

Nuclear's de-rating is a multiple reset, and Q2 prints are the arbiter
Prompt v1.0
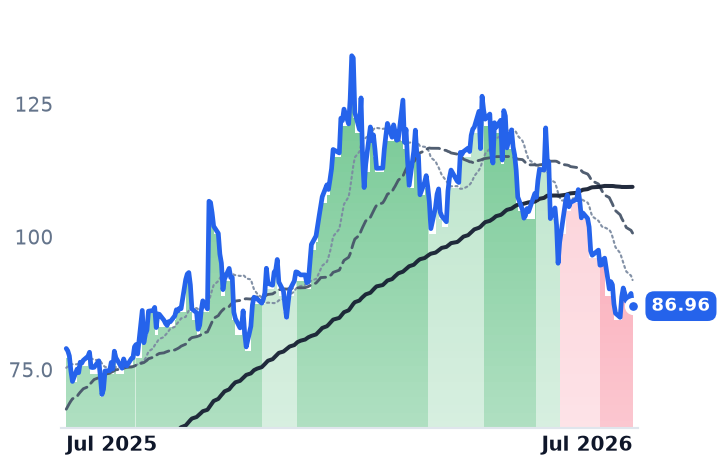
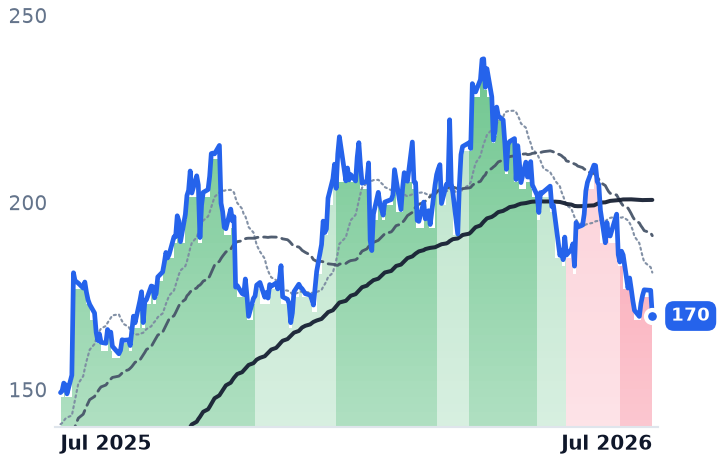
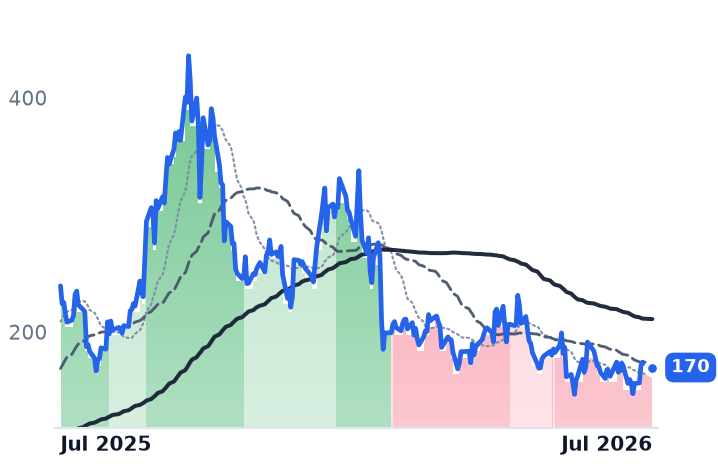
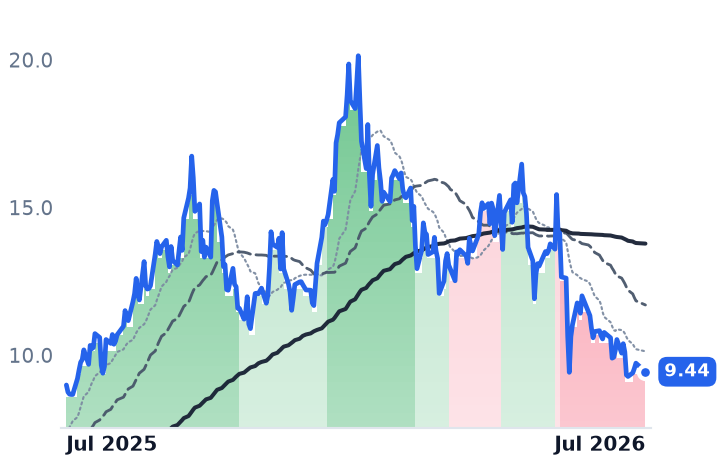
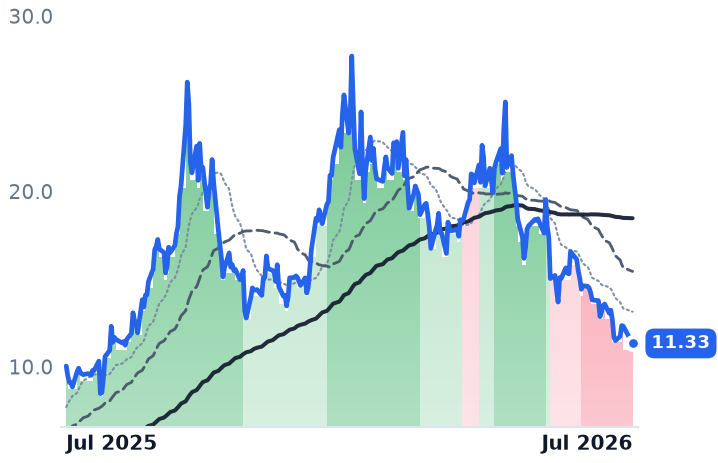
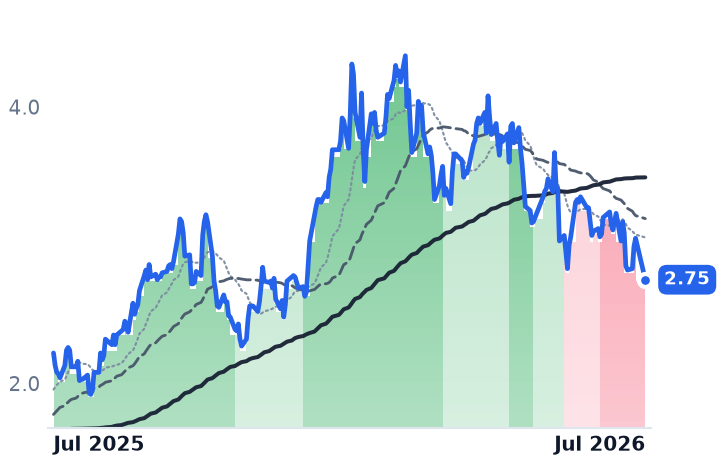
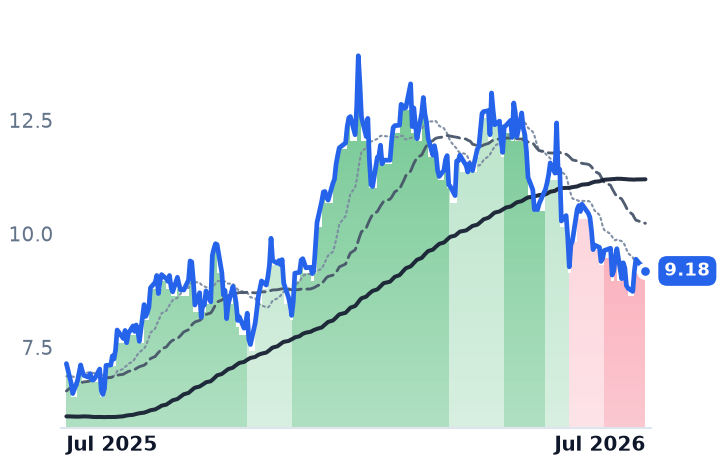
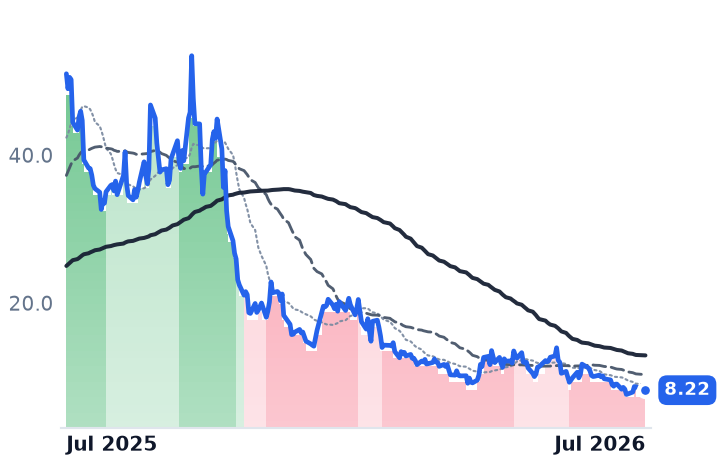
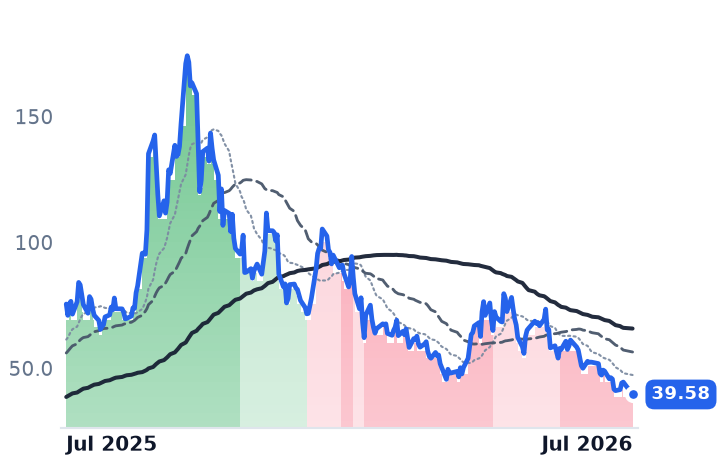
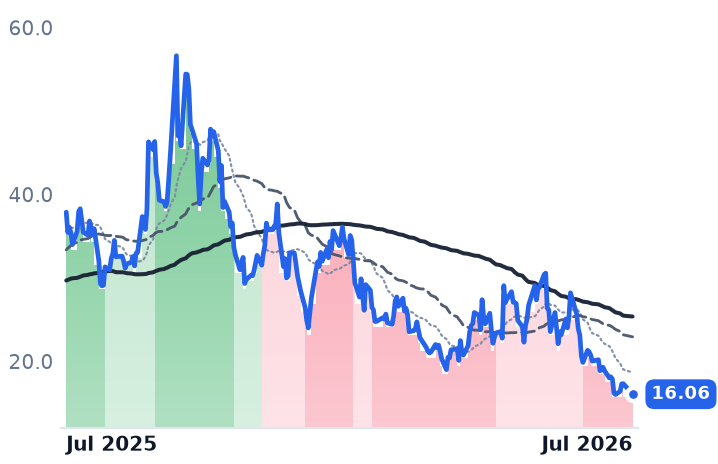
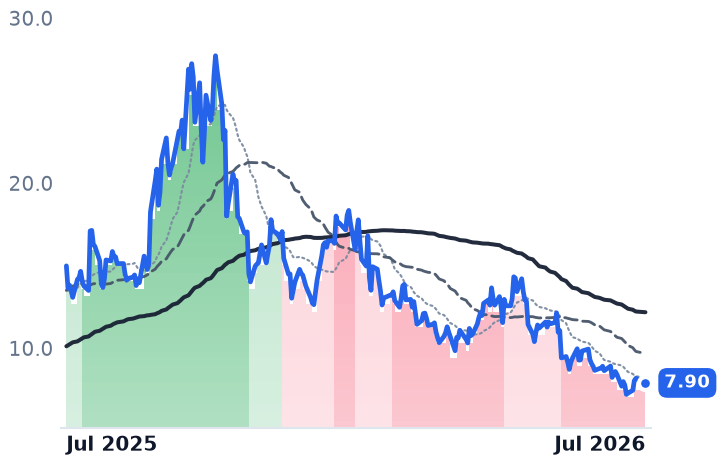
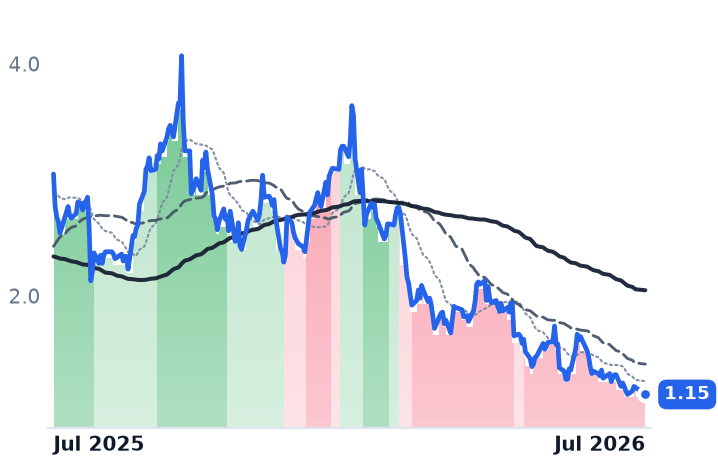
All twelve nuclear-complex names — CCJ and BWXT included — now sit in strongly bearish bands below their 200-day averages, so the fuel-cycle layer was late to break, not immune. The fundamentals underneath (term uranium pricing, backlog, contracted volumes) have not deteriorated in step, which frames the July flush as multiple compression rather than an earnings event — testable on 7/31 and 8/3.
| Ticker | Company | Segment | Trend · 13mo | 30D | 1Y |
|---|---|---|---|---|---|
CCJ | Cameco | Uranium | ⚠️ Emerging Bear | −16.0% | +10.1% |
BWXT | BWX Technologies | Naval & Shipbuilding | ⚠️ Emerging Bear | −10.3% | +13.7% |
LEU | Centrus Energy | Uranium | ⚠️ Emerging Bear | +5.9% | −29.1% |
UEC | Uranium Energy | Uranium | ⚠️ Emerging Bear | −12.8% | +5.0% |
UUUU | Energy Fuels | Uranium | ⚠️ Emerging Bear | −22.3% | +12.8% |
DNN | Denison Mines | Uranium | ⚠️ Emerging Bear | −11.9% | +23.9% |
NXE | NexGen Energy | Uranium | ⚠️ Emerging Bear | −5.4% | +28.6% |
SMR | NuScale Power | Advanced Nuclear | 🔴 Cont. Bear | −19.9% | −83.9% |
OKLO | Oklo | Emerging & Specialized Energy | ⚠️ Emerging Bear | −25.0% | −47.6% |
NNE | Nano Nuclear Energy | Power & Propulsion Systems | ⚠️ Emerging Bear | −24.7% | −57.6% |
LTBR | Lightbridge | Electrical Equipment & Parts | ⚠️ Emerging Bear | −9.9% | −47.3% |
EU | enCore Energy | Uranium | ⚠️ Emerging Bear | −13.5% | −62.3% |
12-month price & trend
| Ticker | Mkt cap | P/E | P/E fwd | P/S | P/S fwd | P/GP | P/GP fwd | EV/EBITDA | FCF yld |
|---|---|---|---|---|---|---|---|---|---|
CCJ | $42.6B | 165.8x | 59.6x | 17.0x | 12.1x | 61.6x | 43.8x | 68.3x | 0.9% |
BWXT | $15.9B | 44.6x | 36.5x | 4.5x | 4.2x | 20.5x | 19.0x | 31.2x | 2.0% |
LEU | $3.6B | 75.8x | 74.3x | 7.6x | 7.9x | 32.7x | 33.8x | 40.1x | -6.2% |
| Ticker | Mkt cap | P/E | P/E fwd | P/S | P/S fwd | P/GP | P/GP fwd | EV/EBITDA | FCF yld |
|---|---|---|---|---|---|---|---|---|---|
UEC | $5.5B | n/m | — | 274.6x | 55.3x | 648.9x | 130.6x | n/m | -2.2% |
UUUU | $3.7B | n/m | — | 35.0x | 25.0x | 80.8x | 57.9x | n/m | -3.0% |
DNN | $2.9B | n/m | — | 988.4x | 120.1x | — | — | n/m | -4.1% |
| Ticker | Mkt cap | P/E | P/E fwd | P/S | P/S fwd | P/GP | P/GP fwd | EV/EBITDA | FCF yld |
|---|---|---|---|---|---|---|---|---|---|
NXE | $6.9B | n/m | — | n/m | — | — | — | n/m | -2.5% |
SMR | $2.8B | n/m | — | 261.9x | 91.1x | — | 432.7x | n/m | -27.7% |
OKLO | $7.7B | n/m | — | — | — | — | — | n/m | -3.6% |
| Ticker | Mkt cap | P/E | P/E fwd | P/S | P/S fwd | P/GP | P/GP fwd | EV/EBITDA | FCF yld |
|---|---|---|---|---|---|---|---|---|---|
NNE | $1.1B | n/m | — | — | 887.7x | — | — | n/m | -3.7% |
LTBR | $297.0M | n/m | — | n/m | — | — | — | n/m | -5.7% |
EU | $363.2M | n/m | — | 8.8x | 4.1x | 39.1x | 18.2x | n/m | -12.1% |
Consensus projections
| Ticker | FY2026E | FY2027E | FY2028E | |
|---|---|---|---|---|
CCJ | Revenue | +2.8% | +10.6% | +9.5% |
| EPS | +14.2% | +60.9% | +20.5% | |
BWXT | Revenue | +20.2% | +9.9% | +7.5% |
| EPS | +24.1% | +11.5% | +11.3% | |
LEU | Revenue | +2.5% | +5.4% | −12.9% |
| EPS | −42.9% | +7.1% | −26.3% | |
UEC | Revenue | −59.3% | +272.6% | +157.9% |
| EPS | +58.7% | −79.8% | −647.6% | |
UUUU | Revenue | +152.8% | +63.3% | +59.0% |
| EPS | −52.3% | −188.4% | +252.4% | |
DNN | Revenue | +394.2% | −27.3% | +1699.7% |
| EPS | −30.5% | −73.1% | −363.0% | |
NXE | Revenue | −68.7% | +131.4% | +32282.1% |
| EPS | −9.1% | −31.8% | +23.4% | |
SMR | Revenue | −26.7% | +434.9% | +101.2% |
| EPS | −74.7% | +33.4% | −18.3% | |
OKLO | Revenue | — | +364.3% | +700.0% |
| EPS | +20.2% | +14.2% | +12.2% | |
NNE | Revenue | +1684.0% | +356.5% | +39.0% |
| EPS | −23.4% | +55.2% | +34.3% | |
EU | Revenue | +101.0% | +20.6% | +72.5% |
| EPS | −66.0% | −114.4% | +1843.9% |
Forward fiscal years only. Blank means no analyst coverage for that year.
The "intact leg" isn't intact
CCJ (+0.0%) and BWXT (-0.1%) held flat over five sessions, but that is a rebound off a mid-July flush, not resilience. CCJ fell from $95.99 on 7/10 to $84.85 on 7/20 (-11.6%) before recovering to $89.35; BWXT fell 8.8% then recovered 4.1%. Both printed strongly bearish bands on 7/7 and 7/8 respectively, after being strongly bullish as recently as late May. All twelve names in the complex — CCJ, BWXT, LEU, UEC, UUUU, DNN, NXE, SMR, OKLO, NNE, LTBR, EU — now sit at -3 of 3 on the trend signal and below their 200-day averages. Over 30 days CCJ is -16.6% and BWXT -15.9% against SPY +2.5%; the fuel layer broke three to five weeks after the developers, not differently. Nuclear is also the worst slice of the power complex, trailing GEV -4.6%, PWR -6.5%, TLN -6.6% and CEG +4.1%.
The fundamentals didn't move with the tape
Spot uranium slid from above $101/lb to roughly $84-87/lb through Q2. But Sprott notes term pricing has ground up to $86/lb, +8.86% YTD after months stuck at $79-82, against thirteen consecutive years of utility under-contracting and 2026 volumes below the ~150 Mlb replacement rate — and long-term contracts drive roughly 80% of volume, so a spot pullback doesn't mechanically hit realized prices. Policy is likewise unchanged: the Russian import ban runs through 2040 with waiver quotas stepping down to 464,183 kg for 2026, and it unlocked $2.7B, funding three $900M DOE grants to Centrus, General Matter and Orano. Hyperscaler offtake — Microsoft's 835 MW Three Mile Island PPA, Google-Kairos, Amazon-X-energy and Meta's up-to-6.6 GW — hasn't been cancelled, though Carnegie's June "Beyond the Hype" assessment signals scrutiny of the timelines.
What's actually compressing
CCJ trades at 81.5x trailing earnings, BWXT 46.2x — and the sell-side is trimming into it: BofA cut its Cameco target on a softer uranium outlook while keeping it a top pick, even as consensus still shows $133.78 for CCJ and $229 for BWXT. OKLO's 28% one-month drop was attributed to valuation and investors reassessing nuclear's timeline — the same de-rating that later caught the quality names. Chronometer's Matthew Smith names CCJ and BWXT as the AP1000 winners, but on a 2033-34 in-service timeline; long-dated optionality is what a compressing tape discounts first.
The test is near. Cameco reported Q1 net earnings of $131M, $509M adjusted EBITDA and unchanged 19.5-21.5 Mlb guidance, with Q2 due 7/31; BWXT, carrying $7.3B backlog (+50%) and 2026 guidance of $4.55-4.70 EPS and $305-320M FCF, reports 8/3. Those two prints separate a multiple story from an earnings story.