

AAR Guided to 21–23% Growth and Lost a Fifth as Guggenheim Cut Parts Sellers to Neutral
Hypothesis Opus 5 · Research Opus 5 · Writing Opus 5 · Prompt v1.6
The only margin AAR Corp lost last quarter came from a shortage of retired airplanes to tear apart — and for the past month the market has been pricing the opposite problem. In mid-September two research houses repriced the entire commercial aviation aftermarket: Guggenheim initiated coverage at Neutral on a forecast of just 1.8% global passenger traffic growth in 2026 against 5.4% last year, and Melius cut five aviation names to Hold on slowing aftermarket growth.
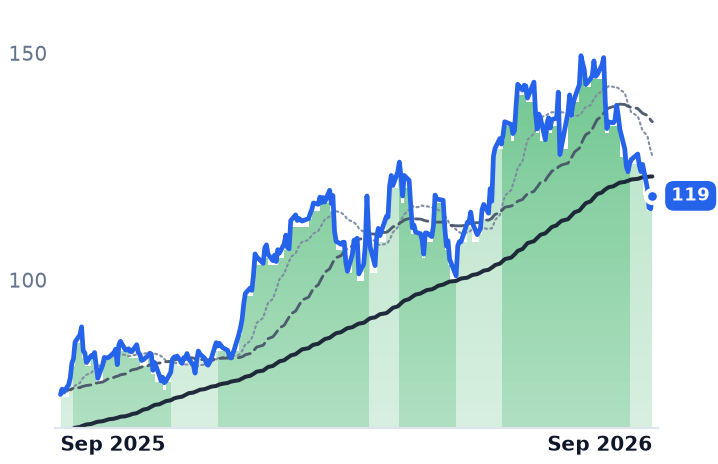
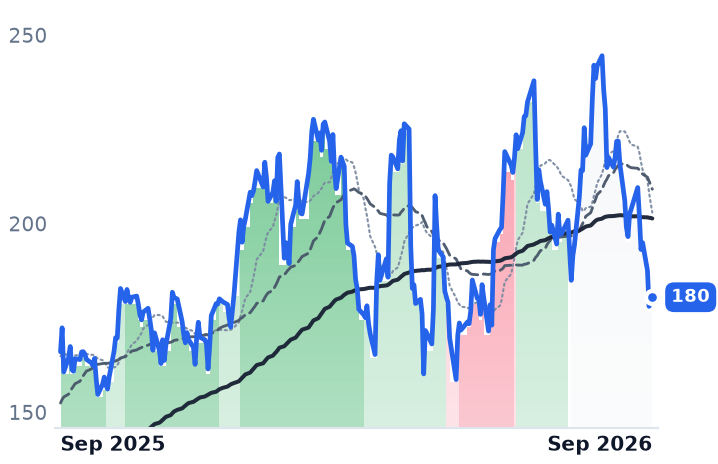
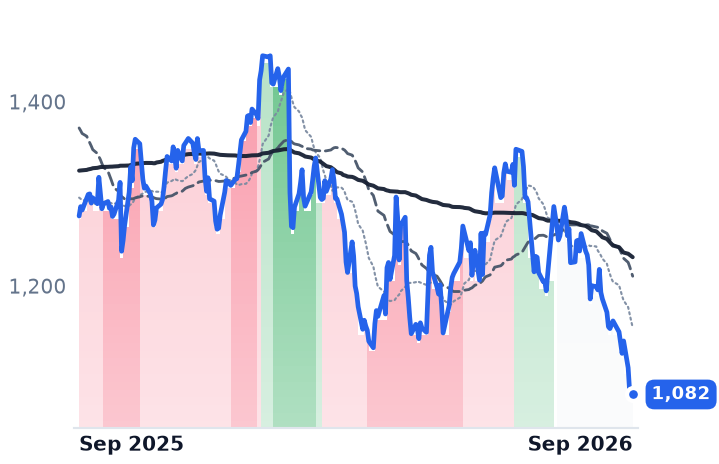
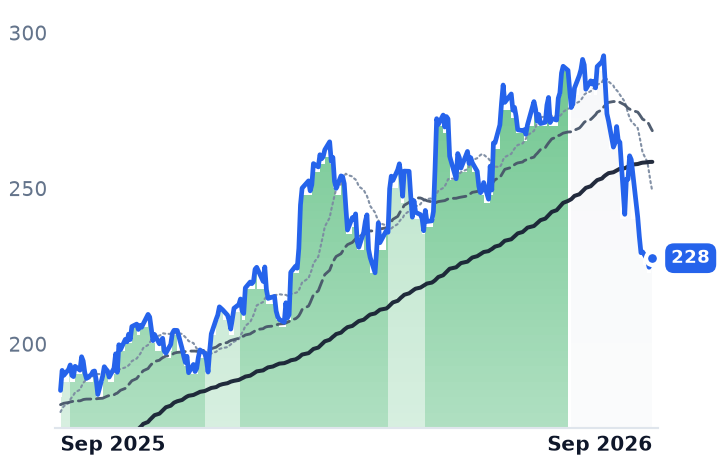
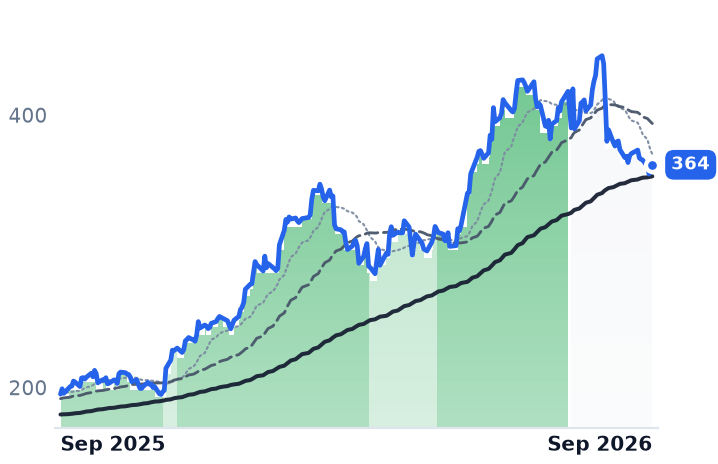
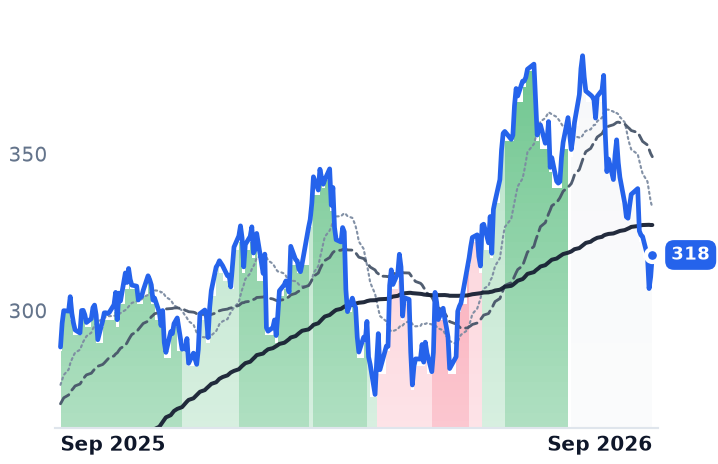
AAR fell 19.6% over thirty days and VSE Corporation 26.2%, but so did HEICO, Howmet and TransDigm, against a market down 1.6%. Neither company cut anything: AAR's fiscal 2026 revenue rose 19% to $3.308bn with operating margin up to 8.18%, and VSE raised full-year guidance in August after a quarter with a record 19.2% adjusted EBITDA margin. The discount is most defensible at VSE, where trailing free cash is roughly nil against $872m of net debt.
| Ticker | Company | Segment | Trend · 13mo | 30D | 1Y |
|---|---|---|---|---|---|
| The subject · what this brief is about | |||||
AIR | AAR | Aftermarket & MRO Services | 🟢 Cont. Bull | −20.5% | +58.6% |
VSEC | VSE | Aftermarket & MRO Services | ⚠️ Emerging Bear | −23.4% | +8.7% |
| Compared against · context, not the story | |||||
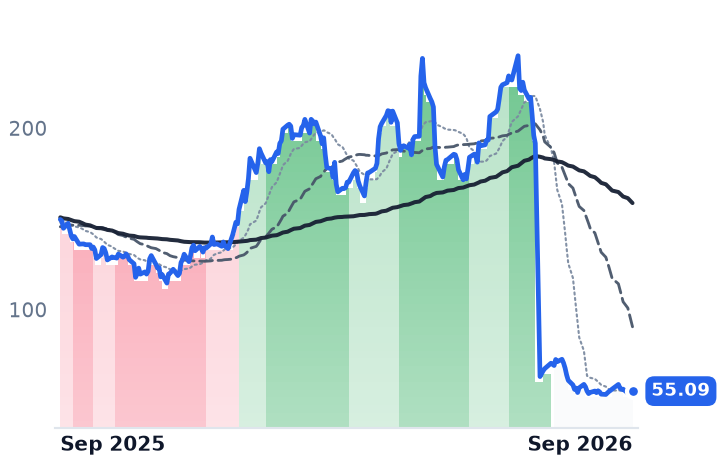
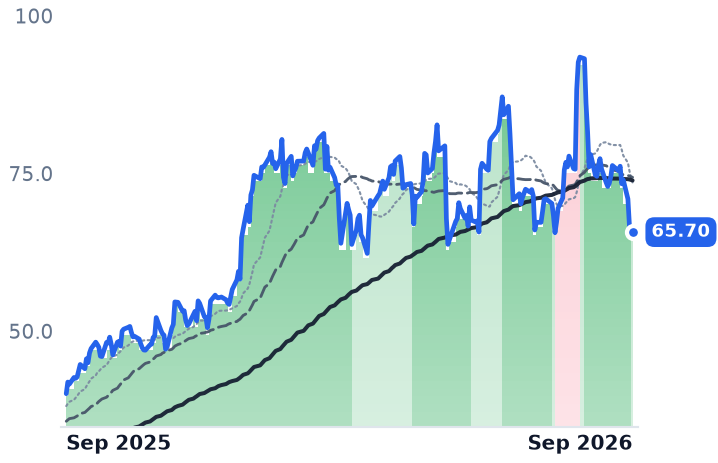
WLFC | Willis Lease Finance | Aviation & Aerospace Leasing | 🟢 Cont. Bull | −4.1% | −63.2% |
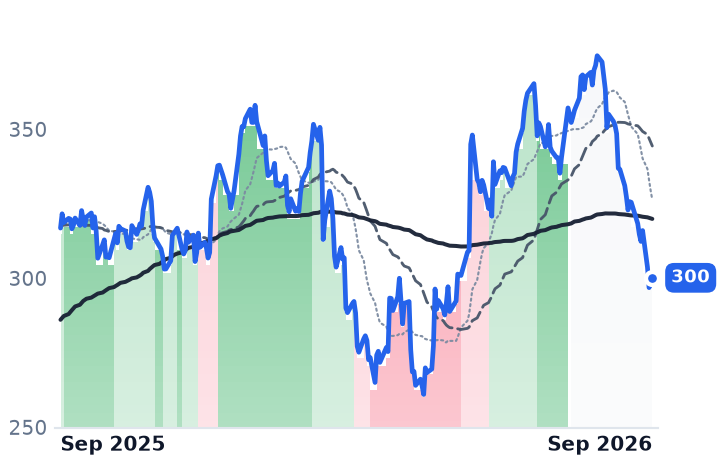
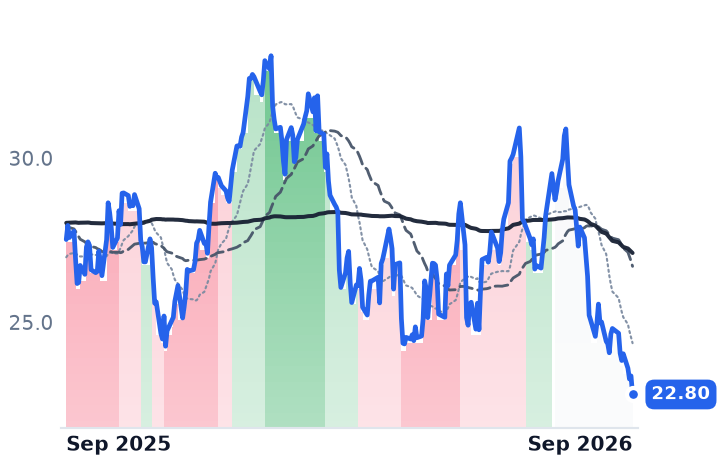
HEI | HEICO | Avionics & Electronic Systems | 🟢 Cont. Bull | −18.4% | −5.3% |
TDG | TransDigm Group Incorporated | Advanced Materials & Components | 🌱 Emerging Bull | −12.3% | −15.2% |
HWM | Howmet Aerospace | Engines & Propulsion | 🟢 Cont. Bull | −22.2% | +23.0% |
ATRO | Astronics | Avionics & Electronic Systems | 🟢 Cont. Bull | −23.7% | +63.9% |
SARO | StandardAero | Engines & Propulsion | 🌱 Emerging Bull | −15.5% | −17.2% |
MOG-A | Moog | Flight Controls & Actuation | 🟢 Cont. Bull | −17.0% | +86.2% |
GE | GE Aerospace | Large Diversified Primes | 🟢 Cont. Bull | −15.3% | +10.2% |
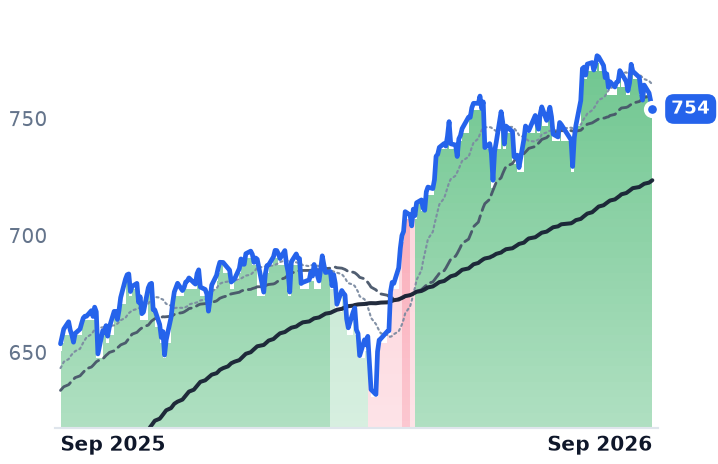
SPY | State Street SPDR S&P 500 ETF Trust | Asset Management | 🟢 Cont. Bull | −0.9% | +16.3% |
12-month price & trend
| Ticker | Mkt cap | P/E | P/E fwd | P/S | P/S fwd | P/GP | P/GP fwd | EV/EBITDA | FCF yld |
|---|---|---|---|---|---|---|---|---|---|
AIR | $4.5B | 23.0x | 19.5x | 1.4x | 1.2x | 7.2x | 6.5x | 13.7x | 1.2% |
VSEC | $4.9B | 63.4x | 25.7x | 3.6x | 2.7x | 25.8x | 19.3x | 33.0x | -0.0% |
WLFC | $3.9B | 23.8x | 8.8x | 5.2x | 5.1x | 8.6x | 8.5x | 20.0x | -2.8% |
| Ticker | Mkt cap | P/E | P/E fwd | P/S | P/S fwd | P/GP | P/GP fwd | EV/EBITDA | FCF yld |
|---|---|---|---|---|---|---|---|---|---|
HEI | $44.0B | 52.0x | 50.3x | 8.5x | 8.2x | 21.1x | 20.2x | 31.6x | 2.3% |
TDG | $64.1B | 34.7x | 27.9x | 6.4x | 6.1x | 10.7x | 10.2x | 19.0x | 3.0% |
HWM | $104.2B | 59.9x | 52.6x | 12.1x | 10.8x | 37.1x | 33.1x | 40.0x | 1.4% |
| Ticker | Mkt cap | P/E | P/E fwd | P/S | P/S fwd | P/GP | P/GP fwd | EV/EBITDA | FCF yld |
|---|---|---|---|---|---|---|---|---|---|
ATRO | $3.1B | 40.0x | 32.7x | 3.3x | 3.2x | 10.2x | 9.8x | 30.8x | 2.0% |
SARO | $8.4B | 28.1x | 19.6x | 1.3x | 1.3x | 9.4x | 9.1x | 14.1x | 1.6% |
MOG-A | $9.6B | 33.8x | 29.1x | 2.3x | 2.2x | 8.6x | 8.3x | 18.6x | 2.1% |
| Ticker | Mkt cap | P/E | P/E fwd | P/S | P/S fwd | P/GP | P/GP fwd | EV/EBITDA | FCF yld |
|---|---|---|---|---|---|---|---|---|---|
GE | $355.4B | 40.2x | 43.3x | 7.0x | 7.1x | 19.8x | 19.9x | 29.9x | 1.0% |
SPY | $773.0B | — | — | — | — | — | — | — | — |
Consensus projections
| Ticker | FY2026E | FY2027E | FY2028E | |
|---|---|---|---|---|
AIR | Revenue | +20.4% | +11.8% | +7.1% |
| EPS | +30.9% | +17.3% | +14.1% | |
VSEC | Revenue | +64.6% | +21.4% | +8.4% |
| EPS | +87.4% | +17.9% | +13.1% | |
WLFC | Revenue | +20.8% | +4.2% | +8.0% |
| EPS | +44.9% | −2.1% | +8.7% | |
HEI | Revenue | +21.1% | +11.1% | +8.7% |
| EPS | +31.4% | +13.5% | +13.1% | |
TDG | Revenue | +19.4% | +10.1% | +7.6% |
| EPS | +12.2% | +17.7% | +15.2% | |
HWM | Revenue | +17.6% | +13.2% | +10.9% |
| EPS | +33.7% | +20.3% | +18.1% | |
ATRO | Revenue | +14.8% | +8.8% | +0.1% |
| EPS | +67.9% | +19.0% | −100.0% | |
SARO | Revenue | +6.6% | +10.1% | +9.8% |
| EPS | +54.4% | +24.7% | +17.2% | |
MOG-A | Revenue | +13.9% | +6.5% | +6.0% |
| EPS | +26.1% | +10.1% | +7.5% | |
GE | Revenue | +20.6% | +11.1% | +9.2% |
| EPS | +26.7% | +15.0% | +13.9% |
Forward fiscal years only. Blank means no analyst coverage for that year.
The one place AAR Corp's margins slipped last quarter was the business of buying used jet parts, and the reason was that airlines have stopped retiring airplanes. AAR — which distributes new and used aircraft components under exclusive manufacturer authorizations, runs heavy-maintenance and paint hangars, and overhauls landing gear, wheels and brakes — saw its Parts Supply segment sell $424m in the quarter ended 31 May, up 39%, while segment adjusted earnings margin fell 250 basis points. Management's explanation on the fourth-quarter call was that asset availability was constrained, so AAR had to pay more for the airframes and engines it harvests, narrowing the spread between what it buys and what it sells.
That is a shortage of feedstock, and it is the inverse of the story the market bought in September. Teardown material is scarce because operators keep flying ageing narrowbodies instead of parting them out — which is the same fact that keeps hangars full and shop visits booked. The distinction matters because the mid-September repricing of this entire industry rested on a forecast that flying itself is about to slow.
What actually happened in September
Guggenheim initiated coverage with Neutral ratings on AAR, HEICO, StandardAero, TransDigm and VSE, forecasting global passenger traffic growth of 1.8% in 2026 against 5.4% last year and warning that higher fares and further retirements could weaken parts demand within six to twelve months. Days earlier Melius Research cut GE Aerospace, HEICO, Honeywell's aerospace arm, TransDigm and Woodward to Hold, expecting aftermarket growth to decelerate to high single digits next year; its TransDigm target went to $1,331 from $1,477. Both calls landed on a week in which the 10-year Treasury yield reached 5.04%, the highest since 2007, after the Federal Reserve's first rate increase in three years.
The result was uniform. Over the thirty days to 17 September, HEICO fell 19.4%, Howmet 21.7%, Astronics 29.5%, StandardAero 17.3% and TransDigm 12.6%, while the S&P 500 exchange-traded fund fell 1.6%. AAR's 19.6% and VSE's 26.2% are the same trade, not a two-company problem.
The meters that pay these companies
AAR's fiscal 2026 revenue rose 19% to $3.308bn and operating margin widened from 6.66% to 8.18%; fourth-quarter sales of $928m rose 23% with adjusted earnings before interest, taxes, depreciation and amortization up 27%. Net leverage ended the year at 2.03x. Guidance for the current quarter is sales growth of 21% to 23% and an adjusted EBITDA margin of 12.25% to 12.75%, and chief executive John M. Holmes reaffirmed nothing less at the Jefferies industrials conference on 9 September.
VSE Corporation, which sold its fleet and federal-services arms to become an aviation parts distributor and repair shop, grew second-quarter revenue 65% to $449.1m — 14% of it organic — and expanded gross margin by 562 basis points to 17.02%. "Adjusted EBITDA nearly doubled year-over-year, significantly outpacing revenue growth and adjusted EBITDA margins reached a record 19.2% in the quarter," chief executive John Cuomo told investors on 5 August, the day the company raised full-year revenue guidance to 61–64% growth. The shares rose 5.3% on that print and made an all-time high twelve days later. The entire de-rating is post-beat.
The third meter is engine values, and it has not broken. Willis Lease Finance, the engine lessor and spare-parts trader, sold 21 engines at a 14.2% margin in the June quarter, lifted its average lease rate factor to 1.03% from 1.00%, and told investors its portfolio appraises about 20% above book. Its warning sits elsewhere: utilization fell to 85.0% from 87.2% and short-term maintenance reserves to $39m from $50.2m as operators cut hours on fuel-thirsty CFM56 and V2500 fleets. Fewer legacy hours flown now means fewer legacy shop visits later — the one honest strand of the bear case, and a slow one. The replacement wave is real but gradual: Boeing delivered 418 jets through August and Airbus 475, while Pratt & Whitney still expects roughly 350 geared-turbofan aircraft grounded per day on average through the end of 2026.
What the businesses earn and what they don't
AAR's forward multiple has fallen from 25.9x next-year consensus earnings at its 18 August peak to 20.6x, against consensus growth of 17.3% — roughly the growth it implies, with a trailing free-cash-flow yield of 1.16% as the offset, because buying authorizations and carrying inventory consumes cash. VSE is the name where the markdown has a foundation: forward earnings of 26.6x this year against about 36x at the peak looks cheaper, but trailing enterprise value is 33 times EBITDA, trailing free cash flow is nil, and $872m of net debt at 2.4x sits partly on a $900m floating-rate term loan raised for the $2.025bn Precision Aviation Group deal. A 5% funding curve is a real cost there in a way it is not at AAR.
So the split is this: nothing in either company's disclosed numbers deteriorated, and the de-rating is a multiple event built on a traffic forecast for a year that hasn't started. What the businesses have genuinely earned is narrower — a squeezed used-parts spread at AAR, and at VSE a balance sheet that converts almost none of a record margin into cash while rates rise.
AAR reports its first fiscal quarter after the close on 29 September. The line to read is not the sales number, which is already guided, but whether the buy-sell spread on used material widened again — which will depend on whether airlines have started parting out their old narrowbodies at last.