

Apollo Originated a Record $74bn at Wider Spreads and Its Stock Is Flat for a Year
Hypothesis Opus 5 · Research Opus 5 · Writing Opus 5 · Prompt v1.5
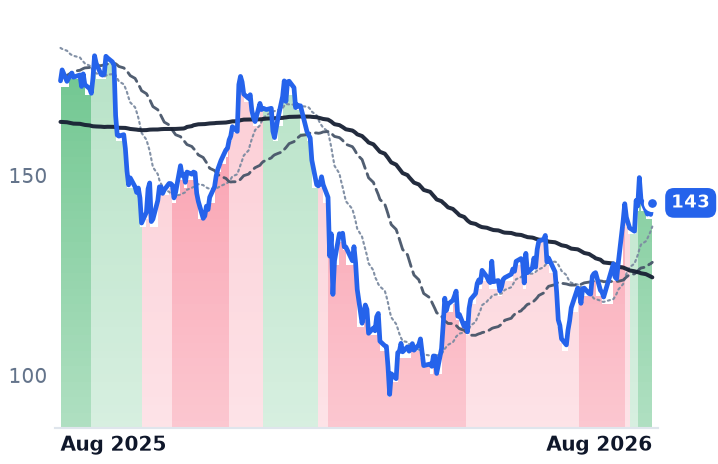
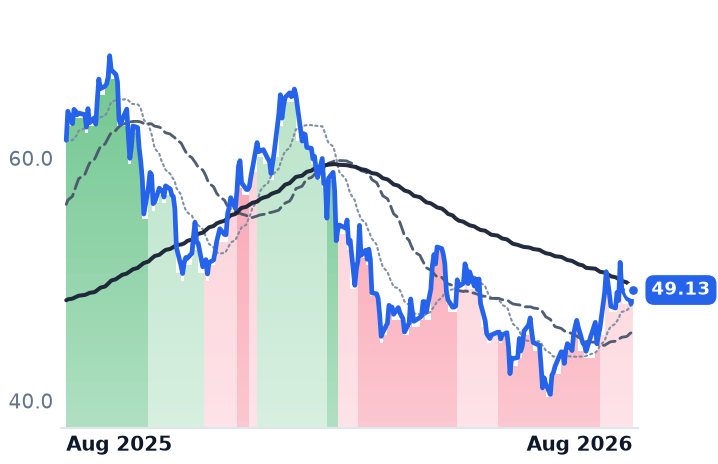
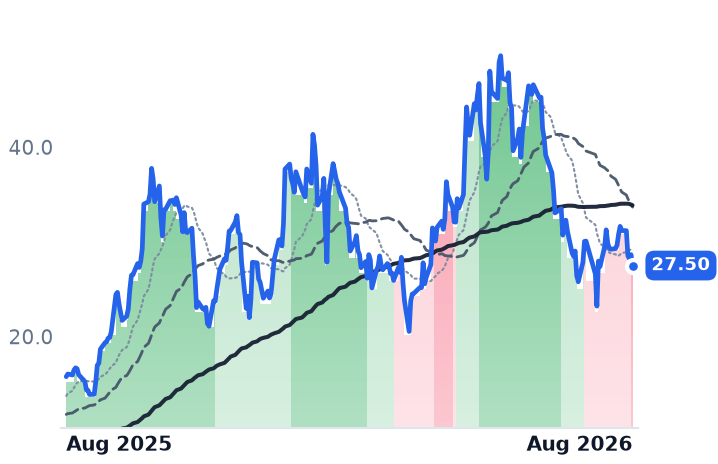
The firms lending into the artificial-intelligence data-center build-out are getting paid more to do it, and their shares have not been paid for it. Apollo Global Management originated a record $74bn of credit in the June quarter, three-quarters of it investment grade priced at 280 basis points of excess spread over Treasuries, and the net spread inside its Athene annuity arm widened to 114 basis points from 97. The stock is unchanged over twelve months and trades at 15.2x forward earnings against 28.8x trailing — the widest gap among the big alternative managers.
The margin widening is real and it is not confined to Apollo: HA Sustainable Infrastructure earns 9.2% on its portfolio against a 6.2% funding cost, and Blackstone marked its data-center platform at $185bn. But the group's August advance was indiscriminate. TPG, with no data-center credit franchise, led it.
| Ticker | Company | Segment | Trend · 13mo | 30D | 1Y |
|---|---|---|---|---|---|
| The subject · what this brief is about | |||||
APO | Apollo Global Management | Alternative & Private Capital | 🌱 Emerging Bull | +12.6% | +0.8% |
BX | Blackstone | Alternative & Private Capital | 🔴 Cont. Bear | +17.8% | −9.7% |
HASI | HA Sustainable Infrastructure Capital | Asset Management | 🟢 Cont. Bull | +6.9% | +53.8% |
| Compared against · context, not the story | |||||
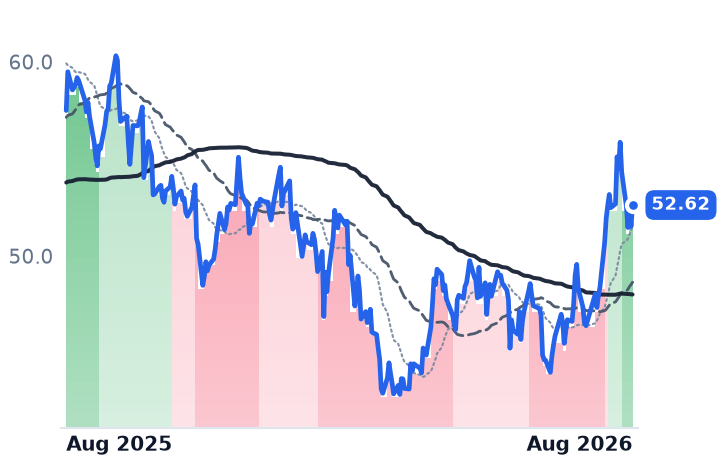
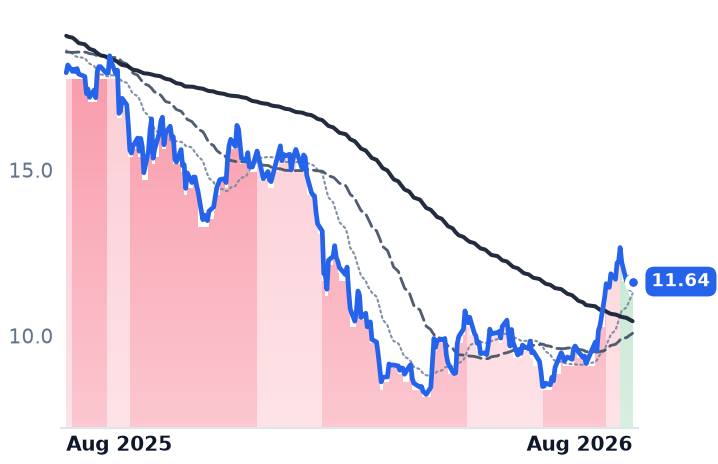
KKR | KKR | Alternative & Private Capital | 🔴 Cont. Bear | +14.2% | −20.6% |
ARES | Ares Management | Alternative & Private Capital | 🔴 Cont. Bear | +19.7% | −17.6% |
CG | The Carlyle | Alternative & Private Capital | ⚠️ Emerging Bear | +11.5% | −20.1% |
BAM | Brookfield Asset Management | Real Estate & Infrastructure | 🔴 Cont. Bear | +13.4% | −8.5% |
OWL | Blue Owl Capital | Alternative & Private Capital | 🔴 Cont. Bear | +27.0% | −35.1% |
TPG | TPG | Alternative & Private Capital | ⚠️ Emerging Bear | +26.7% | −8.8% |
BN | Brookfield | Real Estate & Infrastructure | ⚠️ Emerging Bear | +0.3% | −1.4% |
ARCC | Ares Capital | Middle Market Credit | 🔴 Cont. Bear | +5.8% | −3.7% |
BXSL | Blackstone Secured Lending Fund | BDC & Credit Opportunities | 🔴 Cont. Bear | +6.7% | −9.1% |
APLD | Applied Digital | Data Center & Cloud Infrastructure | ⚠️ Emerging Bear | −8.6% | +74.4% |
CRWV | CoreWeave | Cloud GPU Computing | 🔴 Cont. Bear | +6.5% | −3.0% |
GDS | GDS | Data Center & Cloud Infrastructure | ⚠️ Emerging Bear | −0.3% | +1.9% |
CNP | CenterPoint Energy | US Electric & Gas Utilities | 🟢 Cont. Bull | −9.3% | +5.4% |
SRE | Sempra | US Electric & Gas Utilities | ⚠️ Emerging Bear | −8.0% | +7.8% |
SPY | State Street SPDR S&P 500 ETF Trust | Asset Management | 🟢 Cont. Bull | +2.3% | +21.4% |
NVDA | NVIDIA | AI & Data Center GPUs | 🟢 Cont. Bull | +2.3% | +23.9% |
AVGO | Broadcom | Semiconductor Subsystems | 🟢 Cont. Bull | −7.2% | +27.9% |
GS | The Goldman Sachs | Bulge Bracket Investment Banks | 🟢 Cont. Bull | −7.1% | +44.7% |
MS | Morgan Stanley | Bulge Bracket Investment Banks | 🟢 Cont. Bull | −3.0% | +49.6% |
JPM | JPMorgan Chase | Global Investment Banking & Markets | 🟢 Cont. Bull | +1.8% | +23.4% |
C | Citigroup | Global Investment Banking & Markets | 🟢 Cont. Bull | −0.6% | +43.5% |
BIP | Brookfield Infrastructure Partners | Infrastructure & Transport Conglomerates | 🟢 Cont. Bull | −2.6% | +33.9% |
MAIN | Main Street Capital | Middle Market Credit | ⚠️ Emerging Bear | +9.1% | −6.3% |
HTGC | Hercules Capital | Middle Market Credit | 🔴 Cont. Bear | +6.9% | −5.7% |
GBDC | Golub Capital BDC | Other | 🌱 Emerging Bull | +2.8% | −1.9% |
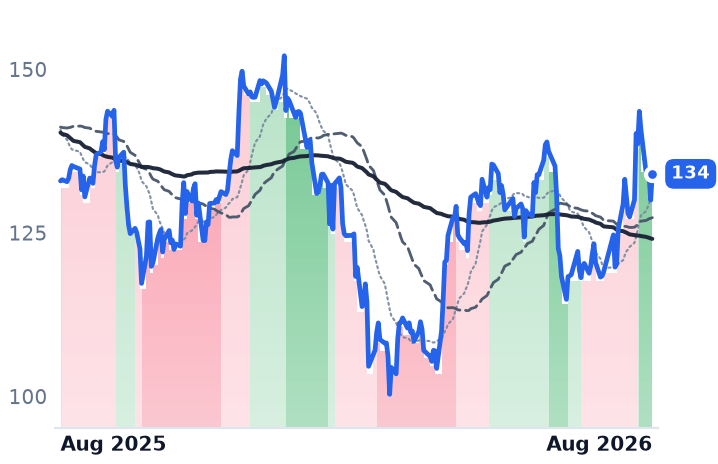
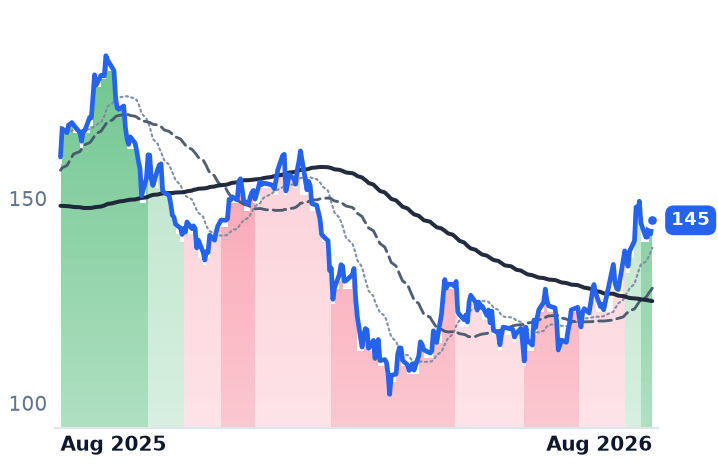
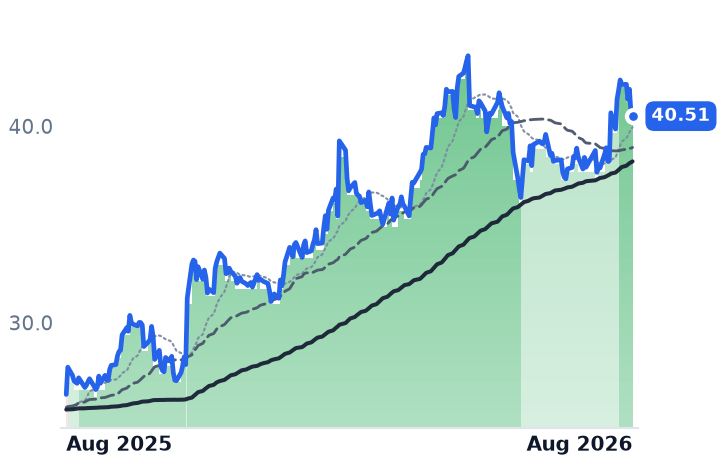
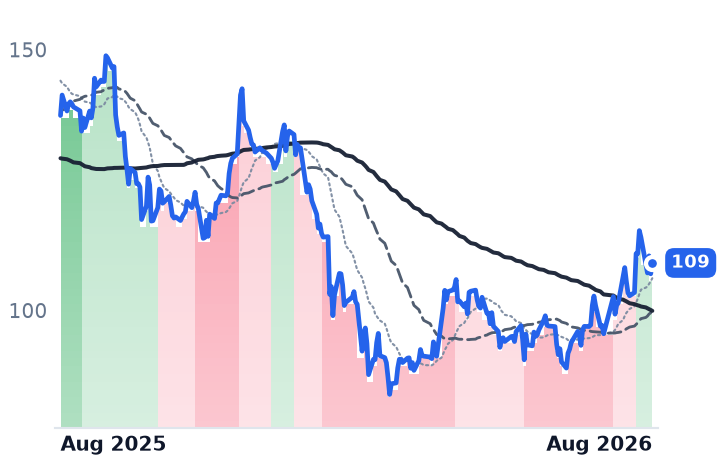
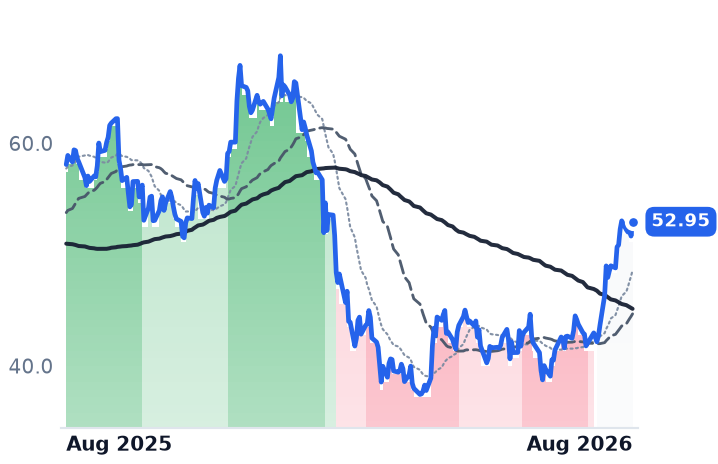
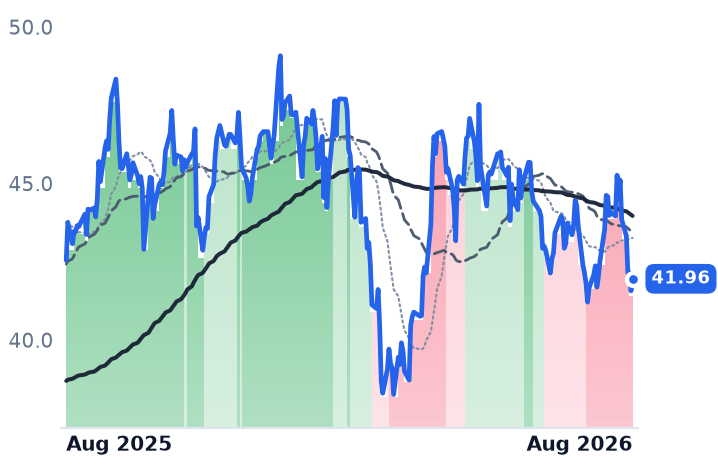
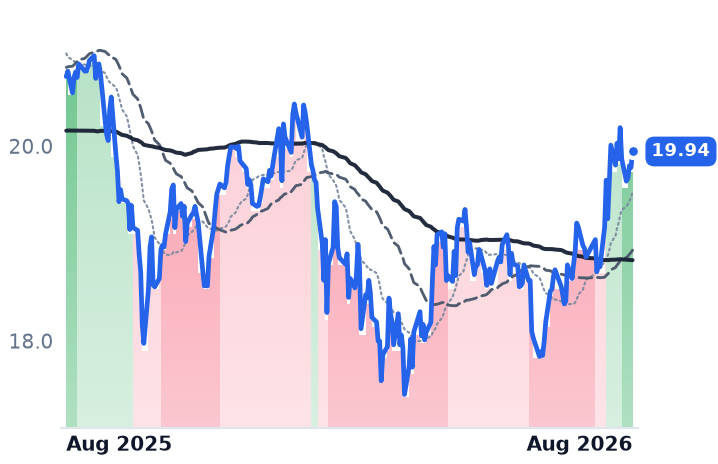
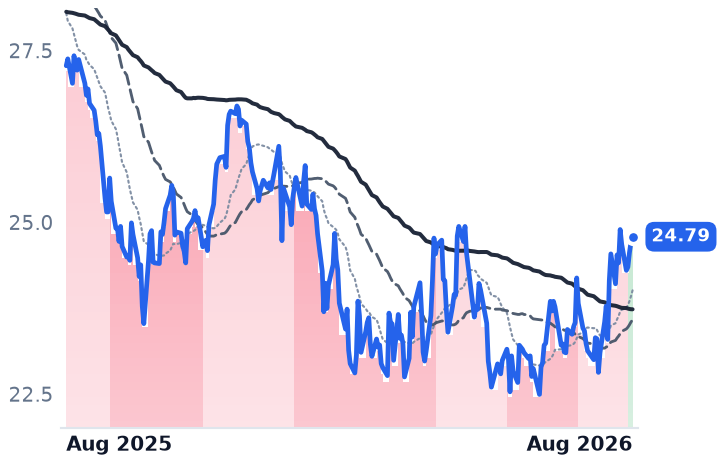
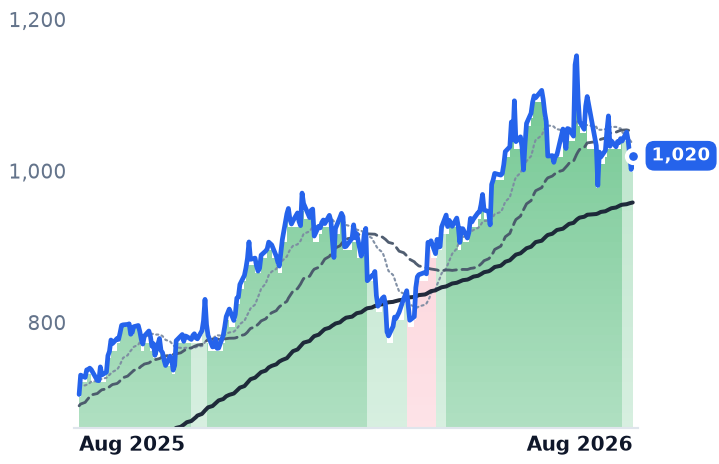
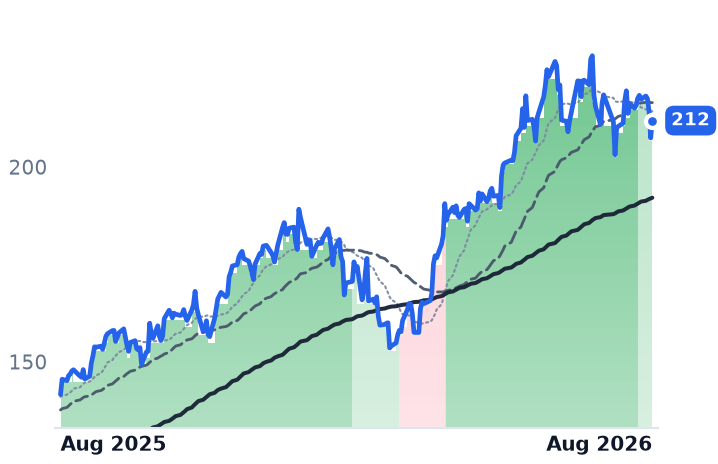
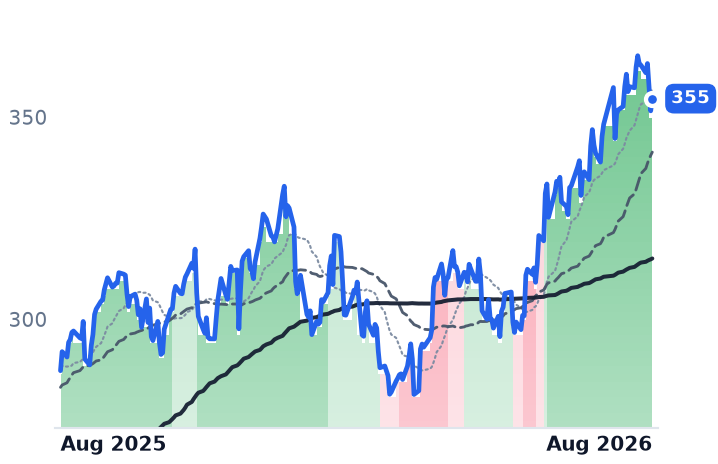
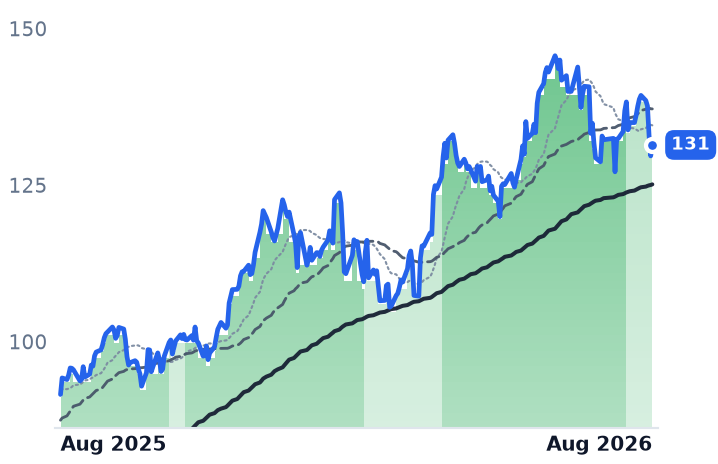
12-month price & trend
| Ticker | Mkt cap | P/E | P/E fwd | P/S | P/S fwd | P/GP | P/GP fwd | EV/EBITDA | FCF yld |
|---|---|---|---|---|---|---|---|---|---|
APO | $76.6B | 28.8x | 15.2x | 2.1x | 3.3x | 2.5x | 3.9x | 6.7x | 10.4% |
BX | $173.7B | 31.9x | 24.1x | 10.8x | 11.9x | 12.2x | 13.4x | 22.0x | 2.5% |
HASI | $5.1B | 61.0x | 13.3x | 11.1x | 11.0x | 40.2x | 39.8x | n/m | 4.1% |
| Ticker | Mkt cap | P/E | P/E fwd | P/S | P/S fwd | P/GP | P/GP fwd | EV/EBITDA | FCF yld |
|---|---|---|---|---|---|---|---|---|---|
KKR | $102.4B | 33.9x | 18.4x | 4.8x | 9.7x | 10.4x | 20.8x | 15.1x | 8.3% |
ARES | $47.3B | 62.9x | 24.5x | 7.4x | 8.4x | 11.8x | 13.4x | 24.3x | 1.8% |
CG | $17.7B | 48.7x | 13.7x | 4.5x | 4.8x | 6.3x | 6.7x | 35.2x | -11.3% |
| Ticker | Mkt cap | P/E | P/E fwd | P/S | P/S fwd | P/GP | P/GP fwd | EV/EBITDA | FCF yld |
|---|---|---|---|---|---|---|---|---|---|
BAM | $86.7B | 31.2x | 29.5x | 16.0x | 14.2x | 20.0x | 17.8x | 90.0x | 2.5% |
OWL | $19.1B | 102.3x | 13.8x | 6.4x | 6.8x | 10.5x | 11.1x | 24.3x | 6.9% |
TPG | $16.0B | 47.7x | 14.8x | 4.5x | 5.9x | 4.8x | 6.2x | 29.7x | 6.1% |
| Ticker | Mkt cap | P/E | P/E fwd | P/S | P/S fwd | P/GP | P/GP fwd | EV/EBITDA | FCF yld |
|---|---|---|---|---|---|---|---|---|---|
BN | $93.3B | 73.4x | 15.1x | 1.2x | 12.3x | 4.2x | 42.8x | 10.3x | -8.9% |
ARCC | $14.3B | 14.7x | 10.4x | 6.2x | 4.6x | 9.2x | 6.9x | 18.2x | 7.5% |
BXSL | $5.6B | 12.7x | 8.5x | 5.4x | 4.1x | 5.0x | 3.8x | 20.4x | -11.3% |
| Ticker | Mkt cap | P/E | P/E fwd | P/S | P/S fwd | P/GP | P/GP fwd | EV/EBITDA | FCF yld |
|---|---|---|---|---|---|---|---|---|---|
APLD | $8.2B | n/m | — | 14.3x | 10.0x | 64.0x | 44.8x | n/m | -33.7% |
CRWV | $46.6B | n/m | — | 7.5x | 3.7x | 10.8x | 5.3x | 25.7x | -22.8% |
GDS | $6.4B | 12.2x | — | 3.6x | — | 14.9x | — | 14.0x | -1.8% |
| Ticker | Mkt cap | P/E | P/E fwd | P/S | P/S fwd | P/GP | P/GP fwd | EV/EBITDA | FCF yld |
|---|---|---|---|---|---|---|---|---|---|
CNP | $25.8B | 23.0x | 20.5x | 2.7x | 2.6x | 5.0x | 4.8x | 12.7x | -10.5% |
SRE | $55.1B | 24.3x | 16.5x | 4.0x | 4.0x | 9.7x | 9.7x | 14.1x | -10.7% |
SPY | $773.0B | — | — | — | — | — | — | — | — |
| Ticker | Mkt cap | P/E | P/E fwd | P/S | P/S fwd | P/GP | P/GP fwd | EV/EBITDA | FCF yld |
|---|---|---|---|---|---|---|---|---|---|
NVDA | $5.5T | 34.3x | 25.0x | 21.5x | 13.9x | 29.0x | 18.7x | 28.3x | 2.2% |
AVGO | $1.7T | 58.8x | 31.4x | 22.9x | 16.4x | 34.3x | 24.5x | 42.3x | 1.9% |
GS | $306.6B | 15.8x | 14.9x | 2.6x | 4.3x | 4.5x | 7.5x | 27.4x | -13.5% |
| Ticker | Mkt cap | P/E | P/E fwd | P/S | P/S fwd | P/GP | P/GP fwd | EV/EBITDA | FCF yld |
|---|---|---|---|---|---|---|---|---|---|
MS | $342.8B | 17.5x | 16.9x | 2.7x | 4.2x | 4.5x | 7.0x | 24.1x | -4.6% |
JPM | $972.2B | 15.6x | 14.7x | 3.3x | 4.7x | 5.2x | 7.5x | 20.4x | 8.9% |
C | $238.9B | 14.8x | 12.5x | 1.6x | 2.5x | 2.9x | 4.6x | 24.5x | -10.3% |
| Ticker | Mkt cap | P/E | P/E fwd | P/S | P/S fwd | P/GP | P/GP fwd | EV/EBITDA | FCF yld |
|---|---|---|---|---|---|---|---|---|---|
BIP | $18.3B | 55.4x | 36.7x | 0.7x | 1.4x | 2.8x | 5.3x | 7.2x | -3.1% |
MAIN | $5.5B | 11.9x | 15.4x | 7.8x | 9.4x | 9.2x | 11.0x | 17.5x | 3.1% |
HTGC | $3.1B | 8.0x | 8.6x | 5.4x | 5.4x | 6.0x | 6.0x | 12.4x | 2.9% |
| Ticker | Mkt cap | P/E | P/E fwd | P/S | P/S fwd | P/GP | P/GP fwd | EV/EBITDA | FCF yld |
|---|---|---|---|---|---|---|---|---|---|
GBDC | $3.5B | 24.1x | 9.6x | 4.8x | 4.5x | 6.5x | 6.0x | 20.3x | 26.6% |
Consensus projections
| Ticker | FY2026E | FY2027E | FY2028E | |
|---|---|---|---|---|
APO | Revenue | +26.8% | +16.1% | +14.3% |
| EPS | +10.4% | +22.4% | +15.6% | |
BX | Revenue | +15.1% | +24.9% | +4.0% |
| EPS | +11.3% | +24.9% | +10.7% | |
HASI | Revenue | +19.3% | +11.0% | +13.4% |
| EPS | +12.0% | +10.3% | +9.4% | |
KKR | Revenue | +33.9% | +17.8% | +32.9% |
| EPS | +26.0% | +18.0% | +15.7% | |
ARES | Revenue | +22.9% | +19.5% | +9.3% |
| EPS | +17.7% | +23.8% | +17.7% | |
CG | Revenue | −1.7% | +36.3% | +9.0% |
| EPS | −10.1% | +41.6% | +15.4% | |
BAM | Revenue | +12.2% | +16.1% | +12.9% |
| EPS | +12.9% | +17.8% | +16.8% | |
OWL | Revenue | +5.9% | +10.5% | +16.1% |
| EPS | +7.9% | +11.4% | +14.5% | |
TPG | Revenue | +22.8% | +20.1% | +16.9% |
| EPS | +21.3% | +26.0% | +14.3% | |
BN | Revenue | −7.4% | +23.6% | +22.3% |
| EPS | +14.2% | +23.1% | +12.0% | |
ARCC | Revenue | +1.4% | +3.1% | −1.4% |
| EPS | −4.5% | +1.4% | −3.9% | |
BXSL | Revenue | −4.9% | −0.2% | −14.7% |
| EPS | −12.3% | −5.2% | −6.2% | |
APLD | Revenue | +98.7% | +92.4% | +149.3% |
| EPS | −24.3% | +6.9% | −104.0% | |
CRWV | Revenue | +147.1% | +98.0% | +60.2% |
| EPS | +194.1% | −65.7% | −325.8% | |
GDS | Revenue | +12.3% | +10.4% | +24.4% |
| EPS | −33.1% | −82.7% | +60.1% | |
CNP | Revenue | +9.0% | +3.9% | +5.0% |
| EPS | +8.5% | +9.1% | +9.2% | |
SRE | Revenue | −3.7% | −1.8% | +1.7% |
| EPS | +11.6% | +8.1% | +8.4% | |
NVDA | Revenue | +65.1% | +84.2% | +43.2% |
| EPS | +59.0% | +91.7% | +42.0% | |
AVGO | Revenue | +66.6% | +65.5% | +33.9% |
| EPS | +71.7% | +68.7% | +33.7% | |
GS | Revenue | +20.6% | +2.7% | +1.8% |
| EPS | +42.8% | +4.7% | +5.3% | |
MS | Revenue | +16.6% | +5.5% | +5.6% |
| EPS | +30.4% | +5.9% | +8.1% | |
JPM | Revenue | +12.9% | +2.5% | +4.5% |
| EPS | +22.0% | +1.4% | +8.3% | |
C | Revenue | +10.9% | +3.7% | +3.6% |
| EPS | +47.4% | +14.3% | +15.3% | |
BIP | Revenue | +61.2% | −25.6% | +8.1% |
| EPS | +2.1% | +38.8% | −2.9% | |
MAIN | Revenue | +3.4% | +7.4% | +9.8% |
| EPS | −4.9% | +3.3% | +4.4% | |
HTGC | Revenue | +8.5% | +7.1% | +9.9% |
| EPS | +0.2% | +0.9% | −1.4% | |
GBDC | Revenue | −12.1% | −3.7% | −0.3% |
| EPS | −11.8% | −6.9% | −5.2% |
Forward fiscal years only. Blank means no analyst coverage for that year.
Three lenders to the artificial-intelligence build-out reported June-quarter results within four weeks of each other, and all three disclosed the same thing: the money they lend is earning a wider margin than it did a year ago. That is the opposite of what a capital glut looks like, and it happened while the companies borrowing that money were being marked down hard.
What the lenders disclosed
Apollo Global Management is a credit-first investment manager whose retirement arm, Athene, sells annuities and must find long-dated assets to back them. On 4 August it reported $74bn of new originations in the quarter, a record, and $150bn in the first half. Three-quarters carried an average rating of BBB+ and was priced at 280 basis points of excess spread over Treasuries; the sub-investment-grade remainder came at 440 basis points. The price matters more than the volume. Athene's net investment spread — what it earns on assets less what it owes policyholders — widened to 114 basis points from 97 the prior quarter, which management attributed to higher yields on Apollo's own originated paper. Fee-related earnings rose 25% to $785m. The $35bn financing package for Broadcom's AI compute, the largest private-credit deal ever announced, is not in the $74bn; it draws from late 2026 into 2027.
HA Sustainable Infrastructure Capital is the clean control. A $5.1bn balance-sheet lender to energy and climate projects with 170 employees, it funds itself in the same bond market it lends against, so a squeeze would show up immediately. It did not. Portfolio yield rose to 9.2% from 8.2% while its weighted-average interest cost moved only to 6.2% from 5.8%, and its own new-issue credit spread compressed below 200 basis points against 340 in 2021. New investments are being underwritten above 11%. The company raised guidance on 24% year-to-date adjusted earnings growth and a return on equity above 15%.
Blackstone, the largest alternative manager at $1.35tn of assets, is the only firm sitting on both sides — it owns data-center operator QTS as equity while originating credit against the sector. It carried that platform at $185bn in the second quarter, up from $130bn at the start of the year, and infrastructure assets reached $90bn, up 40%. Revenue grew 28.5% and operating margin reached 61.9% against 51.6% a year earlier. QTS is also a borrower: it refinanced ten data centers with a record $3.46bn commercial-mortgage-backed loan.
The borrowers are paying for it
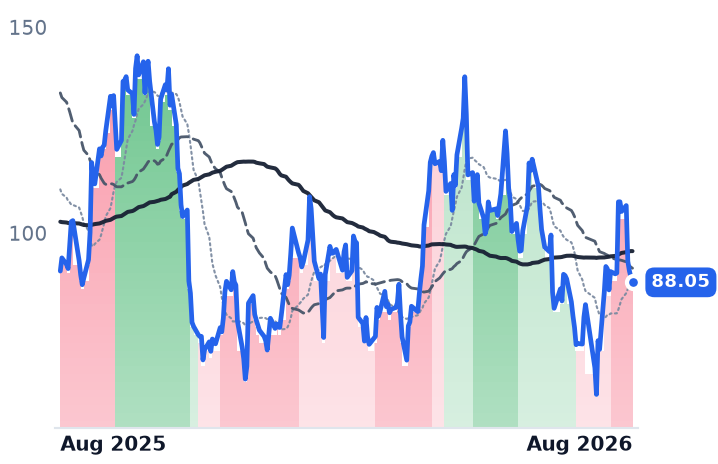
The mechanism is visible in credit markets. Investment-grade data-center secured bonds have widened 40 basis points since mid-June and their high-yield counterparts 120, on Morgan Stanley's numbers, as supply floods in — data-center asset-backed issuance has gone from $4bn in 2020 to $61bn so far this year. CoreWeave, which rents AI computing capacity, now pays $640m of net interest a quarter against $267m a year ago. Over three months Applied Digital, which builds and leases AI data centers, fell 42.7% and CoreWeave 18.2%. None of this is a rates round-trip: the 30-year Treasury yield hit a 19-year high on 18 August, with markets now leaning toward increases rather than the cuts priced in January.
The month, though, was not about lending
On 10 August Nvidia signed memorandums of understanding with Apollo, Blackstone, Brookfield, BlackRock, Goldman Sachs and KKR to mobilize more than $500bn of third-party capital for compute infrastructure. No partner has disclosed a dollar commitment and the agreements await final documentation. The next session, Apollo rose 7.8%, KKR 7.2% and Blackstone 5.9%.
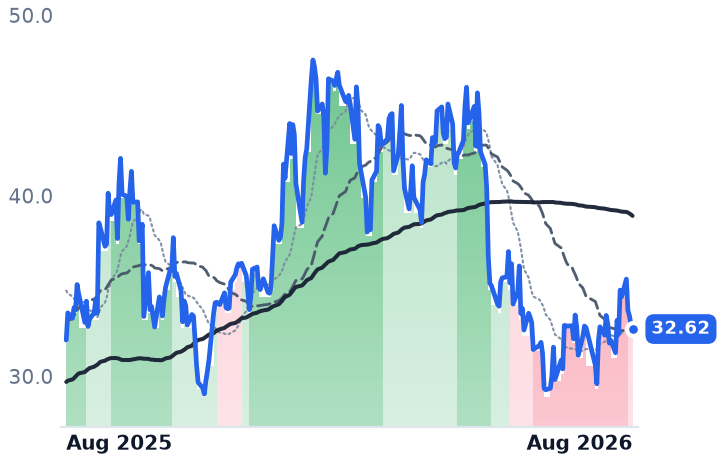
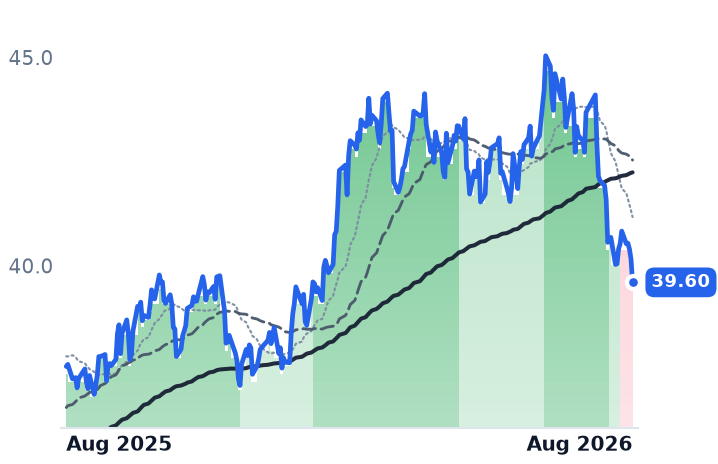
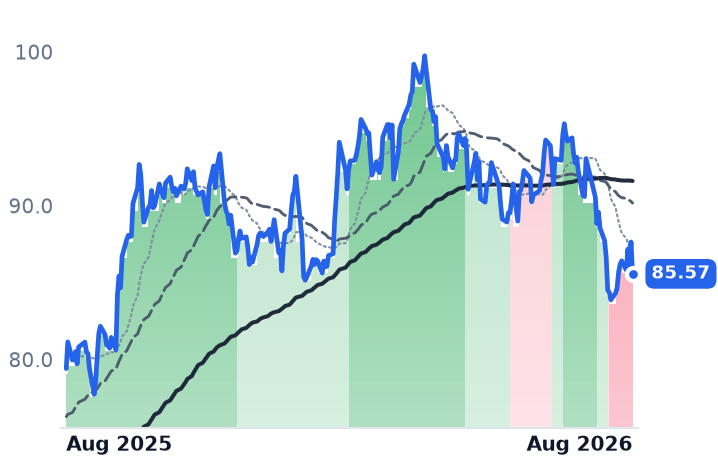
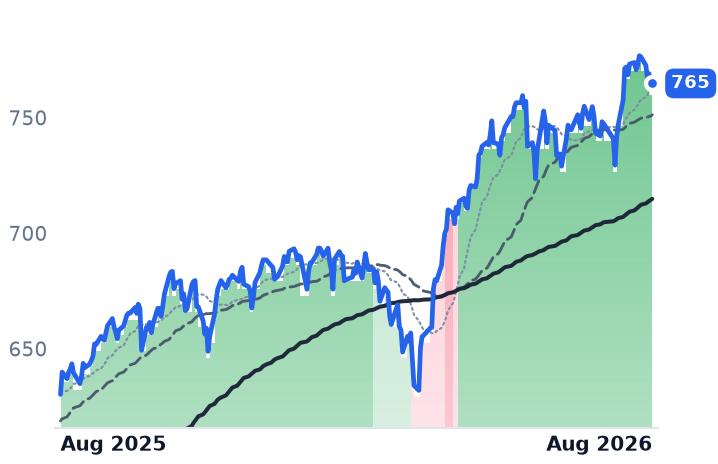
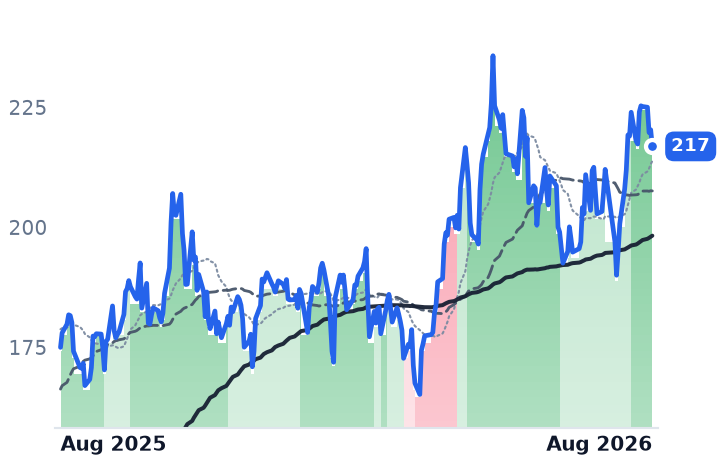
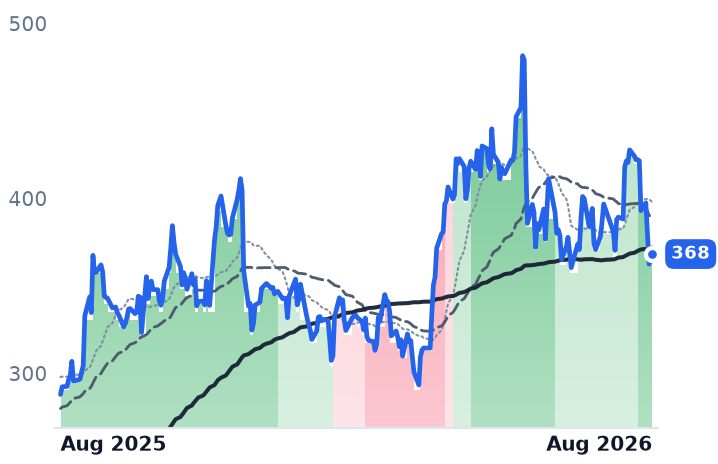
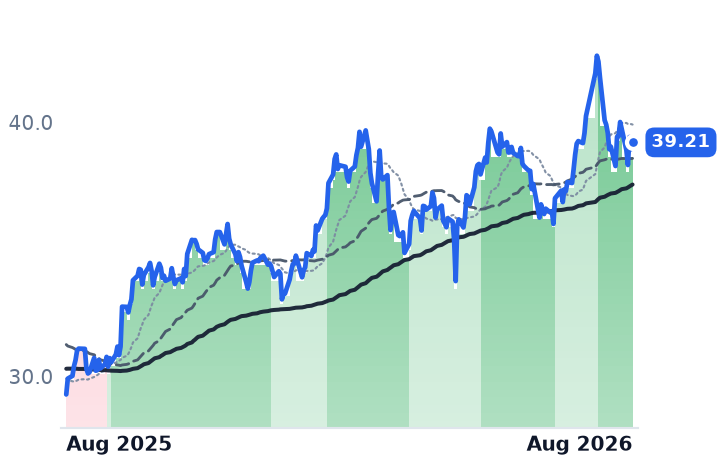
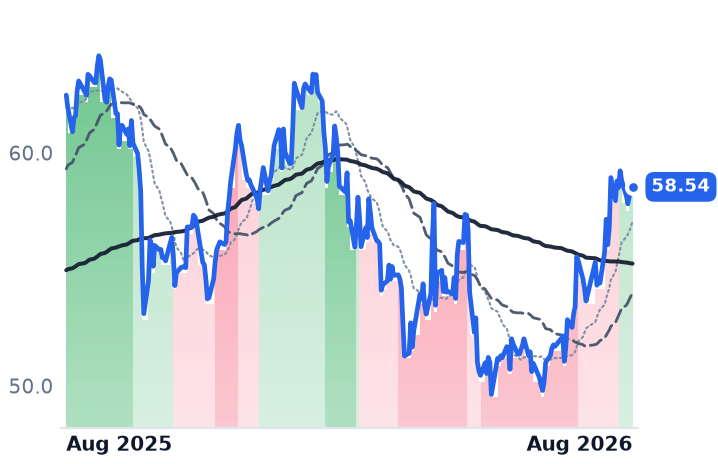
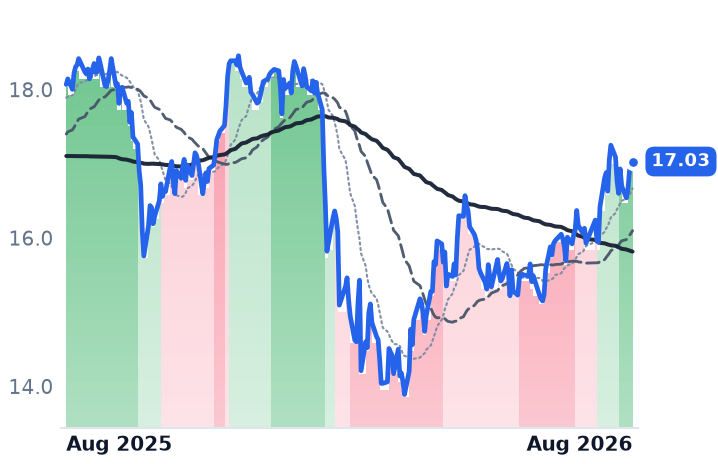
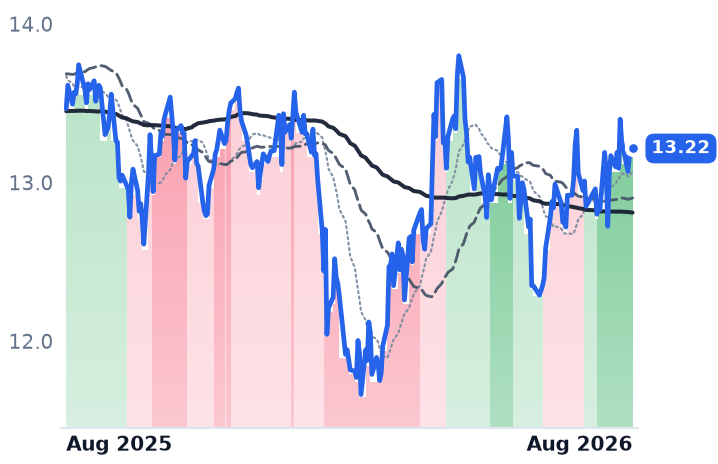
But the best 30-day performer in the group is TPG, at 26.7% — not an Nvidia partner, with no disclosed data-center credit book, and fee earnings up 43% to $315m all the same. Blue Owl added 27.0%, Ares 19.7%, Apollo 12.6%. Meanwhile the listed vehicles that actually hold these loans lagged badly: Ares Capital gained 5.8% and Blackstone Secured Lending 6.7%. The fee franchises re-rated; the loan books did not. And over twelve months the same managers remain deep underwater — Blue Owl down 37.3%, KKR 20.9%, Blackstone 11.5% — against a market up 20.3%. August was a recovery from a de-rating, not a premium for AI lending.
Where the prices sit
Apollo is the dislocation. Twelve-month return of exactly zero, revenue up 64.5%, and 28.8x trailing earnings collapsing to 15.2x forward against consensus 2027 earnings growth of 22.4%. The caution is that its quarterly accounting earnings are mark-driven — the March quarter carried a $1.9bn loss — and the overhang from March's redemption panic at its non-traded business development company has eased rather than cleared, with management flagging 36 competitors now chasing retail annuity money.
Blackstone tells the opposite story: 31.9x trailing, versus 30.8x in early May, while its market value grew from $146.5bn to $173.7bn. The advance was earnings, not enthusiasm. HASI's 61x trailing multiple is an accounting artifact; on 13.3x forward and 2.0x book it is the cheapest of the three, but a 48.1% twelve-month gain means most of that repricing has been collected.
The setup
Where it stands — Lending margins widened at all three firms, but August's share gains tracked the whole alternative-manager group regardless of data-center exposure. Would confirm — Athene's net investment spread holding above 110 basis points in the September quarter, with originations again above $70bn. Would invalidate — Excess spread on Apollo's investment-grade originations falling back toward 250 basis points as competing capital arrives. Watch next — Third-quarter results in late October, plus the first named project under Nvidia's financing memorandums. Valuation — Apollo 28.8x trailing and 15.2x forward; Blackstone 31.9x and 24.1x; HASI 13.3x forward and 2.0x book.