

MLI's -52.8% Slide Is a Stock Split, Not a Downtrend
Prompt v1.0
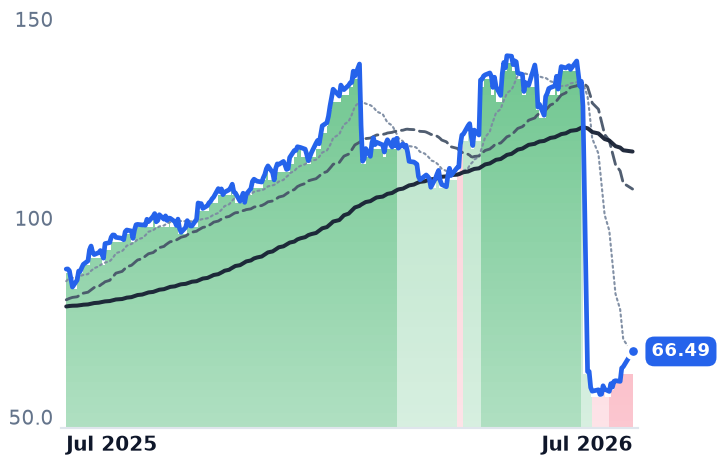
Mueller Industries' apparent -52.8% three-month collapse is an unadjusted 2-for-1 stock split; split-adjusted the stock is only -7.7% over 90 days and just rallied 5.6% on a record Q2. The real, dateable move is a 30-day multiple de-rate in the datacenter-levered HVAC/electrical names (AAON, ATKR) that are still above their 200-day averages — while the genuinely broken residential pair, BLDR and IBP, rolled over back in May.
| Ticker | Company | Segment | Trend · 13mo | 30D | 1Y |
|---|---|---|---|---|---|
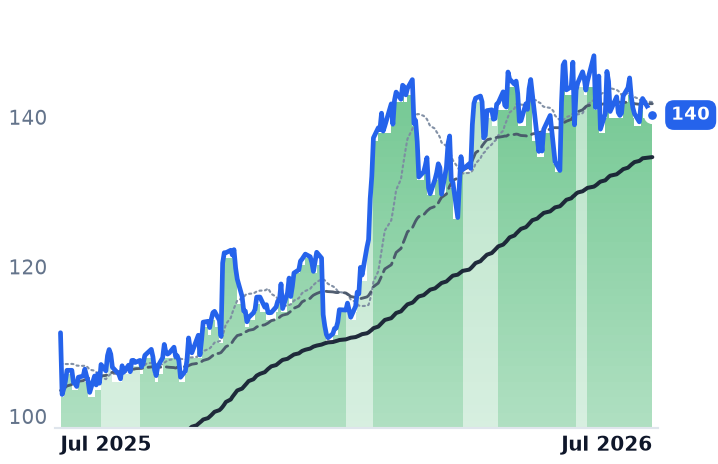
MLI | Mueller Industries | Copper & Brass Products | 🟢 Cont. Bull | +8.3% | −23.7% |
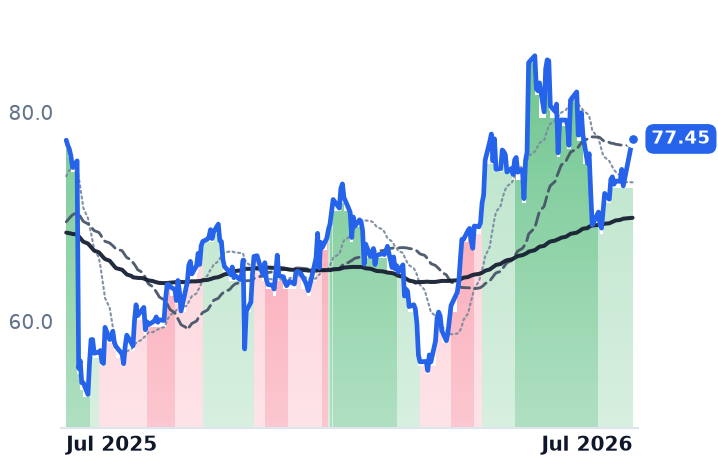
ATKR | Atkore | Electrical Infrastructure Products | 🌱 Emerging Bull | +3.1% | +0.2% |
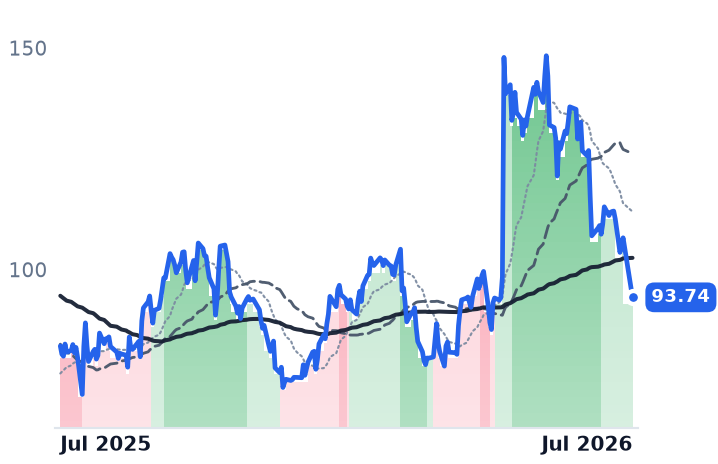
AAON | AAON | HVAC Systems | 🟢 Cont. Bull | −25.4% | +13.2% |
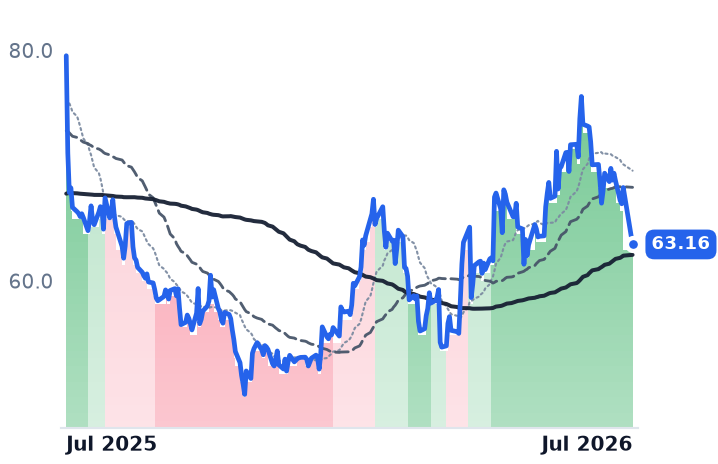
CARR | Carrier Global | HVAC & Refrigeration | 🌱 Emerging Bull | −14.0% | −20.6% |
JCI | Johnson Controls International | HVAC & Refrigeration | 🟢 Cont. Bull | −0.1% | +26.2% |
BLDR | Builders FirstSource | Building Envelope & Insulation | 🔴 Cont. Bear | −18.6% | −45.7% |
IBP | Installed Building Products | Building Products & Installation | ⚠️ Emerging Bear | — | — |
LII | Lennox International | HVAC Systems | 🌱 Emerging Bull | — | — |
MAS | Masco | Plumbing & Bath Fixtures | 🟢 Cont. Bull | — | — |
WSO | Watsco | Electrical & HVAC Distribution | 🌱 Emerging Bull | — | — |
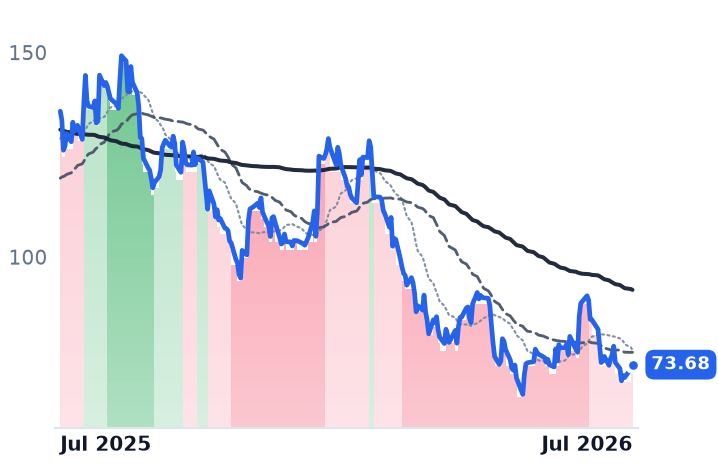
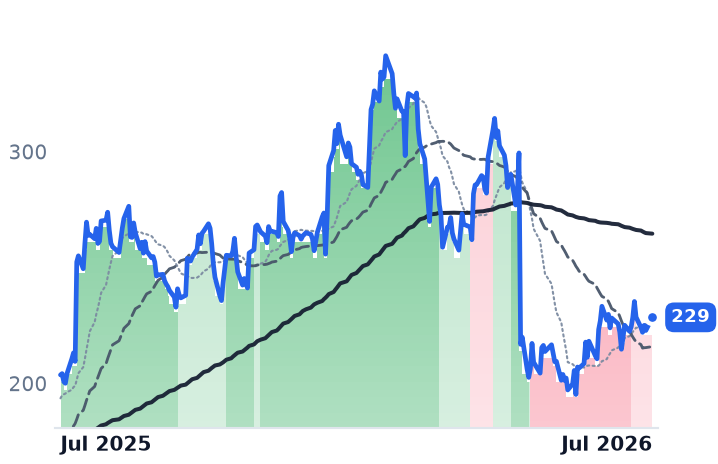
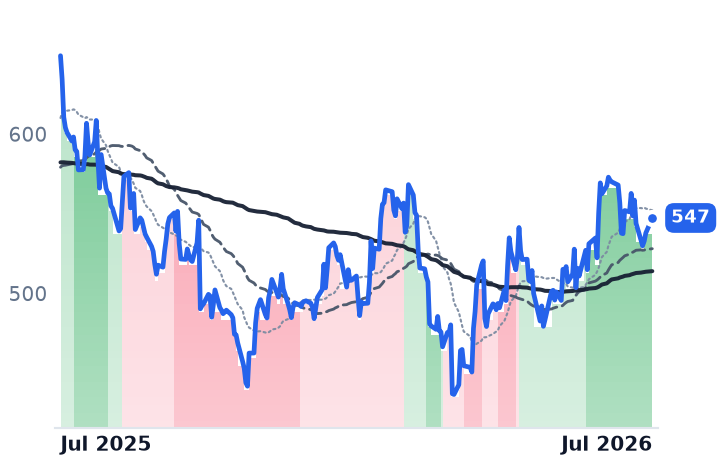
12-month price & trend
| Ticker | Mkt cap | P/E | P/E fwd | P/S | P/S fwd | P/GP | P/GP fwd | EV/EBITDA | FCF yld |
|---|---|---|---|---|---|---|---|---|---|
MLI | $14.7B | 17.0x | 16.0x | 3.2x | 2.9x | 11.6x | 10.6x | 11.2x | 2.5% |
ATKR | $3.2B | n/m | 16.8x | 1.1x | 1.1x | 5.5x | 5.4x | n/m | 1.8% |
AAON | $11.1B | 93.8x | 61.7x | 6.9x | 5.5x | 26.2x | 21.0x | 44.5x | -1.3% |
| Ticker | Mkt cap | P/E | P/E fwd | P/S | P/S fwd | P/GP | P/GP fwd | EV/EBITDA | FCF yld |
|---|---|---|---|---|---|---|---|---|---|
CARR | $53.7B | 40.9x | 23.2x | 2.5x | 2.4x | 9.9x | 9.7x | 20.6x | 3.1% |
JCI | $87.3B | 24.6x | 29.5x | 3.6x | 3.5x | 9.8x | 9.5x | 28.3x | 1.6% |
BLDR | $7.6B | 26.5x | 16.4x | 0.5x | 0.5x | 1.7x | 1.7x | 10.5x | 11.4% |
| Ticker | Mkt cap | P/E | P/E fwd | P/S | P/S fwd | P/GP | P/GP fwd | EV/EBITDA | FCF yld |
|---|---|---|---|---|---|---|---|---|---|
IBP | $5.6B | 22.0x | 20.5x | 1.9x | 1.9x | 5.7x | 5.7x | 9.1x | 1.1% |
LII | $17.4B | 22.2x | 20.6x | 3.3x | 3.1x | 10.0x | 9.4x | 17.1x | 3.8% |
MAS | $13.1B | 15.8x | 15.2x | 1.7x | 1.7x | 4.8x | 4.8x | 11.6x | 7.2% |
| Ticker | Mkt cap | P/E | P/E fwd | P/S | P/S fwd | P/GP | P/GP fwd | EV/EBITDA | FCF yld |
|---|---|---|---|---|---|---|---|---|---|
WSO | $16.4B | 30.9x | 31.8x | 2.3x | 2.2x | 8.0x | 7.7x | 21.2x | 4.2% |
Consensus projections
| Ticker | FY2026E | FY2027E | FY2028E | |
|---|---|---|---|---|
MLI | Revenue | +21.1% | +7.7% | +8.8% |
| EPS | +16.5% | +6.0% | +11.4% | |
ATKR | Revenue | +5.7% | +2.9% | +7.7% |
| EPS | −15.1% | +12.6% | +14.7% | |
AAON | Revenue | +44.5% | +15.1% | +21.9% |
| EPS | +55.9% | +53.8% | +35.7% | |
CARR | Revenue | +1.5% | +4.9% | +5.2% |
| EPS | +7.3% | +14.5% | +13.4% | |
JCI | Revenue | +7.5% | +6.7% | +5.7% |
| EPS | +30.8% | +16.5% | +13.2% | |
BLDR | Revenue | −3.0% | +5.5% | +6.2% |
| EPS | −39.2% | +44.1% | +19.4% | |
IBP | Revenue | −0.4% | +4.5% | +7.0% |
| EPS | −6.9% | +10.7% | +18.3% | |
LII | Revenue | +6.4% | +5.3% | +4.9% |
| EPS | +6.0% | +9.6% | +9.2% | |
MAS | Revenue | +2.4% | +3.2% | +3.6% |
| EPS | +8.7% | +9.9% | +10.9% | |
WSO | Revenue | +3.6% | +4.9% | +4.4% |
| EPS | +2.8% | +9.1% | +8.7% |
Forward fiscal years only. Blank means no analyst coverage for that year.
The -52.8% isn't real
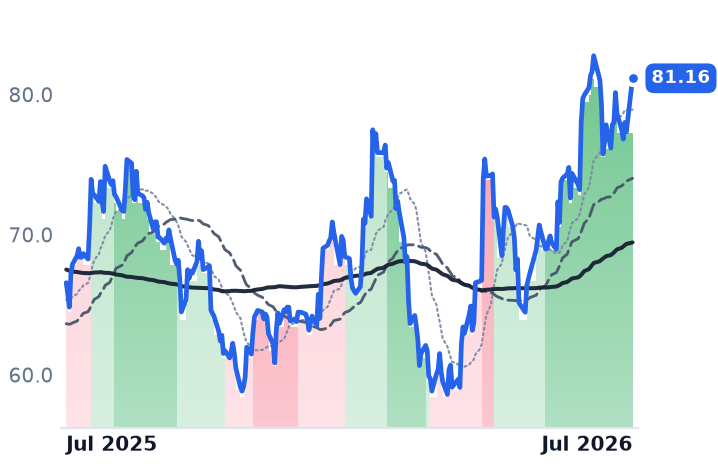
MLI's screen-level three-month collapse is a corporate action, not a trend break. The price went from $128.20 on June 26 to $61.42 on June 29 in a single session — exactly half — with adj_close equal to close, the signature of an unadjusted split. Mueller's board declared a two-for-one forward stock split with a June 25 record date, distributed after the close on June 30; the company also filed an 8-K raising authorized shares to 500 million. Split-adjusted, MLI is roughly -7.7% over 90 days and -11.0% off its 52-week high. The strongly bullish → strongly bearish band flip dated July 13 is a mechanical moving-average artifact of halving price against unadjusted SMAs.
The fundamentals run the other way. Q2 2026, reported July 21, showed net sales of $1.43 billion versus $1.14 billion and operating income of $310.0 million, with COMEX copper averaging $6.16/lb, up 30.6% year over year — the stock closed up 5.6% that day. Q1 had already delivered 30.0% gross margin versus 27.2%, aided by pricing, mix and a $41.4 million Sherwood Valve gain. MLI trades at 17.6x trailing, 16.9x forward.
The macro leg inverts
The tariff windfall is not normalizing. US copper tariffs were finalized June 30, 2026 with refined copper phased in from 2027, alongside record 650,000-ton COMEX inventories; copper set a record $6.73/lb on June 3, and Goldman Sachs forecasts only a modest decline from record highs. The COMEX-LME premium collapse was a July 2025 Section 232 event, not a live 2026 driver.
What is actually moving
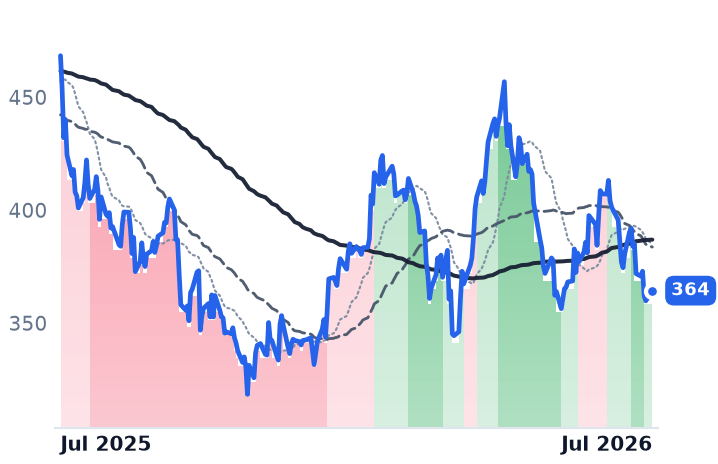
Over 30 days the live cohort fell together: AAON -21.3%, ATKR -11.0%, MLI -10.2% split-adjusted, CARR -5.2%, JCI -3.9%, with ATKR stepping to mildly bullish July 6 and AAON July 8. But over 90 days CARR is +10.7%, AAON +8.6%, ATKR +1.2%, JCI +0.5%, and all four sit above their 200-day averages. AAON meanwhile raised 2026 revenue growth guidance to 40-45% with backlog up 107% to a record $2.1 billion, and Atkore posted $731 million in quarterly sales with ~5% organic volume growth and guided FY26 to $2.9-2.95 billion. That is de-rating off a blowoff top, not demand failure.
The broken leg is residential, and it broke first: BLDR and IBP were already strongly bearish on May 19 at -41.7% and -37.6% over 90 days, with BLDR reporting Q1 sales of $3.29 billion, down 10.1%. Pending home sales fell 5.4% in June and 30-year mortgage rates sit near 6.64% with half the Fed favoring a hike. Caveat: five of the ten cohort tickers have no local data after May 19.