

North American gas: a border split, not a cohort downtrend
Prompt v1.0
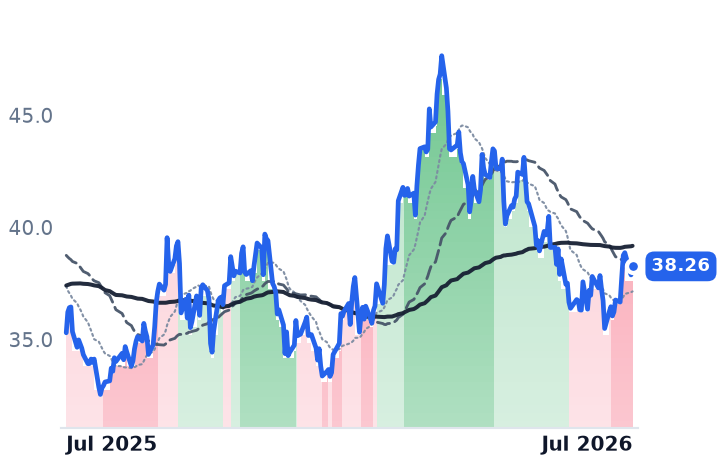
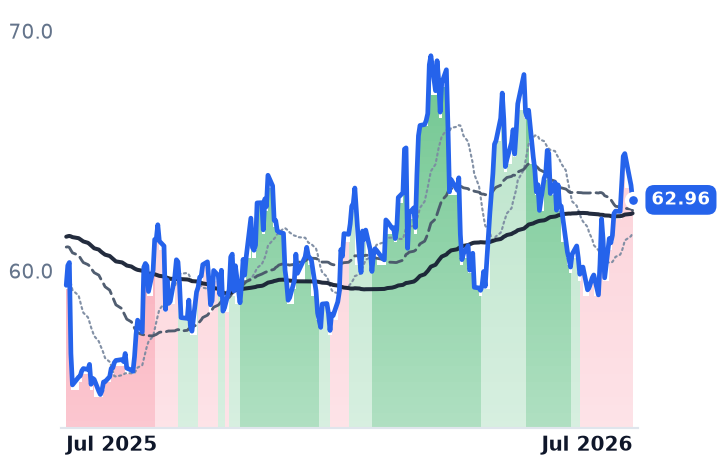
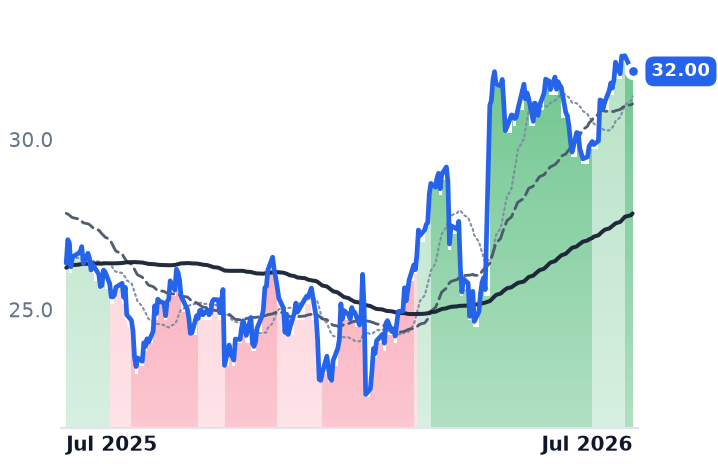
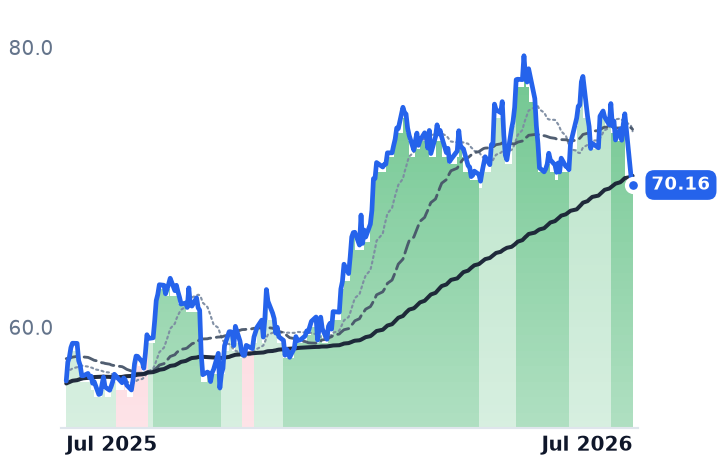
The "five-session unison decline" across gas producers is a single session — 27 July. The real structure is a split: US gas E&Ps broke their bull bands back in April–June and have sat in strongly bearish ever since, while Canadian producers and midstream printed 52-week highs four sessions before the alleged downtrend.
| Ticker | Company | Segment | Trend · 13mo | 30D | 1Y |
|---|---|---|---|---|---|
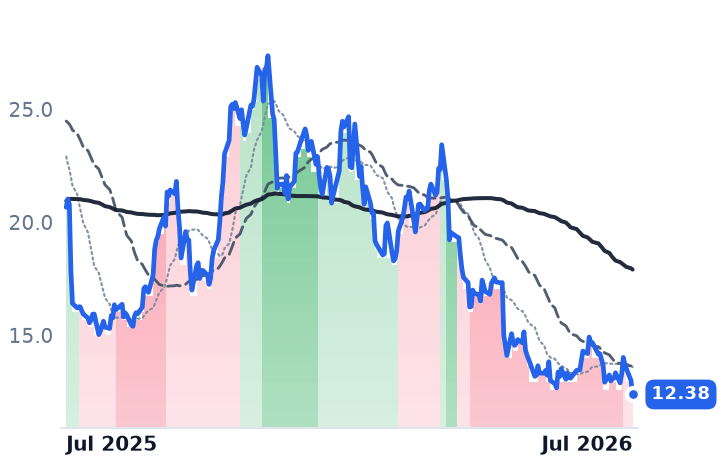
CRK | Comstock Resources | Diversified Onshore & Conventional | ⚠️ Emerging Bear | −12.8% | −40.1% |
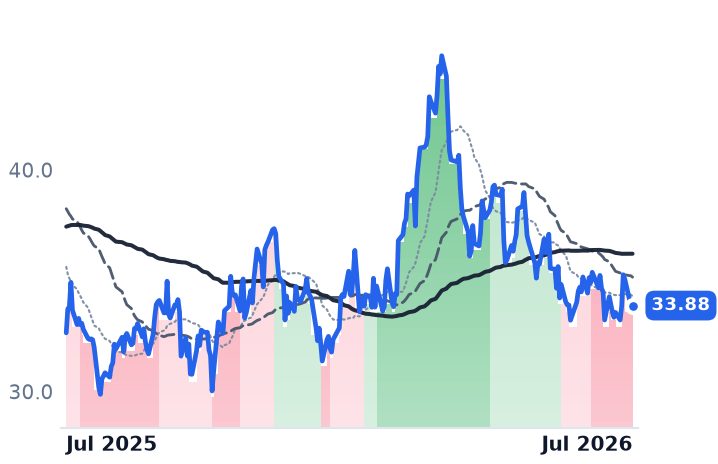
AR | Antero Resources | Appalachian Shale Gas | 🔴 Cont. Bear | −1.6% | +3.8% |
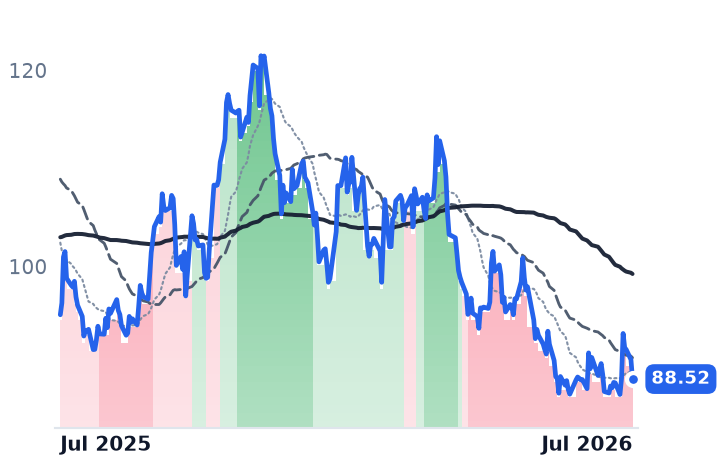
EXE | Expand Energy | Appalachian Shale Gas | ⚠️ Emerging Bear | +1.1% | −6.9% |
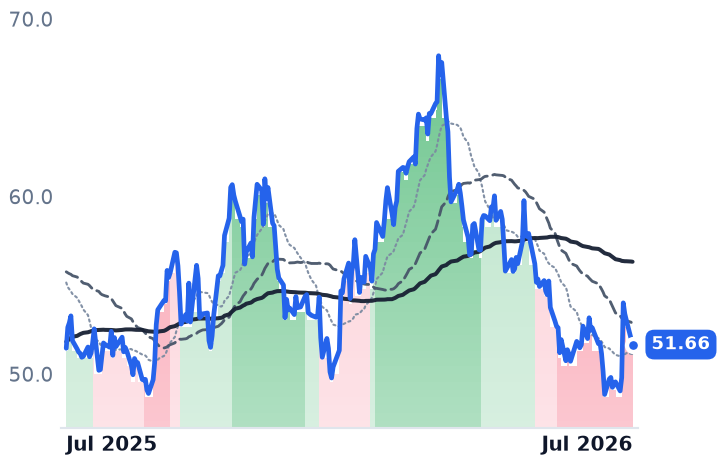
EQT | EQT | Appalachian Shale Gas | ⚠️ Emerging Bear | −0.7% | +0.4% |
RRC | Range Resources | Appalachian Shale Gas | 🔴 Cont. Bear | +5.3% | +8.4% |
TOU.TO | Tourmaline Oil | Oil & Gas Exploration & Production | ⚠️ Emerging Bear | +6.3% | +6.0% |
ARX.TO | ARC Resources | — | 🌱 Emerging Bull | +8.5% | +21.4% |
WMB | The Williams Companies | Natural Gas Pipelines & Transmission | 🟢 Cont. Bull | −6.5% | +24.9% |
PPL.TO | Pembina Pipeline | Oil & Gas Midstream | 🟢 Cont. Bull | +6.2% | +46.1% |
NG=F | Natural Gas Sep 26 | — | 🔴 Cont. Bear | −15.8% | −10.3% |
DVN | Devon Energy | Diversified Onshore & Conventional | 🟢 Cont. Bull | +1.6% | +27.5% |
LNG | Cheniere Energy | LNG Export & Infrastructure | 🟢 Cont. Bull | +3.4% | +11.2% |
KMI | Kinder Morgan | Natural Gas Pipelines & Transmission | 🟢 Cont. Bull | −2.0% | +19.9% |
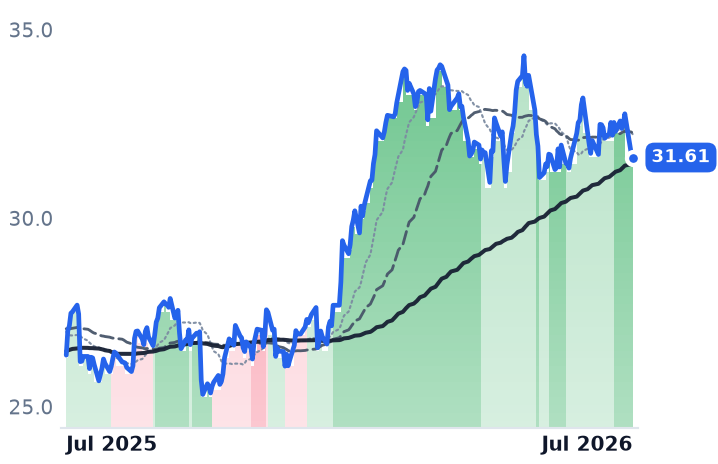
12-month price & trend
| Ticker | Mkt cap | P/E | P/E fwd | P/S | P/S fwd | P/GP | P/GP fwd | EV/EBITDA | FCF yld |
|---|---|---|---|---|---|---|---|---|---|
CRK | $3.9B | 7.6x | 32.0x | 2.1x | 2.0x | 3.1x | 3.0x | 5.2x | -18.7% |
AR | $11.6B | 10.8x | 9.0x | 2.0x | 1.7x | 4.4x | 3.8x | 6.8x | 12.1% |
EXE | $21.9B | 8.1x | 10.3x | 1.6x | 1.6x | 2.6x | 2.6x | 3.8x | 11.6% |
| Ticker | Mkt cap | P/E | P/E fwd | P/S | P/S fwd | P/GP | P/GP fwd | EV/EBITDA | FCF yld |
|---|---|---|---|---|---|---|---|---|---|
EQT | $33.8B | 11.9x | 12.8x | 3.6x | 3.6x | 5.3x | 5.2x | 6.4x | 11.1% |
RRC | $9.3B | 11.0x | 9.7x | 2.8x | 2.6x | 5.9x | 5.5x | 7.2x | 12.6% |
TOU.TO | $23.0B | 61.0x | 13.1x | 4.0x | 3.4x | 75.6x | 65.7x | 6.7x | 0.9% |
| Ticker | Mkt cap | P/E | P/E fwd | P/S | P/S fwd | P/GP | P/GP fwd | EV/EBITDA | FCF yld |
|---|---|---|---|---|---|---|---|---|---|
ARX.TO | — | — | — | — | — | — | — | — | — |
WMB | $90.1B | 29.2x | 30.4x | 7.4x | 7.3x | 10.0x | 10.0x | 16.2x | -0.2% |
PPL.TO | $39.6B | 24.0x | 22.0x | 5.0x | 4.6x | 13.4x | 12.3x | 14.2x | 5.2% |
| Ticker | Mkt cap | P/E | P/E fwd | P/S | P/S fwd | P/GP | P/GP fwd | EV/EBITDA | FCF yld |
|---|---|---|---|---|---|---|---|---|---|
NG=F | — | — | — | — | — | — | — | — | — |
DVN | $30.8B | 13.6x | 9.2x | 1.8x | 1.3x | 8.1x | 5.8x | 4.9x | 8.7% |
LNG | $56.9B | 20.1x | — | 2.6x | 2.6x | 4.8x | 4.8x | 10.0x | 12.4% |
| Ticker | Mkt cap | P/E | P/E fwd | P/S | P/S fwd | P/GP | P/GP fwd | EV/EBITDA | FCF yld |
|---|---|---|---|---|---|---|---|---|---|
KMI | $70.7B | 20.3x | 20.9x | 3.9x | 3.9x | 7.2x | 7.1x | 12.7x | 5.5% |
Consensus projections
| Ticker | FY2026E | FY2027E | FY2028E | |
|---|---|---|---|---|
CRK | Revenue | +2.5% | +16.5% | +12.5% |
| EPS | −20.6% | +71.4% | +79.2% | |
AR | Revenue | +30.3% | +0.3% | +7.0% |
| EPS | +130.9% | +1.8% | +26.1% | |
EXE | Revenue | +17.6% | −3.0% | +4.6% |
| EPS | +52.6% | −4.4% | +15.1% | |
EQT | Revenue | +12.9% | −0.5% | +9.5% |
| EPS | +43.8% | −5.2% | +31.6% | |
RRC | Revenue | +17.7% | +2.8% | +7.2% |
| EPS | +41.8% | −3.5% | +16.8% | |
TOU.TO | Revenue | +10.2% | +8.9% | −1.3% |
| EPS | +44.6% | +7.4% | +6.3% | |
WMB | Revenue | +7.4% | +9.9% | +12.7% |
| EPS | +14.1% | +4.5% | +18.3% | |
PPL.TO | Revenue | +9.3% | +4.2% | +4.6% |
| EPS | +15.8% | +2.2% | +5.3% | |
DVN | Revenue | +42.1% | +10.1% | +4.9% |
| EPS | +35.0% | −1.0% | +8.2% | |
LNG | Revenue | +11.9% | +6.0% | +3.4% |
| EPS | −141.4% | −345.2% | −8.0% | |
KMI | Revenue | +8.2% | +1.9% | +5.8% |
| EPS | +18.1% | +0.8% | +8.6% |
Forward fiscal years only. Blank means no analyst coverage for that year.
The move being described is one session
Measuring from the 23 July close to the 27 July close reproduces the cited declines almost exactly — CRK -5.2% (13.72→13.00), DVN -4.7%, WMB -5.9%, AR -3.5%, PPL.TO -2.2%, TOU.TO -2.0%. Over a properly measured trailing five sessions, most of the cohort is up: EQT +6.0%, EXE +4.1%, RRC +3.1%, TOU.TO +1.7%, CRK +0.9%, AR +0.8%. The reason is that these names rallied 4–9% between 20 and 23 July on EQT's Q2 print, which was a beat-and-raise rather than a guidance cut: 634 Bcfe of sales volume above the high end of guidance, capex of $666M some 9% below the low end, FY26 production guidance raised and full-year capital reduced by $25M. EQT also closed its Blackline Midstream acquisition on 21 July alongside $1,048M of operating cash flow. Williams' 27 July drop had no company-specific catalyst — a broad energy selloff as gas hit an 11-week low.
The break is old, and it stops at the border
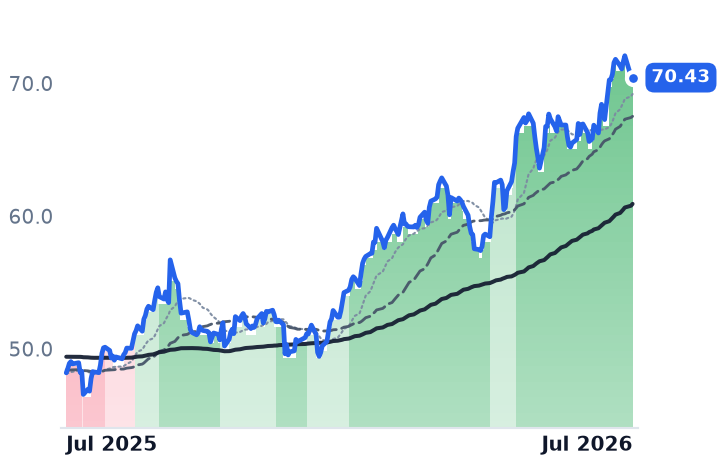
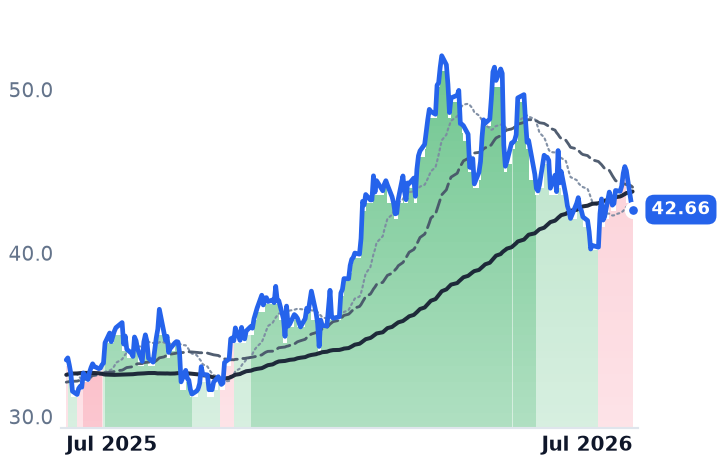
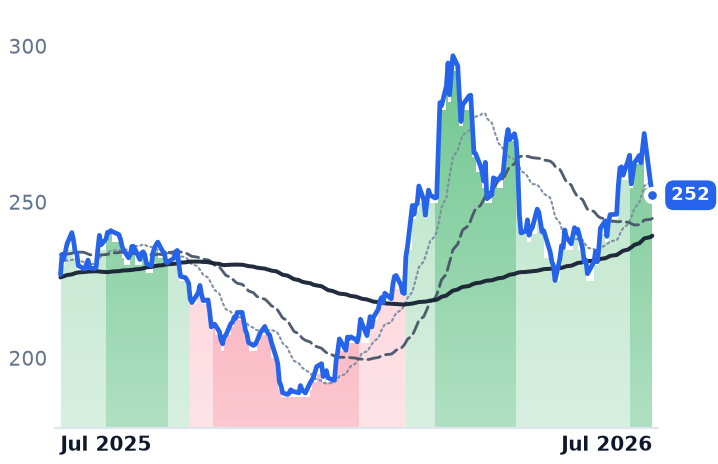
The US gas E&Ps left their bull bands months ago: CRK on 6 April, EXE 8 April, EQT to mildly bearish 26 May, AR 12 June, RRC 17 June. AR, EQT, EXE and RRC are all in strongly bearish bands today, 20–53% off 52-week highs. Distance to the 200-day average splits the group cleanly — CRK -31.5%, EXE -12.0%, EQT -7.8%, AR -5.0%, RRC -2.3% below; TOU.TO +1.4%, WMB +3.7%, KMI +4.6%, LNG +10.2%, ARX.TO +17.1% and PPL.TO +18.4% above. ARX.TO and PPL.TO set 52-week closing highs on 23 July, four sessions before the supposed downtrend. Canadian producers have curtailed rather than grown into weak AECO, with Tourmaline and ARC deferring fracs and AECO projected to firm from C$1.62/GJ in 2026 to C$2.31 in 2027.
The macro leg reads seasonal
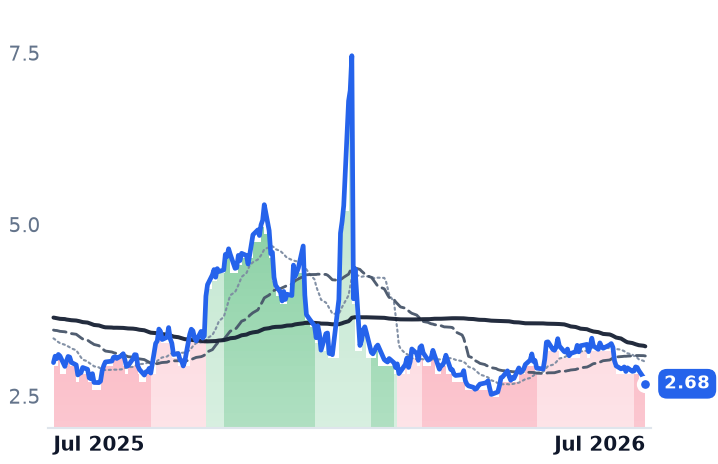
Henry Hub closed at $2.753 and was downgraded to strongly bearish on 21 July — before the equity move — yet it is still +8.0% over three months. Storage at 2,983 Bcf sits 185 Bcf (~7%) above the five-year average, a known and modest surplus. The curve is in steep contango, with January 2027 quoted near $4.25, and EIA's own base case has prices falling slightly in 2026 then rising in 2027. Supply is at records — dry gas from 107.7 to 111.0 Bcf/d — but so is demand, with Plaquemines feedgas past 4 Bcf/d and Golden Pass shipping its first cargo as feedgas tops 20 Bcf/d. Even the datacenter leg has a dated contract behind it: Comstock's 5.2 GW Western Haynesville power hub could take nearly 1 Bcf/d by 2031.
The tape is not pricing an early producer downtrend. It priced one months ago, and it did so only for the US molecule owners.