

Natural Gas Supply Chain Selloff: Three Distinct Stories, Not One Macro Trade
Prompt v1.0
The coordinated-looking drawdown across CRK, NFE, CLB, PRIM, and FLR is not one trade — it is three separate stories: an idiosyncratic NFE balance-sheet collapse, a genuine gas-curve de-rating for E&Ps and services names, and company-specific execution failures at the EPC contractors. The AI-datacenter/LNG demand tailwind is real but unevenly distributed across the cohort.
| Ticker | Company | Segment | Trend · 13mo | 30D | 1Y |
|---|---|---|---|---|---|
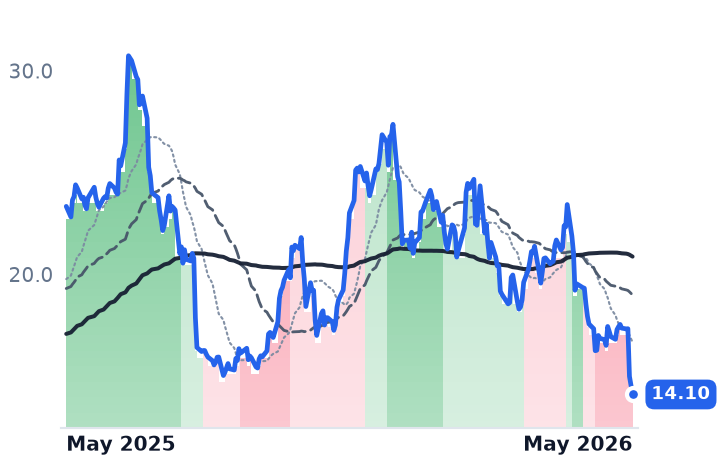
CRK | Comstock Resources | Diversified Onshore & Conventional | ⚠️ Emerging Bear | −21.4% | −39.6% |
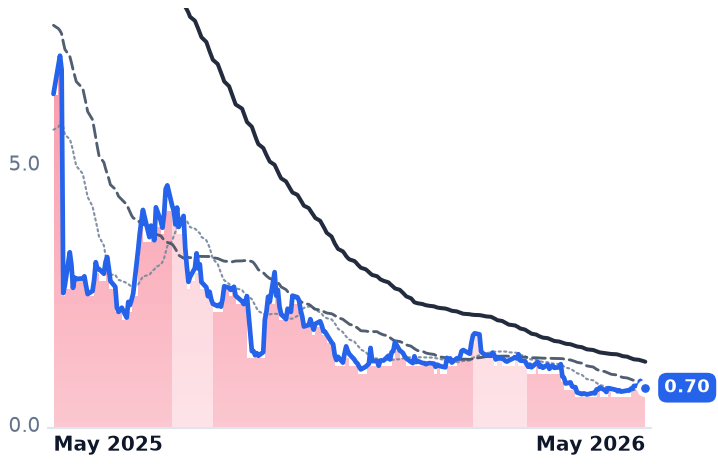
NFE | New Fortress Energy | Regulated Gas | 🔴 Cont. Bear | +4.8% | −88.9% |
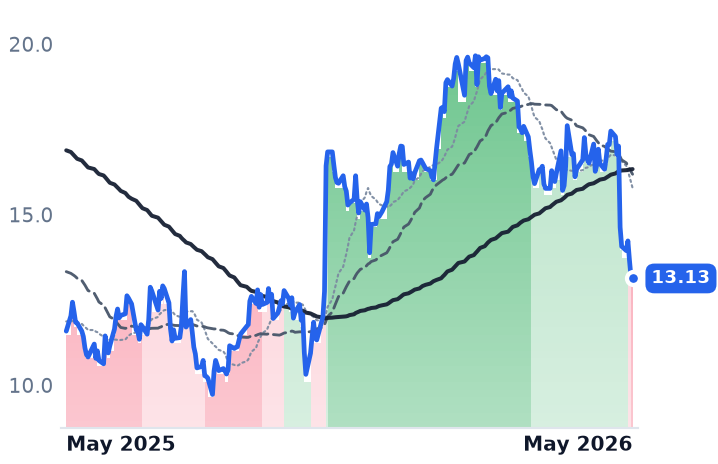
CLB | Core Laboratories | Oilfield Equipment & Tools | 🔴 Cont. Bear | −21.0% | +13.3% |
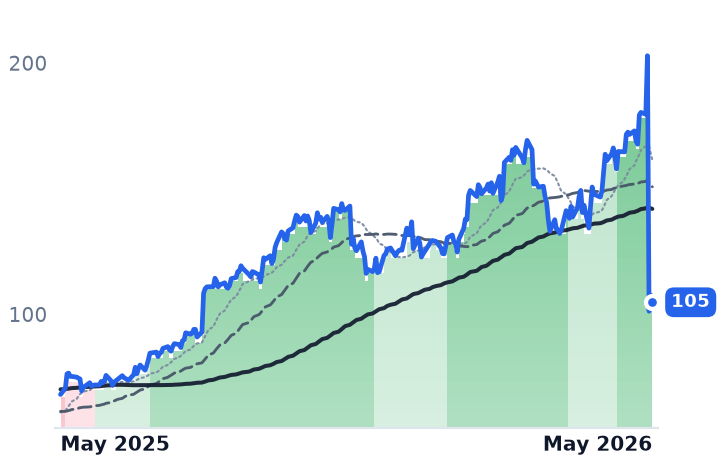
PRIM | Primoris Services | Energy & Power Project Solutions | 🟢 Cont. Bull | −36.0% | +53.9% |
FLR | Fluor | Energy & Power Project Solutions | 🌱 Emerging Bull | −11.7% | +20.8% |
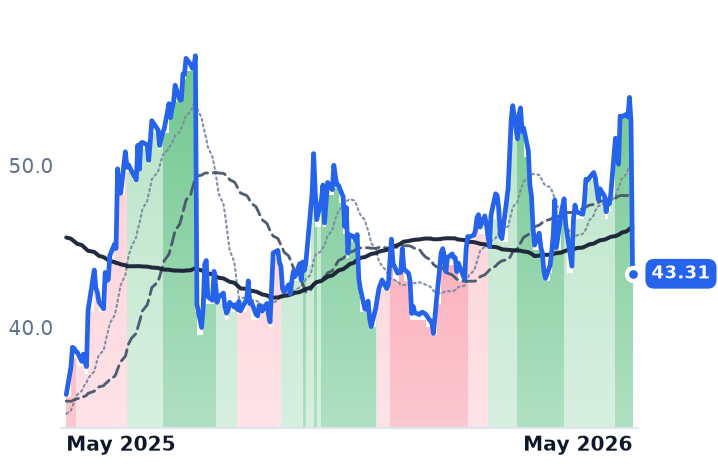
12-month price & trend
| Ticker | Mkt cap | P/E | P/E fwd | P/S | P/S fwd | P/GP | P/GP fwd | EV/EBITDA | FCF yld |
|---|---|---|---|---|---|---|---|---|---|
CRK | $3.9B | 7.6x | 32.0x | 2.1x | 2.0x | 3.1x | 3.0x | 5.2x | -18.7% |
NFE | $197.4M | n/m | — | 0.2x | 0.1x | 1.0x | 0.4x | n/m | -519.1% |
CLB | $602.5M | 20.7x | 21.2x | 1.1x | 1.2x | 6.4x | 6.6x | 8.6x | 3.1% |
| Ticker | Mkt cap | P/E | P/E fwd | P/S | P/S fwd | P/GP | P/GP fwd | EV/EBITDA | FCF yld |
|---|---|---|---|---|---|---|---|---|---|
PRIM | $6.1B | 24.7x | 23.4x | 0.8x | 0.8x | 7.9x | 7.7x | 14.4x | 2.7% |
FLR | $6.2B | 21.4x | 16.9x | 0.4x | 0.4x | — | — | n/m | -0.7% |
Consensus projections
| Ticker | FY2026E | FY2027E | FY2028E | |
|---|---|---|---|---|
CRK | Revenue | +2.5% | +16.5% | +12.5% |
| EPS | −20.6% | +71.4% | +79.2% | |
NFE | Revenue | +89.1% | +3.5% | −36.7% |
| EPS | −71.2% | −105.6% | −185.7% | |
CLB | Revenue | −1.1% | +5.7% | +14.4% |
| EPS | −16.4% | +36.8% | +75.3% | |
PRIM | Revenue | +2.8% | +11.4% | +7.6% |
| EPS | −12.3% | +24.1% | +10.2% | |
FLR | Revenue | +2.8% | +7.0% | +6.9% |
| EPS | +19.4% | +23.9% | +15.8% |
Forward fiscal years only. Blank means no analyst coverage for that year.
What's Actually Driving the Cohort Move
On the surface, five names across the U.S. natural gas supply chain have all declined sharply over recent months — CRK -42% in 3 months, NFE -47% in 3 months and -89% over 12 months, CLB -33% in 3 months, PRIM -42% in five days, and FLR -19% in five days. The instinct to read this as a single macro gas-curve trade is understandable, but the evidence does not support it. Three distinct mechanisms are at work.
Story 1: NFE Is Idiosyncratic and Has No Read-Through
New Fortress Energy's collapse is entirely self-inflicted and should be quarantined from any thesis about LNG demand. The company has disclosed going-concern risk, carries roughly $8.9B in debt, has missed interest payments, and has been flagged for pervasive financial misstatements. This is a balance-sheet and governance failure, not a signal about global LNG appetite. Treating NFE's -89% over 12 months as evidence of structural LNG weakness would be a category error.
Story 2: Gas-Curve De-Rating Is Real for E&Ps and Services
For CRK and CLB, the selloff does track the gas curve. The EIA's May 2026 Short-Term Energy Outlook projects Henry Hub averaging roughly $3.1/MMBtu in Q2–Q3 2026, with storage levels near the five-year average and supply growth continuing to outpace demand. That is a genuine headwind for gas-weighted E&Ps and the reservoir/completion services companies that serve them. CRK's gas realizations and CLB's activity levels in the Haynesville and other dry-gas basins move with the strip, and the strip is soft.
However, CRK's Q1 2026 earnings call introduced a potentially transformational counterweight: the U.S. Department of Commerce selected CRK's Western Haynesville acreage as the site for a 5.2 GW NextEra gas-fired power hub, tied to a reported $550B Japan-U.S. trade framework. Management explicitly positioned CRK as a dedicated supplier for AI-datacenter gas demand. If that contract structure holds, CRK's medium-term volume and price visibility looks materially different from what spot Henry Hub alone implies — raising the question of whether the stock is discounting too much pessimism relative to its contracted-supply opportunity.
Story 3: EPC Contractors Hit by Execution, Not Demand
PRIM's five-day crash of roughly 49% (settling around -42% net) was triggered by Q1 2026 renewables cost overruns and a guidance cut to adjusted EPS of $4.80–$5.00 against a prior consensus near $5.93 — a roughly 17% miss at the midpoint. FLR's Energy Solutions segment absorbed a $643M Santos litigation charge in 2025. These are execution and legal resets, not demand collapses.
Critically, both companies are reporting expanding gas-related backlogs. PRIM cited roughly $800M in near-term verbal awards in gas-fired generation and described a $7B+ multi-year pipeline funnel. FLR continues to pursue LNG export terminal work. The stock dislocations appear to reflect investor frustration with near-term earnings misses rather than any structural deterioration in the gas-power or LNG-export construction markets — which remain active given ongoing LNG export capacity additions at projects like Plaquemines LNG and Rio Grande LNG.
Why the Distinction Matters
The AI-datacenter power demand narrative is showing up in EPC backlog commentary and in CRK's direct contract discussions, but it has not yet fully offset near-term gas-price weakness for the pure E&P and services names. The macro tailwind is real; the timing of when it translates into higher realizations and margin recovery is the open question. What the evidence makes clear is that investors grouping these five names as a single "gas supply chain" trade risk conflating a going-concern credit event (NFE), a commodity-price cycle (CRK/CLB), and project execution stumbles (PRIM/FLR) — each of which has a different resolution timeline and a different set of catalysts to watch.