

Nutanix Costs 62% More per Dollar of Gross Profit Than in May, on No New Numbers
Hypothesis Opus 5 · Research Opus 5 · Writing Opus 5 · Prompt v1.5
Last week the market stopped rewarding cloud companies for selling artificial-intelligence capacity and started penalizing them for owning it. With the 30-year Treasury yield at a 19-year high, every operator funding graphics chips on its own balance sheet was sold, while Nutanix — which licenses software onto hardware its customers buy — barely moved.
The problem is that the businesses point the other way. DigitalOcean's revenue growth accelerated for a fourth straight quarter, to 28.6%, and its artificial-intelligence customer base now carries $234m of annual recurring revenue, yet the shares are down 28% in three months. Nutanix's growth has halved to 10% over the same four quarters and it cut 5% of staff on 4 August, yet the price paid per dollar of its gross profit has gone from 4.68x in early May to 7.57x without a single earnings report in between. That gap gets tested on 26 August. Rackspace, shrinking under $2.79bn of debt, is no part of either story.
| Ticker | Company | Segment | Trend · 13mo | 30D | 1Y |
|---|---|---|---|---|---|
| The subject · what this brief is about | |||||
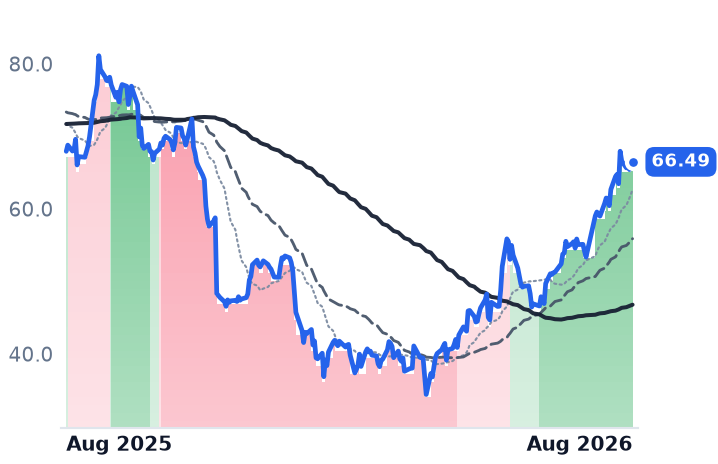
NTNX | Nutanix | Cloud Infrastructure & Platforms | 🌱 Emerging Bull | +24.6% | −2.1% |
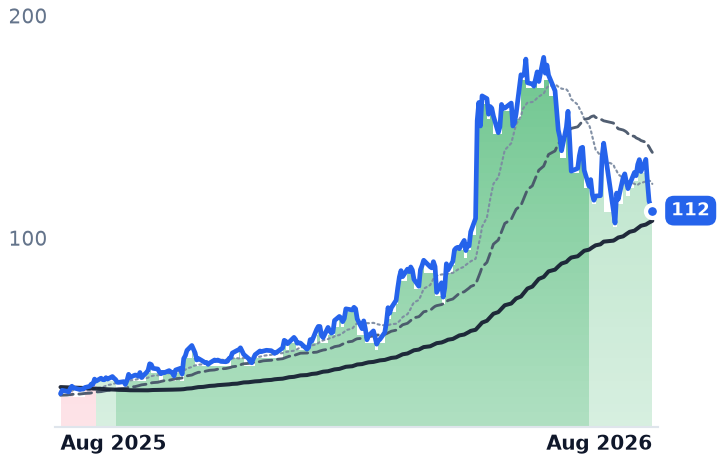
DOCN | DigitalOcean | Cloud Infrastructure & Platforms | 🟢 Cont. Bull | −21.3% | +274.6% |
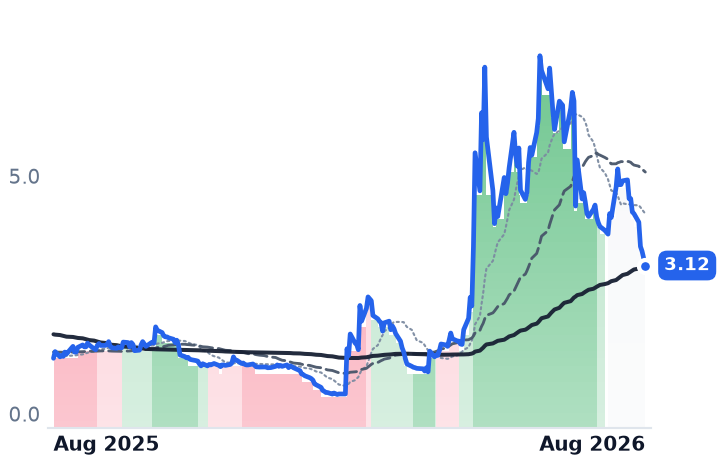
RXT | Rackspace Technology | Cloud Infrastructure & Platforms | 🌱 Emerging Bull | −24.6% | +166.7% |
| Compared against · context, not the story | |||||
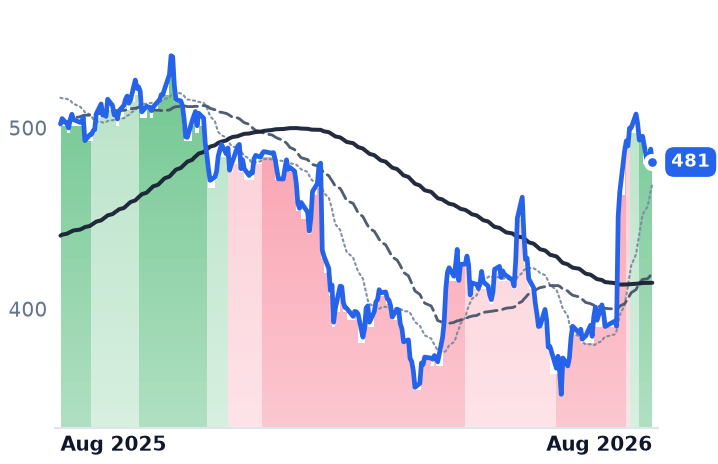
MSFT | Microsoft | Cloud Infrastructure & Platforms | 🔴 Cont. Bear | +23.3% | −4.2% |
ORCL | Oracle | Cloud Infrastructure & Platforms | 🔴 Cont. Bear | +15.6% | −37.1% |
TUYA | Tuya | Cloud Infrastructure & Platforms | 🔴 Cont. Bear | +0.9% | −24.2% |
CRWV | CoreWeave | Cloud GPU Computing | 🔴 Cont. Bear | +6.5% | −3.0% |
NBIS | Nebius | Cloud Infrastructure & AI | 🟢 Cont. Bull | +1.3% | +233.8% |
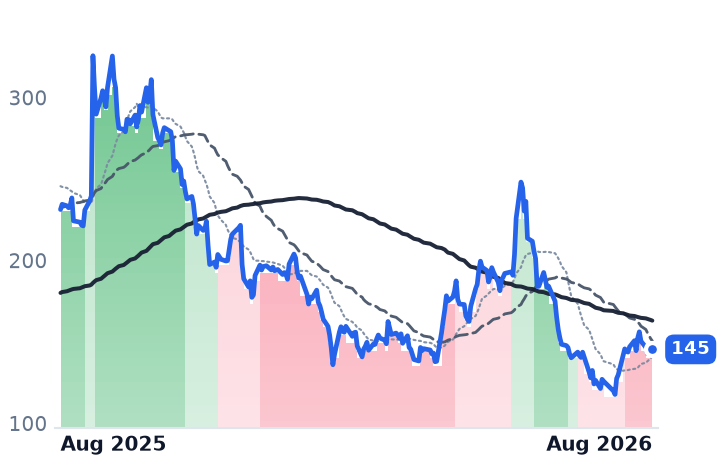
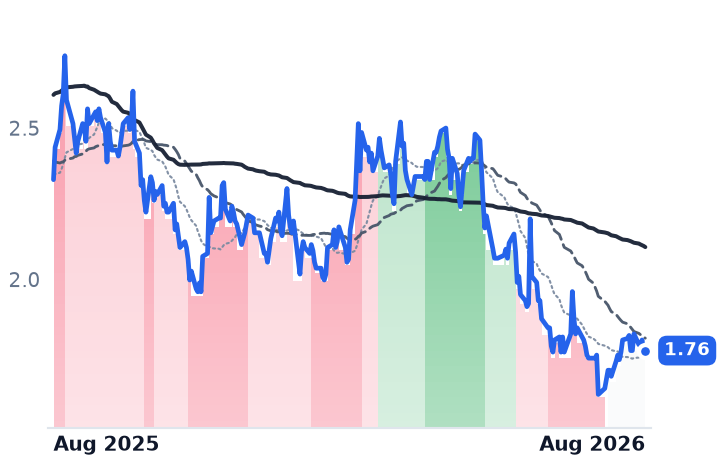
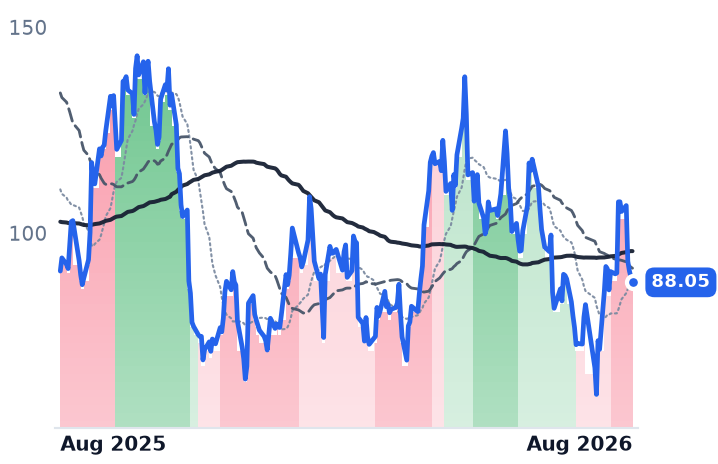
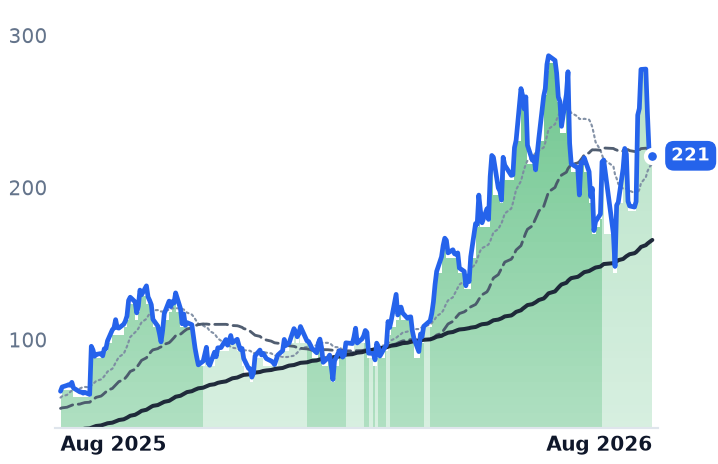
12-month price & trend
| Ticker | Mkt cap | P/E | P/E fwd | P/S | P/S fwd | P/GP | P/GP fwd | EV/EBITDA | FCF yld |
|---|---|---|---|---|---|---|---|---|---|
NTNX | $18.1B | 65.7x | 30.5x | 6.6x | 5.7x | 7.6x | 6.5x | 53.6x | 4.3% |
DOCN | $13.4B | 45.4x | 78.6x | 13.2x | 11.4x | 23.1x | 19.8x | 37.7x | 0.1% |
RXT | $835.5M | n/m | — | 0.3x | 0.3x | 2.2x | 2.4x | 13.7x | 4.9% |
| Ticker | Mkt cap | P/E | P/E fwd | P/S | P/S fwd | P/GP | P/GP fwd | EV/EBITDA | FCF yld |
|---|---|---|---|---|---|---|---|---|---|
MSFT | $3.7T | 27.5x | 25.2x | 11.1x | 9.4x | 16.3x | 13.9x | 18.2x | 1.8% |
ORCL | $433.0B | 25.3x | 18.7x | 6.4x | 4.8x | 9.8x | 7.3x | 17.4x | -5.5% |
TUYA | $1.1B | 17.7x | 15.5x | 3.4x | 3.1x | 7.1x | 6.5x | 3.3x | 4.7% |
| Ticker | Mkt cap | P/E | P/E fwd | P/S | P/S fwd | P/GP | P/GP fwd | EV/EBITDA | FCF yld |
|---|---|---|---|---|---|---|---|---|---|
CRWV | $46.6B | n/m | — | 7.5x | 3.7x | 10.8x | 5.3x | 25.7x | -22.8% |
NBIS | $45.6B | 56.0x | — | 51.9x | 13.5x | 108.3x | 28.2x | 32.8x | -5.4% |
Consensus projections
| Ticker | FY2026E | FY2027E | FY2028E | |
|---|---|---|---|---|
NTNX | Revenue | +12.2% | +12.9% | +12.6% |
| EPS | +11.0% | +14.1% | +15.9% | |
DOCN | Revenue | +31.2% | +53.5% | +43.7% |
| EPS | −29.0% | +23.2% | +60.4% | |
RXT | Revenue | −6.4% | +4.8% | +11.5% |
| EPS | +30.3% | −150.4% | +256.9% | |
MSFT | Revenue | +18.0% | +18.2% | +19.6% |
| EPS | +26.7% | +15.4% | +18.5% | |
ORCL | Revenue | +17.8% | +33.2% | +45.5% |
| EPS | +25.3% | +7.6% | +35.6% | |
TUYA | Revenue | +12.1% | +11.7% | +13.9% |
| EPS | −7.8% | +12.8% | +13.2% | |
CRWV | Revenue | +147.1% | +98.0% | +60.2% |
| EPS | +194.1% | −65.7% | −325.8% | |
NBIS | Revenue | +512.2% | +244.5% | +86.2% |
| EPS | +126.3% | +35.2% | −23.8% |
Forward fiscal years only. Blank means no analyst coverage for that year.
The week the cost of capital picked the winner
Investors spent last week re-sorting cloud companies by a question that had not mattered much before: who has to buy the hardware. On 18 August the 30-year US Treasury yield topped 5.33%, its highest since June 2007, driven by sticky inflation, deficit worry and a surge of corporate bond issuance from technology firms funding data centers. Operators that put graphics processing units (GPUs) on their own balance sheets were sold together — CoreWeave and Nebius among them. Nebius then fell again on a $4.5bn convertible note offering, new paper punished rather than applauded.
The three small companies in the rung of cloud below Amazon, Microsoft and Google split cleanly along that line, and not in the direction their results would suggest.
Nutanix: the multiple moved, the business did not
Nutanix sells the software layer of a private data center — virtualization, storage and networking bundled as the Acropolis stack, sold by subscription and run on servers the customer owns. Roughly 30,000 enterprises use it, and almost every new one arrives from VMware, whose pricing was overhauled after Broadcom bought it. Chief executive Rajiv Ramaswami says that migration wave "has years to run", with 500 to 1,000 new customers landing each quarter.
Because Nutanix owns no chips, its economics are the mirror image of a GPU landlord's: gross margin of 86.9%, and a trailing free-cash-flow yield of 4.25% against DigitalOcean's 0.11%. That is why it was flat in the week everything levered broke.
The difficulty is what has happened to the price in the absence of news. Revenue growth has decelerated four quarters running — 19.2%, then 13.5%, then 10.4%, then 10.0% on $703.1m in the February-to-April quarter. On 4 August the company told the Securities and Exchange Commission it would cut about 5% of its workforce, some 390 jobs, at a pre-tax cost of $33m to $43m. The genuine offset is operating leverage: operating income rose 51% year over year, lifting operating margin to 10.4% from 7.6%.
Against that, the shares have re-rated hard. The price paid per dollar of trailing gross profit was 4.68x on 3 May and is 7.57x today — a 62% expansion with no financial disclosure since the third-quarter report on 27 May, which showed annual recurring revenue of $2.43bn, up 15%. Forward earnings are capitalized at 30.5x while consensus has revenue growing 12.9% next fiscal year. Nutanix reports fourth-quarter and full-year results after the close on 26 August.
DigitalOcean: the numbers accelerated and the shares fell anyway
DigitalOcean rents computing by the hour to individual developers, start-ups and small businesses, on flat published prices, with 1,462 employees. Its June-quarter revenue reached $281.2m, a fourth consecutive acceleration to 28.6% growth. Annual recurring revenue from artificial-intelligence customers rose 212% to $234m, with inference — running trained models, not building them — now more than 70% of it. Remaining performance obligations, the contracted revenue not yet delivered, went to $894m from $71m a year earlier after the company signed its first nine-figure annual commitment, stretching average contract life past three years from 1.6.
The debit is on the cost line, and it is the whole argument. Gross margin has fallen every quarter for five, to 55.0% from 61.4%, because data-center expansion lifts depreciation and colocation costs months before those facilities earn anything. So gross profit grew 18.1% while revenue grew 28.6%, and reported operating income fell 17.5%. Management also cut its adjusted free-cash-flow margin guide to 11-13%. With roughly 155 megawatts of committed capacity against CoreWeave's more than a gigawatt, DigitalOcean cannot compete for training work and is betting on inference price-performance instead.
The shares ran to $135.40 on 17 August, nine trading days after the beat, then fell four straight sessions on rising volume. That has taken the price per dollar of trailing gross profit from 26.0x to about 22.7x. It still costs three times Nutanix on that measure while its gross profit compounds less than twice as fast.
Rackspace: the control, and not an AI story
Rackspace manages public and private cloud for enterprises from San Antonio. Second-quarter revenue was $670m, up 1%, with a $68m net loss, $2.79bn of debt and $202m of liquidity against an $836m equity value. Gross margin improved to 19.4% from 13.7%, and the loss widened anyway. On 9 July the company cut full-year revenue guidance by $150m and announced a $250m equity offering; the stock fell 33.6% that day. Its 179% twelve-month gain is a bounce off $1.17, and it has round-tripped. Consensus has revenue down 6.4% this year — the only one of the three pointing lower.
What would make Nutanix's price right
There is a real mechanism underneath the repatriation case. An enterprise survey commissioned by Cloudian found the share of companies using public cloud as their primary home for production inference fell to 41% from 56% in a year, with 56% now running or planning private-cloud inference on cost, latency and data-sovereignty grounds. Nutanix has shipped bare-metal Kubernetes aimed at GPU density to catch exactly that work. None of it is yet visible in the disclosed growth rate, which remains a VMware replacement story running at 10%.
The setup
Where it stands — Nutanix has re-rated 62% since early May on no new results; DigitalOcean has de-rated while every operating metric improved except margin.
Would confirm — Nutanix fiscal-fourth-quarter revenue growth above 12% with fiscal-2027 guidance ahead of the $3.20bn consensus.
Would invalidate — Growth printing near 10% again on 26 August, or DigitalOcean's gross margin falling below 55% next quarter.
Watch next — Nutanix reports after the US close on Wednesday 26 August; DigitalOcean guided the September quarter to $304-307m.
Valuation — Nutanix: 7.57x trailing and 6.50x forward gross profit, against 4.68x on 3 May; DigitalOcean 23.1x trailing, 19.9x forward.