

Oracle and DigitalOcean Are Paying a Gross-Margin Tax That Microsoft and Nutanix Aren't
Hypothesis Opus 5 · Research Opus 5 · Writing Opus 5 · Prompt v1.4
Six companies that rent computing capacity have gained about 11% in a month, and the number hides a split that matters more than the average. The ones renting out graphics chips are losing margin faster than they add revenue; the ones selling software licences are not.
DigitalOcean's June-quarter revenue grew 28.6%, its fastest in years, but gross profit rose only 18.1% and gross margin fell to 55.0% from 59.9%. Oracle shows the identical shape at scale: revenue up 20.6%, gross profit up 12.0%, gross margin down five points in a year and free cash flow negative. Microsoft's gross margin slipped 1.4 points; Nutanix held 86.9% and grew operating income 51%.
The monthly gain is also arithmetic: Microsoft and Nutanix supply 71% of it, Rackspace fell, and over three months four of the six are down.
| Ticker | Company | Segment | Trend · 13mo | 30D | 1Y |
|---|---|---|---|---|---|
| The subject · what this brief is about | |||||
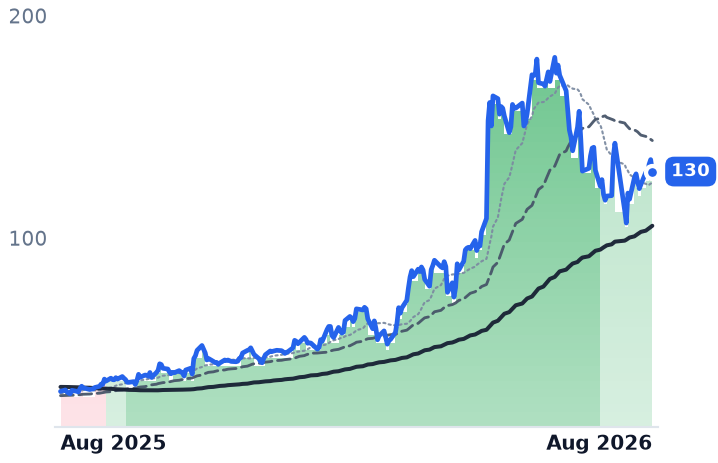
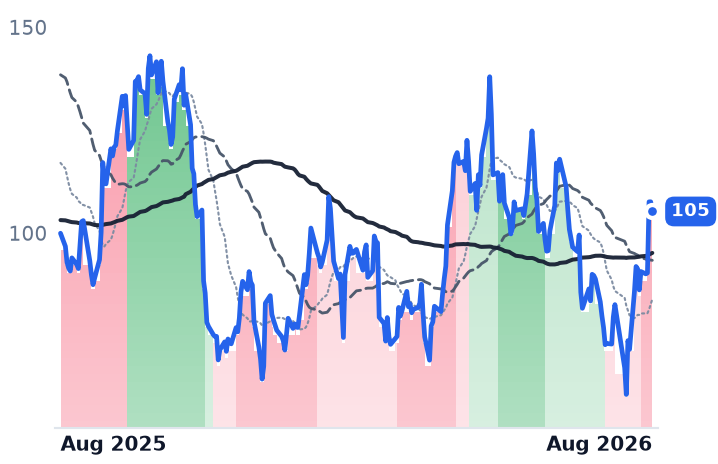
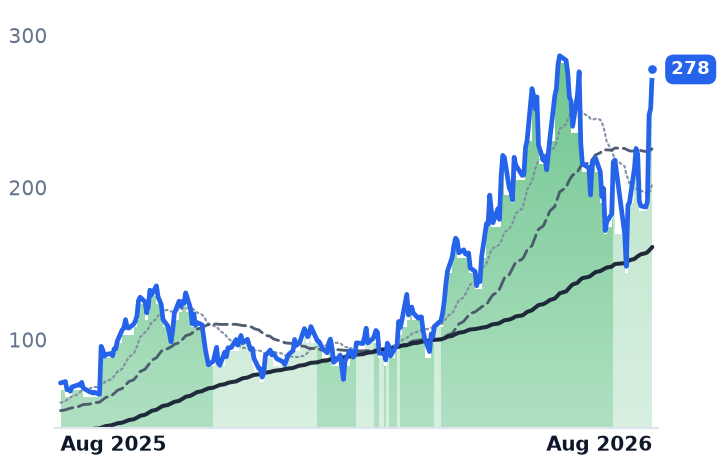
DOCN | DigitalOcean | Cloud Infrastructure & Platforms | 🟢 Cont. Bull | +11.0% | +318.6% |
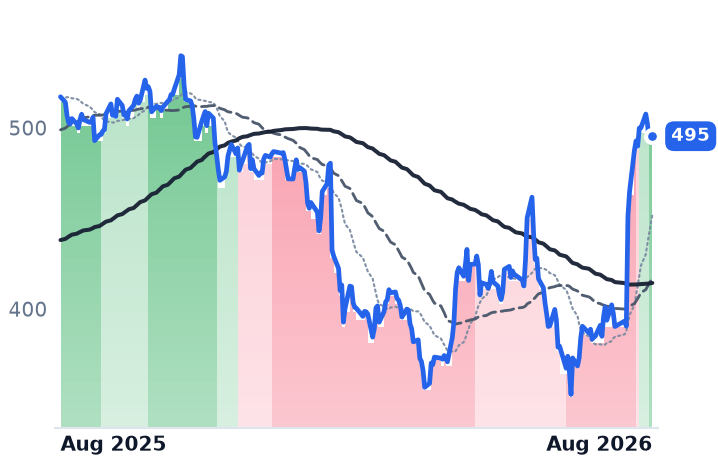
MSFT | Microsoft | Cloud Infrastructure & Platforms | 🔴 Cont. Bear | +23.5% | −4.2% |
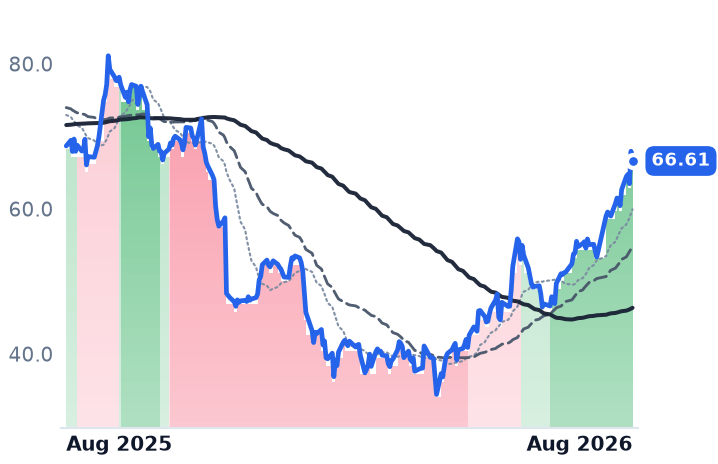
NTNX | Nutanix | Cloud Infrastructure & Platforms | 🌱 Emerging Bull | +19.3% | −3.0% |
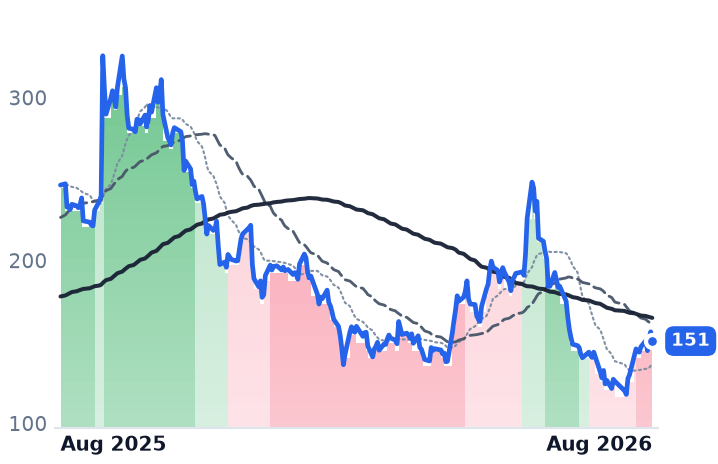
ORCL | Oracle | Cloud Infrastructure & Platforms | 🔴 Cont. Bear | +21.2% | −38.9% |
RXT | Rackspace Technology | Cloud Infrastructure & Platforms | 🌱 Emerging Bull | +0.0% | +259.8% |
TUYA | Tuya | Cloud Infrastructure & Platforms | 🔴 Cont. Bear | +4.0% | −21.5% |
| Compared against · context, not the story | |||||
AMD | Advanced Micro Devices | AI & Data Center GPUs | 🟢 Cont. Bull | +2.7% | +189.8% |
AVGO | Broadcom | Semiconductor Subsystems | 🟢 Cont. Bull | +5.0% | +29.0% |
CRWV | CoreWeave | Cloud GPU Computing | 🔴 Cont. Bear | +44.4% | +5.3% |
NBIS | Nebius | Cloud Infrastructure & AI | 🟢 Cont. Bull | +61.7% | +287.7% |
12-month price & trend
| Ticker | Mkt cap | P/E | P/E fwd | P/S | P/S fwd | P/GP | P/GP fwd | EV/EBITDA | FCF yld |
|---|---|---|---|---|---|---|---|---|---|
DOCN | $15.2B | 51.6x | 89.4x | 15.0x | 12.9x | 26.3x | 22.6x | 42.6x | 0.1% |
MSFT | $3.7T | 27.5x | 25.2x | 11.1x | 9.4x | 16.3x | 13.9x | 18.2x | 1.8% |
NTNX | $18.0B | 65.3x | 30.4x | 6.5x | 5.6x | 7.5x | 6.5x | 53.3x | 4.3% |
| Ticker | Mkt cap | P/E | P/E fwd | P/S | P/S fwd | P/GP | P/GP fwd | EV/EBITDA | FCF yld |
|---|---|---|---|---|---|---|---|---|---|
ORCL | $433.0B | 25.3x | 18.7x | 6.4x | 4.8x | 9.8x | 7.3x | 17.4x | -5.5% |
RXT | $1.1B | n/m | — | 0.4x | 0.4x | 2.9x | 3.1x | 14.5x | 3.8% |
TUYA | $1.1B | 17.7x | 15.5x | 3.4x | 3.1x | 7.1x | 6.5x | 3.3x | 4.7% |
| Ticker | Mkt cap | P/E | P/E fwd | P/S | P/S fwd | P/GP | P/GP fwd | EV/EBITDA | FCF yld |
|---|---|---|---|---|---|---|---|---|---|
AMD | $838.8B | 130.6x | 67.7x | 20.3x | 16.4x | 38.2x | 30.9x | 78.2x | 1.0% |
AVGO | $1.9T | 63.5x | 33.9x | 24.8x | 17.7x | 37.0x | 26.4x | 45.6x | 1.8% |
CRWV | $46.6B | n/m | — | 7.5x | 3.7x | 10.8x | 5.3x | 25.7x | -22.8% |
| Ticker | Mkt cap | P/E | P/E fwd | P/S | P/S fwd | P/GP | P/GP fwd | EV/EBITDA | FCF yld |
|---|---|---|---|---|---|---|---|---|---|
NBIS | $45.6B | 56.0x | — | 51.9x | 13.5x | 108.3x | 28.2x | 32.8x | -5.4% |
Consensus projections
| Ticker | FY2026E | FY2027E | FY2028E | |
|---|---|---|---|---|
DOCN | Revenue | +31.2% | +53.5% | +43.7% |
| EPS | −29.0% | +23.2% | +60.4% | |
MSFT | Revenue | +18.0% | +18.2% | +19.6% |
| EPS | +26.7% | +15.4% | +18.5% | |
NTNX | Revenue | +12.1% | +12.8% | +12.5% |
| EPS | +10.9% | +13.6% | +16.3% | |
ORCL | Revenue | +17.8% | +33.2% | +45.5% |
| EPS | +25.3% | +7.6% | +35.6% | |
RXT | Revenue | −6.6% | +4.4% | +8.4% |
| EPS | −11.9% | −194.9% | +167.0% | |
TUYA | Revenue | +12.1% | +11.7% | +13.9% |
| EPS | −7.8% | +12.8% | +13.2% | |
AMD | Revenue | +49.6% | +68.8% | +37.0% |
| EPS | +91.9% | +98.7% | +42.7% | |
AVGO | Revenue | +66.6% | +65.5% | +33.9% |
| EPS | +71.7% | +68.7% | +33.7% | |
CRWV | Revenue | +147.1% | +98.0% | +60.2% |
| EPS | +194.1% | −65.7% | −325.8% | |
NBIS | Revenue | +512.2% | +244.5% | +86.2% |
| EPS | +126.3% | +35.2% | −23.8% |
Forward fiscal years only. Blank means no analyst coverage for that year.
DigitalOcean, which rents cloud servers, storage and managed databases to individual developers and small businesses, told investors on 4 August that June-quarter revenue reached $281m, its fastest growth in years, and raised its full-year forecast to $1.17–1.18bn. The same statement carried a less flattering line. Gross margin was 55.0%, down from 59.9% a year earlier, and GAAP operating income fell 17.5% to $29.4m.
That combination — revenue accelerating while the profit on each dollar of it shrinks — is the single most important thing happening across the companies that rent out computing capacity rather than sell the hardware it runs on. It separates them cleanly into two groups, and it is invisible in the 13% one-month gain that the group as a whole shows.
The cost of renting graphics chips
DigitalOcean's growth is real and it is being bought. Revenue has accelerated four quarters running, from 15.7% to 28.6%. Annual recurring revenue from artificial-intelligence customers rose 212% to $234m, incremental ARR hit a record $93m, and remaining performance obligations — contracted revenue not yet recognized — jumped to $894m from $71m as the company signed its first nine-figure commitments and stretched average contract life past three years. The cost is depreciation: it rose to $51m from $33m as capacity came online, which is why operating income fell while sales grew.
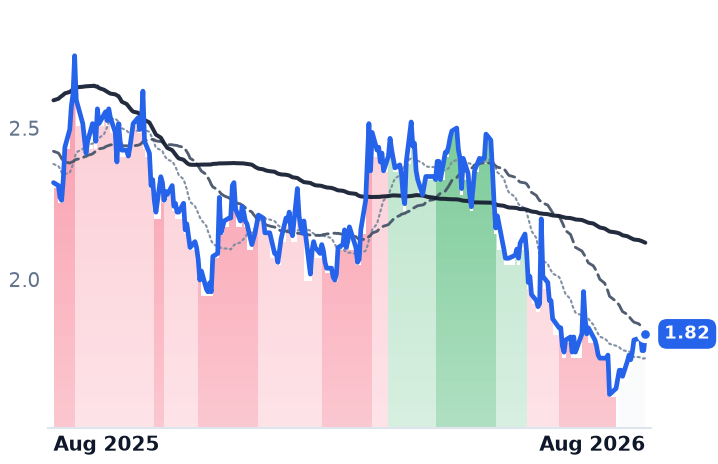
Oracle, which sells databases and enterprise applications alongside its Oracle Cloud Infrastructure rental business, is the same picture with two more zeros. Its May-quarter revenue grew 20.6% but gross profit only 12.0%, and gross margin has fallen five percentage points in a year, to 65.2%. Trailing free cash flow yield is minus 5.5%, the only negative figure in the group. Consensus has Oracle's fiscal-2027 revenue rising 33.2% to $89.6bn with earnings per share up just 7.6%. The shares are down roughly 29% this year as the company added $40bn of debt and equity funding against a 162% capex increase, with S&P expecting leverage near 4.5x — above the level consistent with its rating.
The two that escape it
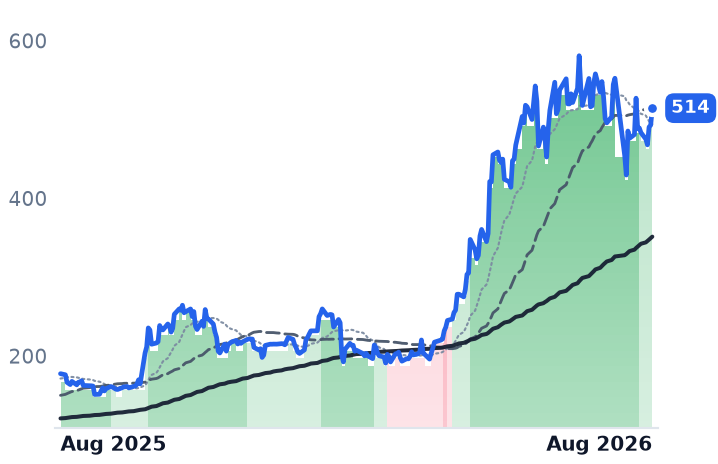
Microsoft rents compute too, but it sells software on top of it. Its gross margin fell 1.4 points last quarter and operating income grew slightly faster than revenue, up 18.3%. Azure grew 43%, its best since 2022, and the shares jumped 15.5% the next day — largely because finance chief Amy Hood left the capital-spending forecast unchanged while rivals raised theirs. Even after that, Microsoft sits 5.2% below where it traded a year ago.
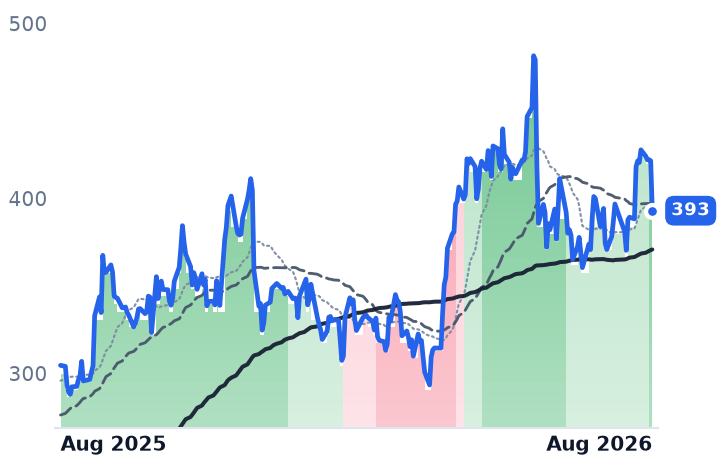
Nutanix, which licenses per-node software that bundles virtualization, storage and networking for enterprise data centers, has no chips to depreciate. Gross margin held at 86.9% and operating income grew 51% on 10% revenue growth. But its top line has decelerated three quarters running, from 13.5% to 10.0%, roughly half the 18.1% it managed in fiscal 2025. Annual recurring revenue is still compounding at 24%, to $1.82bn, on more than 700 new customers in a quarter, mostly migrating off Broadcom-owned VMware. The stock has risen 43.7% in three months without a single new disclosure — its last results were reported on 27 May.
The average is mostly one company
Equal-weighted, the six names gained about 11% in the month to 14 August. Microsoft and Nutanix supplied 71% of it. Rackspace, a managed multi-cloud services provider, fell 5.4%. Stretch to three months and four of six are down, for an average of minus 3.7%. Microsoft is 88.7% of the group's combined $4.15trn of market value; the three small caps are 0.8%.
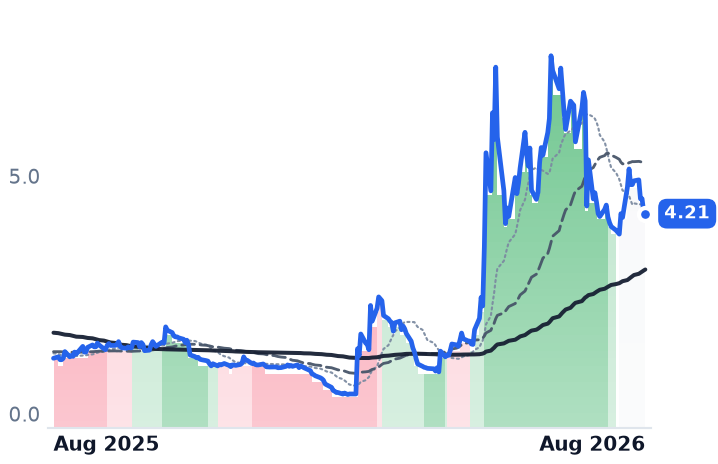
Rackspace is a separate story dressed as the same one. Its shares went from $0.42 to $4.21 in six months after a June agreement with AMD to deploy an initial 30 megawatts of AI compute. Revenue was flat at $666m last quarter, the net loss was $67.5m, and it carries $2.79bn of debt against $2.75bn of assets. Gross margin improving to 19.4% from 13.7% is the one line moving the right way. Tuya, a Chinese platform for smart-device makers and the only member not renting general-purpose compute, grew 8.6% and trades at 15.5x forward earnings.
What the price already assumes
DigitalOcean is the most expensive name here by a distance: 15.0x trailing and 12.9x forward sales, against 6.5x for Nutanix, which itself was near 3.9x in May. Its forward price/earnings ratio of 89.4x sits above its trailing 51.6x, because consensus expects GAAP net income to fall 17.8% this year to $178m even as revenue rises 31.2%. The shares fell 16% over three months, including a 21% drawdown in four sessions in late July around a $472m convertible-note repurchase funded by stock sold at $117.54. Analysts remain split: Citi lifted its target to $190 while UBS cut to $140.
The setup
Where it stands — The businesses renting graphics chips are growing fast and converting less of it; the software-licensing names are not paying that cost.
Would confirm — DigitalOcean's gross margin falls below 55% again in the September quarter as depreciation scales further.
Would invalidate — Gross margin stabilizes near 55% while revenue growth holds above 30%, showing the capacity build has front-loaded its cost.
Watch next — DigitalOcean's third-quarter results, due early November, against a guided fourth-quarter exit rate above 35%.
Valuation — DigitalOcean at 15.0x trailing and 12.9x forward sales; Nutanix 6.5x against 3.9x in May; Oracle 18.7x forward earnings.