

Seventy Product Tankers Moved Into Crude; Hafnia's Third Quarter Is Booked 30% Lower
Hypothesis Opus 5 · Research Opus 5 · Writing Opus 5 · Prompt v1.6
Hafnia's delayed second quarter landed on 28 August with net profit of $277.8m against $75.3m a year earlier — its best quarter since 2022 — alongside forward bookings that say the current quarter will be materially worse. Its shares have risen 27.9% in thirty days regardless.
The tanker rally of the past year is being read as a freight boom. The fixture books say it is a crude boom. Okeanis has nearly half its third-quarter very large crude carrier days booked at $206,600 a day, flat against the $213,600 it just realized, while Ardmore's medium-range guide sits about 43% below the $51,900 its ships earned in the second quarter.
The cause is not weak fuel demand — refining margins widened — but a Hormuz closure that pays crude several times what it pays clean cargo, and that has pulled large product carriers out of the clean trade entirely.
| Ticker | Company | Segment | Trend · 13mo | 30D | 1Y |
|---|---|---|---|---|---|
| The subject · what this brief is about | |||||
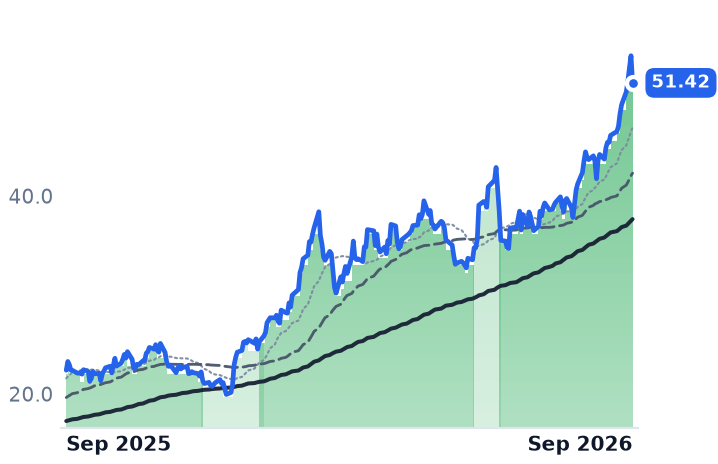
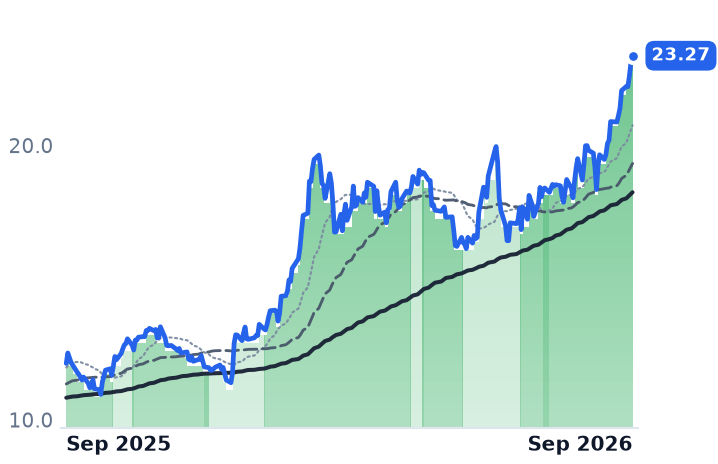
HAFN | Hafnia | Oil & Chemical Tankers | 🟢 Cont. Bull | +24.0% | +77.6% |
ASC | Ardmore Shipping | Oil & Chemical Tankers | 🟢 Cont. Bull | +3.5% | +52.8% |
ECO | Okeanis Eco Tankers | Oil & Chemical Tankers | 🟢 Cont. Bull | +31.3% | +195.2% |
| Compared against · context, not the story | |||||
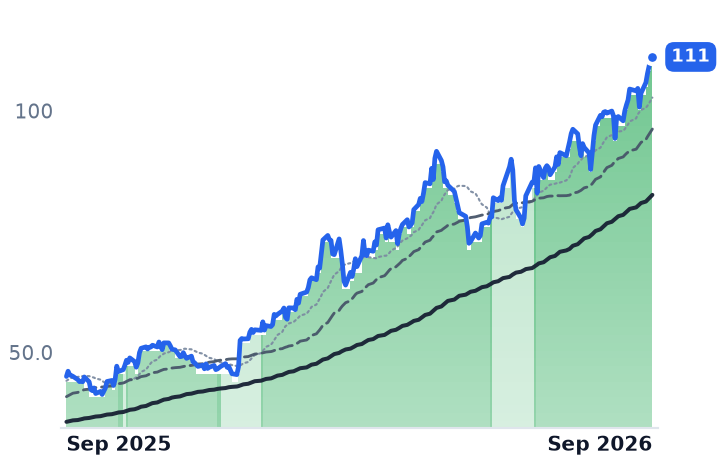
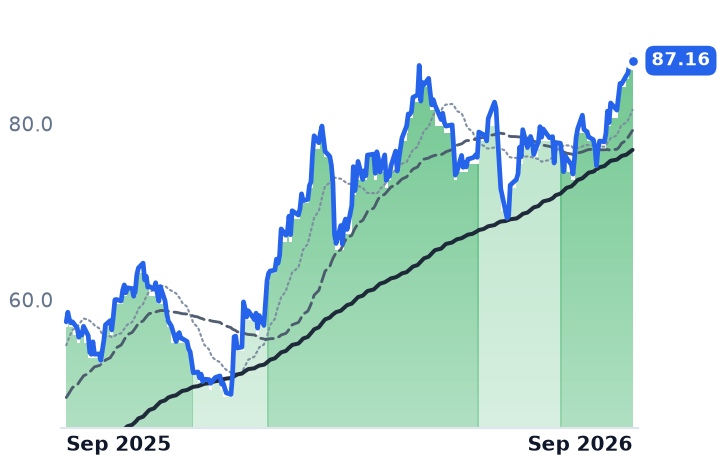
NAT | Nordic American Tankers | Oil & Chemical Tankers | 🟢 Cont. Bull | +18.4% | +163.4% |
FRO | Frontline | Marine Crude & Product Tankers | 🟢 Cont. Bull | +17.7% | +129.6% |
DHT | DHT | Marine Crude & Product Tankers | 🟢 Cont. Bull | +17.4% | +93.0% |
INSW | International Seaways | Marine Crude & Product Tankers | 🟢 Cont. Bull | +11.7% | +146.9% |
STNG | Scorpio Tankers | Marine Crude & Product Tankers | 🟢 Cont. Bull | +11.0% | +51.6% |
TRMD | TORM | Marine Crude & Product Tankers | 🟢 Cont. Bull | +20.2% | +81.7% |
MPC | Marathon Petroleum | Integrated Refiners | 🟢 Cont. Bull | +17.8% | +129.2% |
VLO | Valero Energy | Integrated Refiners | 🟢 Cont. Bull | +18.5% | +151.4% |
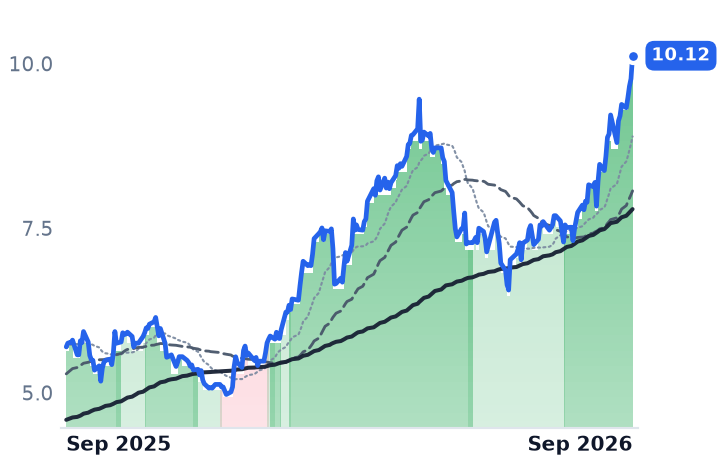
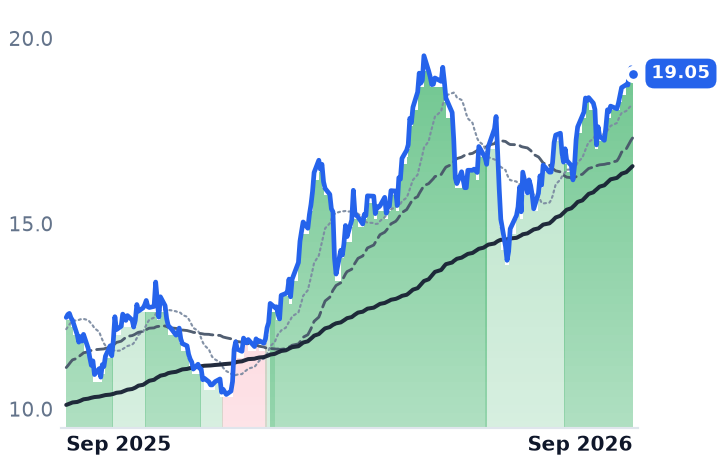
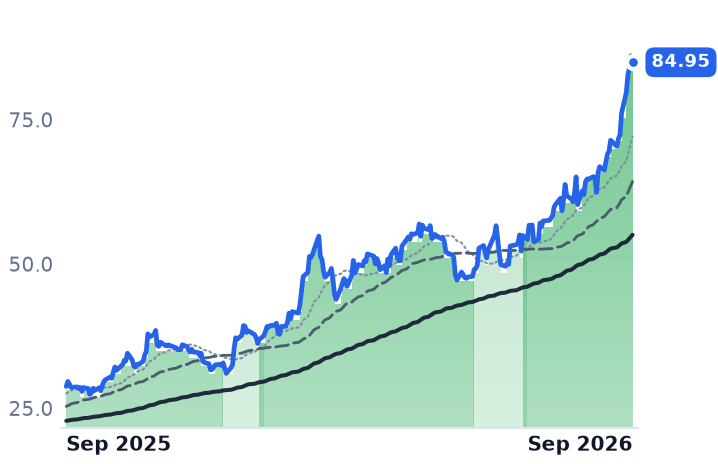
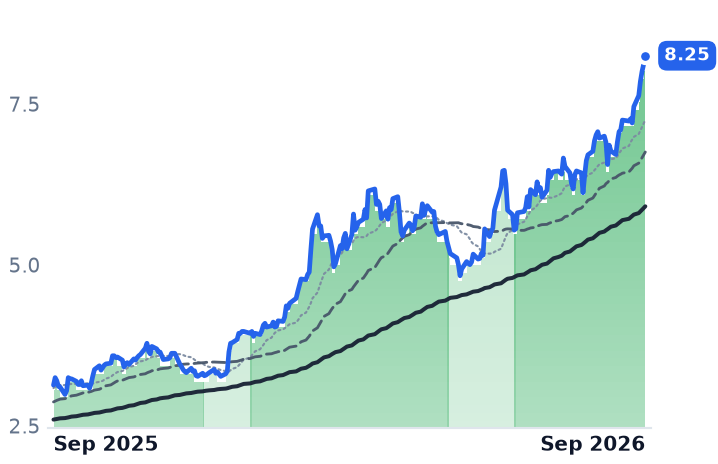
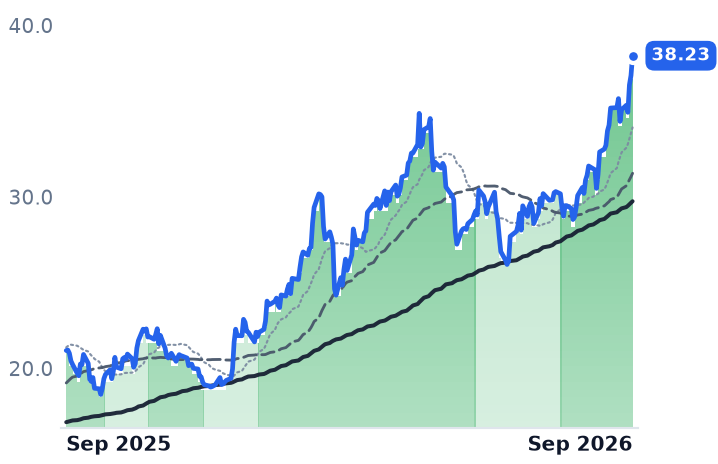
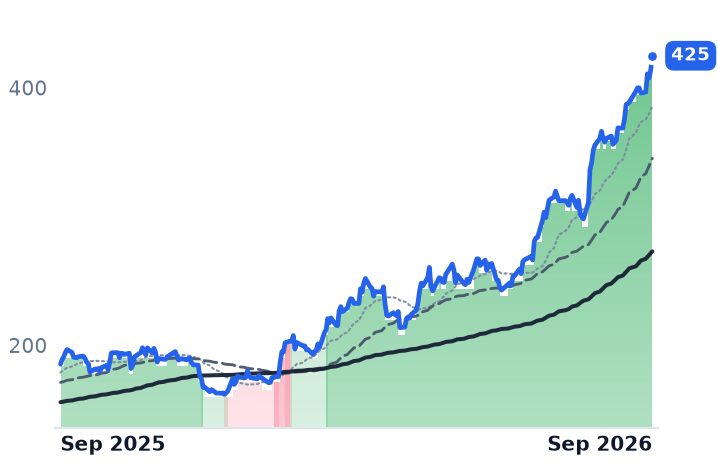
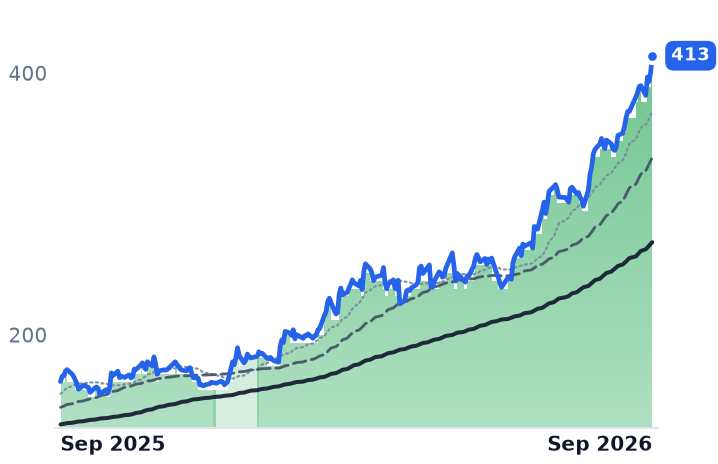
12-month price & trend
| Ticker | Mkt cap | P/E | P/E fwd | P/S | P/S fwd | P/GP | P/GP fwd | EV/EBITDA | FCF yld |
|---|---|---|---|---|---|---|---|---|---|
HAFN | $5.1B | 7.8x | 7.0x | 1.9x | 3.9x | 8.1x | 16.6x | 6.8x | 10.8% |
ASC | $777.3M | 7.4x | 6.6x | 2.1x | 2.8x | 5.6x | 7.5x | 5.2x | 1.7% |
ECO | $2.8B | 8.0x | 4.9x | 4.6x | 3.3x | 7.0x | 5.0x | 7.7x | 1.3% |
| Ticker | Mkt cap | P/E | P/E fwd | P/S | P/S fwd | P/GP | P/GP fwd | EV/EBITDA | FCF yld |
|---|---|---|---|---|---|---|---|---|---|
NAT | $1.7B | 14.0x | 9.1x | 4.6x | 5.3x | 12.2x | 13.9x | 11.1x | 6.8% |
FRO | $8.2B | 21.5x | 5.6x | 4.2x | 3.9x | 12.7x | 12.0x | 11.6x | 8.2% |
DHT | $2.8B | 8.6x | 6.0x | 5.0x | 4.2x | 10.6x | 8.8x | 7.2x | -4.6% |
| Ticker | Mkt cap | P/E | P/E fwd | P/S | P/S fwd | P/GP | P/GP fwd | EV/EBITDA | FCF yld |
|---|---|---|---|---|---|---|---|---|---|
INSW | $4.2B | 7.7x | 6.9x | 4.2x | 3.5x | 7.7x | 6.4x | 6.5x | 2.9% |
STNG | $4.3B | 7.7x | 6.5x | 4.1x | 3.6x | 7.9x | 6.9x | 6.5x | 11.2% |
TRMD | $3.3B | 9.7x | 4.5x | 2.4x | 2.3x | 5.9x | 5.7x | 6.7x | 2.4% |
| Ticker | Mkt cap | P/E | P/E fwd | P/S | P/S fwd | P/GP | P/GP fwd | EV/EBITDA | FCF yld |
|---|---|---|---|---|---|---|---|---|---|
MPC | $120.8B | 14.2x | 7.4x | 0.8x | 0.7x | 6.8x | 5.9x | 8.4x | 10.7% |
VLO | $116.1B | 16.7x | 8.6x | 0.9x | 0.8x | 7.7x | 6.8x | 9.0x | 8.7% |
Consensus projections
| Ticker | FY2026E | FY2027E | FY2028E | |
|---|---|---|---|---|
HAFN | Revenue | +31.2% | −17.7% | −16.3% |
| EPS | +112.5% | −35.6% | −25.1% | |
ASC | Revenue | +37.7% | −20.6% | −13.9% |
| EPS | +184.0% | −42.5% | −32.1% | |
ECO | Revenue | +217.7% | −35.9% | −29.0% |
| EPS | +382.5% | −50.0% | −36.0% | |
NAT | Revenue | +65.7% | −2.1% | −36.6% |
| EPS | +700.0% | −37.8% | −70.5% | |
FRO | Revenue | +66.6% | −25.9% | −8.0% |
| EPS | +263.1% | −48.1% | −16.9% | |
DHT | Revenue | +85.5% | −24.2% | −6.3% |
| EPS | +187.1% | −37.8% | −9.5% | |
INSW | Revenue | +46.7% | −24.4% | −7.8% |
| EPS | +136.4% | −46.3% | −5.7% | |
STNG | Revenue | +31.6% | −24.9% | −2.2% |
| EPS | +133.7% | −47.7% | −5.7% | |
TRMD | Revenue | +55.7% | −29.8% | −14.8% |
| EPS | +165.5% | −48.5% | −38.2% | |
MPC | Revenue | +31.9% | −8.6% | −2.0% |
| EPS | +479.5% | −23.6% | −45.7% | |
VLO | Revenue | +25.0% | −12.9% | −12.1% |
| EPS | +367.5% | −18.8% | −30.7% |
Forward fiscal years only. Blank means no analyst coverage for that year.
Hafnia reported its delayed second quarter on 28 August. Net profit reached $277.8m against $75.3m a year earlier, the strongest quarter since 2022 for a Bermuda-based owner that runs roughly 200 product tankers — long-range, medium-range and handysize ships moving refined fuels, vegetable oils and chemicals for majors and traders. In mid-August Hafnia had been the odd name in the tanker complex, down 10.5% over three months while its margins widened. The quarter that explained the gap has now arrived, and the shares are up 27.9% in thirty days.
Buried in the same disclosure is a colder number. Hafnia has 80% of its third-quarter operating days already fixed at $30,716 a day, against the $44,093 its fleet actually earned in the quarter being reported — a booked step down of about 30%. Ardmore Shipping, which owns mid-size product and chemical tankers and employs 56 people, guided the same direction: roughly 45% of third-quarter medium-range days fixed near $29,600, some 43% below the $51,900 those ships earned in the second quarter. Okeanis Eco Tankers, a Piraeus owner of scrubber-fitted very large crude carriers and Suezmaxes with 14 employees, guided the other way: 48% of third-quarter crude-carrier days booked at $206,600, essentially level with the $213,600 realized.
Why one crisis pays crude and not clean
The Strait of Hormuz has been effectively shut to commercial traffic since early March, running roughly 5 to 11 transits a day against about 125 before the war, with war-risk premiums at forty times pre-crisis levels. "We are still experiencing disruptions to Gulf flows and rising tensions have reestablished the Red Sea chokepoints, dislocating oil flows across the world," Mikael Skov, then Hafnia's chief executive, told investors on the 28 August call.
The dislocation is not evenly paid. A long-range clean benchmark has run near $70,000 a day against about $50,000 before the crisis, a 40% uplift, while crude carriers earned between $175,000 and $451,000 a day across 2026. Because crude aframax earnings overtook clean long-range earnings, a record number of large product carriers switched to dirty cargoes — about 70 fewer available to the clean trade than at the start of the year — and the cross-basin share of long-haul clean exports fell to 28.9% from 31.7%. Clean tonnage got scarcer and its voyages got shorter at once.
Cargo demand is not the culprit. Marathon Petroleum's June-quarter gross margin widened to 17.2% from 8.8%, and the Atlantic basin entered the year having permanently closed almost 800,000 barrels a day of refining capacity. The barrels still need moving. The ships that move them are simply worth more carrying crude.
What a day at sea costs
The operating leverage is why these numbers matter so much. Ardmore's medium-range ships carry an operating cash breakeven of $10,800 a day, or $11,700 including pro-rata dry-docking — nearly a third of what they earned last quarter, and every dollar above it lands almost whole in cash. Ardmore's second-quarter net income of $60.5m exceeded all of 2025's $41.0m, on revenue up 61.3% and an operating margin of 42.8% against 14.5%. It is also the cleanest asset test in the group at 1.11x book, 6.58x forward against 7.36x trailing — and on 27 August it exercised options for two more handysize newbuildings, taking its programme to six ships worth about $269m.
Okeanis is the mirror. Revenue rose 239% year on year with gross margin at 76.7% from 46.3%, and it pays an annual dividend of $9.55 a share, a yield near 12.8%, which is why its free-cash-flow yield reads 1.3%. At $84.95 it trades on 3.82x book — more than triple Ardmore's — against broker net asset value estimates in the mid-to-high $40s, and its 4.89x forward earnings rests on consensus 2026 earnings of $17.38 a share that fall to $8.70 in 2027, or about 9.8x.
The verdict the fixture books deliver
Over twelve months the crude names ran and the clean names trailed: Okeanis returned 189.7% and Nordic American Tankers 157.8%, against 73.1% for Hafnia and 45.7% for Ardmore. This was never a product-ton-mile repricing. It was a crude repricing that lifted clean rates as a by-product and is now withdrawing that lift.
Which leaves Hafnia's month. Its forward book does not pay for a 27.9% advance; the likelier reading is a delayed quarter catching up to the rest of the group, helped by a $250m distribution at a 90% payout, the eighteenth consecutive quarterly dividend, with the gain achieved through ex-dividend dates of 7 and 8 September. At $10.12 the shares now sit above the company's own published net asset value of $8.89, where in August they sat below it. Ardmore, whose guide is the weakest of the three, rose 3.6% in the same thirty days — the market appears to be reading the same books.
Hafnia's management names the risk itself: a full reopening of Hormuz and the Red Sea erases the ship-to-ship transfers and extended ballast legs that manufacture today's ton-miles. On that day the crude rate breaks first, and the seventy product carriers now hauling crude sail home to a clean market that lost its rate while they were away.