

AI-Boom Chip and Software Stocks Retreat in Rough Proportion to How Far They Ran
Hypothesis Opus 5 · Research Sonnet 5 · Writing Sonnet 5 · Prompt v1.1
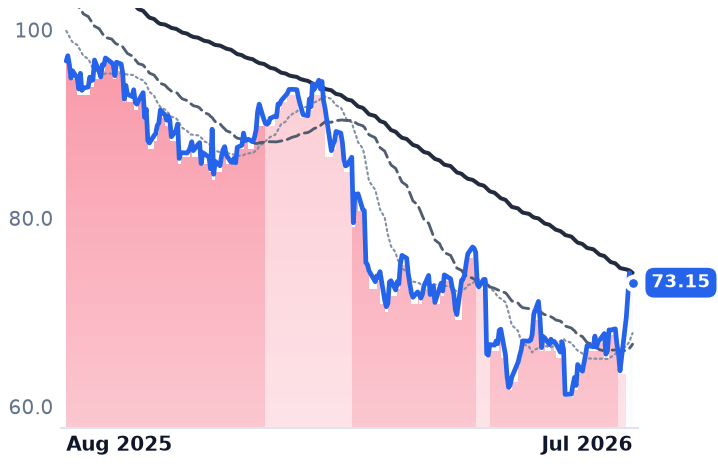
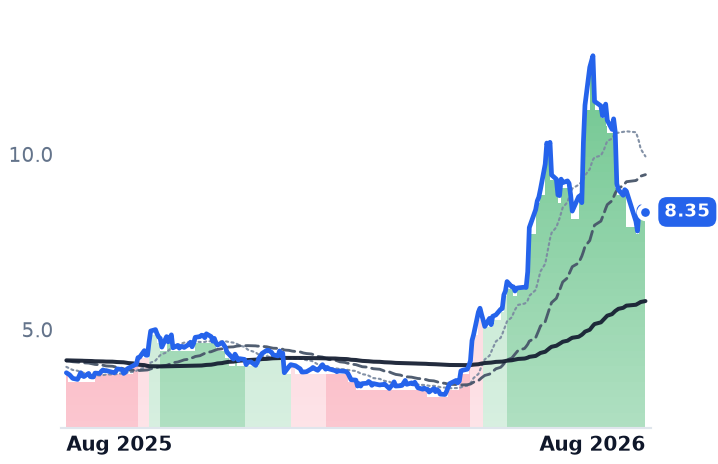
A band of chip, optical-component and communications-software stocks that led the market's rally over the past year — some up 250% to 850% — have given back 20% to 47% in the past 30 days, while previously lagging IT-services and identity-security names bounced. Guidance and backlog held up at most of the hardware leaders, but Corning and Accenture both cut forecasts, showing the pullback is a mix of position-unwinding and two real fundamental cracks, not one single story.
| Ticker | Company | Segment | Trend | 30D | 1Y |
|---|---|---|---|---|---|
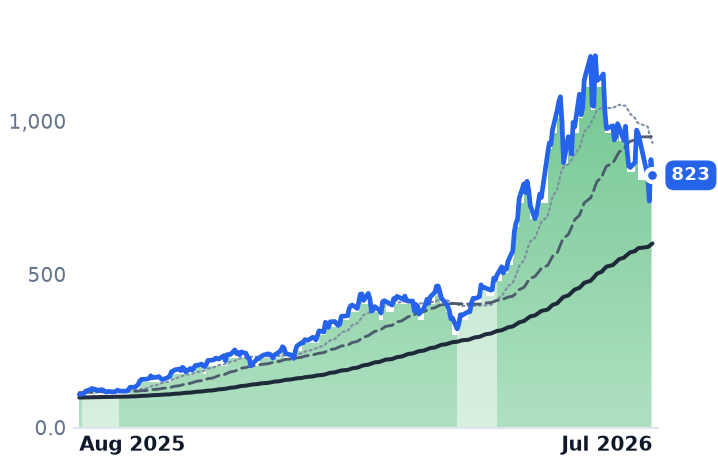
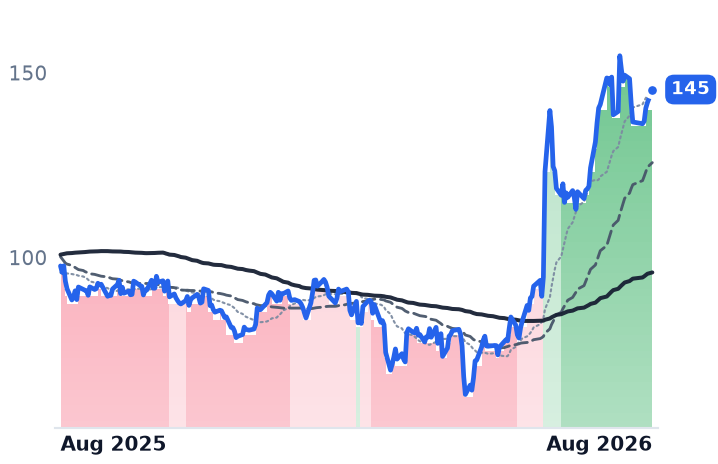
MU | Micron Technology | Memory (DRAM/NAND) | 🟢 Cont. Bull | −16.4% | +664.8% |
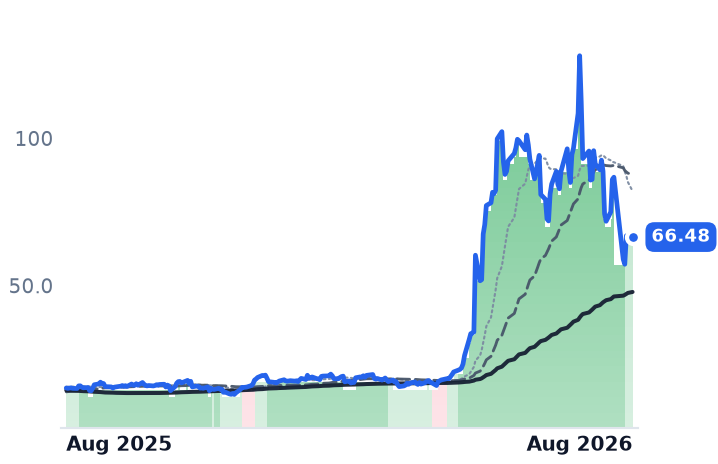
MXL | MaxLinear | RF & Wireless | 🟢 Cont. Bull | −30.5% | +335.9% |
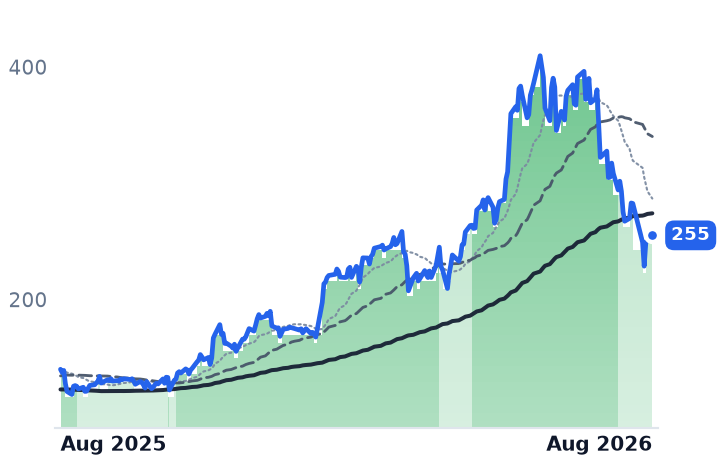
MTSI | MACOM Technology Solutions | RF & Wireless | 🟢 Cont. Bull | −22.1% | +82.3% |
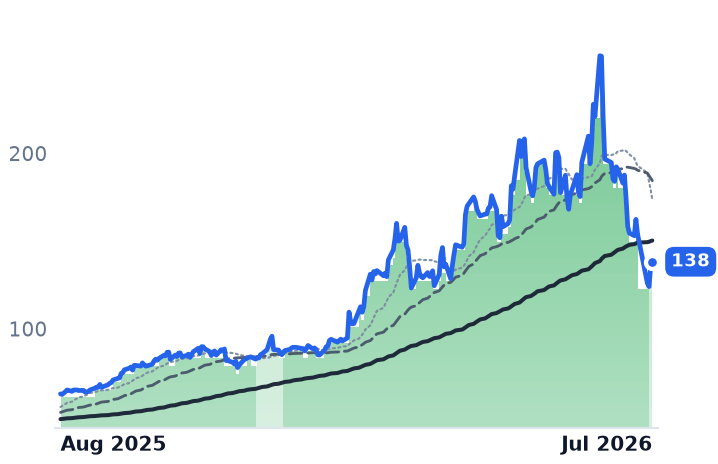
GLW | Corning | Display & Optical Materials | 🟢 Cont. Bull | −29.0% | +119.8% |
CLS | Celestica | Electronic Manufacturing Services | 🟢 Cont. Bull | −5.4% | +64.5% |
JBL | Jabil | Electronic Manufacturing Services | 🟢 Cont. Bull | −6.9% | +41.9% |
FLEX | Flex | Electronic Manufacturing Services | 🟢 Cont. Bull | −18.0% | +123.3% |
ACN | Accenture | Enterprise Consulting & Systems Integration | 🔴 Cont. Bear | +22.6% | −34.6% |
OKTA | Okta | Identity & Access Management | 🌱 Emerging Bull | −2.1% | +48.9% |
SAIL | SailPoint | Identity & Access Management | 🌱 Emerging Bull | +10.6% | −14.9% |
TWLO | Twilio | Communications & Messaging Platforms | 🟢 Cont. Bull | −5.8% | +57.2% |
AAOI | Applied Optoelectronics | RF & Wireless | 🟢 Cont. Bull | −14.4% | +376.0% |
WOLF | Wolfspeed | Discrete & Power | 🌱 Emerging Bull | −40.2% | +6.9% |
BAND | Bandwidth | Communications & Messaging Platforms | 🌱 Emerging Bull | −35.5% | +187.2% |
EPAM | EPAM Systems | Enterprise Consulting & Systems Integration | 🔴 Cont. Bear | +21.5% | −31.1% |
QCOM | QUALCOMM Incorporated | RF & Wireless | 🟢 Cont. Bull | −20.1% | +2.8% |
PLAB | Photronics | Discrete & Power | ⚠️ Emerging Bear | +3.7% | +51.8% |
SANM | Sanmina | Electronic Manufacturing Services | 🟢 Cont. Bull | −14.7% | +59.0% |
PLXS | Plexus | Electronic Manufacturing Services | 🟢 Cont. Bull | −8.7% | +93.9% |
BHE | Benchmark Electronics | Electronic Manufacturing Services | 🟢 Cont. Bull | −6.8% | +103.8% |
MRAM | Everspin Technologies | Memory (DRAM/NAND) | 🟢 Cont. Bull | −25.9% | +136.6% |
GDYN | Grid Dynamics | Enterprise Consulting & Systems Integration | 🔴 Cont. Bear | +16.4% | −14.7% |
GLOB | Globant | Enterprise Consulting & Systems Integration | 🔴 Cont. Bear | +18.3% | −55.4% |
WIT | Wipro | Enterprise Consulting & Systems Integration | 🔴 Cont. Bear | +7.6% | −25.8% |
GIB | CGI | Enterprise Consulting & Systems Integration | 🔴 Cont. Bear | +10.2% | −24.3% |
BB | BlackBerry | Identity & Access Management | 🌱 Emerging Bull | −26.6% | +121.6% |
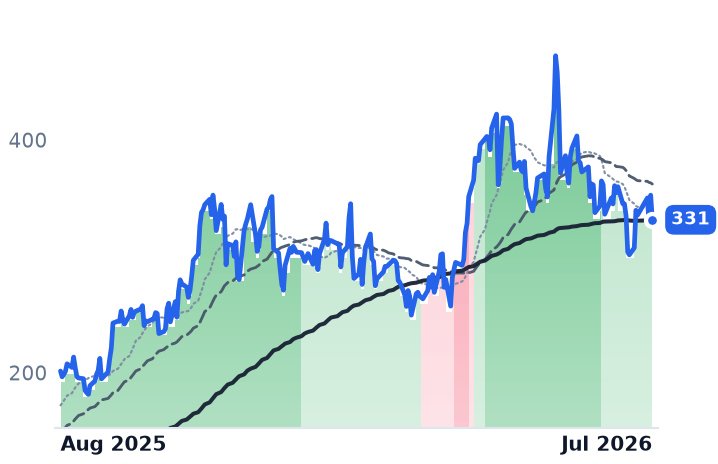
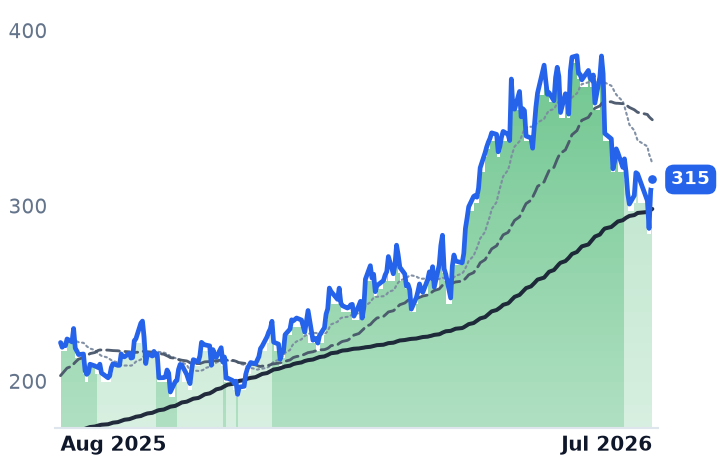
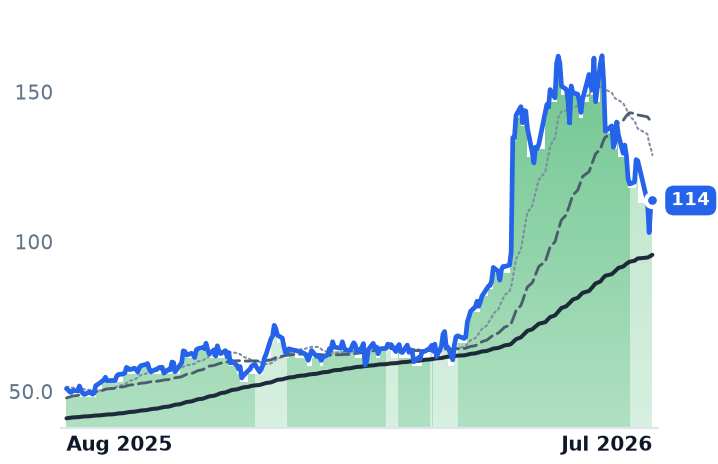
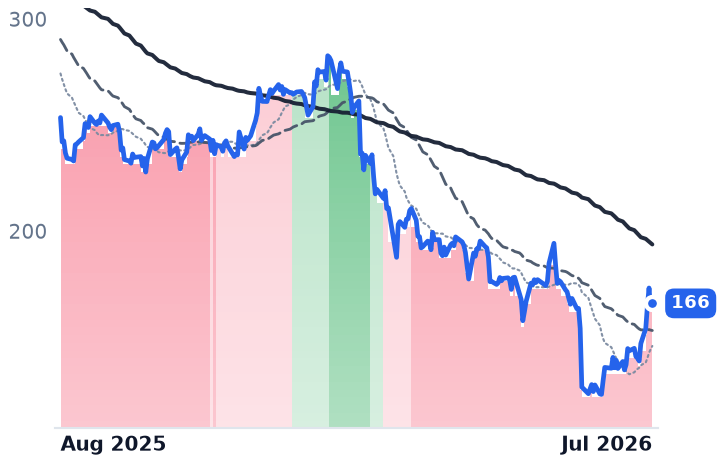
12-month price & trend
| Ticker | Mkt cap | P/E | P/E fwd | P/S | P/S fwd | P/GP | P/GP fwd | EV/EBITDA | FCF yld |
|---|---|---|---|---|---|---|---|---|---|
MU | $929.5B | 18.4x | 11.2x | 10.3x | 7.2x | 14.2x | 9.9x | 20.3x | 2.8% |
MXL | $6.0B | n/m | 39.7x | 10.6x | 8.3x | 18.5x | 14.5x | n/m | 0.1% |
MTSI | $19.5B | 107.9x | 50.9x | 18.2x | 15.5x | 32.2x | 27.4x | 70.7x | 0.8% |
| Ticker | Mkt cap | P/E | P/E fwd | P/S | P/S fwd | P/GP | P/GP fwd | EV/EBITDA | FCF yld |
|---|---|---|---|---|---|---|---|---|---|
GLW | $119.0B | 62.6x | 42.5x | 7.0x | 6.2x | 19.3x | 17.1x | 35.9x | 2.0% |
CLS | $38.1B | 34.1x | 29.1x | 2.4x | 1.9x | 20.7x | 16.4x | 25.5x | 1.4% |
JBL | $33.0B | 38.9x | 24.7x | 1.0x | 0.9x | 10.8x | 9.8x | 16.7x | 4.6% |
| Ticker | Mkt cap | P/E | P/E fwd | P/S | P/S fwd | P/GP | P/GP fwd | EV/EBITDA | FCF yld |
|---|---|---|---|---|---|---|---|---|---|
FLEX | $41.7B | 43.9x | 24.2x | 1.4x | 1.2x | 14.8x | 12.7x | 20.8x | 2.6% |
ACN | $101.5B | 13.1x | 12.0x | 1.4x | 1.4x | 4.4x | 4.4x | 7.9x | 12.4% |
OKTA | $24.2B | 103.9x | 37.8x | 8.1x | 7.6x | 10.5x | 9.8x | 66.2x | 3.7% |
| Ticker | Mkt cap | P/E | P/E fwd | P/S | P/S fwd | P/GP | P/GP fwd | EV/EBITDA | FCF yld |
|---|---|---|---|---|---|---|---|---|---|
SAIL | $9.9B | n/m | — | 8.9x | — | 13.4x | — | 757.3x | 1.9% |
TWLO | $29.9B | 289.7x | 34.5x | 5.6x | 5.1x | 11.5x | 10.5x | 97.9x | 3.3% |
AAOI | $8.5B | n/m | 102.2x | 16.7x | 8.1x | 57.8x | 28.0x | n/m | -2.8% |
| Ticker | Mkt cap | P/E | P/E fwd | P/S | P/S fwd | P/GP | P/GP fwd | EV/EBITDA | FCF yld |
|---|---|---|---|---|---|---|---|---|---|
WOLF | $1.2B | n/m | — | 1.7x | 1.9x | — | — | n/m | -61.1% |
BAND | $1.3B | 593.9x | 22.4x | 1.5x | 1.4x | 4.0x | 3.8x | — | 5.8% |
EPAM | $5.5B | 15.1x | 8.1x | 1.0x | 1.0x | 3.5x | 3.5x | 7.0x | 9.9% |
| Ticker | Mkt cap | P/E | P/E fwd | P/S | P/S fwd | P/GP | P/GP fwd | EV/EBITDA | FCF yld |
|---|---|---|---|---|---|---|---|---|---|
QCOM | $156.5B | 17.0x | 14.0x | 3.6x | 3.6x | 6.6x | 6.6x | 12.4x | 6.7% |
PLAB | $1.8B | 11.1x | 16.3x | 2.1x | 2.1x | 6.2x | 6.2x | 4.0x | 5.4% |
SANM | $9.9B | 32.6x | 15.3x | 0.8x | 0.7x | 8.9x | 7.8x | 15.8x | 10.3% |
| Ticker | Mkt cap | P/E | P/E fwd | P/S | P/S fwd | P/GP | P/GP fwd | EV/EBITDA | FCF yld |
|---|---|---|---|---|---|---|---|---|---|
PLXS | $6.7B | 36.3x | 29.3x | 1.5x | 1.4x | 14.9x | 13.9x | 27.0x | 0.9% |
BHE | $2.9B | 53.9x | 27.0x | 1.0x | 1.0x | 9.8x | 9.8x | 19.8x | 5.4% |
MRAM | $340.7M | — | — | 6.0x | 4.9x | 11.5x | 9.4x | 87.9x | -0.3% |
| Ticker | Mkt cap | P/E | P/E fwd | P/S | P/S fwd | P/GP | P/GP fwd | EV/EBITDA | FCF yld |
|---|---|---|---|---|---|---|---|---|---|
GDYN | $559.0M | 250.5x | 15.7x | 1.3x | 1.3x | 3.7x | 3.7x | 11.5x | 2.9% |
GLOB | $1.6B | 14.7x | 5.9x | 0.6x | 0.6x | 1.8x | 1.8x | 5.4x | 19.2% |
WIT | $19.6B | 14.9x | 0.2x | 2.0x | 0.0x | 6.9x | n/m | 9.9x | 7.6% |
| Ticker | Mkt cap | P/E | P/E fwd | P/S | P/S fwd | P/GP | P/GP fwd | EV/EBITDA | FCF yld |
|---|---|---|---|---|---|---|---|---|---|
GIB | $15.6B | 12.7x | 8.0x | 1.3x | 0.9x | 6.4x | 4.4x | 8.5x | 11.1% |
BB | $4.9B | 82.5x | 43.4x | 8.4x | 7.9x | 10.9x | 10.2x | 56.9x | 1.3% |
Valuation & fundamentals
Consensus projections
| Ticker | FY2026E | FY2027E | FY2028E | |
|---|---|---|---|---|
MU | Revenue | +248.0% | +92.8% | +11.4% |
| EPS | +804.9% | +111.2% | +7.9% | |
MXL | Revenue | +55.6% | +29.7% | +18.5% |
| EPS | +479.6% | +54.2% | +19.7% | |
MTSI | Revenue | +30.6% | +26.8% | +16.3% |
| EPS | +44.9% | +37.9% | +21.7% | |
GLW | Revenue | +17.6% | +18.6% | +20.7% |
| EPS | +29.1% | +32.1% | +36.1% | |
CLS | Revenue | +67.0% | +69.3% | +32.3% |
| EPS | +90.2% | +74.7% | +34.3% | |
JBL | Revenue | +20.2% | +21.2% | +12.1% |
| EPS | +35.9% | +31.0% | +20.3% | |
FLEX | Revenue | +6.8% | +26.3% | +30.0% |
| EPS | +24.2% | +44.7% | +51.0% | |
ACN | Revenue | +6.0% | +4.1% | +5.3% |
| EPS | +7.6% | +5.9% | +7.3% | |
OKTA | Revenue | +12.0% | +10.0% | +9.5% |
| EPS | +24.3% | +11.7% | +10.8% | |
TWLO | Revenue | +16.0% | +10.1% | +10.4% |
| EPS | +19.1% | +16.3% | +15.7% | |
AAOI | Revenue | +129.8% | +169.3% | +48.7% |
| EPS | −417.3% | +454.2% | +102.6% | |
WOLF | Revenue | +0.7% | −14.8% | +24.1% |
| EPS | +275.2% | −30.1% | −11.8% | |
BAND | Revenue | +20.0% | +4.0% | +19.3% |
| EPS | +22.0% | +8.3% | +36.1% | |
EPAM | Revenue | +5.2% | +5.8% | +6.7% |
| EPS | +14.2% | +8.8% | +9.3% | |
QCOM | Revenue | −1.3% | +4.2% | +15.1% |
| EPS | −10.8% | −2.6% | +26.8% | |
PLAB | Revenue | +2.5% | +4.5% | +7.1% |
| EPS | −1.1% | +8.6% | +8.4% | |
SANM | Revenue | +74.9% | +15.8% | +11.8% |
| EPS | +103.4% | +15.2% | +12.7% | |
PLXS | Revenue | +20.8% | +13.8% | +9.0% |
| EPS | +19.5% | +15.6% | +12.0% | |
BHE | Revenue | +13.3% | +7.8% | — |
| EPS | +26.7% | +13.0% | — | |
MRAM | Revenue | +26.8% | +12.4% | +8.2% |
| EPS | −140.0% | +1266.7% | +97.6% | |
GDYN | Revenue | +6.5% | +9.2% | +10.6% |
| EPS | +11.3% | +17.7% | +9.6% | |
GLOB | Revenue | +1.0% | +4.5% | +5.3% |
| EPS | +1.6% | +6.1% | +7.4% | |
WIT | Revenue | +5.4% | +4.3% | +2.5% |
| EPS | +4.6% | +2.9% | +3.7% | |
GIB | Revenue | +5.3% | +2.6% | +2.6% |
| EPS | +9.7% | +9.2% | +8.0% | |
BB | Revenue | +0.2% | +15.1% | +10.4% |
| EPS | +1183.3% | +29.8% | +20.2% |
Forward fiscal years only. Blank means no analyst coverage for that year.
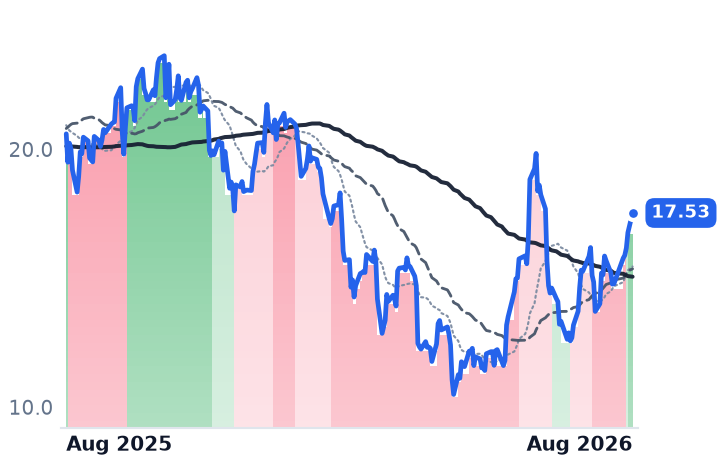
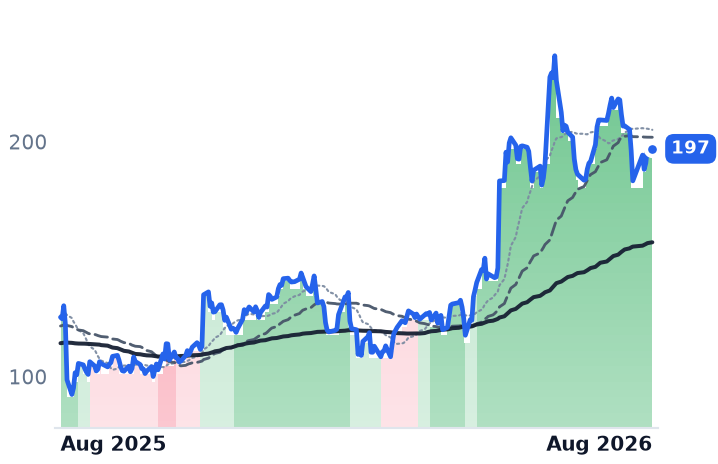
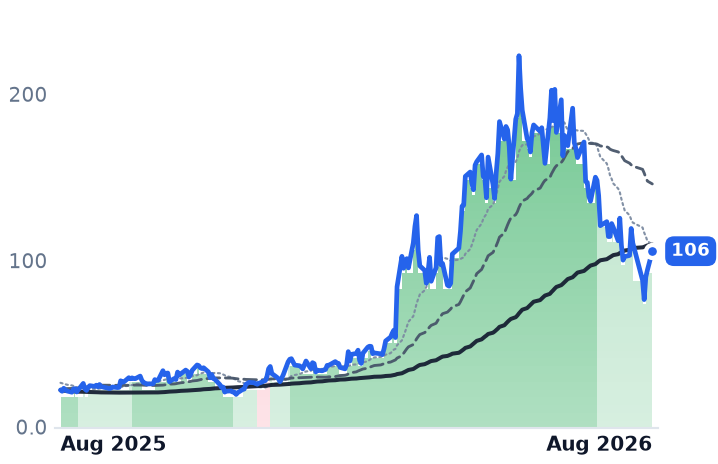
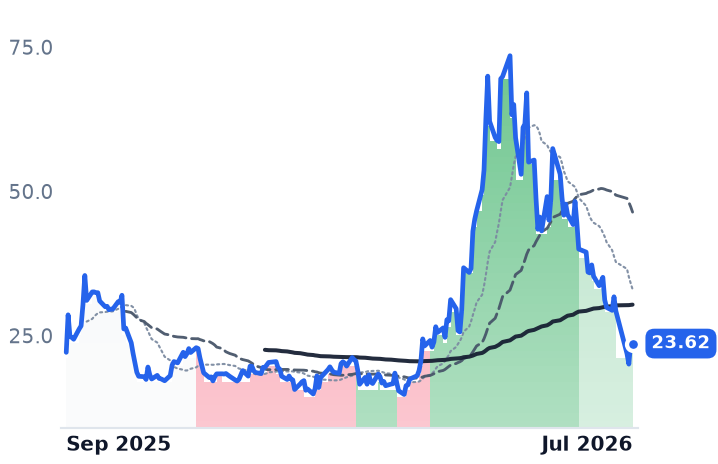
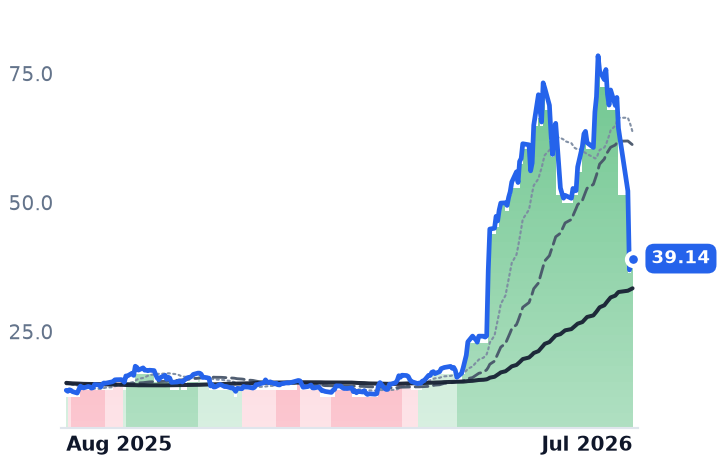
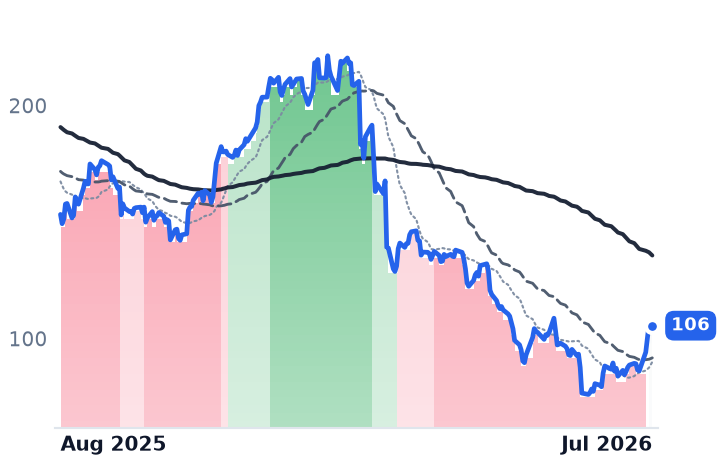
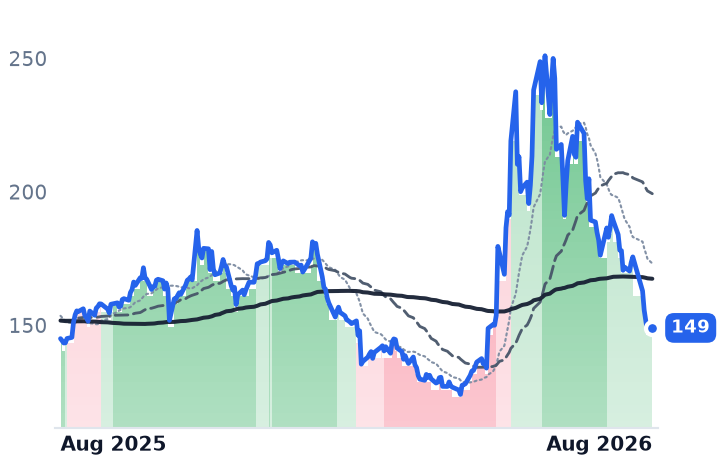
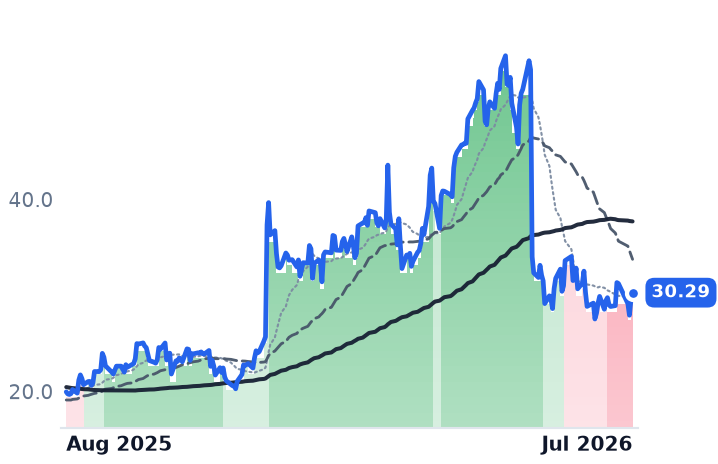
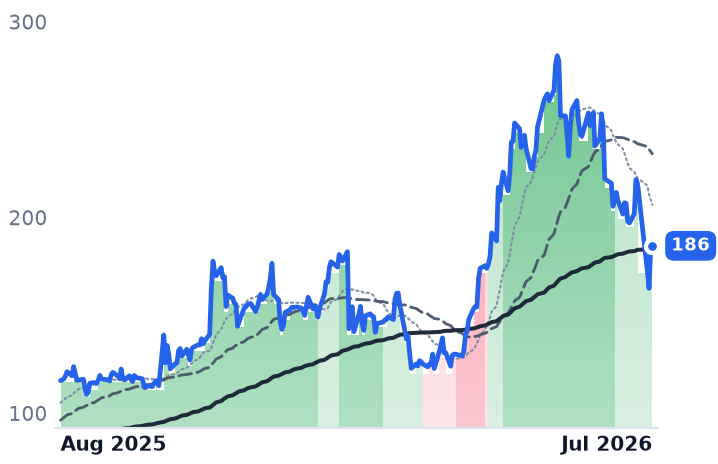
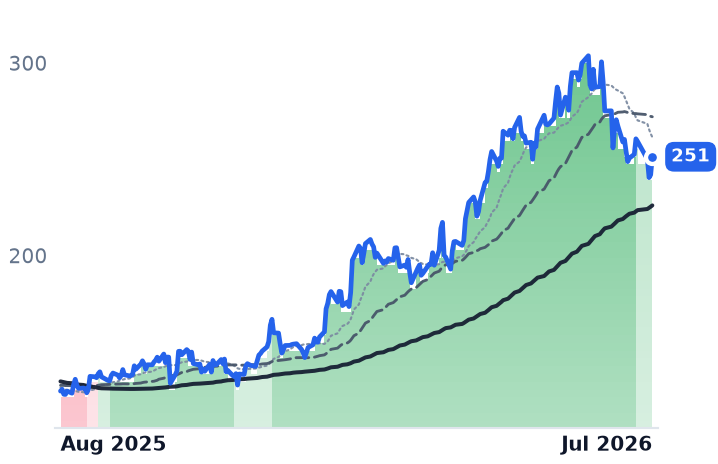
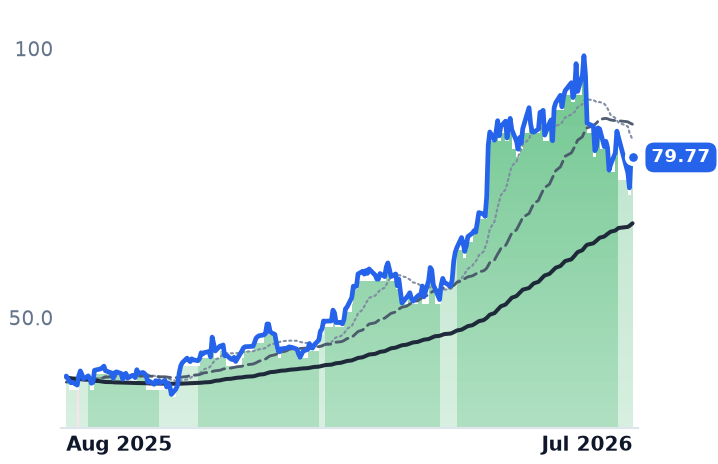
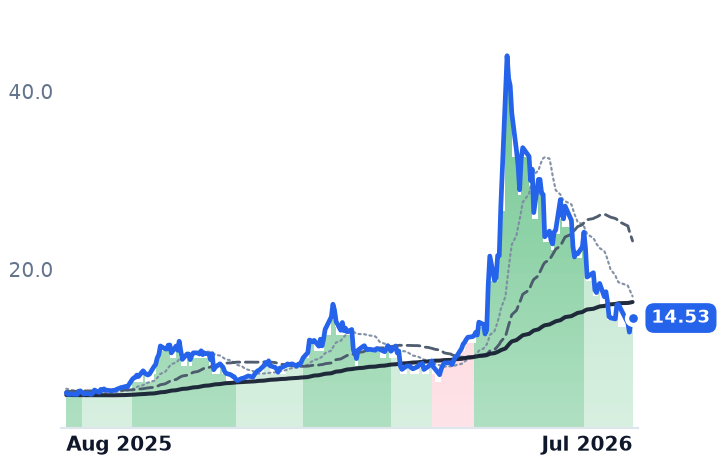
Investors who piled into the most successful artificial-intelligence-adjacent stocks over the past year have spent the last month selling them, and the size of the sell-off tracks the size of the earlier rally almost name for name. Memory-chip maker Micron, radio-frequency component supplier MaxLinear, and glass-and-fiber manufacturer Corning — all among the biggest winners of the past twelve months — have each fallen 20% to 40% since late June. Meanwhile stocks that lagged badly over the same period, including IT-consulting firms and identity-security software vendors, have risen 6% to 27% in the last 30 days. That symmetry points to investors rotating out of crowded winners rather than a wave of bad news — except at two companies where guidance actually did deteriorate.
The names at the center of this are Micron (MU), which makes DRAM and NAND memory chips used in AI servers; MaxLinear (MXL), which makes radio-frequency and data-center connectivity chips; MACOM Technology (MTSI), a maker of high-speed optical and RF components for data centers; Corning (GLW), which supplies optical fiber and specialty glass to telecom and data-center customers; contract electronics assemblers Celestica (CLS), Jabil (JBL) and Flex (FLEX), which build servers and networking gear for cloud customers; Accenture (ACN), the largest IT-consulting and systems-integration firm; identity-security software vendors Okta (OKTA) and SailPoint (SAIL); cloud-communications software provider Twilio (TWLO); optical-networking equipment maker Applied Optoelectronics (AAOI); silicon-carbide chipmaker Wolfspeed (WOLF); cloud-communications platform Bandwidth (BAND); and IT-services firm EPAM Systems (EPAM).
At the hardware leaders, the business kept accelerating even as the stock fell. Micron's fiscal third-quarter revenue hit a record $41.5 billion, up 74% from the prior quarter, with gross margin expanding to nearly 85% and management saying DRAM and NAND supply will trail demand into 2027 on AI-driven demand. MACOM booked a record 1.3-times book-to-bill ratio with backlog still building. Celestica, Jabil and Flex all raised AI and data-center revenue guidance in their most recent quarters, and MaxLinear raised its 2026 optical data-center revenue outlook to $210-$230 million even after a one-off operating loss. None of that squares with a 20%-to-40% share-price decline on fundamentals alone — it looks like a crowded trade unwinding after chip stocks logged an 80% first-half rally before shedding more than $1 trillion in value in a single week in late July, alongside a broader wobble after the largest cloud providers raised 2026 capital-spending guidance to roughly $700 billion combined and investors reacted by questioning the payoff rather than the spending itself.
Two names break that pattern. Corning fell about 15% on July 28 after issuing a third-quarter sales forecast below Wall Street's estimate, tied to the pace of building new optical-fiber production lines for data centers — a real, if modest, guidance miss, not pure rotation. Accenture cut its full-year revenue growth guidance to 3%-4% from 3%-5% and reported bookings down 2%-3% year over year, citing weak US federal spending — a genuine deterioration that sits oddly next to Accenture's own peers, which merely lagged the market rather than falling on fresh bad news and have since bounced.
The bounce side is also not one story. Okta's revenue grew 12% last quarter, a continued deceleration from the mid-teens pace of prior years, even as free cash flow stayed strong at $211 million — a real business-maturation trend, not just sentiment. SailPoint, by contrast, grew revenue 20% and SaaS annual recurring revenue 38%, crossing $1 billion in total ARR, but is still posting losses. Twilio's organic revenue growth accelerated to 20%, its best pace in three years, with guidance raised twice in 2026.
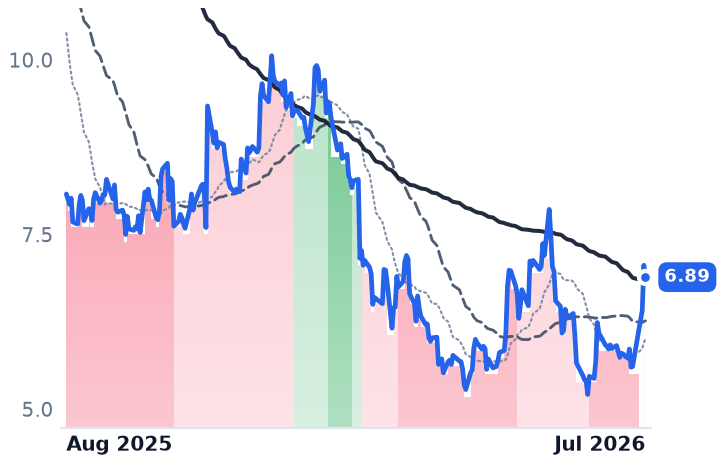
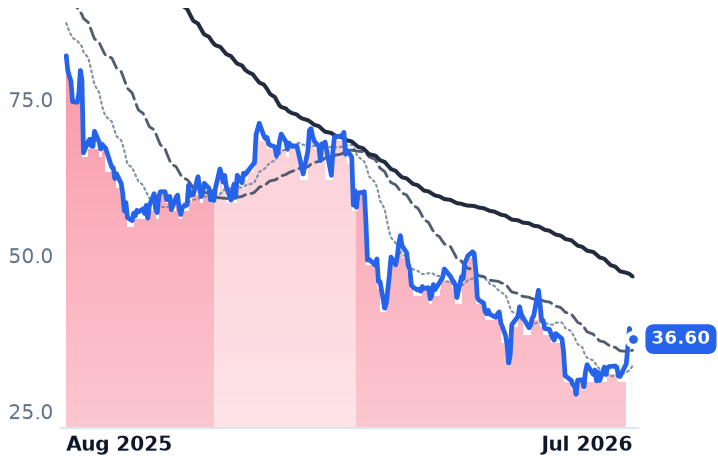
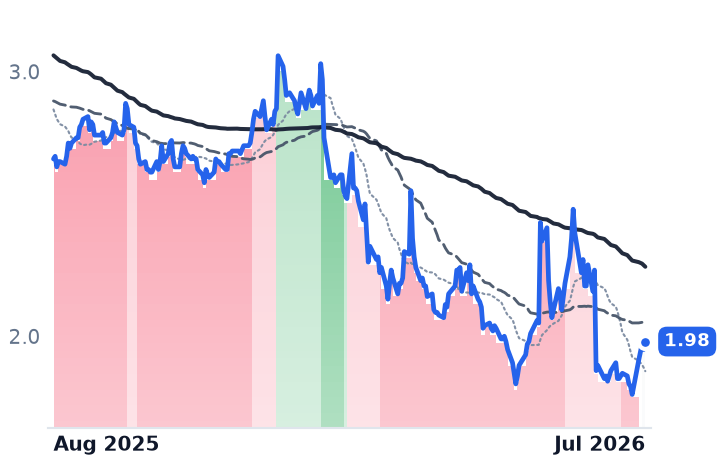
On the tape, the pattern is directional but not perfectly linear: Micron's 30-day drawdown (-20%) is smaller than MaxLinear's (-40%) despite a far bigger prior-year gain, and Wolfspeed's -47% drawdown reflects a distressed, post-restructuring share count more than crowding. Database records show a uniform strong-bull-to-mild-bull downgrade stamped July 31 across Micron, MaxLinear, MACOM, Corning, Celestica, Jabil, Flex, Applied Optoelectronics and several smaller peers, while Accenture alone moved to a strong-bear reading — consistent with its being the one name in the group facing an actual guidance cut rather than a crowded-trade exit.
On valuation, the hardware leaders still carry cycle-sensitive multiples: Celestica, Jabil and Flex trade at trailing price-to-earnings ratios of roughly 40x-60x, and Micron's ~12x forward earnings looks inexpensive only if AI-driven memory pricing holds near current, historically elevated levels. Twilio's ~33x-35x forward earnings and Photronics' 11x trailing earnings sit at opposite ends of that spectrum, underscoring that the group's re-rating has room to run in either direction depending on which multiple an investor anchors to.
The setup
Where it stands — Chip and optical-hardware leaders fell 20%-47% in 30 days despite mostly intact guidance; Corning and Accenture fell on genuine guidance cuts. Would confirm — Micron, MACOM, Celestica, Jabil and Flex maintain or raise guidance again in their next quarterly reports without further share declines. Would invalidate — Book-to-bill or hyperscaler capex commentary turns down at MACOM or Micron's next print, confirming a fundamental, not technical, rollover. Watch next — Micron's fiscal Q4 FY26 report and Corning's Q3 2026 results, both due within the next 60-90 days. Valuation — Micron trades near 12x forward earnings versus a cycle-average that has ranged from single digits to over 20x across past memory cycles.