July 28, 2026 · 5:38 PM PDT
Clean-energy selloff is a bifurcated cohort, not a fresh rotation Hypothesis Opus 5 · Research Sonnet 5 · Writing Sonnet 5 · Prompt v1.0
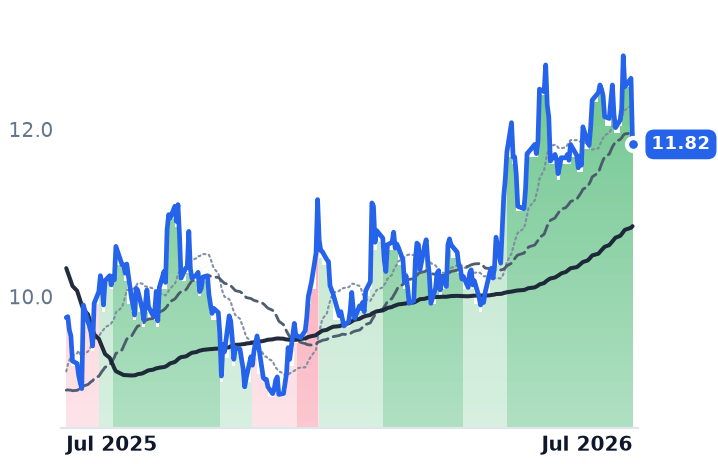
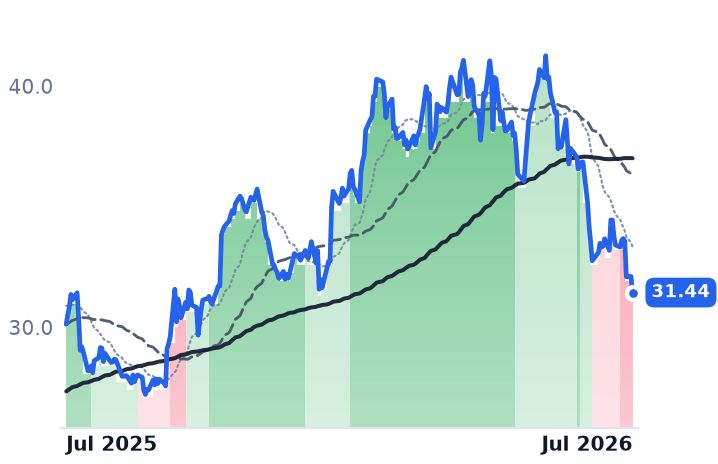
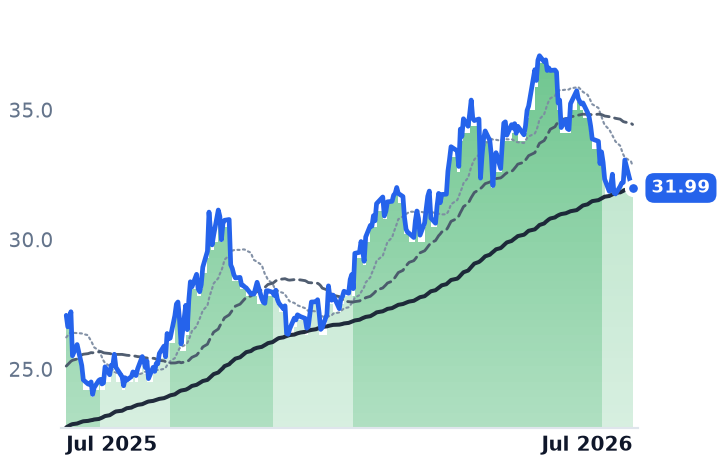
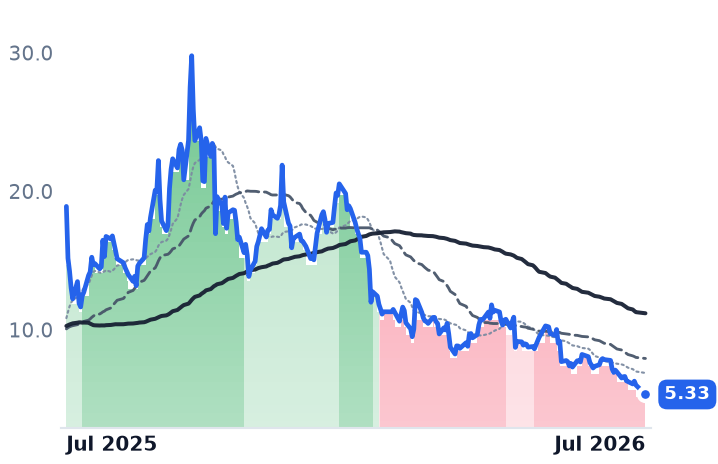
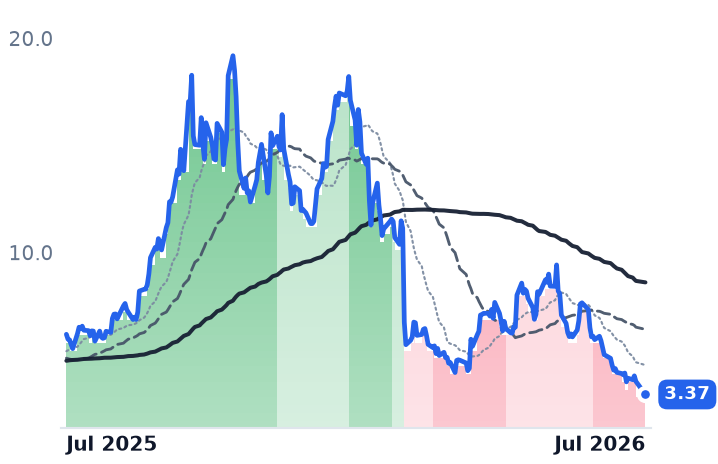
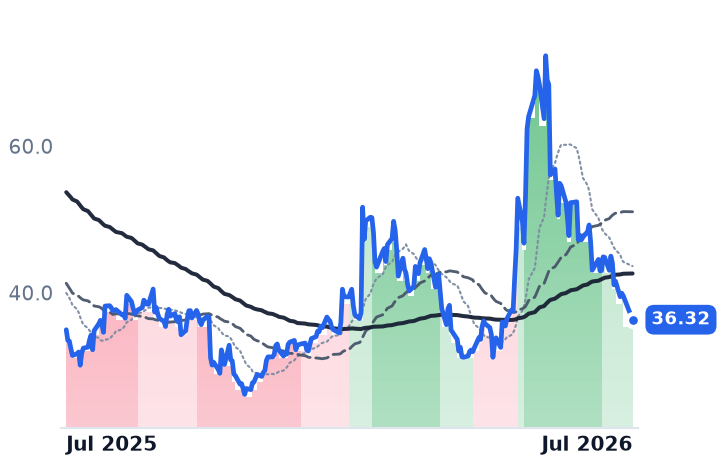
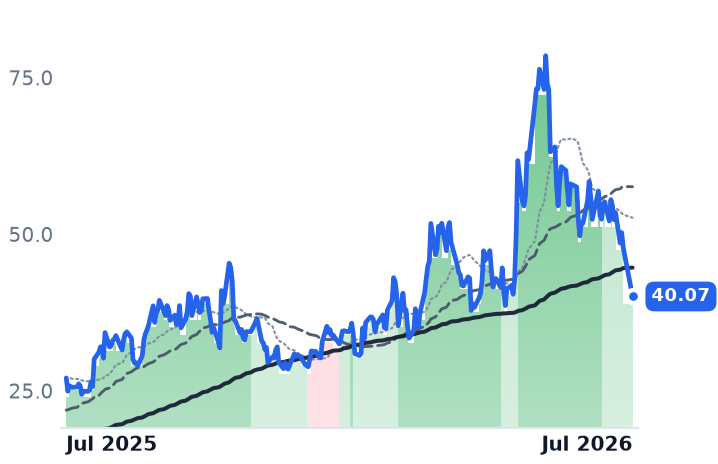
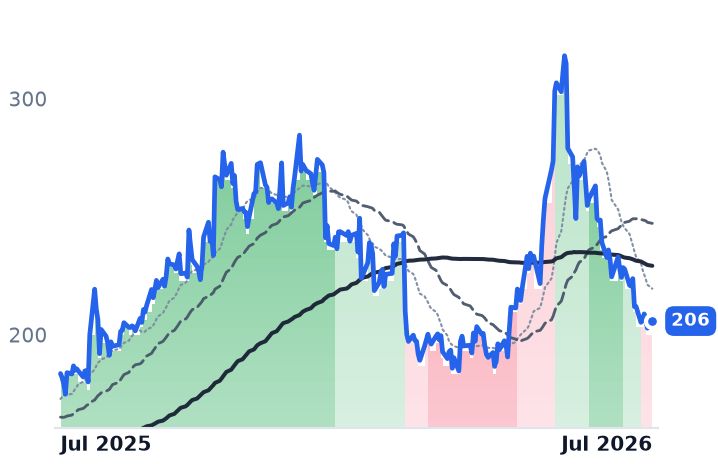
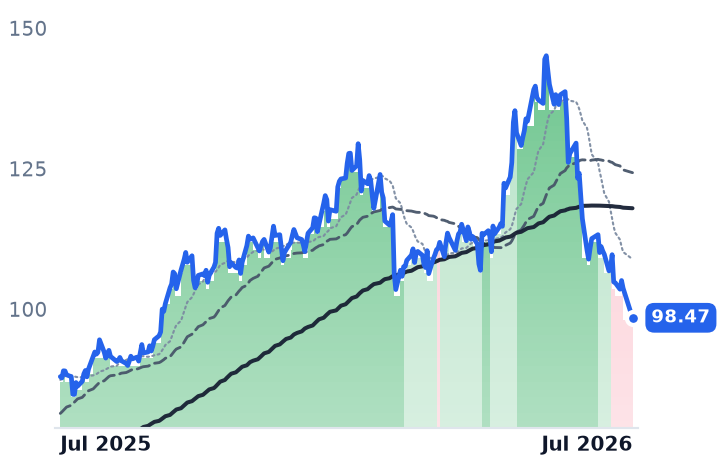
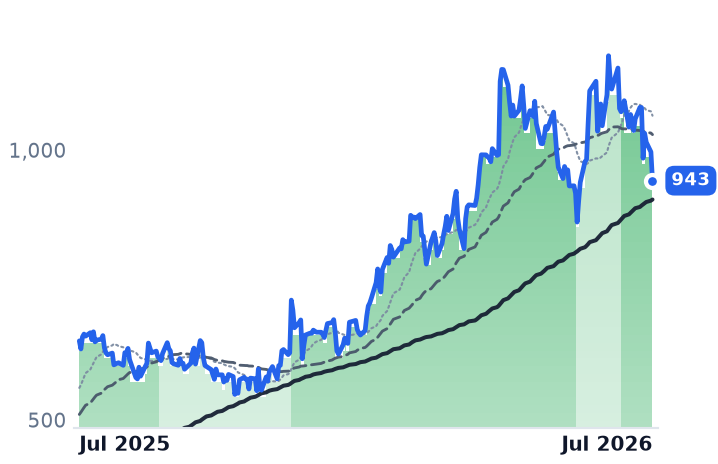
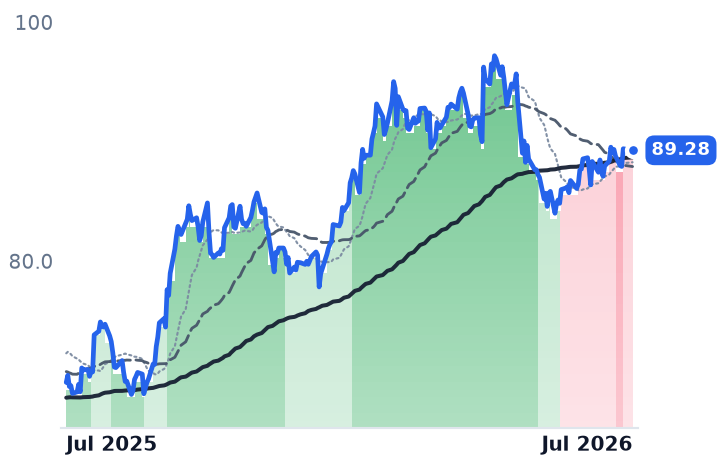
Trend-band data shows the clean-energy complex splitting into two distinct groups this week: a handful of names (CWEN, ORA, and the already-broken RUN/STEM/EOSE) are in genuine multi-week-to-multi-month bear regimes tied to specific fundamentals, while XIFR, BEP, ENPH, SEDG, GEV and TLN remain in bull bands despite sharp five-day pullbacks — arguing this is sector beta layered on top of two older, idiosyncratic downtrends rather than a new cohort-wide macro-driven break.
XIFR CWEN BEP RUN STEM EOSE ENPH SEDG FSLR ORA GEV NEE TLN CEG WMB LNG CAT
Ticker Company Segment Trend · 13mo 30D 1Y XIFRXPLR Infrastructure Renewable & Infrastructure Assets 🟢 Cont. Bull −0.3% +21.2% CWENClearway Energy Wind & Solar Developers ⚠️ Emerging Bear −10.6% +4.4% BEPBrookfield Renewable Partners Diversified Renewable Generators 🟢 Cont. Bull −8.3% +18.1% RUNSunrun Residential Solar Installers ⚠️ Emerging Bear −28.6% −13.6% STEMStem Software - Infrastructure ⚠️ Emerging Bear −28.7% −71.8% EOSEEos Energy Enterprises Energy Storage & Batteries ⚠️ Emerging Bear −44.7% −45.5% ENPHEnphase Energy Inverters & Power Electronics 🌱 Emerging Bull −24.9% +3.9% SEDGSolarEdge Technologies Inverters & Power Electronics 🟢 Cont. Bull −27.6% +48.1% FSLRFirst Solar Solar Module Manufacturers 🟢 Cont. Bull — — ORAOrmat Technologies Geothermal & Specialized 🟢 Cont. Bull −10.9% +11.9% GEVGE Vernova GE Vernova Integrated 🟢 Cont. Bull −14.4% +45.9% NEENextEra Energy Vertically Integrated Utilities ⚠️ Emerging Bear +0.7% +27.8% TLNTalen Energy Wholesale Power Producers 🟢 Cont. Bull −18.4% −9.1% CEGConstellation Energy Diversified Renewable Generators ⚠️ Emerging Bear +0.2% −20.7% WMBThe Williams Companies Natural Gas Pipelines & Transmission 🟢 Cont. Bull −6.5% +24.9% LNGCheniere Energy LNG Export & Infrastructure 🟢 Cont. Bull +3.4% +11.2% CATCaterpillar Heavy Construction & Mining 🟢 Cont. Bull −18.6% +95.6%
12-month price & trend 11.82
−0.79 (−6.26%)
vs. prior close
Renewable & Infrastructure Assets
31.44
−0.67 (−2.09%)
vs. prior close
Wind & Solar Developers
BEP
Brookfield Renewable Partners
31.99
−0.14 (−0.44%)
vs. prior close
Diversified Renewable Generators
Ticker Mkt cap P/E P/E fwd P/S P/S fwd P/GP P/GP fwd EV/EBITDA FCF yld XIFR$1.1B 17.8x 3.5x 0.9x 0.8x 5.4x 4.9x 9.0x -56.5% CWEN$6.5B 793.3x — 4.4x 3.9x 8.5x 7.5x 14.3x 9.0% BEP$10.6B 75.5x — 1.7x 1.6x 6.9x 6.4x 10.0x -44.4%
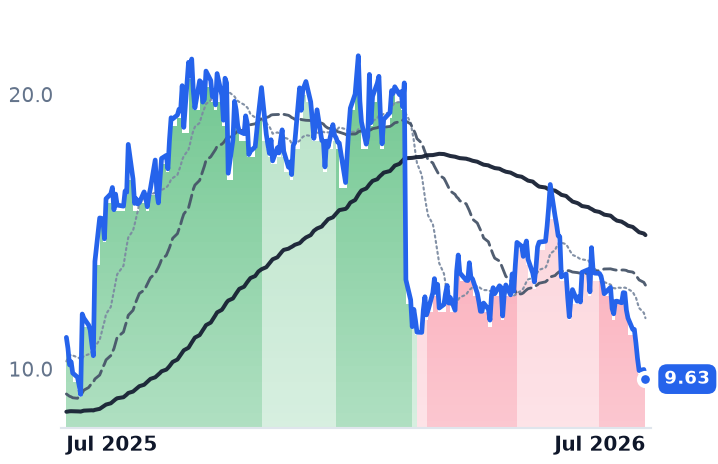
9.63
−0.35 (−3.51%)
vs. prior close
Residential Solar Installers
5.33
−0.68 (−11.31%)
vs. prior close
Software - Infrastructure
EOSE
Eos Energy Enterprises
3.37
−0.61 (−15.33%)
vs. prior close
Energy Storage & Batteries
Ticker Mkt cap P/E P/E fwd P/S P/S fwd P/GP P/GP fwd EV/EBITDA FCF yld RUN$2.3B 4.0x 8.1x 0.7x 0.8x 2.4x 2.5x 22.0x -32.1% STEM$50.3M 0.3x — 0.3x 0.3x 0.9x 0.9x 1.6x -19.3% EOSE$2.1B n/m — 12.8x 6.7x — — n/m -18.8%
36.32
−3.26 (−8.24%)
vs. prior close
Inverters & Power Electronics
SEDG
SolarEdge Technologies
40.07
−7.81 (−16.31%)
vs. prior close
Inverters & Power Electronics
206
+3.01 (+1.48%)
vs. prior close
Solar Module Manufacturers
Ticker Mkt cap P/E P/E fwd P/S P/S fwd P/GP P/GP fwd EV/EBITDA FCF yld ENPH$5.3B 39.7x 20.0x 4.0x 4.5x 8.6x 9.6x 30.5x 2.9% SEDG$2.0B n/m — 1.5x 1.5x 6.7x 6.6x n/m 4.6% FSLR$22.7B 13.0x 11.9x 4.2x 4.5x 9.6x 10.2x 8.6x 5.1%
98.47
−5.27 (−5.08%)
vs. prior close
Geothermal & Specialized
943
−53.19 (−5.34%)
vs. prior close
GE Vernova Integrated
89.28
−0.13 (−0.15%)
vs. prior close
Vertically Integrated Utilities
Ticker Mkt cap P/E P/E fwd P/S P/S fwd P/GP P/GP fwd EV/EBITDA FCF yld ORA$8.1B 62.8x 57.4x 6.9x 7.0x 25.2x 25.4x 18.8x -2.7% GEV$268.1B 28.6x 32.8x 6.5x 5.8x 32.1x 28.8x 29.9x 4.6% NEE$194.7B 23.8x 23.1x 6.9x 6.3x 10.3x 9.4x 17.3x 1.2%
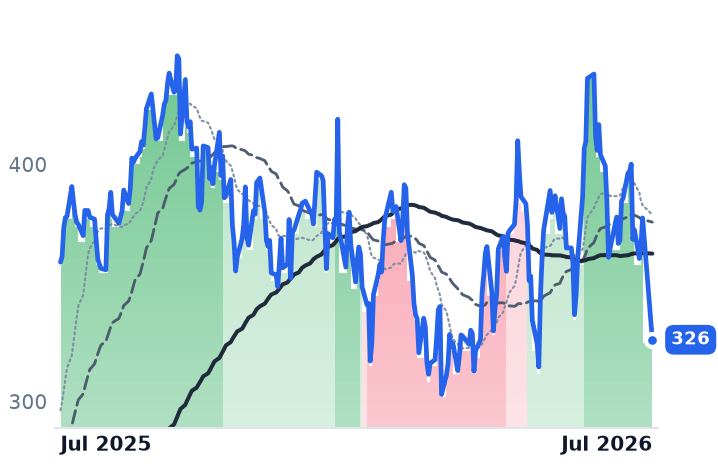
326
−51.36 (−13.61%)
vs. prior close
Wholesale Power Producers
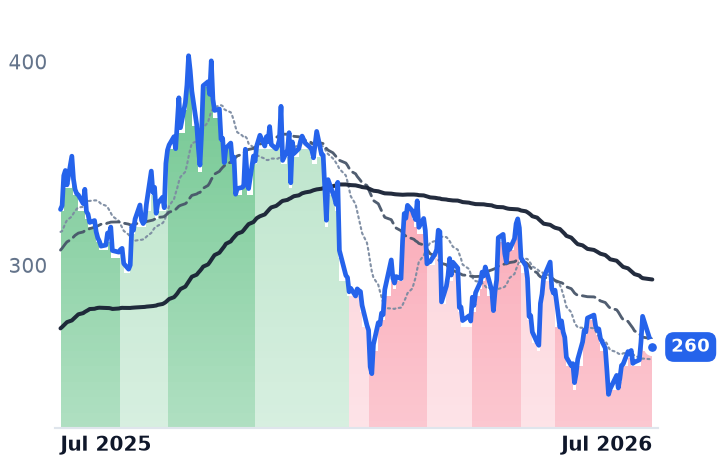
260
−15.08 (−5.49%)
vs. prior close
Diversified Renewable Generators
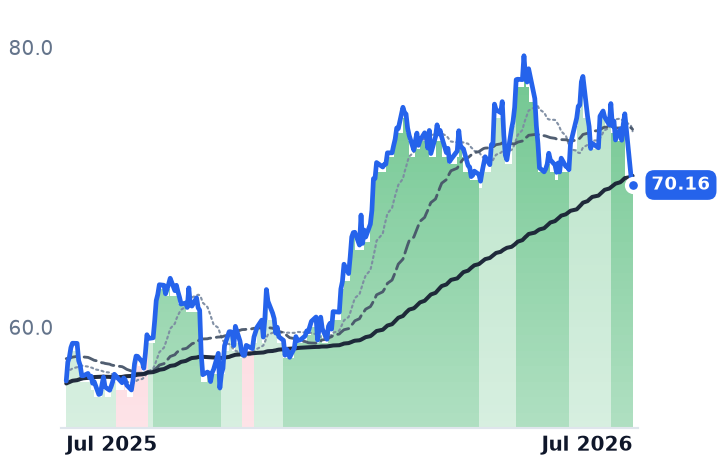
WMB
The Williams Companies
70.16
−0.63 (−0.89%)
vs. prior close
Natural Gas Pipelines & Transmission
Ticker Mkt cap P/E P/E fwd P/S P/S fwd P/GP P/GP fwd EV/EBITDA FCF yld TLN$16.2B n/m 16.9x 4.6x 3.6x 10.3x 8.1x 32.2x 3.1% CEG$101.4B 27.5x 24.1x 3.2x 3.1x 3.4x 3.2x 14.7x 0.3% WMB$90.1B 29.2x 30.4x 7.4x 7.3x 10.0x 10.0x 16.2x -0.2%
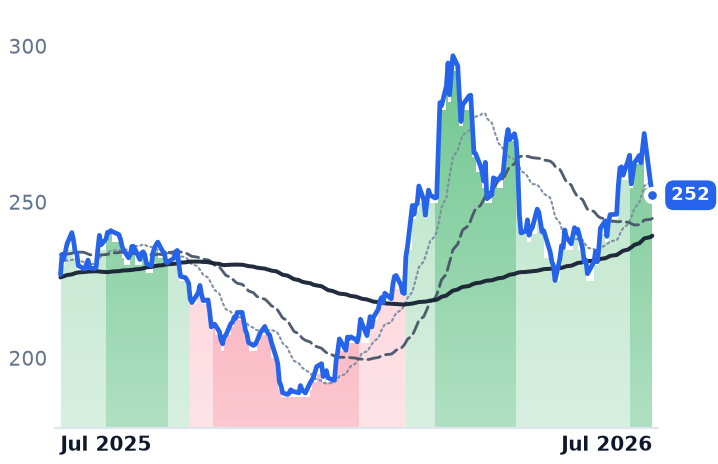
252
−3.70 (−1.45%)
vs. prior close
LNG Export & Infrastructure
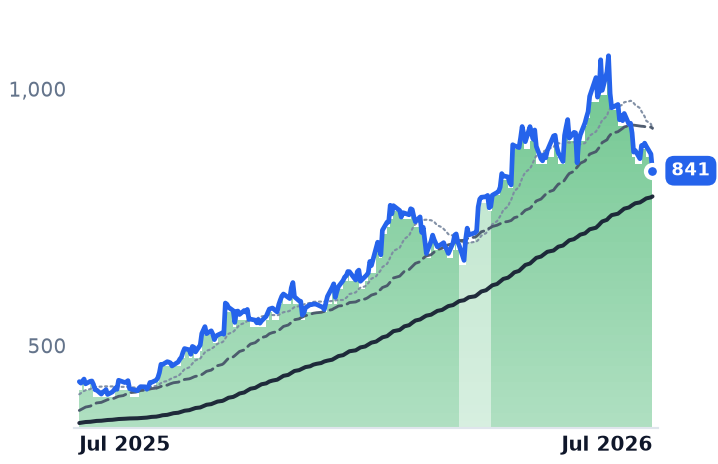
841
−32.43 (−3.71%)
vs. prior close
Heavy Construction & Mining
Ticker Mkt cap P/E P/E fwd P/S P/S fwd P/GP P/GP fwd EV/EBITDA FCF yld LNG$56.9B 20.1x — 2.6x 2.6x 4.8x 4.8x 10.0x 12.4% CAT$409.2B 43.7x 36.2x 5.8x 5.4x 17.8x 16.5x 29.3x 2.8%
Consensus projections Ticker FY2026E FY2027E FY2028E XIFRRevenue −0.5% +6.4% +2.4% EPS −2313.0% −17.3% −43.1% CWENRevenue +17.0% +11.6% +12.6% EPS −164.1% −148.8% +63.8% BEPRevenue +6.1% +11.0% −0.0% EPS +4.7% −20.8% +4.8% RUNRevenue +26.6% +7.7% +13.7% EPS −11.7% −61.6% +54.2% STEMRevenue +2.2% +19.4% +23.3% EPS +36.9% −17.3% −49.2% EOSERevenue +104.5% +94.6% +87.8% EPS −93.2% −73.0% −510.5% ENPHRevenue −19.3% +5.7% +11.2% EPS −27.7% +9.8% +17.8% SEDGRevenue +13.6% +11.7% +11.0% EPS −88.4% −454.7% +84.6% FSLRRevenue −1.1% +17.0% +11.0% EPS +21.1% +34.6% +22.8% ORARevenue +19.2% +1.7% +10.7% EPS +4.8% +8.5% +29.3% GEVRevenue +23.4% +14.6% +15.3% EPS +322.4% −19.0% +40.3% NEERevenue +9.0% +9.3% +8.6% EPS +9.4% +8.8% +8.4% TLNRevenue +85.4% +16.2% +4.4% EPS +258.6% +48.7% +19.6% CEGRevenue +35.3% +4.1% +5.2% EPS +25.2% +13.1% +28.6% WMBRevenue +7.4% +9.9% +12.7% EPS +14.1% +4.5% +18.3% LNGRevenue +11.9% +6.0% +3.4% EPS −141.4% −345.2% −8.0% CATRevenue +15.1% +10.4% +11.0% EPS +31.4% +22.1% +20.9%
Forward fiscal years only. Blank means no analyst coverage for that year.
Old downtrends deepening, not starting
Sunrun, Stem and Eos Energy have sat in strong-bear trend bands since February–March 2026, well before this week's headlines. Sunrun's break traces to a roughly 28% share-price plunge around its Q4 2025 earnings report, when the company guided 2026 cash flow to $250-450M versus 2025's $377M and Jefferies downgraded the stock to Hold . The demand deterioration has continued into 2026: Sunrun's Q1 2026 metrics showed new subscriber count down 25% year-over-year, added storage capacity down 15%, and added solar capacity down 19% . RUN, STEM and EOSE are down roughly 29%, 29% and 45% over the trailing 30 days and 51%, 68% and 79% over six months, respectively — a long secular decline this week's action is extending, not initiating.
The freshest genuine break: CWEN and ORA
Clearway Energy is the cleanest new cohort signal: its trend band flipped from mild-bull to mild-bear on July 2 and deepened to strong-bear on July 20, ahead of this week's broader selloff. The catalyst looks fundamental: CWEN was added to the Zacks Strong Sell list on July 13 on a 112% negative EPS revision, with shares falling into oversold RSI territory near a 52-week low . Notably, the company has not cut guidance to match the sentiment shift — Clearway reaffirmed 2026 cash-available-for-distribution guidance of $470-510M and a 2030 CAFD target of $2.90-3.10/share as recently as its May 2026 Q1 results , suggesting an estimate-revision/sentiment move rather than a guided coverage deterioration. Ormat (ORA) shows a similar, slightly earlier band flip on July 14.
What's still holding up
Six names in the original cohort — XIFR, BEP, ENPH, SEDG, GEV and TLN — remain in mild- or strong-bull trend bands despite steep five-day declines. XIFR is roughly flat over 30 days and up 15.7%/20.1% over 90/180 days despite its -6.3% single-day headline; the company's July 28 Q2 print reaffirmed full-year 2026 adjusted EBITDA guidance of $1.75-1.95B and free-cash-flow-before-growth guidance of $600-700M . GE Vernova's drop looks like its own story: shares fell on a quarterly margin/cash-flow guidance miss and a Siemens Energy rival downgrade , yet its trend band never left strong-bull.
Macro legs are mostly already priced
The hypothesis's structural catalysts predate this week's move: the 45Y/48E "beginning of construction" deadline landed July 4, three weeks before the selloff ; heavy AD/CVD tariffs on Southeast Asian solar cells were finalized months earlier ; California's NEM 3.0 grandfathering window closed April 15 ; and the 10-year Treasury yield actually eased into July 28 after a modest rise over the trailing month . None of these lands as a fresh, dated trigger inside the specific window driving this week's price action.