

Data-Center Utilities Split: Regulated Wires Hold, Merchant Power Cracks First
Hypothesis Opus 5 · Research Sonnet 5 · Writing Sonnet 5 · Prompt v1.0
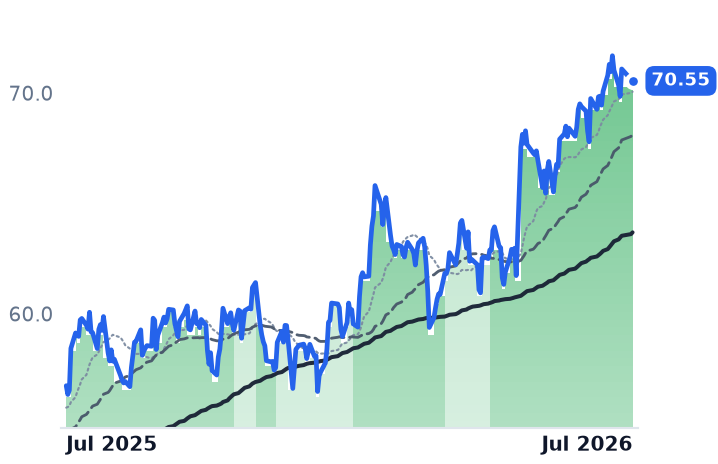
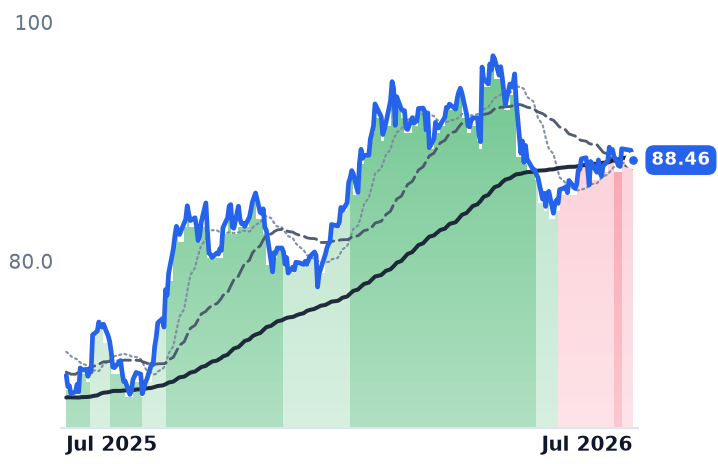
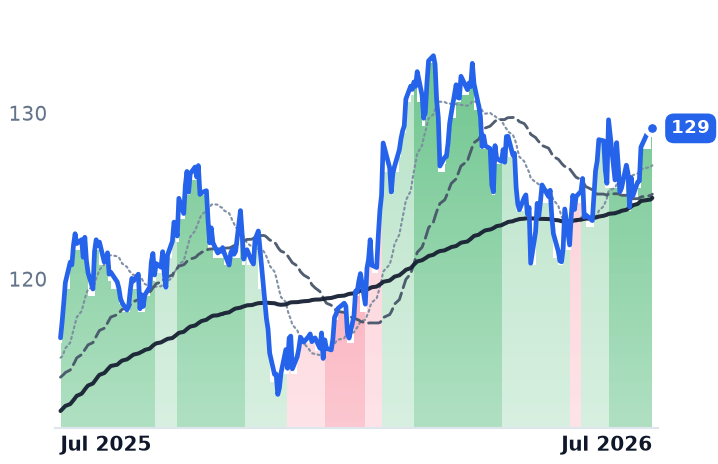
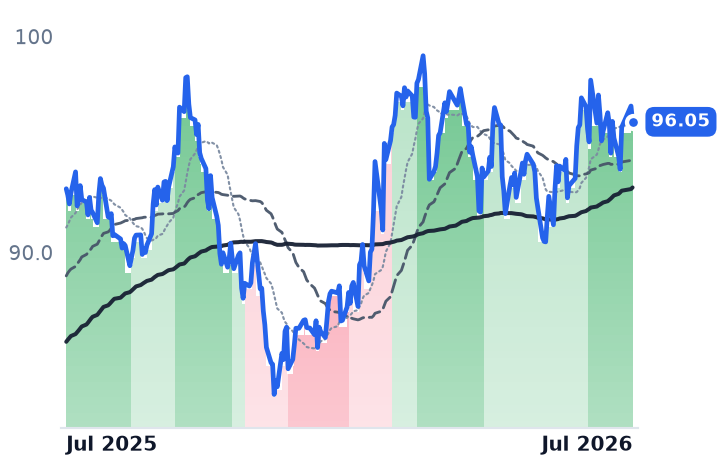
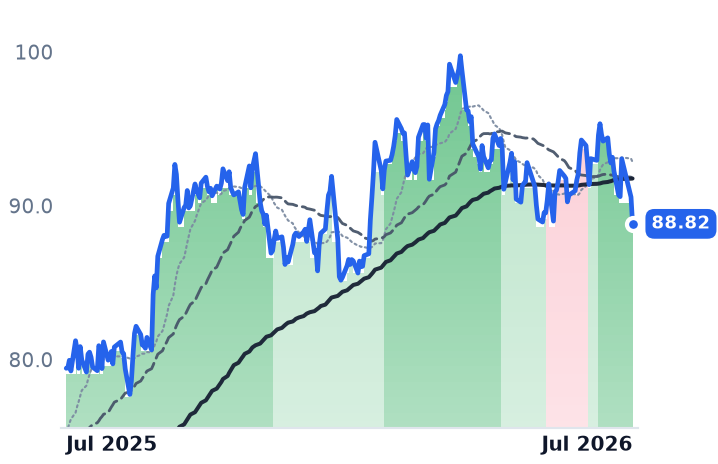
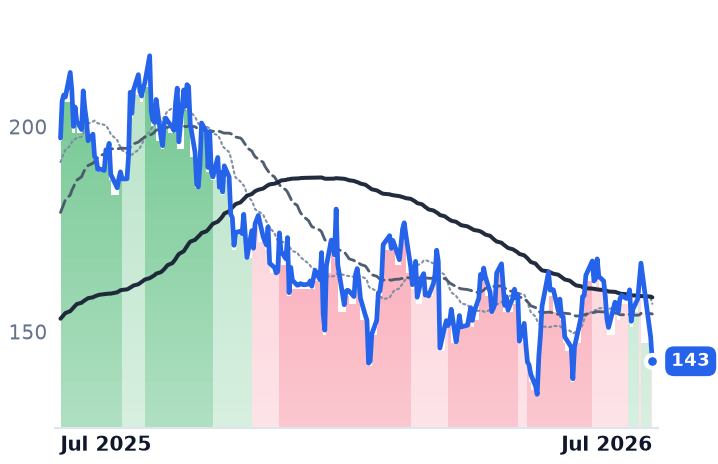
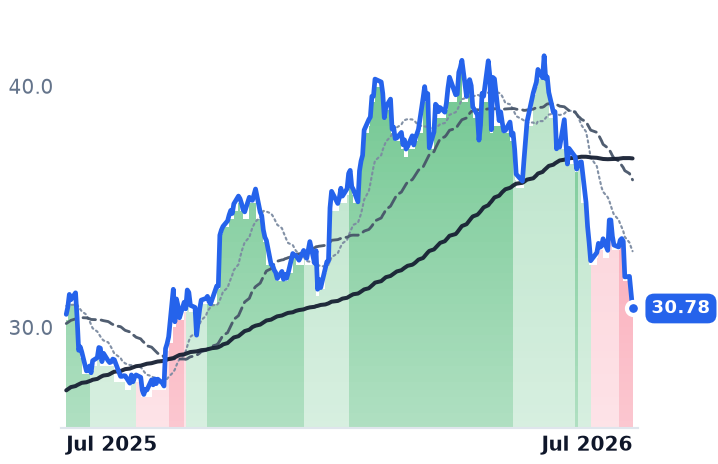
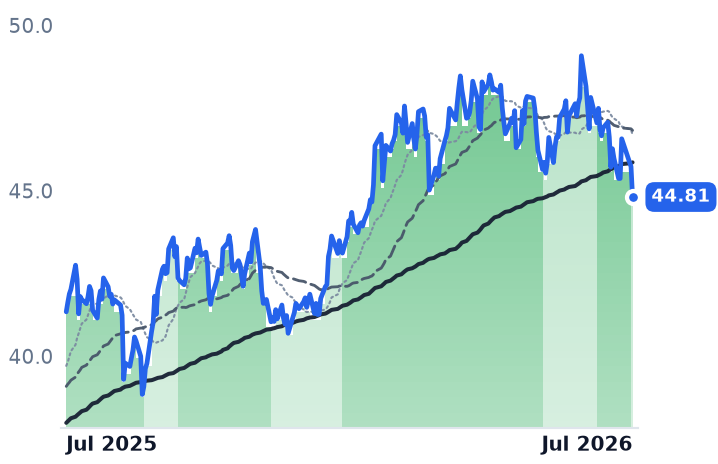
The regulated-utility datacenter cohort's flat 30-day return masks a real bifurcation, but not the one first assumed: core wires names (AEP, D, DUK, SO, SRE, PCG) remain in strongly bullish bands on 60-day-plus streaks, while NextEra and PPL have been in persistent mild-bear bands for over a month — a distinct, deal- and lag-driven story — and it's the merchant/IPP leg (Vistra, Clearway) cracking hardest on earnings and catalyst fatigue.
| Ticker | Company | Segment | Trend · 13mo | 30D | 1Y |
|---|---|---|---|---|---|
| The subject · what this brief is about | |||||
D | Dominion Energy | Vertically Integrated Utilities | 🟢 Cont. Bull | +2.0% | +24.3% |
NEE | NextEra Energy | Vertically Integrated Utilities | ⚠️ Emerging Bear | −0.2% | +25.6% |
DUK | Duke Energy | Vertically Integrated Utilities | 🟢 Cont. Bull | +0.6% | +10.8% |
SO | The Southern | Vertically Integrated Utilities | 🟢 Cont. Bull | −0.7% | +3.3% |
AEP | American Electric Power | Vertically Integrated Utilities | 🟢 Cont. Bull | −6.2% | +21.3% |
ETR | Entergy | Vertically Integrated Utilities | 🟢 Cont. Bull | −7.3% | +24.6% |
PPL | PPL | Transmission & Distribution Only | ⚠️ Emerging Bear | −2.8% | +0.9% |
PCG | PG&E | Vertically Integrated Utilities | 🟢 Cont. Bull | +3.0% | +27.6% |
SRE | Sempra | US Electric & Gas Utilities | 🟢 Cont. Bull | −5.4% | +11.8% |
| Compared against · context, not the story | |||||
VST | Vistra | Integrated Retail & Generation | 🔴 Cont. Bear | −12.1% | −27.6% |
CWEN | Clearway Energy | Wind & Solar Developers | ⚠️ Emerging Bear | −12.5% | +0.8% |
NI | NiSource | Natural Gas Distribution | 🟢 Cont. Bull | −6.9% | +8.4% |
BEP | Brookfield Renewable Partners | Diversified Renewable Generators | 🟢 Cont. Bull | −9.3% | +18.8% |
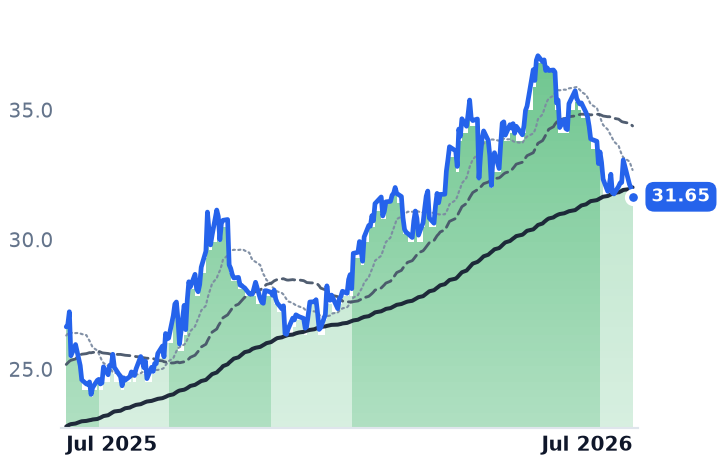
12-month price & trend
| Ticker | Mkt cap | P/E | P/E fwd | P/S | P/S fwd | P/GP | P/GP fwd | EV/EBITDA | FCF yld |
|---|---|---|---|---|---|---|---|---|---|
D | $59.3B | 23.3x | 18.8x | 3.2x | 3.2x | 6.6x | 6.6x | 15.3x | -11.5% |
NEE | $194.7B | 23.8x | 23.1x | 6.9x | 6.3x | 10.3x | 9.4x | 17.3x | 1.2% |
DUK | $97.3B | 18.7x | 18.6x | 2.9x | 2.9x | 4.3x | 4.2x | 11.6x | 1.6% |
| Ticker | Mkt cap | P/E | P/E fwd | P/S | P/S fwd | P/GP | P/GP fwd | EV/EBITDA | FCF yld |
|---|---|---|---|---|---|---|---|---|---|
SO | $106.6B | 22.2x | 20.2x | 3.5x | 3.5x | 8.1x | 8.0x | 12.7x | 2.4% |
AEP | $68.1B | 18.6x | 19.7x | 3.1x | 2.9x | 7.6x | 7.2x | 13.7x | 9.1% |
ETR | $49.6B | 26.8x | 24.2x | 3.7x | 3.6x | 9.5x | 9.1x | 14.4x | -6.3% |
| Ticker | Mkt cap | P/E | P/E fwd | P/S | P/S fwd | P/GP | P/GP fwd | EV/EBITDA | FCF yld |
|---|---|---|---|---|---|---|---|---|---|
PPL | $26.2B | 21.5x | 17.9x | 2.8x | 2.7x | 8.0x | 7.7x | 12.0x | -6.2% |
PCG | $35.5B | 12.0x | 9.8x | 1.4x | 1.3x | 3.0x | 2.9x | 9.2x | -11.9% |
SRE | $54.8B | 23.0x | 16.4x | 4.0x | 4.0x | 12.3x | 12.3x | 17.8x | -10.8% |
| Ticker | Mkt cap | P/E | P/E fwd | P/S | P/S fwd | P/GP | P/GP fwd | EV/EBITDA | FCF yld |
|---|---|---|---|---|---|---|---|---|---|
VST | $47.4B | 23.5x | 15.5x | 3.0x | 2.0x | 22.9x | 15.7x | 10.3x | 2.9% |
CWEN | $6.5B | 793.3x | — | 4.4x | 3.9x | 8.5x | 7.5x | 14.3x | 9.0% |
NI | $20.2B | 22.1x | 20.4x | 2.9x | 2.8x | 5.8x | 5.6x | 11.8x | -5.4% |
| Ticker | Mkt cap | P/E | P/E fwd | P/S | P/S fwd | P/GP | P/GP fwd | EV/EBITDA | FCF yld |
|---|---|---|---|---|---|---|---|---|---|
BEP | $10.6B | 75.5x | — | 1.7x | 1.6x | 6.9x | 6.4x | 10.0x | -44.4% |
Consensus projections
| Ticker | FY2026E | FY2027E | FY2028E | |
|---|---|---|---|---|
D | Revenue | +13.4% | +6.1% | +5.7% |
| EPS | +4.9% | +6.4% | +6.9% | |
NEE | Revenue | +9.0% | +9.3% | +8.6% |
| EPS | +9.4% | +8.8% | +8.4% | |
DUK | Revenue | +5.7% | +4.4% | +4.0% |
| EPS | +6.2% | +6.9% | +7.0% | |
SO | Revenue | +7.7% | +5.5% | +6.1% |
| EPS | +6.8% | +7.5% | +9.2% | |
AEP | Revenue | +9.1% | +5.8% | +7.5% |
| EPS | +7.4% | +7.9% | +10.5% | |
ETR | Revenue | +8.6% | +9.7% | +9.6% |
| EPS | +12.3% | +15.9% | +13.5% | |
PPL | Revenue | +10.6% | +5.4% | +5.6% |
| EPS | +7.8% | +8.6% | +8.3% | |
PCG | Revenue | +4.0% | +3.3% | +3.7% |
| EPS | +9.6% | +9.4% | +9.3% | |
SRE | Revenue | −3.3% | −2.0% | +1.8% |
| EPS | +11.5% | +8.0% | +8.5% | |
VST | Revenue | +20.8% | +8.9% | +4.9% |
| EPS | +89.5% | +20.6% | +16.1% | |
CWEN | Revenue | +17.0% | +11.6% | +12.6% |
| EPS | −164.1% | −148.8% | +63.8% | |
NI | Revenue | +15.3% | +5.7% | +6.3% |
| EPS | +9.2% | +9.4% | +10.1% | |
BEP | Revenue | +6.1% | +11.0% | −0.0% |
| EPS | +4.7% | −20.8% | +4.8% |
Forward fiscal years only. Blank means no analyst coverage for that year.
What the bands actually show
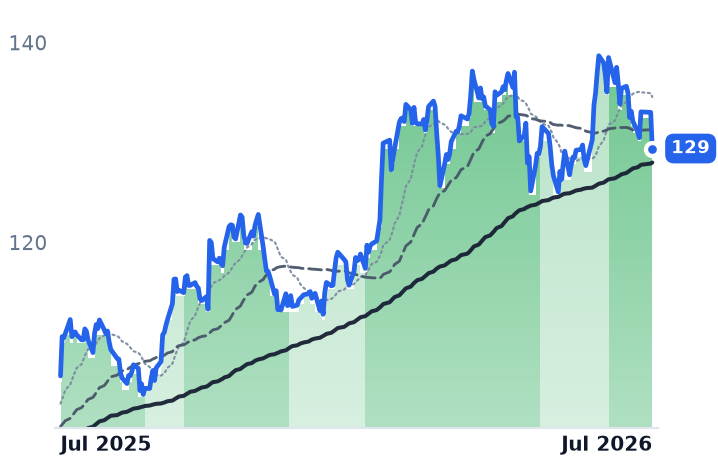
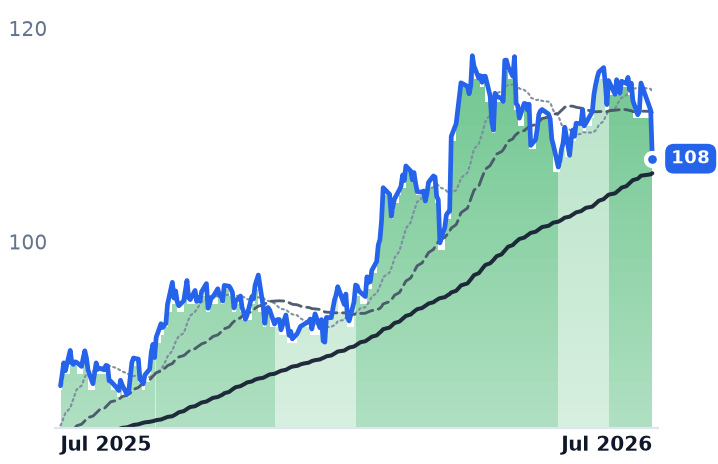
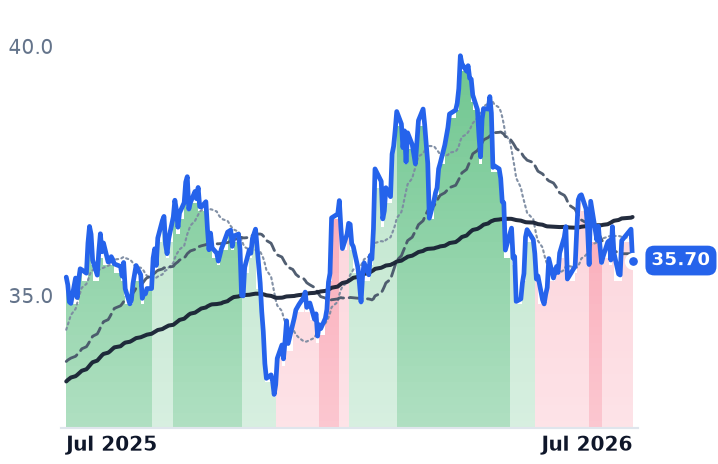
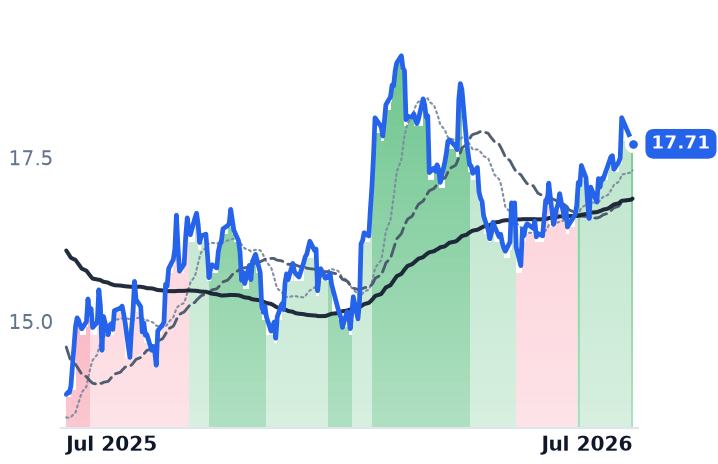
As of 2026-07-28, seven of the nine core names in the cohort — AEP, D, DUK, SO, ETR, SRE and PCG — sit in strongly bullish bands, several with multi-week-to-multi-month streaks intact. The two bear-band members, NextEra (NEE) and PPL, aren't fresh cracks: NEE has been mild-to-strong bear continuously since mid-June, and PPL has been bear-banded since the same window, including a strongly bearish stretch in early July. That reframes the original downgrade narrative — this is persistent underperformance, not a last-week inflection. NEE's weakness traces to a specific catalyst: its $67B all-stock acquisition of Dominion Energy announced May 18, 2026, which creates the largest US regulated utility around AI-datacenter demand but added dilution and integration risk, sending NEE down roughly 5% in the following week. Dominion itself, the acquisition target, has re-rated up 12.3% over 90 days on its Virginia "Data Center Alley" exposure — the opposite of a shared-thesis failure.
The merchant/IPP leg is where the crack is real and fast. Vistra shares fell 3.3% on July 27 as AI-power names weakened broadly with no fresh company catalyst, though its band has been choppy rather than a clean single break, and VST is down 24% over the trailing year — it is not propping up the cohort's annual return as the hypothesis worried. Clearway is unambiguous: added to a Zacks Strong Sell list after a 112% downward EPS revision, trading near 52-week lows with an RSI near 28.
The load-growth case still has substance
Five-year capex plans keep getting revised up on datacenter demand: AEP's rose to $78B with contracted load doubling to 63 GW, Dominion's to $65B with 10.4 GW under signed energy service agreements in Virginia, and Entergy's from $43B to $57B after a new Meta Louisiana contract. Regulatory structure is de-risking these forecasts — Virginia's GS-5 tariff requires 14-year contracts and $1.5M/MW collateral, while Ohio's PUCO-approved AEP large-load tariff mandates 85% minimum-take over 12 years, part of 24 states now with approved large-load tariffs.
The counterweight: cost allocation and cheap grid
Valuations aren't uniformly cheap anymore (SRE ~34x, ETR ~27-30x versus PCG ~12.6x), and political backlash is intensifying: PJM's board is weighing backstop auctions and data-center curtailment after a supply-short capacity auction, FERC issued show-cause orders to six grid operators over large-load interconnection rules, and a federal Ratepayer Protection Act advanced out of committee amid polling showing 7 in 10 Americans oppose new data-center construction. Virginia has also enacted the first state tax on datacenter electricity use. The load-growth thesis remains structurally sound at the wires level, but the flat month reflects a cohort splitting along regulated-versus-merchant lines rather than one uniformly holding.