

Equinix Funds at Investment Grade, Applied Digital Doesn't — the Bond Selloff Showed It
Hypothesis Opus 5 · Research Opus 5 · Writing Opus 5 · Prompt v1.5
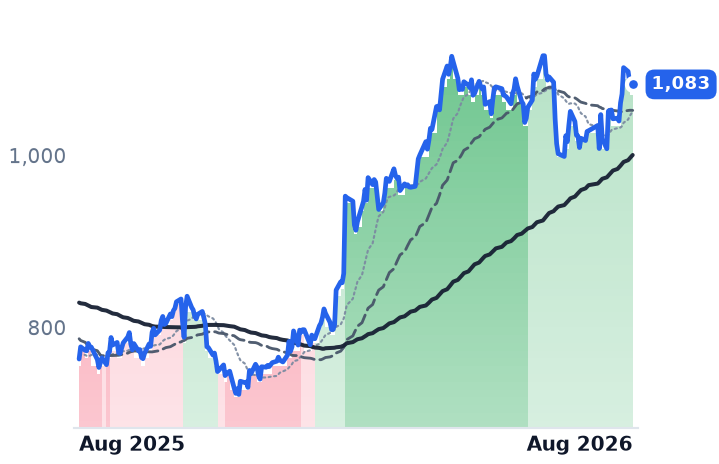
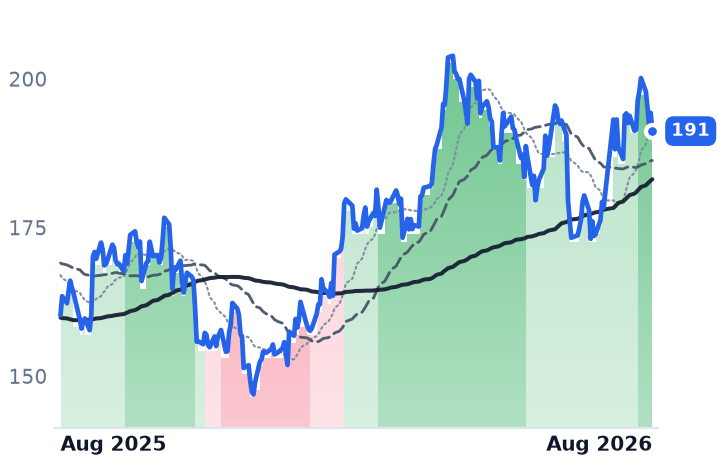
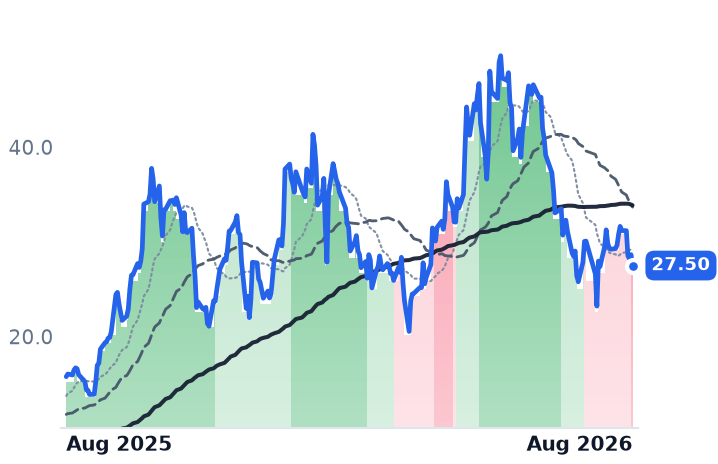
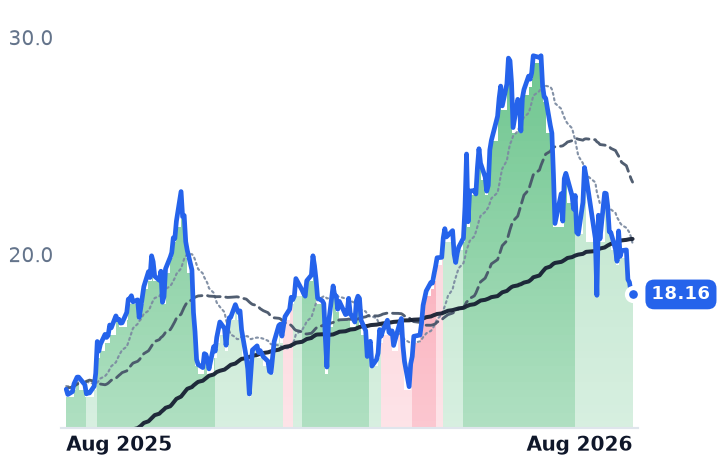
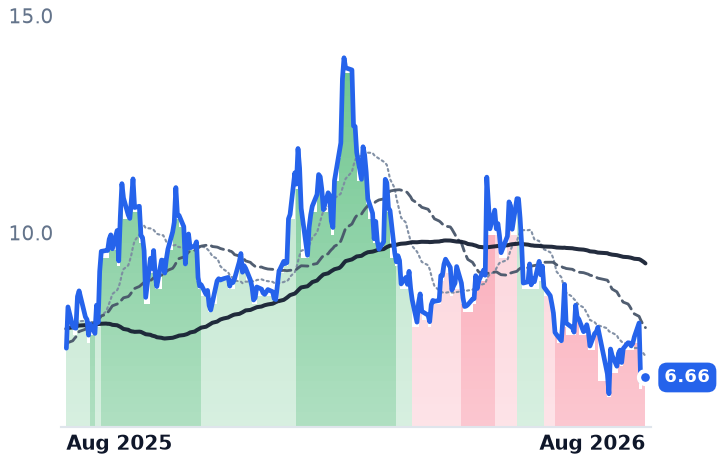
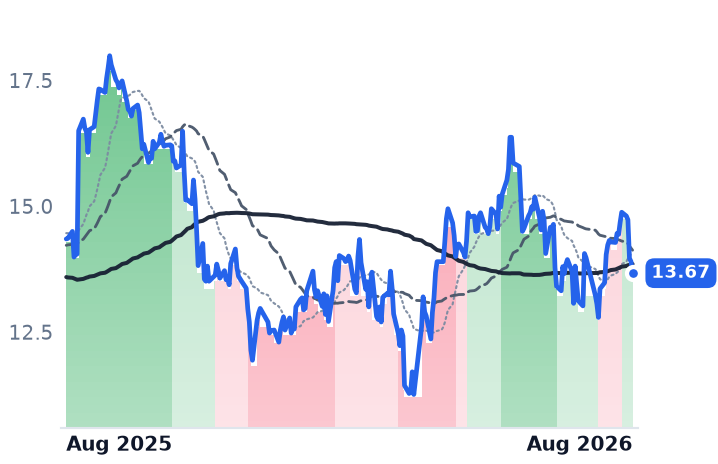
The companies that own AI data halls are usually described as one trade on interest rates. On 18 August, when the 30-year Treasury yield printed its highest level in 19 years, that description broke. Equinix and Digital Realty, the two investment-grade colocation landlords, lost about a point each. Applied Digital, which builds single-tenant AI halls financed on project debt, fell 8.6%; Core Scientific fell 6.7%.
The separation is about credit standing, not duration. Digital Realty is building 1.4 gigawatts at an 11.5% stabilized yield against a 5.32% long bond, and repriced its largest expiring leases 66.7% higher. Applied Digital's gross margin fell from 42.5% to 15.7% in a single quarter and only 175 of its 1,410 contracted megawatts are live. Over 90 days the merchant developers gave back 40% and 28%; the landlords barely moved.
| Ticker | Company | Segment | Trend · 13mo | 30D | 1Y |
|---|---|---|---|---|---|
| The subject · what this brief is about | |||||
EQIX | Equinix | Data Center & Colocation | 🌱 Emerging Bull | +4.0% | +40.1% |
DLR | Digital Realty Trust | Data Center & Colocation | 🟢 Cont. Bull | +7.2% | +19.3% |
APLD | Applied Digital | Data Center & Cloud Infrastructure | ⚠️ Emerging Bear | −8.6% | +74.4% |
| Compared against · context, not the story | |||||
CORZ | Core Scientific | Blockchain & Crypto | 🟢 Cont. Bull | −23.1% | +31.7% |
AMT | American Tower | Wireless & Fiber Infrastructure | 🔴 Cont. Bear | +7.0% | −12.9% |
CCI | Crown Castle | Wireless & Fiber Infrastructure | 🔴 Cont. Bear | −2.0% | −23.5% |
IRM | Iron Mountain Incorporated | Records & Information Management | 🟢 Cont. Bull | −1.8% | +38.7% |
GDS | GDS | Data Center & Cloud Infrastructure | ⚠️ Emerging Bear | −0.3% | +1.9% |
VNET | VNET | Data Center & Cloud Infrastructure | ⚠️ Emerging Bear | −14.8% | −9.2% |
NXT.AX | NEXTDC | Information Technology Services | 🌱 Emerging Bull | −2.2% | −4.7% |
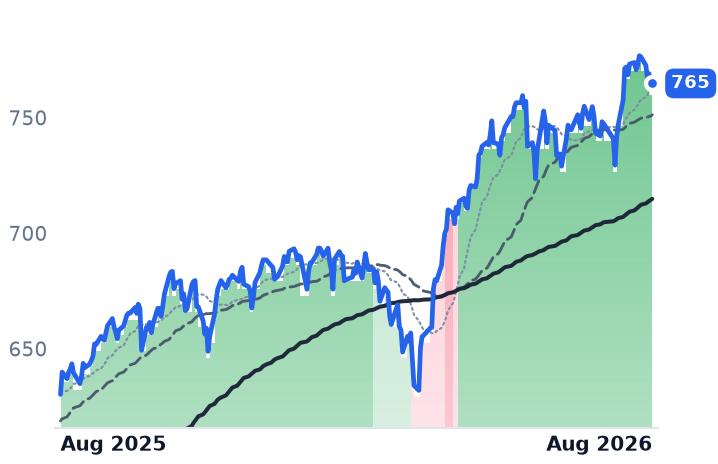
SPY | State Street SPDR S&P 500 ETF Trust | Asset Management | 🟢 Cont. Bull | +2.3% | +21.4% |
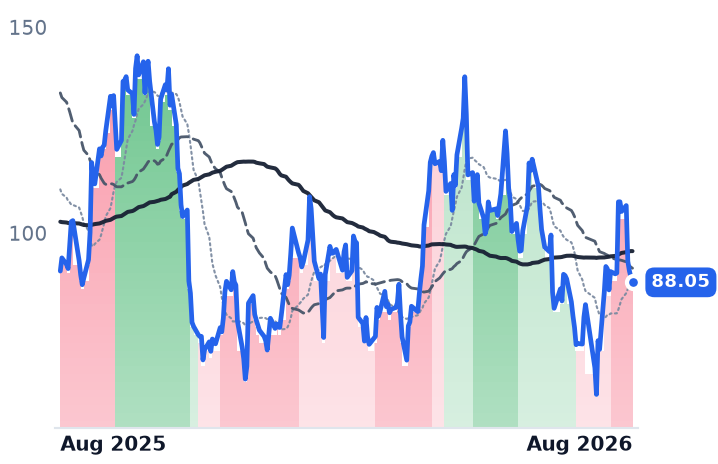
CRWV | CoreWeave | Cloud GPU Computing | 🔴 Cont. Bear | +6.5% | −3.0% |
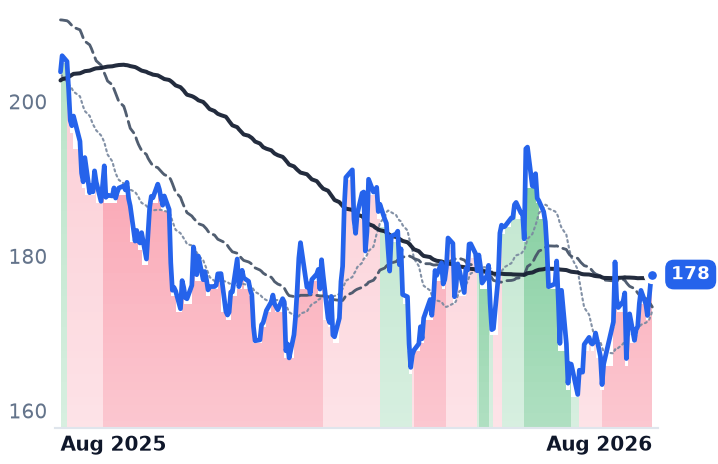
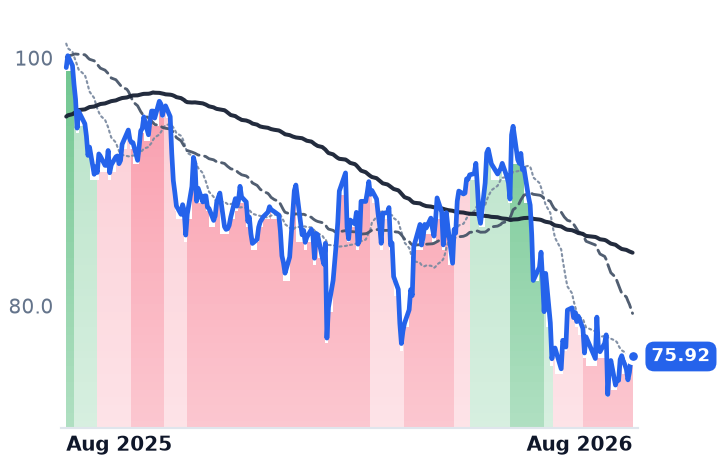
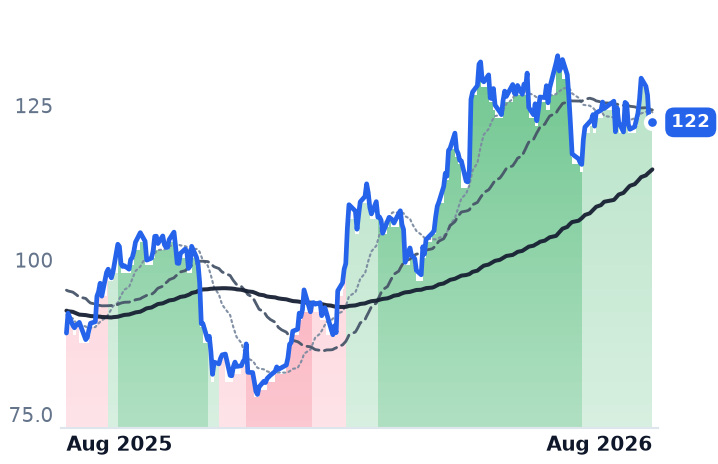
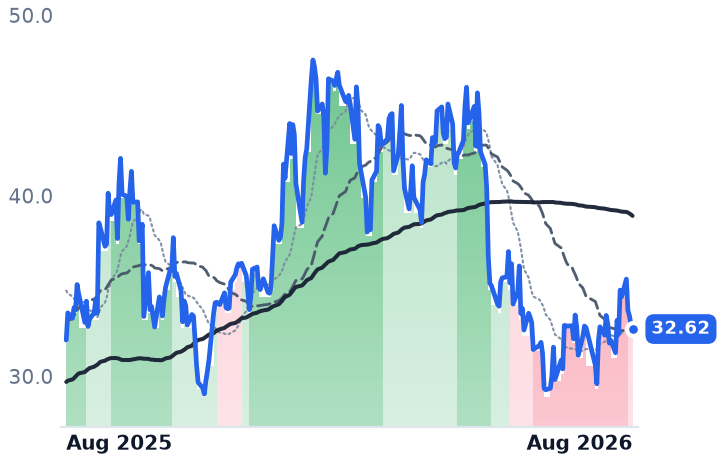
12-month price & trend
| Ticker | Mkt cap | P/E | P/E fwd | P/S | P/S fwd | P/GP | P/GP fwd | EV/EBITDA | FCF yld |
|---|---|---|---|---|---|---|---|---|---|
EQIX | $105.1B | 68.3x | 61.8x | 10.7x | 10.2x | 20.7x | 19.8x | 28.4x | 1.3% |
DLR | $70.5B | 87.8x | 70.4x | 10.3x | 10.0x | 74.8x | 72.4x | 25.5x | 1.9% |
APLD | $7.8B | n/m | — | 13.6x | 9.6x | 60.7x | 42.7x | n/m | -35.4% |
| Ticker | Mkt cap | P/E | P/E fwd | P/S | P/S fwd | P/GP | P/GP fwd | EV/EBITDA | FCF yld |
|---|---|---|---|---|---|---|---|---|---|
CORZ | $5.7B | n/m | — | 13.0x | 8.4x | 46.0x | 29.8x | n/m | -16.9% |
AMT | $80.4B | 23.7x | 25.1x | 7.3x | 7.3x | 10.0x | 10.0x | 17.6x | 4.9% |
CCI | $33.0B | 30.6x | 38.2x | 7.9x | 8.2x | 12.6x | 12.9x | 20.4x | 7.3% |
| Ticker | Mkt cap | P/E | P/E fwd | P/S | P/S fwd | P/GP | P/GP fwd | EV/EBITDA | FCF yld |
|---|---|---|---|---|---|---|---|---|---|
IRM | $36.3B | 87.0x | 50.5x | 4.8x | 4.5x | 8.8x | 8.3x | 22.2x | -1.3% |
GDS | $6.4B | 12.2x | — | 3.6x | — | 14.9x | — | 14.0x | -1.8% |
VNET | $1.9B | n/m | — | 1.2x | — | 5.8x | — | 9.7x | -58.2% |
| Ticker | Mkt cap | P/E | P/E fwd | P/S | P/S fwd | P/GP | P/GP fwd | EV/EBITDA | FCF yld |
|---|---|---|---|---|---|---|---|---|---|
NXT.AX | $10.2B | n/m | — | 22.6x | 14.0x | 730.6x | 453.6x | 57.5x | -16.2% |
SPY | $773.0B | — | — | — | — | — | — | — | — |
CRWV | $46.6B | n/m | — | 7.5x | 3.7x | 10.8x | 5.3x | 25.7x | -22.8% |
Consensus projections
| Ticker | FY2026E | FY2027E | FY2028E | |
|---|---|---|---|---|
EQIX | Revenue | +11.0% | +10.6% | +11.4% |
| EPS | +16.8% | +9.3% | +10.4% | |
DLR | Revenue | +16.9% | +11.1% | +14.1% |
| EPS | −26.0% | −5.5% | +25.1% | |
APLD | Revenue | +98.7% | +92.0% | +149.5% |
| EPS | −24.3% | +9.0% | −74.8% | |
CORZ | Revenue | +89.1% | +70.2% | +50.6% |
| EPS | +143.1% | −107.0% | +161.6% | |
AMT | Revenue | +4.0% | +3.3% | +5.9% |
| EPS | +34.5% | +1.4% | +10.5% | |
CCI | Revenue | −5.0% | +1.3% | +2.3% |
| EPS | +112.8% | +44.5% | +5.5% | |
IRM | Revenue | +16.8% | +8.6% | +7.7% |
| EPS | +20.4% | +9.9% | +15.9% | |
GDS | Revenue | +12.5% | +10.4% | +24.4% |
| EPS | −33.0% | −82.7% | +60.1% | |
VNET | Revenue | +20.5% | +22.0% | +20.8% |
| EPS | −32.3% | −239.3% | +74.3% | |
NXT.AX | Revenue | +13.5% | +49.6% | +51.1% |
| EPS | +111.5% | +95.8% | +22.2% | |
CRWV | Revenue | +147.1% | +98.0% | +60.2% |
| EPS | +194.1% | −65.7% | −325.8% |
Forward fiscal years only. Blank means no analyst coverage for that year.
On 18 August the 30-year Treasury yield topped 5.33%, its highest in 19 years, on a global bond selloff and worry about a US debt load nearing $40 trillion. Long-duration assets sold off. But the companies that own the buildings artificial-intelligence computing runs inside did not sell off together, and the gap between them was wide enough to rule out a common cause.
Equinix, which rents rack space, power and network cross-connects in 273-plus data centers across 36 countries to more than 10,000 customers, closed down 1.1% that session. Digital Realty, the wholesale landlord that leases whole halls to hyperscale tenants from a fleet of 309 facilities holding roughly 3.0 gigawatts of live capacity, fell 1.3%. Applied Digital, a former crypto miner that now builds single-tenant AI campuses in North Dakota, dropped 8.6%. Core Scientific, which converted mining sites to compute hosting after emerging from Chapter 11, fell 6.7%.
Same tenants, different balance sheets
The two rungs sell adjacent products to overlapping customers. What differs is who carries the financing risk. Digital Realty funds at investment-grade spreads, sits at 4.7x debt-to-EBITDA against a 5.5x internal ceiling, and has about $6bn of liquidity. Applied Digital's equity is a levered residual on project debt raised against contracts with tenants that are themselves borrowers. That distinction became visible in the credit market this spring: CoreWeave's $3.1bn delayed-draw facility closed in May was collateralized by two non-investment-grade customer contracts and priced at a higher rate than the prior facility backed by Meta-anchored paper. CoreWeave, Applied Digital's anchor tenant, disclosed $35.6bn of total debt in its second quarter.
When the long end moves, the landlord's spread narrows. The developer's financing question reopens.
The landlords' numbers are accelerating
Equinix's revenue growth ran 5.2% in the third quarter of 2025 and reached 16.4% in the second quarter of 2026, on revenue of $2.625bn. Operating margin widened to 25.3% from 21.9%. Annualized gross bookings were $424m, up 23%, and churn improved to 1.8%. Management raised 2026 guidance by the largest increment in company history, to 11-12% revenue growth and 10-12% growth in adjusted funds from operations (AFFO) per share. Diluted shares rose 1.1%.
Digital Realty is the sharper case. Cash rents on renewals rose a record 25.4%, and on leases above one megawatt they rose 66.7% — the pricing power sits in the hyperscale sockets, not the retail ones. Backlog reached a record $1.9bn of annualized rent at full share, up 75% since January and equal to roughly 30% of in-place data-center revenue. It has $20bn under construction, of which 1.4 gigawatts is 63% pre-leased at an 11.5% average stabilized yield — six points of spread over the 5.32% long bond. That cushion matters because construction costs keep climbing: the average global build ran $10.7m per megawatt in 2025 against $7.7m in 2020, with a further 6% rise forecast for 2026.
What the developers are earning
Applied Digital's fiscal fourth-quarter revenue rose 580.7% to $258.7m, and it holds about 1,410 megawatts of contracted load worth roughly $36bn over 15-year take-or-pay terms. Only 175 megawatts is live — 12%. Gross margin fell to 15.7% from 42.5% the prior quarter, the full-year operating loss was -$236m, and trailing free cash flow runs at -35.4% of market value. Diluted shares went from 201.2m to 275.2m in one fiscal year, alongside $450m of convertible notes. Core Scientific grew revenue 108.8% to $164.2m and lost $1.155bn in the quarter. Neither has an earnings multiple to anchor; Applied Digital trades at 60.7x trailing gross profit.
The rate explanation fails a simpler test. American Tower and Crown Castle, which own cell towers and no AI load at all, fell 15.3% and 26.2% over twelve months. Equinix rose 38.5% and Digital Realty 16.8%. A shared duration factor cannot open a 50-point gap.
Where the price sits
Equinix's guided 2026 AFFO is $42.69-$43.29 per share; at $1,069.50 that is about 24.9x the midpoint, at or just below the bottom of the 25-30x forward multiple the stock has historically commanded as the sector's most expensive name. The trailing price/earnings ratio of 68.3x is a depreciation artifact. Digital Realty's guided 2026 core funds from operations is $8.15-$8.20, putting it near 23.4x against a historic 22-25x — but its share count rose 4.6% year on year on the Blackstone and Columbia Capital deals, so per-share growth is being bought.
Over 90 days Applied Digital fell 40.0% and Core Scientific 28.1%, while Equinix and Digital Realty were within half a point of unchanged. The AI leasing story did not weaken. The cost of financing it without an investment-grade rating did.
The setup
Where it stands — The investment-grade data-center landlords held through the bond selloff; the project-debt developers absorbed six to eight times the hit.
Would confirm — Digital Realty converts backlog on schedule with stabilized development yields staying above 11% into 2027.
Would invalidate — Applied Digital energizes a large share of its 1,410 contracted megawatts and gross margin recovers toward 40%.
Watch next — Equinix's third-quarter report in late October, against 11-12% guided 2026 revenue growth.
Valuation — Equinix 24.9x guided 2026 AFFO versus a 25-30x history; Digital Realty 23.4x core FFO versus 22-25x.