

Group 1 Answered a 26.1% Profit Drop by Buying Ten Atlanta Dealerships for $1.3bn
Hypothesis Opus 5 · Research Opus 5 · Writing Opus 5 · Prompt v1.6
Group 1 Automotive trades at 7.68x forward earnings against 12.50x trailing — the widest gap between the two readings among the listed franchised dealer groups, and roughly half Lithia's forward multiple. That discount is not a verdict on the business as reported.
The June quarter was a genuine deterioration: revenue fell 5.6%, operating income 22.4%, and adjusted earnings of $9.61 a share landed well under the $11.01 consensus. Alongside the miss, the company agreed to buy ten Atlanta dealerships carrying about $1.7bn of annualized revenue.
The service drive still works — same-store customer-pay gross profit up 6% — but it works at every dealer group. What the forward multiple embeds is $50m of annualized cost cuts not yet visible in reported expense, and an acquisition that has not closed.
| Ticker | Company | Segment | Trend · 13mo | 30D | 1Y |
|---|---|---|---|---|---|
| The subject · what this brief is about | |||||
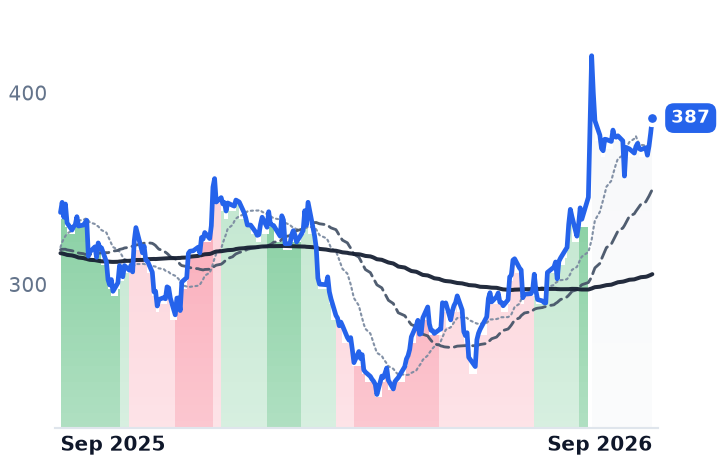
LAD | Lithia Motors | Traditional Dealership Groups | 🌱 Emerging Bull | +3.0% | +14.6% |
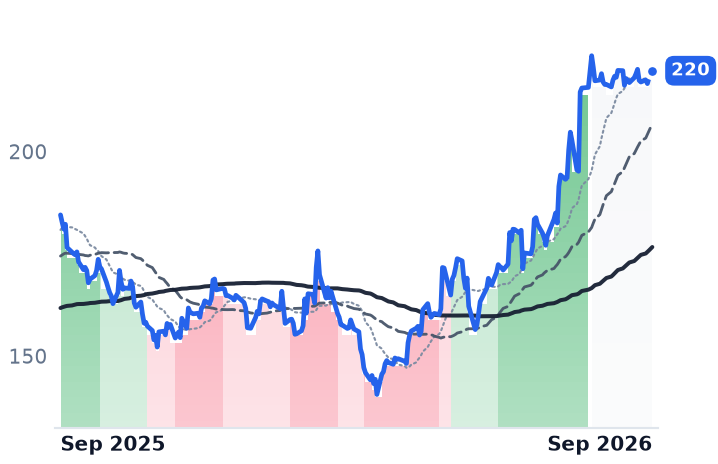
PAG | Penske Automotive | Traditional Dealership Groups | 🌱 Emerging Bull | +1.6% | +19.1% |
| Compared against · context, not the story | |||||
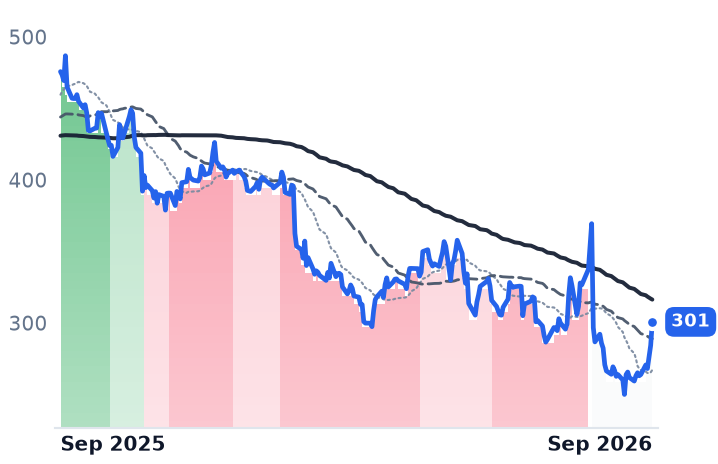
GPI | Group 1 Automotive | Traditional Dealership Groups | 🔴 Cont. Bear | +12.9% | −36.8% |
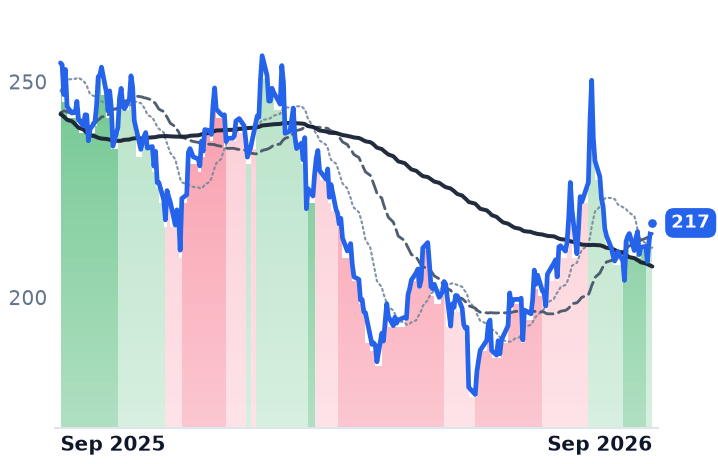
ABG | Asbury Automotive | Traditional Dealership Groups | 🟢 Cont. Bull | +1.4% | −14.6% |
AN | AutoNation | Traditional Dealership Groups | 🟢 Cont. Bull | +1.5% | −6.5% |
SAH | Sonic Automotive | Traditional Dealership Groups | 🌱 Emerging Bull | −1.7% | −0.8% |
RUSHA | Rush Enterprises | Commercial Truck Dealerships | 🟢 Cont. Bull | −36.4% | −11.5% |
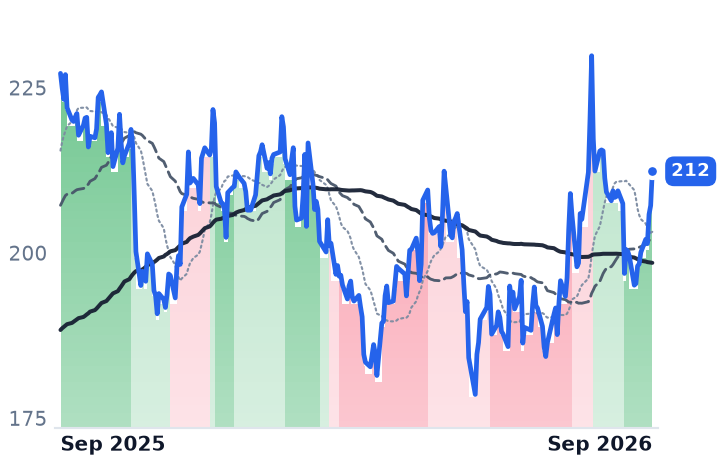
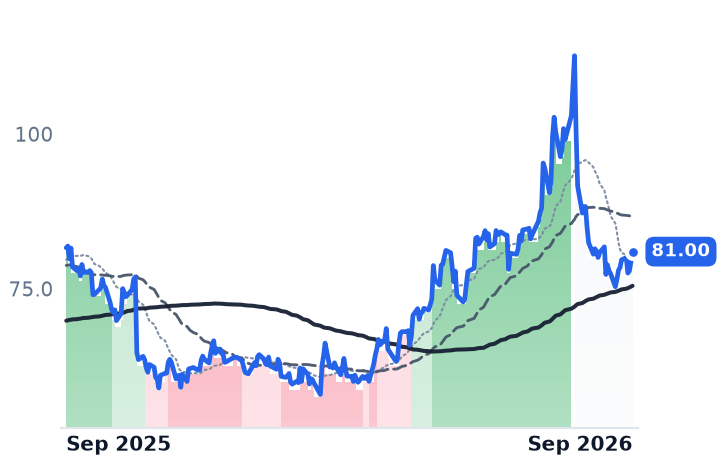
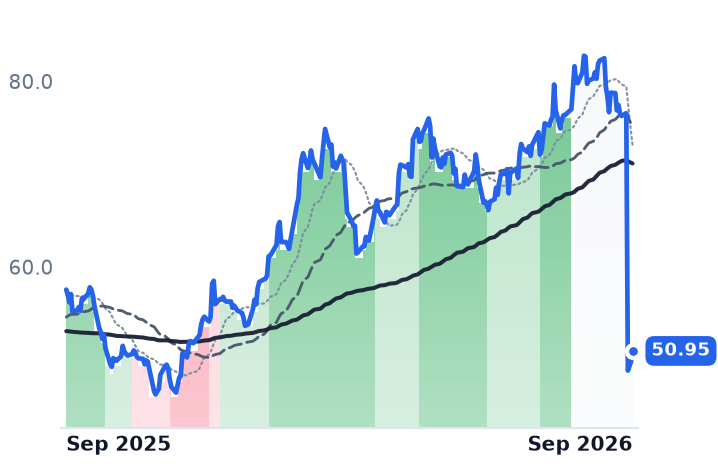
12-month price & trend
| Ticker | Mkt cap | P/E | P/E fwd | P/S | P/S fwd | P/GP | P/GP fwd | EV/EBITDA | FCF yld |
|---|---|---|---|---|---|---|---|---|---|
GPI | $3.6B | 12.5x | 7.7x | 0.2x | 0.2x | 1.0x | 1.0x | 11.4x | 3.9% |
LAD | $8.5B | 12.8x | 10.7x | 0.2x | 0.2x | 2.0x | 2.0x | 17.5x | -5.9% |
ABG | $4.0B | 8.1x | 8.2x | 0.2x | 0.2x | 1.3x | 1.3x | 8.9x | 12.3% |
| Ticker | Mkt cap | P/E | P/E fwd | P/S | P/S fwd | P/GP | P/GP fwd | EV/EBITDA | FCF yld |
|---|---|---|---|---|---|---|---|---|---|
PAG | $14.4B | 16.2x | 16.2x | 0.4x | 0.4x | 2.7x | 2.7x | 13.7x | 4.1% |
AN | $6.9B | 9.4x | 9.5x | 0.3x | 0.2x | 1.4x | 1.4x | 11.1x | 0.2% |
SAH | $2.7B | 12.7x | 11.7x | 0.2x | 0.2x | 1.1x | 1.1x | 11.0x | -2.0% |
| Ticker | Mkt cap | P/E | P/E fwd | P/S | P/S fwd | P/GP | P/GP fwd | EV/EBITDA | FCF yld |
|---|---|---|---|---|---|---|---|---|---|
RUSHA | $5.7B | 14.5x | 19.9x | 0.8x | 0.7x | 4.2x | 3.9x | 13.0x | 2.2% |
Consensus projections
| Ticker | FY2026E | FY2027E | FY2028E | |
|---|---|---|---|---|
GPI | Revenue | −1.4% | +5.4% | +3.6% |
| EPS | −5.3% | +12.2% | +13.9% | |
LAD | Revenue | +1.8% | +3.6% | +5.0% |
| EPS | +2.6% | +16.7% | +12.2% | |
ABG | Revenue | −2.2% | +4.2% | +7.0% |
| EPS | −5.9% | +14.9% | +9.5% | |
PAG | Revenue | +6.7% | +2.5% | +2.2% |
| EPS | +1.0% | +6.6% | +7.0% | |
AN | Revenue | −0.4% | +3.2% | +2.1% |
| EPS | +9.1% | +13.5% | +13.9% | |
SAH | Revenue | +3.5% | +4.5% | +5.4% |
| EPS | +5.2% | +10.5% | +8.8% | |
RUSHA | Revenue | +5.2% | +10.5% | +5.5% |
| EPS | +18.2% | +23.5% | +21.7% |
Forward fiscal years only. Blank means no analyst coverage for that year.
A miss, then a deal
Group 1 Automotive followed a quarter in which profit fell by more than a quarter by agreeing to pay roughly $1.3bn for ten Atlanta dealerships. In the June quarter the company — which runs 204 dealerships and 273 franchises across 17 American states and 35 British towns — saw revenue fall 5.6% to $5.385bn, operating income fall 22.4% and net income fall 26.1% from a year earlier. Adjusted earnings of $9.61 a share came in against consensus of $11.01, and the shares fell 15.7% on the print.
What makes the sequence worth following is where it left the valuation. Group 1, the smallest of the six listed franchised dealer groups at a $3.59bn market value, trades at 12.50x trailing earnings but only 7.68x the forward estimate — the widest trailing-to-forward gap in the group and roughly half Lithia Motors' forward multiple. That is not a market judgment that the business is cheap today. It is consensus counting two things that have not yet reached the income statement: $50m of annualized cost reductions running for a full year, and Hennessy Automobile Companies' revenue.
What broke, and what didn't
The damage sits in the front end, where the constraint is inventory rather than demand. "Sourcing is a big challenge right now, one, because the SAAR was depressed in the first quarter, so there were fewer trades," chief executive Daryl Kenningham told investors, referring to the seasonally adjusted annual rate of US vehicle sales. Used-vehicle gross profit per unit fell about 3%; new-vehicle gross held above $3,250 for a third consecutive quarter at $3,313.
The repair bays held up. US after-sales gross profit reached a new quarterly high, with same-store customer-pay gross profit up 6% on repair orders up 2.5% and technician headcount up 3%. That is the industry pattern rather than a Group 1 edge: gross profit per new vehicle at the average US franchised dealership fell 13.5% year over year to $1,840 in the second quarter while fixed operations produced 52.8% of total dealership gross profit, against 50.1% a year earlier. Nor is there rate relief underneath: the Federal Reserve left the funds rate at 3.50-3.75% for a fifth consecutive meeting in July, with three members dissenting in favor of an increase.
The arithmetic behind the discount
By the end of April, Group 1 had eliminated 700 US roles for about $35m of annual savings, plus $15m from cutting contracts and vendors — $50m annualized, roughly $12.5m a quarter starting in the June period, chief financial officer Daniel McHenry told investors, with technician hiring and training deliberately protected. The Hennessy purchase adds about $1.7bn of annualized revenue for roughly $1.3bn, of which about $1bn is goodwill, and is expected to close by year-end 2026.
Against peers the discount is real, and so is the reason for it. Lithia Motors, which sells under the Lithia, Driveway and GreenCars brands and finances its own customers, trades at 12.77x trailing and 10.70x forward after a 16.6% twelve-month gain. Asbury Automotive, another franchised group, is the cheapest on earnings at 8.11x trailing and 8.22x forward, with a 12.3% trailing free-cash-flow yield and net leverage of 3.4x against its own 3.0x target. Group 1 is valued at 1.03x its gross profit; Lithia at 2.03x. Group 1's shares closed at $300.76 on September 4, down 36.0% over twelve months from $470.28, having bounced 13.9% over the preceding five sessions.
The verdict
The business earns part of the de-rating: operating income down more than a fifth on falling revenue is real deterioration, and the service annuity carrying every dealer group carries this one too — table stakes, not differentiation. What the forward multiple embeds is neither. It is a cost program whose quarterly benefit is known but unproven in reported expense, and an acquisition whose earnings begin only when it closes. If both arrive, 7.68x will look like an obvious mispricing in hindsight. If either slips, the trailing 12.50x is the honest number, and it is no bargain.
Every dealer group now tells the same story about the service drive. Group 1 is the one asking shareholders to pay about $1bn of goodwill to buy more of it.