

Tetra Tech's Gross Profit Fell as Its Shares Rose 41%. MYR Group's Did the Opposite.
Hypothesis Opus 5 · Research Opus 5 · Writing Opus 5 · Prompt v1.5
Four firms that design, permit and build the physical connection between data-center campuses and the power grid reported quarters between 30 July and 11 August. All four posted record order books. The market then paid up for the one whose profits are shrinking and marked down the one whose profits nearly doubled.
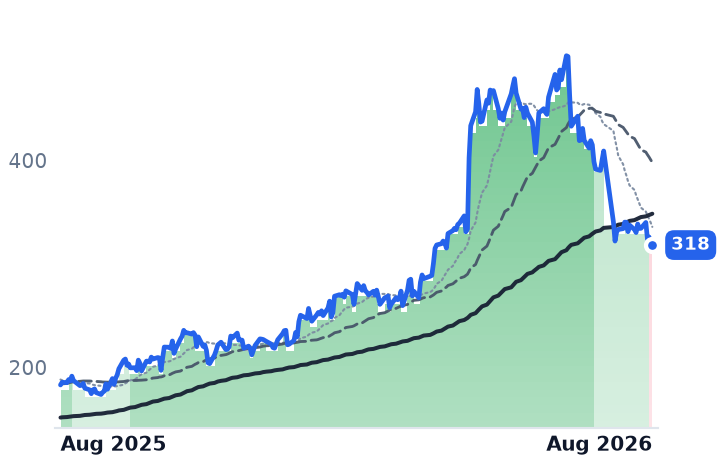
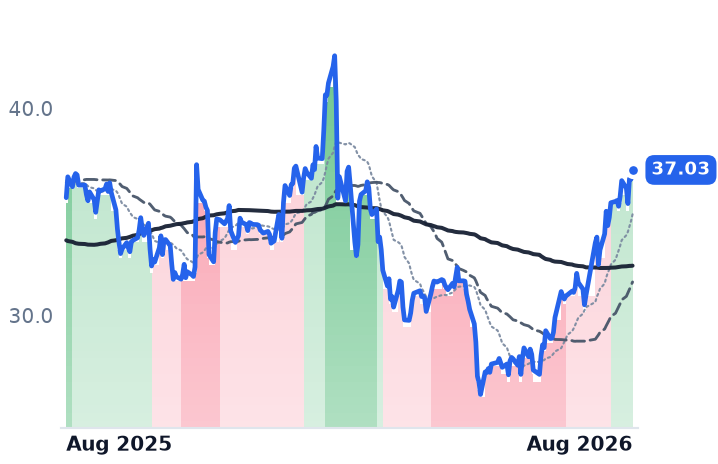
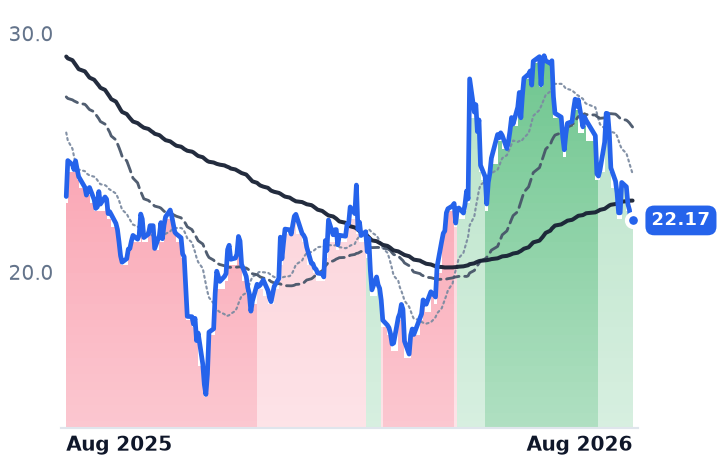
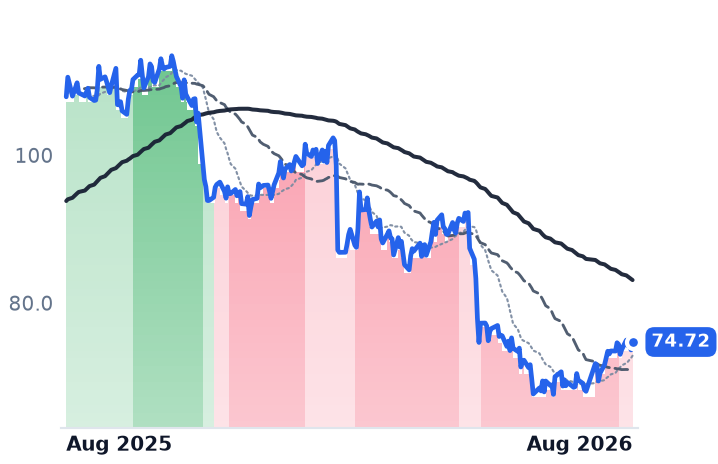
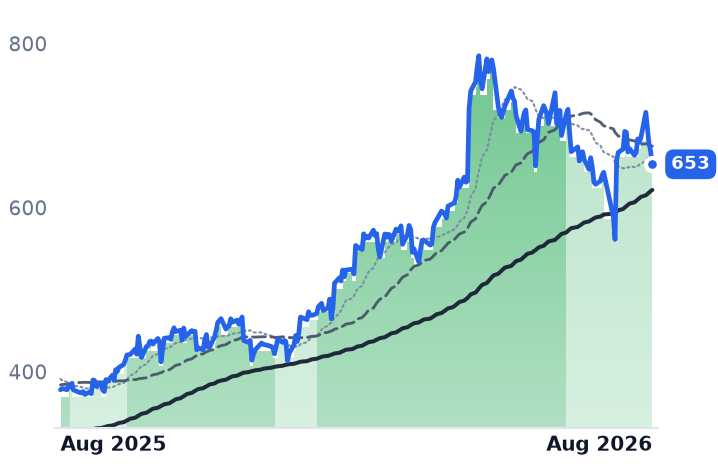
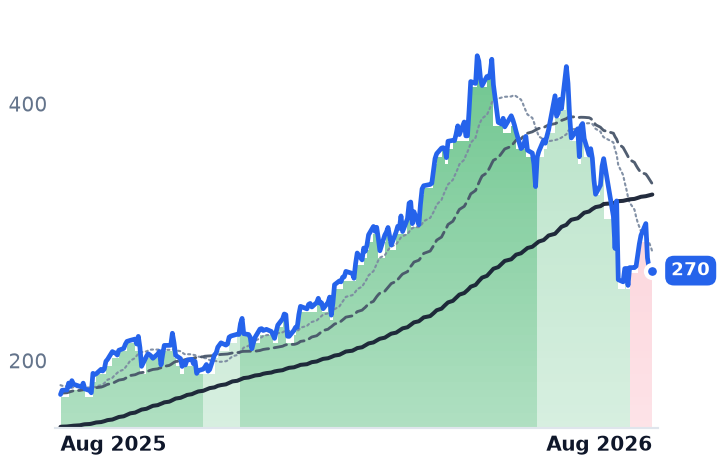
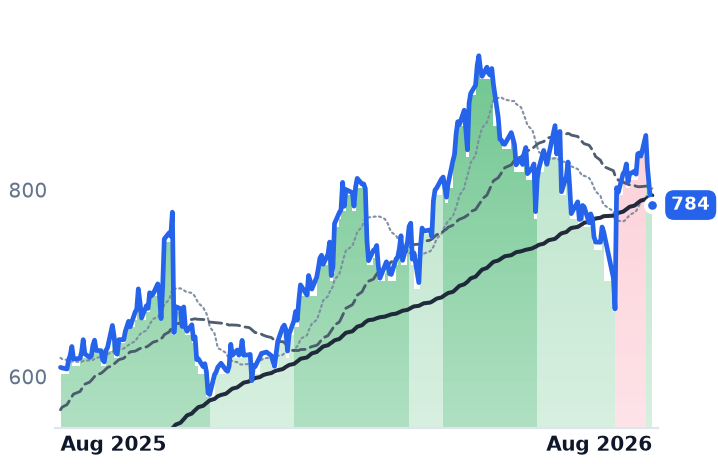
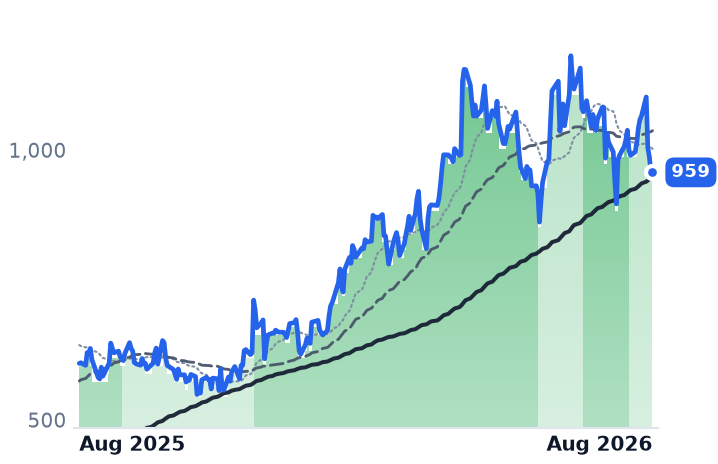
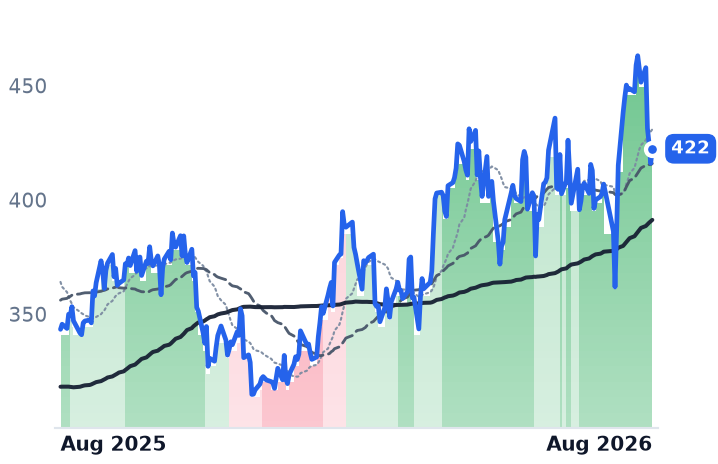
Tetra Tech, a consulting engineer, grew revenue 13.5% last quarter while gross profit fell 3.3%; its shares have risen 41% since mid-May and now trade at 23.5x forward earnings, above the 22.2x trailing. MYR Group, the contractor that actually builds substations, grew gross profit 39% to a 13.2% margin on record backlog, and fell 22% in a month.
Part of the gap is timing — MYR Group's largest transmission awards bill no revenue until late 2027. The rest is not obviously explained by either business.
| Ticker | Company | Segment | Trend · 13mo | 30D | 1Y |
|---|---|---|---|---|---|
| The subject · what this brief is about | |||||
MYRG | MYR | Electrical & Power Infrastructure | 🟢 Cont. Bull | −22.2% | +73.8% |
TTEK | Tetra Tech | Design & Engineering Consulting | 🔴 Cont. Bear | +19.5% | +3.8% |
WSC | WillScot | Modular & Portable Storage | 🌱 Emerging Bull | −15.9% | −4.3% |
| Compared against · context, not the story | |||||
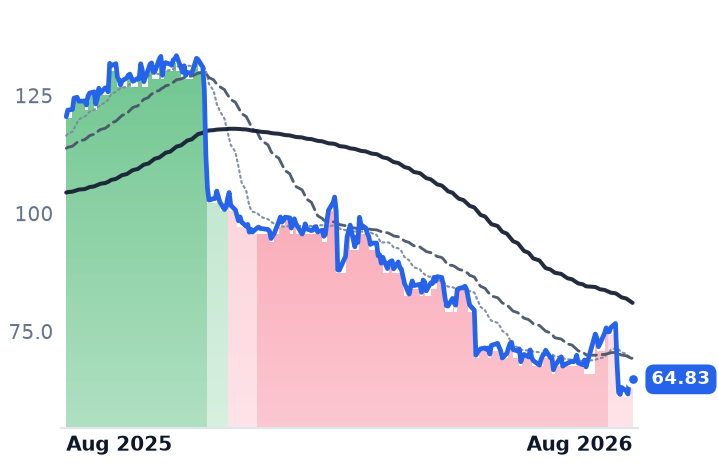
ACM | Aecom | Design & Engineering Consulting | 🔴 Cont. Bear | −3.9% | −46.2% |
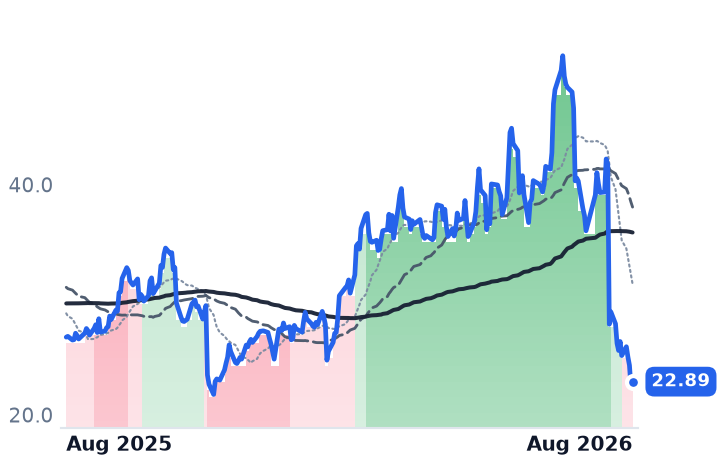
UTI | Universal Technical Institute | Career & Technical Training | 🌱 Emerging Bull | −36.4% | −14.4% |
STN | Stantec | Design & Engineering Consulting | 🔴 Cont. Bear | +9.8% | −30.8% |
WSP.TO | WSP Global | Engineering & Construction | 🔴 Cont. Bear | +11.3% | −30.7% |
PWR | Quanta Services | Electrical & Power Infrastructure | 🟢 Cont. Bull | +1.5% | +72.7% |
MTZ | MasTec | Electrical & Power Infrastructure | 🟢 Cont. Bull | −24.4% | +55.5% |
EME | EMCOR | Electrical & Power Infrastructure | 🟢 Cont. Bull | +3.8% | +28.5% |
PRIM | Primoris Services | Energy & Power Project Solutions | ⚠️ Emerging Bear | −12.4% | −29.7% |
VRT | Vertiv | Data Center Power & Thermal | 🟢 Cont. Bull | −13.9% | +105.1% |
GEV | GE Vernova | GE Vernova Integrated | 🟢 Cont. Bull | −2.7% | +58.5% |
ETN | Eaton | Power & Propulsion Systems | 🟢 Cont. Bull | +3.8% | +23.0% |
POWL | Powell Industries | Electrical Distribution & Switchgear | 🟢 Cont. Bull | −17.9% | +136.5% |
STRL | Sterling Infrastructure | Infrastructure & Civil Construction | 🟢 Cont. Bull | −28.6% | +84.6% |
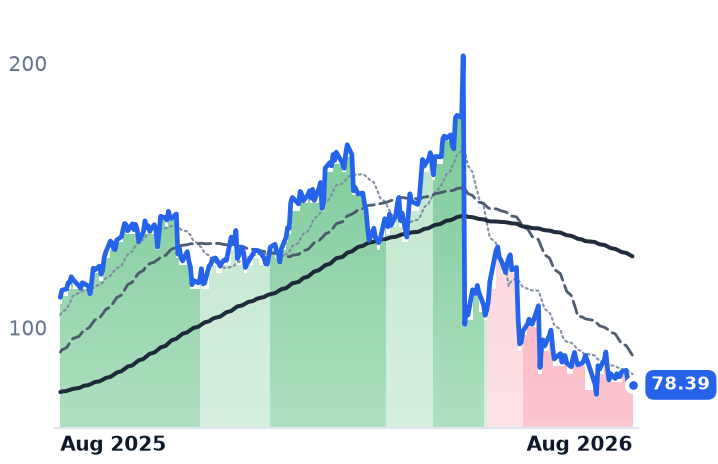
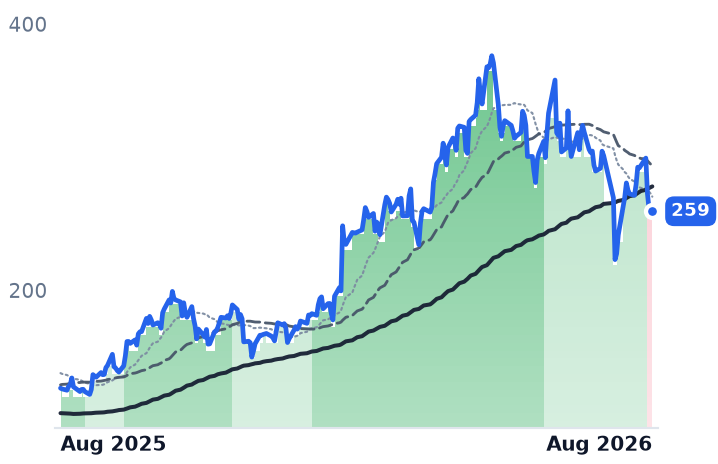
12-month price & trend
| Ticker | Mkt cap | P/E | P/E fwd | P/S | P/S fwd | P/GP | P/GP fwd | EV/EBITDA | FCF yld |
|---|---|---|---|---|---|---|---|---|---|
MYRG | $4.8B | 29.2x | 25.5x | 1.2x | 1.1x | 9.7x | 8.9x | 16.2x | 4.0% |
TTEK | $9.6B | 22.2x | 23.5x | 1.9x | 2.2x | 10.1x | 11.7x | 15.6x | 5.7% |
ACM | $8.4B | 29.5x | 16.4x | 0.5x | 1.1x | 9.6x | 19.8x | n/m | 2.4% |
| Ticker | Mkt cap | P/E | P/E fwd | P/S | P/S fwd | P/GP | P/GP fwd | EV/EBITDA | FCF yld |
|---|---|---|---|---|---|---|---|---|---|
UTI | $1.2B | 35.6x | 37.0x | 1.4x | 1.4x | 2.3x | 2.2x | 14.0x | -1.9% |
WSC | $4.0B | n/m | 19.8x | 1.7x | 1.7x | 3.6x | 3.6x | 21.8x | 13.4% |
STN | $8.0B | 23.0x | 16.0x | 1.4x | 1.1x | 3.3x | 2.6x | 12.4x | 6.0% |
| Ticker | Mkt cap | P/E | P/E fwd | P/S | P/S fwd | P/GP | P/GP fwd | EV/EBITDA | FCF yld |
|---|---|---|---|---|---|---|---|---|---|
WSP.TO | $23.1B | 23.3x | 14.9x | 1.3x | 1.4x | 7.3x | 8.1x | 13.3x | 7.5% |
PWR | $96.3B | 72.4x | 38.3x | 2.9x | 2.4x | 20.4x | 16.9x | 33.7x | 2.5% |
MTZ | $21.1B | 41.4x | 28.6x | 1.3x | 1.2x | 11.4x | 10.0x | 21.9x | 1.2% |
| Ticker | Mkt cap | P/E | P/E fwd | P/S | P/S fwd | P/GP | P/GP fwd | EV/EBITDA | FCF yld |
|---|---|---|---|---|---|---|---|---|---|
EME | $40.7B | 30.8x | 31.1x | 2.3x | 2.1x | 11.7x | 11.0x | 19.8x | 2.7% |
PRIM | $6.1B | 24.7x | 23.4x | 0.8x | 0.8x | 7.9x | 7.7x | 14.4x | 2.7% |
VRT | $100.3B | 57.7x | 38.8x | 8.7x | 7.2x | 23.3x | 19.1x | 39.9x | 2.9% |
| Ticker | Mkt cap | P/E | P/E fwd | P/S | P/S fwd | P/GP | P/GP fwd | EV/EBITDA | FCF yld |
|---|---|---|---|---|---|---|---|---|---|
GEV | $268.1B | 28.6x | 32.8x | 6.5x | 5.8x | 32.1x | 28.8x | 29.9x | 4.6% |
ETN | $163.0B | 42.6x | 31.0x | 5.4x | 5.0x | 15.1x | 13.8x | 28.5x | 2.8% |
POWL | $7.2B | 37.7x | 36.6x | 6.2x | 6.0x | 20.7x | 20.1x | 26.4x | 3.4% |
| Ticker | Mkt cap | P/E | P/E fwd | P/S | P/S fwd | P/GP | P/GP fwd | EV/EBITDA | FCF yld |
|---|---|---|---|---|---|---|---|---|---|
STRL | $15.9B | 36.9x | 26.2x | 4.6x | 3.9x | 19.6x | 16.6x | 21.9x | 3.0% |
Consensus projections
| Ticker | FY2026E | FY2027E | FY2028E | |
|---|---|---|---|---|
MYRG | Revenue | +22.9% | +15.5% | +11.4% |
| EPS | +72.5% | +18.4% | +22.2% | |
TTEK | Revenue | −3.5% | +4.3% | +1.8% |
| EPS | +4.1% | +10.2% | +11.4% | |
ACM | Revenue | −1.6% | +7.2% | +5.8% |
| EPS | −24.1% | +56.4% | +17.1% | |
UTI | Revenue | +7.7% | +8.5% | +10.9% |
| EPS | −42.9% | +22.9% | +70.5% | |
WSC | Revenue | +2.3% | +2.6% | +4.7% |
| EPS | −0.3% | +16.3% | +35.2% | |
STN | Revenue | +10.4% | +5.8% | +7.3% |
| EPS | +14.5% | +11.1% | +22.0% | |
WSP.TO | Revenue | +18.9% | +7.5% | +6.9% |
| EPS | +19.5% | +14.6% | +13.8% | |
PWR | Revenue | +40.6% | +16.7% | +12.5% |
| EPS | +57.5% | +17.8% | +16.7% | |
MTZ | Revenue | +30.5% | +20.3% | +14.5% |
| EPS | +43.0% | +34.8% | +28.0% | |
EME | Revenue | +13.3% | +7.5% | +6.9% |
| EPS | +15.8% | +11.2% | +13.6% | |
PRIM | Revenue | +2.8% | +11.4% | +7.6% |
| EPS | −12.3% | +24.1% | +10.2% | |
VRT | Revenue | +37.0% | +29.7% | +21.9% |
| EPS | +62.8% | +36.4% | +27.1% | |
GEV | Revenue | +23.4% | +14.6% | +15.3% |
| EPS | +322.4% | −19.0% | +40.3% | |
ETN | Revenue | +19.6% | +11.1% | +9.7% |
| EPS | +12.2% | +18.4% | +16.8% | |
POWL | Revenue | +8.8% | +25.8% | +14.5% |
| EPS | +12.7% | +24.1% | +32.7% | |
STRL | Revenue | +71.1% | +21.1% | +14.3% |
| EPS | +91.0% | +27.7% | +14.5% |
Forward fiscal years only. Blank means no analyst coverage for that year.
Four record backlogs, four different verdicts
Between 30 July and 11 August, the firms that survey, design, permit and physically wire the connection between a data-center campus and the high-voltage grid reported their quarters. Every one of them announced a record order book. What happened to their shares afterward bore almost no relation to what their income statements said.
MYR Group, a Colorado electrical contractor that strings high-voltage transmission line, builds substations and wires the electrical rooms inside data halls, grew second-quarter revenue 20% to $1.08bn. Gross profit rose 39% — roughly twice as fast — lifting gross margin to 13.2% from 11.4%. That is wide for a business that earned 8.6% at the gross line in 2024. Backlog reached a record $3.16bn, including two Xcel Energy transmission awards worth more than $200m combined, a 500-kilovolt Arizona substation and named data-center jobs in New Jersey, Arizona and Colorado. The shares are down 22% over the past month.
Tetra Tech, a consulting and engineering firm whose work runs from water and environmental permitting to the interconnection studies that decide when a load can attach to the grid, went the other way. Fiscal third-quarter revenue rose 13.5% to $1.31bn, but gross profit fell 3.3% and gross margin contracted to 18.6% from 21.8%. Backlog also set a record, at $4.5bn, and management raised full-year guidance and the dividend. The shares have climbed 41% from their 15 May low of $26.18.
The market is paying more for less
Tetra Tech now trades at 22.2x trailing earnings and 23.5x forward. The forward multiple sitting above the trailing one is the whole argument: consensus has revenue falling about 3.5% in the coming year, so the rally has been bought entirely with multiple expansion, not with earnings.
There is a defensible reason to prefer the designer to the builder here, and MYR Group's own management supplied it. Those Xcel awards contribute no revenue until the second half of 2027, on an 18-month build; most of the major projects won will be constructed between 2028 and 2030. Quanta Services, the largest bidder in the same market, told investors its 765-, 345- and 500-kilovolt programs are mostly still in engineering, with backlog entry from late 2026 and field execution in the second half of 2027. Design hours bill now. Construction dollars land years later. The interconnection queue behind all of it holds roughly 2,600 gigawatts, and in PJM the wait from application to operation has stretched past eight years from under two in 2008.
The problem with applying that logic to Tetra Tech is arithmetic. Its data-center practice runs about $60m annualized against $4.3bn of company revenue. The recovery is federal: US federal revenue grew 12% year over year, and management attributed the backlog inflection to defense and civil-works task orders released after the budget resolution. Grid interconnection is not what is paying for the re-rating.
The loudest decliners never touched the grid
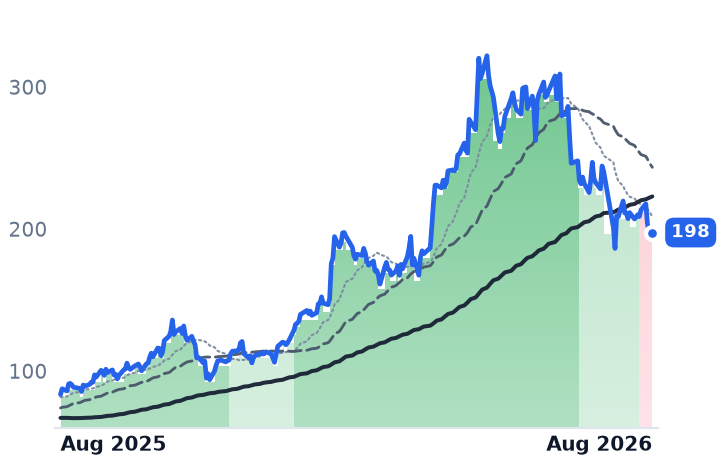
Two of the names habitually grouped into the AI-power engineering trade have no grid revenue at all. Universal Technical Institute, a trade-school operator, fell 33% in a single session on 6 August after cutting full-year adjusted earnings guidance to above $135m from above $155m; its chief financial officer said the shortfall came from running about 140 high-school field recruiters against a needed 170, not from weak demand. Even after a 36% drawdown it trades at 37x forward earnings. WillScot, which leases modular offices and portable storage to construction sites, is down 16% in a month on 3.7x net leverage and an adjusted EBITDA margin some 500 basis points below last year, with non-residential construction square footage still shrinking.
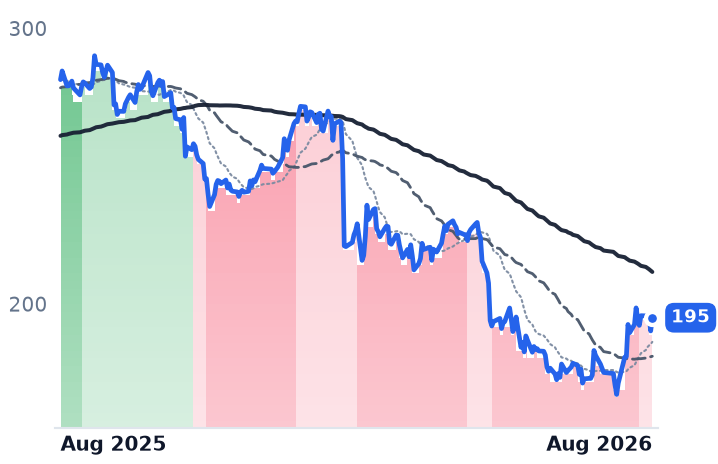
AECOM is the fourth. Its fiscal third quarter swung to a net loss on a $337m charge tied to a construction-management contract awarded in 2019 under terms it says it would not accept today. Underneath it, backlog hit an all-time high, up 13%, at a 1.6x book-to-burn. The charge depresses trailing earnings to 29.5x while the forward multiple sits at 16.4x — the widest such gap among these firms.
What MYR Group costs now
For a thin-margin self-perform contractor, price against gross profit is steadier than price against net income, which swings on project closeouts. On that measure MYR Group has gone from 8.0x a year ago to 15.0x in May to about 10.0x today, while trailing four-quarter gross profit rose 37% to $497m. Quanta, growing revenue 41% with a $53bn backlog, trades at 20.4x. Quanta is also buying its way into the bottleneck itself, acquiring right-of-way and permitting firm Percheron; MYR Group has disclosed no equivalent front-end capability, and its closest thing to a moat is incumbency — master service agreements supply 65% of transmission-and-distribution revenue, and over 90% of business is repeat.
The softest spot in MYR Group's quarter is exactly where the story claims strength. Transmission and distribution — the grid segment — grew 4%. Commercial and industrial, which includes data-hall electrical work, grew 42%.
The setup
Where it stands — Record backlogs across the group, with the fastest gross-profit growth marked down and the shrinking gross profit bid up. Would confirm — MYR Group's transmission-and-distribution revenue reaccelerating above 10% growth in the third quarter as Xcel work approaches. Would invalidate — Gross margin falling back toward the 8-11% segment guidance midpoint, showing Q2 was project closeouts, not mix. Watch next — MYR Group's third-quarter results in late October, and Tetra Tech's fiscal fourth quarter in November. Valuation — MYR Group 29.2x trailing and 25.5x forward earnings; 10.0x trailing gross profit against 15.0x in May and Quanta's 20.4x.