

The alt-manager bear-band exit already happened — in April — and it failed
Prompt v1.0
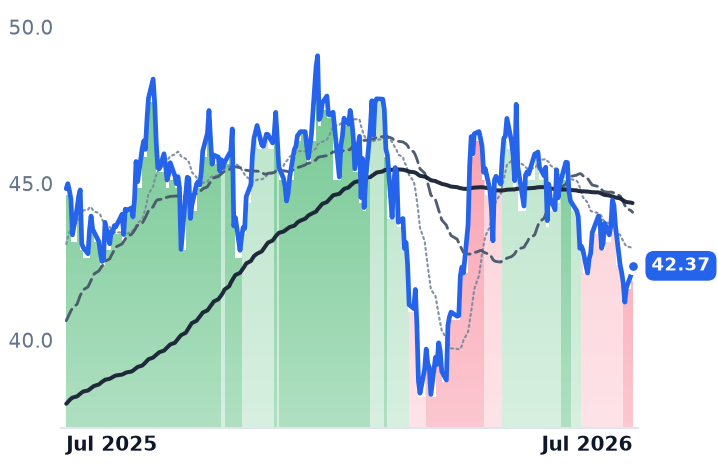
Six of eight alternative asset managers exited strongly bearish inside an 11-session window in late April 2026 — exactly the synchronized signal an early-uptrend thesis needs — but every one has since reversed back into bear territory, and BN's cited +2.1% is a three-session bounce off a three-month low inside a band that was cut to strongly bearish on 22 July.
| Ticker | Company | Segment | Trend · 13mo | 30D | 1Y |
|---|---|---|---|---|---|
BN | Brookfield | Real Estate & Infrastructure | ⚠️ Emerging Bear | +0.5% | −5.5% |
BAM | Brookfield Asset Management | Real Estate & Infrastructure | 🔴 Cont. Bear | +9.2% | −21.6% |
BX | Blackstone | Alternative & Private Capital | 🔴 Cont. Bear | +16.6% | −22.3% |
KKR | KKR | Alternative & Private Capital | 🔴 Cont. Bear | +15.4% | −32.2% |
APO | Apollo Global Management | Alternative & Private Capital | 🌱 Emerging Bull | +8.6% | −15.2% |
ARES | Ares Management | Alternative & Private Capital | 🔴 Cont. Bear | +18.9% | −29.9% |
OWL | Blue Owl Capital | Alternative & Private Capital | 🔴 Cont. Bear | +15.1% | −48.2% |
TPG | TPG | Alternative & Private Capital | ⚠️ Emerging Bear | — | — |
XIFR | XPLR Infrastructure | Renewable & Infrastructure Assets | 🟢 Cont. Bull | −0.3% | +21.2% |
ATH | ATH | — | 🔴 Cont. Bear | — | — |
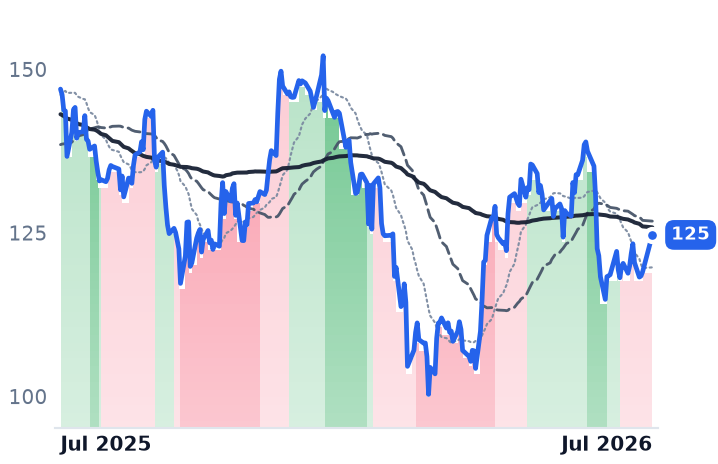
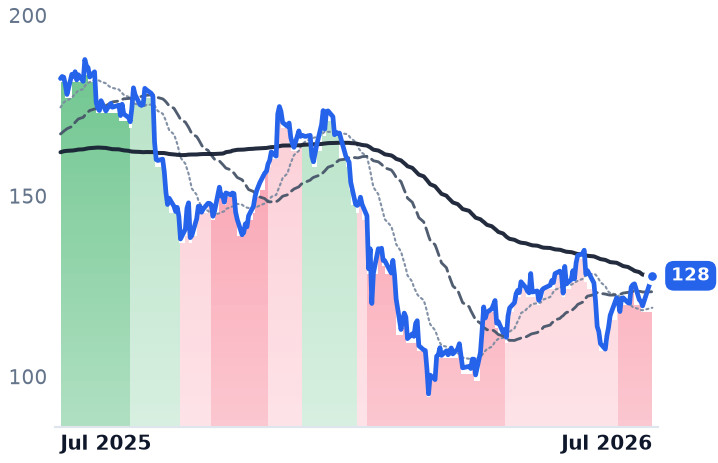
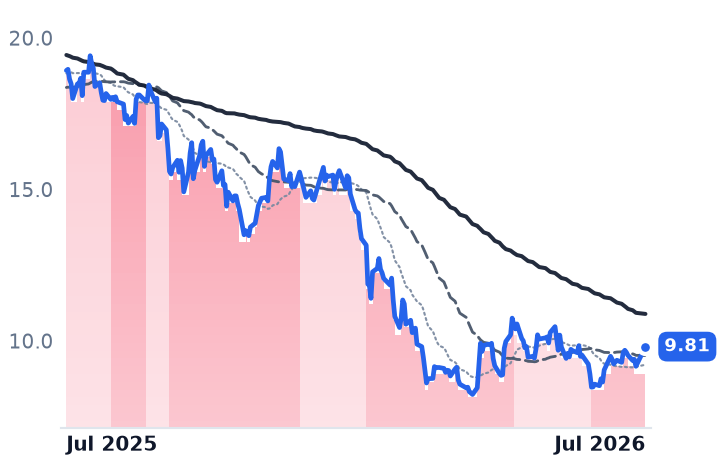
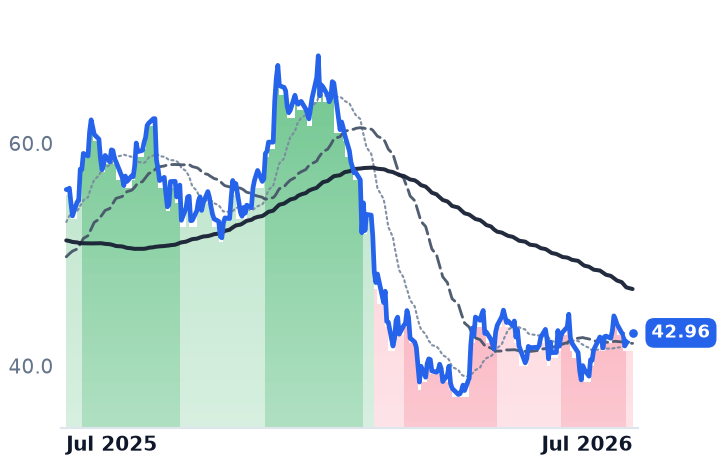
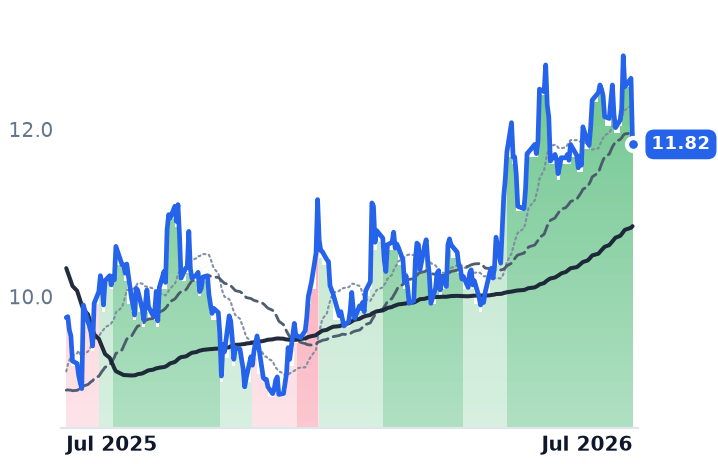
12-month price & trend
| Ticker | Mkt cap | P/E | P/E fwd | P/S | P/S fwd | P/GP | P/GP fwd | EV/EBITDA | FCF yld |
|---|---|---|---|---|---|---|---|---|---|
BN | $99.3B | 84.0x | 16.2x | 1.3x | 13.0x | 3.7x | 36.9x | 10.5x | -7.3% |
BAM | $86.7B | 31.2x | 29.5x | 16.0x | 14.2x | 20.0x | 17.8x | 90.0x | 2.5% |
BX | $173.9B | 32.0x | 24.3x | 10.8x | 11.9x | 12.2x | 13.4x | 22.0x | 2.5% |
| Ticker | Mkt cap | P/E | P/E fwd | P/S | P/S fwd | P/GP | P/GP fwd | EV/EBITDA | FCF yld |
|---|---|---|---|---|---|---|---|---|---|
KKR | $102.4B | 33.9x | 18.4x | 4.8x | 9.7x | 10.4x | 20.8x | 15.1x | 8.3% |
APO | $81.1B | 30.5x | 16.0x | 2.4x | 3.5x | 3.0x | 4.4x | 5.8x | 9.9% |
ARES | $47.3B | 62.9x | 24.5x | 7.4x | 8.4x | 11.8x | 13.4x | 24.3x | 1.8% |
| Ticker | Mkt cap | P/E | P/E fwd | P/S | P/S fwd | P/GP | P/GP fwd | EV/EBITDA | FCF yld |
|---|---|---|---|---|---|---|---|---|---|
OWL | $19.1B | 102.3x | 13.8x | 6.4x | 6.8x | 10.5x | 11.1x | 24.3x | 6.9% |
TPG | $16.0B | 47.7x | 14.8x | 4.5x | 5.9x | 4.8x | 6.2x | 29.7x | 6.1% |
XIFR | $1.1B | 17.8x | 3.5x | 0.9x | 0.8x | 5.4x | 4.9x | 9.0x | -56.5% |
Consensus projections
| Ticker | FY2026E | FY2027E | FY2028E | |
|---|---|---|---|---|
BN | Revenue | −6.8% | +21.4% | +21.7% |
| EPS | +13.2% | +23.7% | +15.4% | |
BAM | Revenue | +12.2% | +16.1% | +12.9% |
| EPS | +12.9% | +17.8% | +16.8% | |
BX | Revenue | +15.0% | +24.4% | +4.9% |
| EPS | +10.7% | +25.2% | +10.8% | |
KKR | Revenue | +33.9% | +17.8% | +32.9% |
| EPS | +26.0% | +18.0% | +15.7% | |
APO | Revenue | +27.3% | +16.0% | +13.9% |
| EPS | +10.8% | +21.4% | +16.1% | |
ARES | Revenue | +22.9% | +19.5% | +9.3% |
| EPS | +17.7% | +23.8% | +17.7% | |
OWL | Revenue | +5.9% | +10.5% | +16.1% |
| EPS | +7.9% | +11.4% | +14.5% | |
TPG | Revenue | +22.8% | +20.1% | +16.9% |
| EPS | +21.3% | +26.0% | +14.3% | |
XIFR | Revenue | −0.5% | +6.4% | +2.4% |
| EPS | −2313.0% | −17.3% | −43.1% |
Forward fiscal years only. Blank means no analyst coverage for that year.
The turn already happened — and unwound
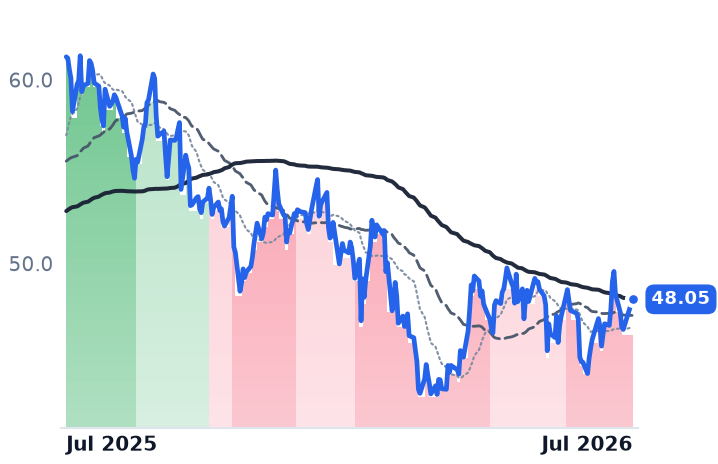
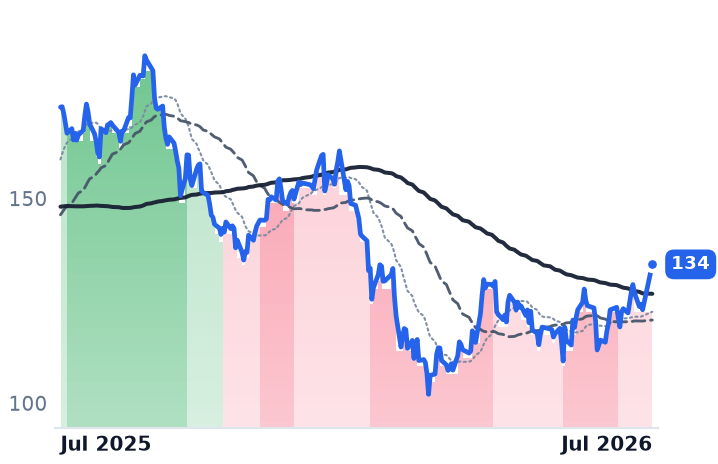
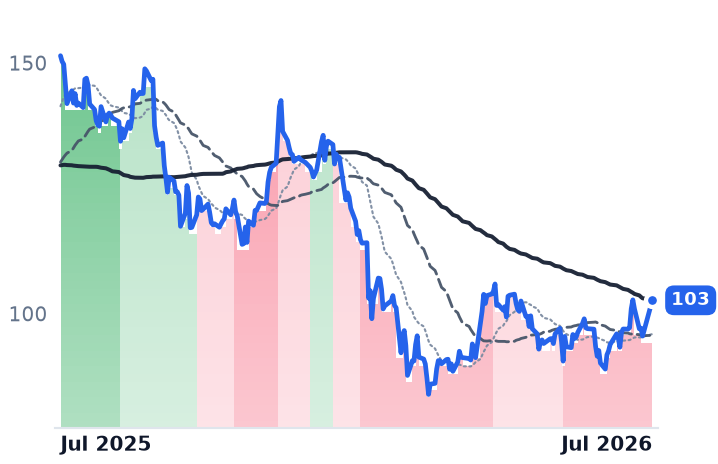
The cohort-wide bear-band exit this thesis is hunting for is three months stale. BX and KKR exited strongly bearish on 21 April, APO on the 22nd, BN the 23rd, BAM the 27th, ARES the 28th, with TPG on 1 May and OWL on 6 May — six names in eleven sessions. It has fully reversed: BX and KKR back to strongly bearish on 3 June, BAM 15 June, OWL 24 June, ARES 7 July, APO to mildly bearish 8 July, and BN cut to strongly bearish on 22 July, in the middle of the bounce being cited as evidence of an uptrend. Only BN and APO ever reached a bull band at all. As of each name's latest close, seven of eight sit in bear bands and zero print a bull band.
Those April exits were moving-average mean reversion, not price gains. From 20 April to 22 July, BN is -10.4%, KKR -8.1%, OWL -7.4%, APO -6.5%, BAM -5.4% and BX -4.8%; only ARES is positive. BN's +2.1% is three sessions — 41.21 on 7/23 to 42.08 on 7/27 — off a three-month low, after peaking at 44.47 on 15 July. Over a true trailing five sessions BN is -0.73%. The "best on the watchlist" framing is a coverage artifact: 880 symbols have prices through 7/22 but only 28 run past it, and TPG's series stops on 19 May.
Both macro legs fail
The easing path isn't there. Futures into the 29 July FOMC price roughly a 64% hold and a 35-36% chance of a hike, with a cut effectively off the table. Credit is deteriorating at the margin: BDC non-accruals rose to 2.1% of amortized cost from 1.8% while new-issue private-credit spreads compressed to 2017 tights — worse future net investment income on top of rising distress. The 2025 de-rating was sentiment, not realized loss: across 166 BDCs, First Brands exposure totalled $237 million, or 0.05% of AUM. And the "upside to targets" leg is a modelling gap the market is rejecting — the group trades at roughly 9-14x 2027 earnings against sell-side models in the 20s.
What survives
BN reads idiosyncratic: $1 billion repurchased in Q1 at a stated ~40% discount to intrinsic value, plus a renewed issuer bid for 10% of float. Operating prints aren't uniformly weak — KKR flagged over $900 million of monetization income from 31 March to 24 June, though Q2's reclassification of K-Series performance fees into fee-related revenues mechanically inflates FRE, and Athene guided to ~$350 million of pre-tax alternative net investment income. The datacenter-credit engine is real — the ~$30bn Meta Hyperion SPV and $200bn+ of AI private credit with $800bn more projected — but it levers the same capex cycle without bank-style oversight, and the Chicago Fed warns of indirect bank exposure through nonbanks.
XIFR is no read-through: a Utilities/IPP yieldco, strongly bullish since 8 May, +22% over 90 days and 4.8% off its high — even as Q2 net income fell to $38 million from $79 million. The infrastructure leg and the private-capital leg diverged.