

Kyndryl's Signings Now Exceed Its Revenue. Its Market Value Is Below Its Gross Profit
Hypothesis Opus 5 · Research Opus 5 · Writing Opus 5 · Prompt v1.5
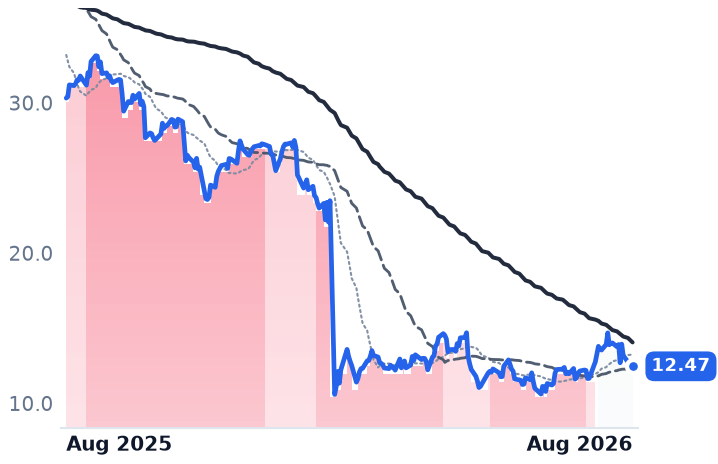
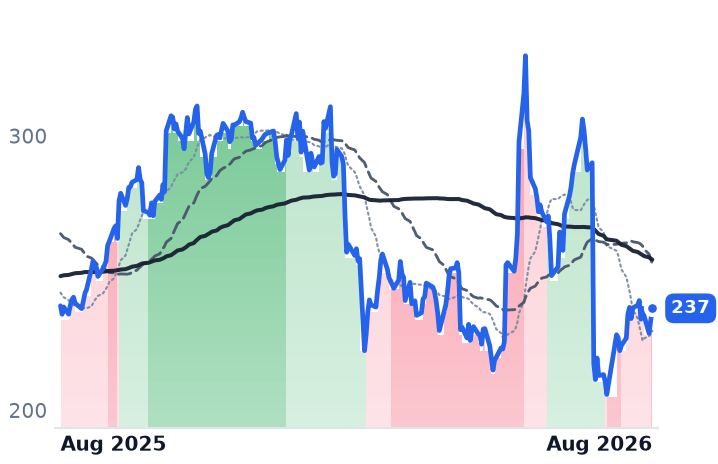
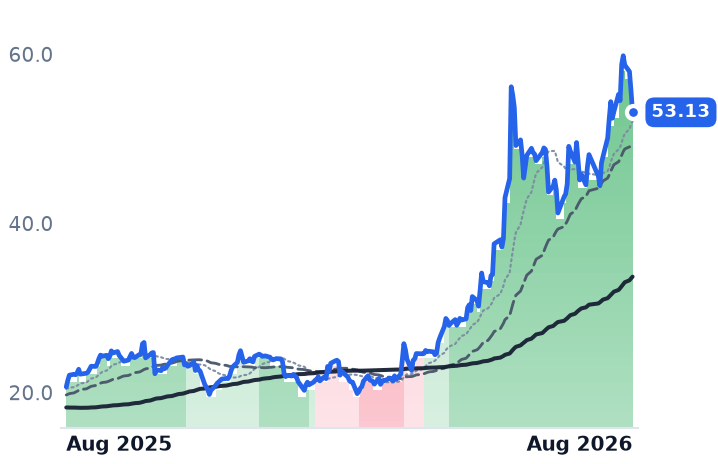
An accounting review that produced no restatement has cost Kyndryl two thirds of its market value, and the operating numbers underneath it went the other way. The IBM spin-out, which runs other companies' mainframes and data centers, closed its fiscal year to March with gross margin of 21.8%, up 92 basis points and higher for the fifth straight year, and trailing signings of $14.2bn — more work booked than billed. The shares are down 59% over twelve months, almost all of it in one February session.
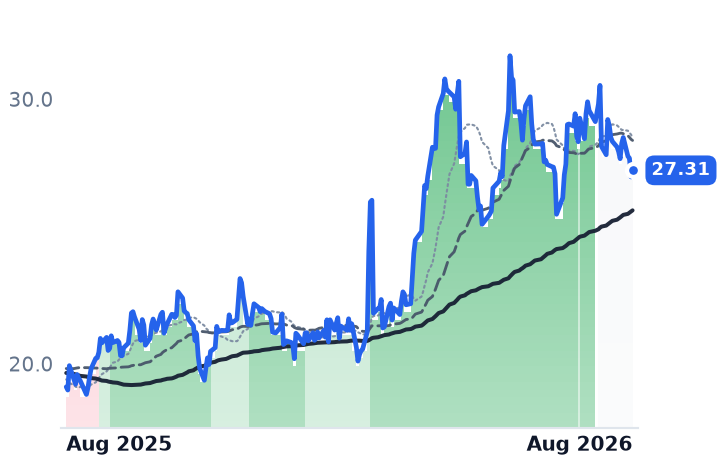
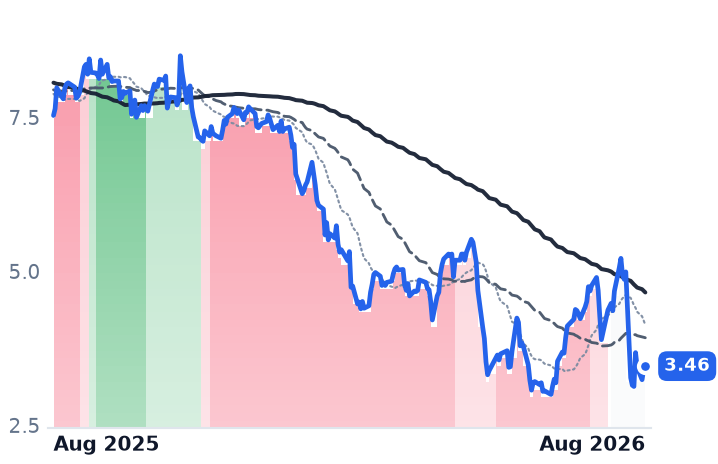
At a $2.75bn market capitalization, Kyndryl is valued below its own annual gross profit of $3.29bn, against roughly 2.3x a year ago. Management still targets more than $1.2bn of adjusted pretax income in fiscal 2028. The wider enterprise channel is not falling with it: Ingram Micro grew gross profit faster than revenue and rose 41%, while CDW's record sales were memory-price pass-through, with gross margin down 70 basis points.
| Ticker | Company | Segment | Trend · 13mo | 30D | 1Y |
|---|---|---|---|---|---|
| The subject · what this brief is about | |||||
KD | Kyndryl | IT Infrastructure & Operations | 🔴 Cont. Bear | +2.3% | −58.9% |
INGM | Ingram Micro | IT Infrastructure & Operations | 🟢 Cont. Bull | −7.3% | +42.8% |
CDW | CDW | IT Infrastructure & Operations | 🌱 Emerging Bull | +6.0% | −16.5% |
| Compared against · context, not the story | |||||
DXC | DXC Technology | IT Infrastructure & Operations | 🔴 Cont. Bear | +16.5% | −20.8% |
IBM | International Business Machines | IT Infrastructure & Operations | ⚠️ Emerging Bear | +12.7% | −0.4% |
NABL | N-able | IT Infrastructure & Operations | 🔴 Cont. Bear | −26.2% | −54.1% |
SNX | TD SYNNEX | Broad IT Infrastructure | 🟢 Cont. Bull | +1.0% | +74.8% |
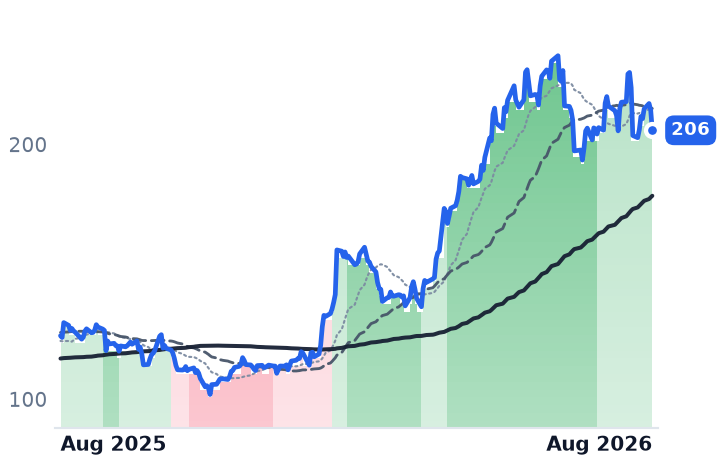
ARW | Arrow Electronics | Enterprise IT Solutions | 🟢 Cont. Bull | −4.9% | +64.5% |
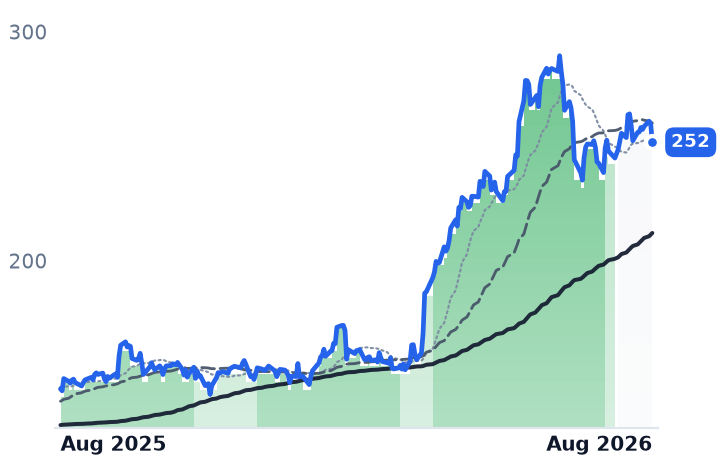
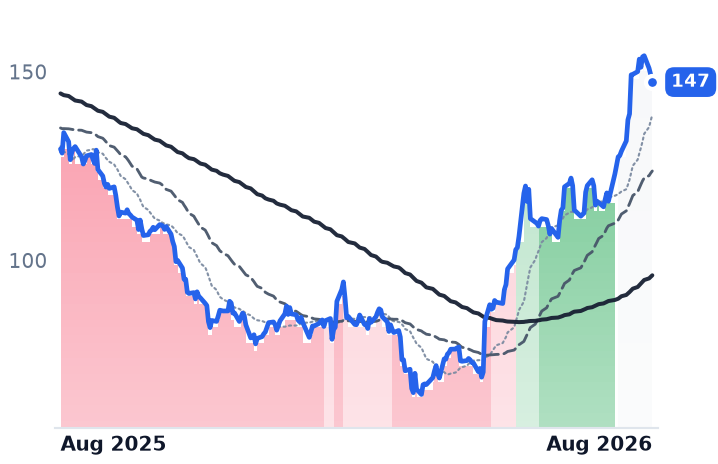
HPE | Hewlett Packard Enterprise | Enterprise Storage & Software | 🟢 Cont. Bull | +13.7% | +157.0% |
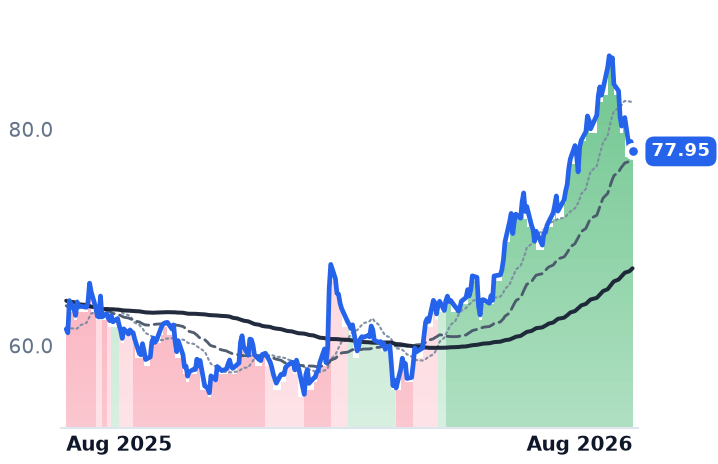
NSIT | Insight Enterprises | Enterprise IT Solutions | 🌱 Emerging Bull | +26.8% | +13.7% |
CNXN | PC Connection | Enterprise IT Solutions | 🌱 Emerging Bull | −4.0% | +26.7% |
12-month price & trend
| Ticker | Mkt cap | P/E | P/E fwd | P/S | P/S fwd | P/GP | P/GP fwd | EV/EBITDA | FCF yld |
|---|---|---|---|---|---|---|---|---|---|
KD | $2.7B | 8.4x | 6.7x | 0.1x | 0.2x | 0.5x | 0.9x | 2.4x | 5.4% |
INGM | $6.3B | 14.8x | 8.0x | 0.1x | 0.1x | 1.7x | 1.6x | 7.5x | -3.7% |
CDW | $17.6B | 16.5x | 12.6x | 0.7x | 0.7x | 3.5x | 3.4x | 12.7x | 6.3% |
| Ticker | Mkt cap | P/E | P/E fwd | P/S | P/S fwd | P/GP | P/GP fwd | EV/EBITDA | FCF yld |
|---|---|---|---|---|---|---|---|---|---|
DXC | $1.8B | 14.2x | 4.2x | 0.1x | 0.1x | 1.0x | 1.1x | 2.6x | 71.4% |
IBM | $222.5B | 20.6x | 19.2x | 3.2x | 3.2x | 5.5x | 5.4x | 17.3x | 6.6% |
NABL | $647.1M | n/m | 8.8x | 1.2x | 1.2x | 1.6x | 1.5x | 14.2x | 10.9% |
| Ticker | Mkt cap | P/E | P/E fwd | P/S | P/S fwd | P/GP | P/GP fwd | EV/EBITDA | FCF yld |
|---|---|---|---|---|---|---|---|---|---|
SNX | $18.6B | 18.7x | 13.7x | 0.3x | 0.3x | 4.2x | 4.0x | 9.5x | 6.7% |
ARW | $10.9B | 13.6x | 10.5x | 0.3x | 0.3x | 2.7x | 2.5x | 10.1x | 8.2% |
HPE | $70.3B | 48.7x | 15.5x | 1.8x | 1.6x | 5.5x | 4.7x | 21.5x | 5.7% |
| Ticker | Mkt cap | P/E | P/E fwd | P/S | P/S fwd | P/GP | P/GP fwd | EV/EBITDA | FCF yld |
|---|---|---|---|---|---|---|---|---|---|
NSIT | $4.7B | 22.5x | 13.5x | 0.5x | 0.6x | 2.5x | 2.5x | 12.7x | 9.1% |
CNXN | $2.0B | 21.4x | 19.4x | 0.7x | 0.7x | 3.6x | 3.5x | 13.5x | 1.7% |
Consensus projections
| Ticker | FY2026E | FY2027E | FY2028E | |
|---|---|---|---|---|
KD | Revenue | +0.4% | −2.0% | −0.1% |
| EPS | +49.9% | +6.4% | +34.3% | |
INGM | Revenue | +11.6% | +3.5% | +4.3% |
| EPS | +19.9% | +10.6% | +11.3% | |
CDW | Revenue | +8.9% | +3.7% | +2.8% |
| EPS | +10.5% | +9.2% | +8.9% | |
DXC | Revenue | −1.2% | −4.1% | −1.4% |
| EPS | −5.6% | −18.4% | +14.1% | |
IBM | Revenue | +5.0% | +3.9% | +5.1% |
| EPS | +8.4% | +6.8% | +8.6% | |
NABL | Revenue | +6.4% | +6.1% | +9.1% |
| EPS | −8.0% | +11.2% | +11.8% | |
SNX | Revenue | +9.8% | +5.7% | +5.6% |
| EPS | +28.4% | +9.8% | +13.2% | |
ARW | Revenue | +29.9% | +5.1% | +6.7% |
| EPS | +96.7% | +9.4% | +10.8% | |
HPE | Revenue | +30.3% | +11.5% | +5.6% |
| EPS | +80.5% | +18.1% | +9.6% | |
NSIT | Revenue | +2.1% | +2.8% | +6.2% |
| EPS | +17.7% | +8.0% | +14.8% | |
CNXN | Revenue | +7.0% | +2.4% | — |
| EPS | +22.8% | +6.9% | — |
Forward fiscal years only. Blank means no analyst coverage for that year.
A review that ended quietly
On 9 February, Kyndryl's chief financial officer and general counsel left with immediate effect, the company delayed a quarterly filing, and it cut its free-cash-flow guidance for the year to $325-375m from $550m. The shares lost more than half their value in a session. The audit-committee review behind those departures, prompted by voluntary document requests from the Securities and Exchange Commission's enforcement division into cash-management practices and adjusted free-cash-flow disclosure, found no misstatements of previously issued financial statements and required no restatement. The amended annual report added disclosure, nothing more. The stock has traded between $10.62 and $14.69 in every month since.
Kyndryl is the 2021 spin-out of International Business Machines' managed-infrastructure arm: 72,000 people who operate other companies' mainframes, networks, cloud estates and digital workplaces for banks, telecom carriers, retailers and carmakers. It says it runs more than half the world's outsourced mainframes, staffed by 8,000 to 9,000 specialists — a skills pool that is not being replaced.
The business went the other way
Revenue in the year to March 2026 was $15.09bn, essentially flat. Gross profit rose 4.6% to $3.29bn, and gross margin reached 21.79%, up 92 basis points. That margin has climbed every year since the spin, from 11.3% in fiscal 2022, while revenue fell by $3.6bn — a five-year trade of volume for profitability, and it is still working: operating income rose 15.0% to $635m.
The forward book is the surprising part. Trailing twelve-month signings reached $14.2bn, now larger than annual revenue, with projected gross margin on that work of about 25% — above the margin of the business it replaces. Kyndryl Consult revenue grew 14% and its signings rose 50% in the June quarter; revenue tied to hyperscaler partnerships grew 48% over twelve months to $2bn. Forty deals above $50m were signed in the period, with new scope and new customers making up about 30% of large-deal value against 15% a year earlier.
The drag is disclosed and finite. Customer spending routed through IBM has halved from roughly $4bn annualized at separation to under $2bn, as clients buy IBM hardware and software directly and keep Kyndryl's services — a three-point revenue headwind that management says costs little in earnings. The June quarter also carried $152m of workforce-rebalancing charges, producing an adjusted pretax loss of $37m against $128m of income a year earlier. Roughly $200m of such charges are planned this year against about $200m of in-year savings and $400-500m annualized by fiscal 2028.
What it costs
Kyndryl trades at 6.7x forward earnings against 8.4x trailing, and 2.44x trailing EBITDA. Price to trailing gross profit is about 0.84x, down from roughly 2.3x a year ago — a 63% de-rating over a period in which gross-profit dollars grew. Management reaffirmed fiscal 2027 guidance of $600-700m adjusted pretax income and $400-500m of free cash flow, and kept fiscal 2028 targets above $1.2bn and $1bn respectively, against a market value of $2.75bn.
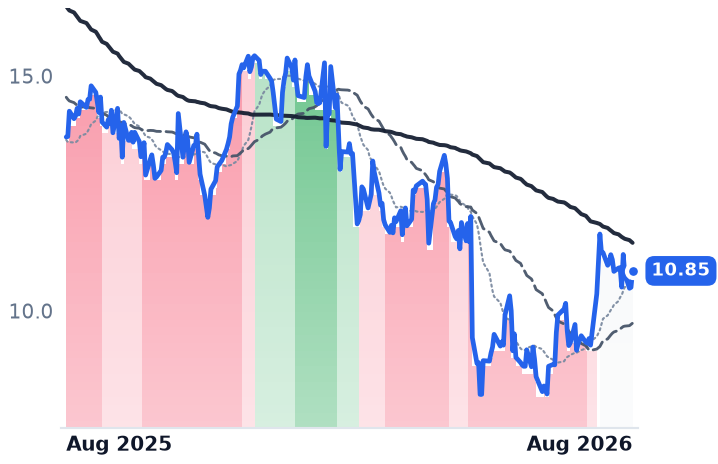
It is also acting like a buyer, not a target: a consortium of Apollo Global Management and Kyndryl has approached DXC Technology with an all-cash proposal reported at $22-25 a share, against a DXC price near $10.85. DXC, a $1.75bn outsourcer whose quarterly revenue fell 5.1%, is the declining asset here.
The channel split, and why
The idea that artificial-intelligence spending bypasses resellers and distributors is contradicted by the hardware data: ODM-direct's share of the server market fell from 64.1% to 50.2% in the first quarter of 2026 as enterprise and sovereign buyers chose established vendors, while server revenue grew 30.4%. What is splitting the channel is memory cost. Server DRAM contract prices are forecast to rise 13-18% in the third quarter, and cloud providers have locked long-term agreements — so the increase lands on enterprise buyers.
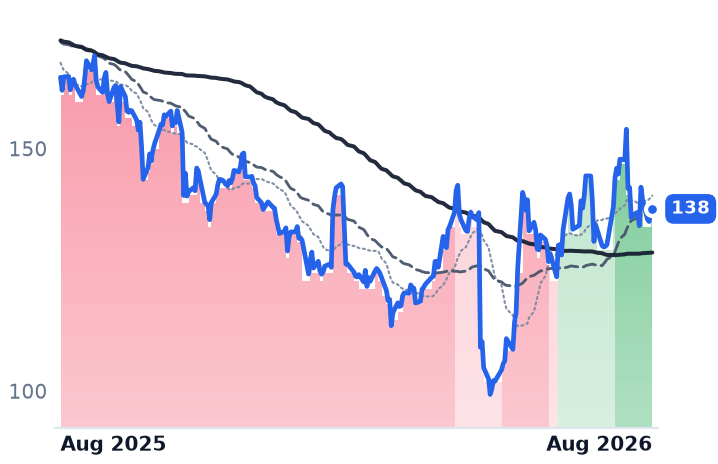
Ingram Micro, the global distributor that supplies resellers in more than 100 markets, is converting that: quarterly revenue rose 13.6% to $14.5bn and gross profit rose faster, up 14.2%, with GPU and AI infrastructure sales more than doubling. It trades at 8.0x forward earnings against 14.8x trailing. CDW, the largest US corporate and public-sector reseller, is on the other side: revenue rose 10.0% to a record, but gross profit grew 6.3% and gross margin fell 70 basis points to 20.1%, with management attributing personal-computer growth to higher selling prices rather than units. Year-to-date adjusted free cash flow was 42% of non-GAAP net income against an 80-90% target.
The setup
Where it stands — Kyndryl's margins, signings and consulting mix are improving while its equity trades below its annual gross profit.
Would confirm — Fiscal 2027 adjusted pretax income lands inside the reaffirmed $600-700m range with free cash flow of $400m or more.
Would invalidate — Signings fall back below revenue, or gross margin slips from 21.8%, as rebalancing charges outrun the promised savings.
Watch next — The September-quarter report, and whether the Apollo-Kyndryl approach to DXC becomes a firm offer.
Valuation — 6.7x forward earnings against 8.4x trailing; 0.84x trailing gross profit versus roughly 2.3x a year ago.