

Funded With New Shares, AEP and Entergy Grew Revenue and Earned Less Per Share
Hypothesis Opus 5 · Research Opus 5 · Writing Opus 5 · Prompt v1.6
Two utilities racing to serve data-center load reported growing businesses and falling per-share earnings in the same quarter. The reason is structural rather than operational: a state commission fixes the allowed return on equity for years, while the shares issued to fund the construction are sold at whatever price the market sets that week. Entergy's diluted share count rose 4.6% in the June quarter and earnings per share slipped to $1.03 from $1.05.
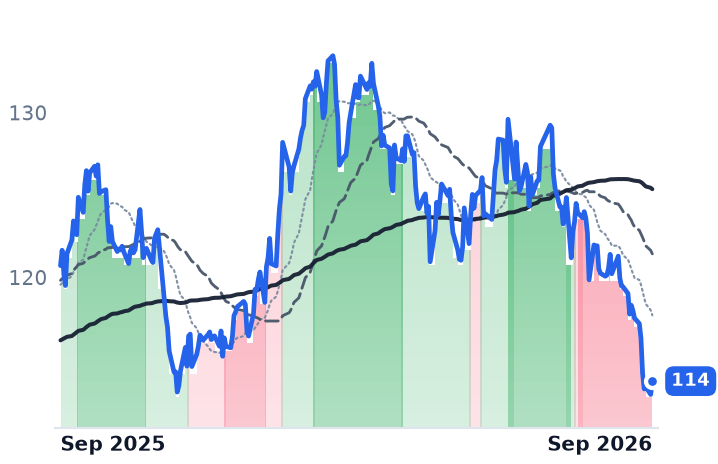
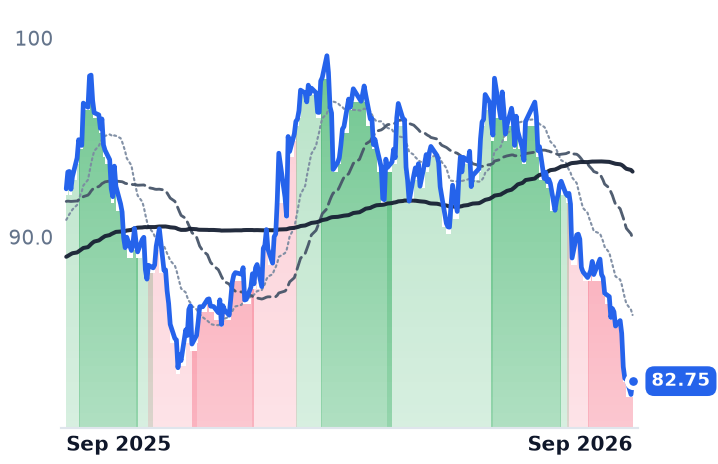
American Electric Power raised guidance, reaffirmed a $78bn five-year capital plan, and still reported lower per-share operating earnings. The de-rating splits them: AEP has cheapened to roughly 19x forward earnings while its guidance rose; Entergy, at 25.2x trailing, is the most expensive of the three even as delivered per-share earnings go backwards. Dominion's shares carry no verdict at all — since May they have traded as a fixed claim on NextEra stock.
| Ticker | Company | Segment | Trend · 13mo | 30D | 1Y |
|---|---|---|---|---|---|
| The subject · what this brief is about | |||||
AEP | American Electric Power | Vertically Integrated Utilities | ⚠️ Emerging Bear | −3.0% | +9.8% |
ETR | Entergy | Vertically Integrated Utilities | ⚠️ Emerging Bear | −6.2% | +8.1% |
D | Dominion Energy | Vertically Integrated Utilities | 🟢 Cont. Bull | −7.8% | +1.7% |
| Compared against · context, not the story | |||||
NEE | NextEra Energy | Vertically Integrated Utilities | 🔴 Cont. Bear | −7.7% | +0.9% |
DUK | Duke Energy | Vertically Integrated Utilities | ⚠️ Emerging Bear | −5.3% | −5.8% |
SO | The Southern | Vertically Integrated Utilities | ⚠️ Emerging Bear | −5.9% | −10.5% |
ED | Consolidated Edison | Vertically Integrated Utilities | ⚠️ Emerging Bear | −3.7% | +6.2% |
ES | Eversource Energy | Vertically Integrated Utilities | 🟢 Cont. Bull | −9.3% | −7.9% |
XEL | Xcel Energy | Vertically Integrated Utilities | ⚠️ Emerging Bear | −7.7% | −11.5% |
WEC | WEC Energy | Vertically Integrated Utilities | ⚠️ Emerging Bear | −3.8% | −8.8% |
EXC | Exelon | Vertically Integrated Utilities | ⚠️ Emerging Bear | −7.3% | −7.1% |
FE | FirstEnergy | Vertically Integrated Utilities | ⚠️ Emerging Bear | −5.8% | −3.0% |
PPL | PPL | Transmission & Distribution Only | 🔴 Cont. Bear | −5.3% | −11.6% |
SRE | Sempra | US Electric & Gas Utilities | ⚠️ Emerging Bear | −5.3% | −11.8% |
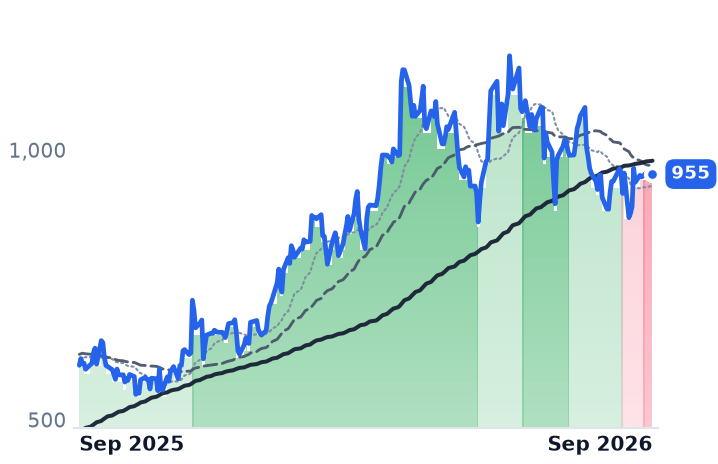
GEV | GE Vernova | GE Vernova Integrated | ⚠️ Emerging Bear | +7.3% | +59.0% |
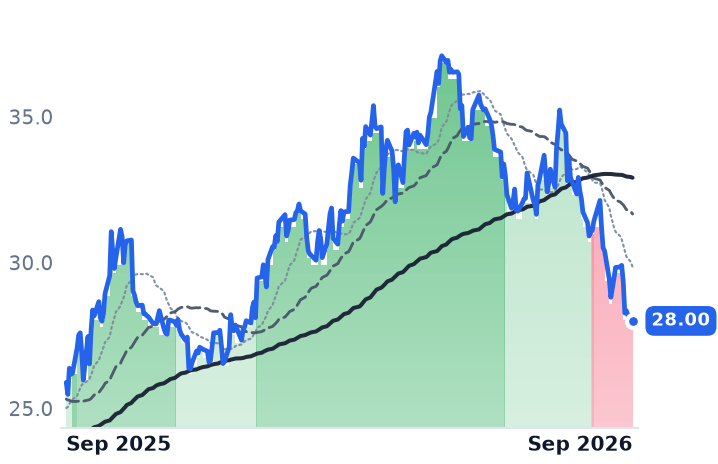
BEP | Brookfield Renewable Partners | Diversified Renewable Generators | ⚠️ Emerging Bear | −10.7% | +8.1% |
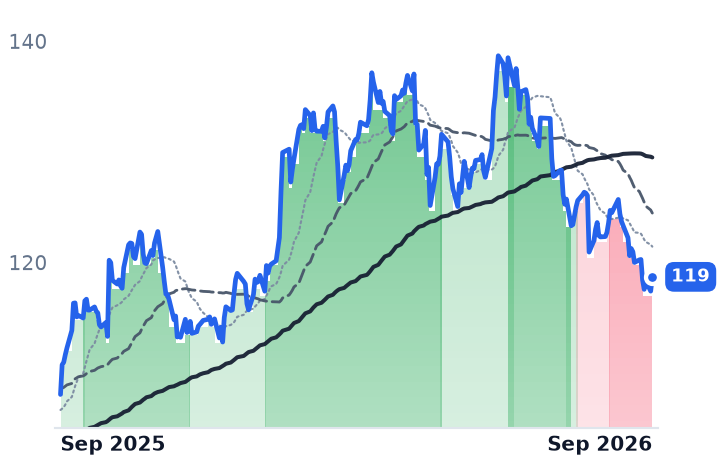
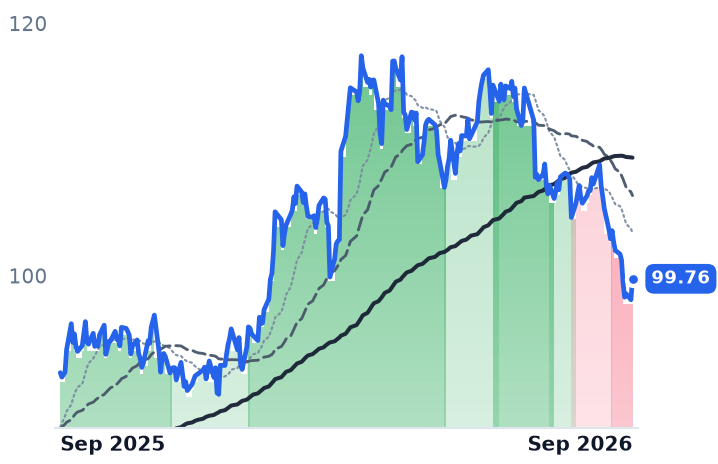
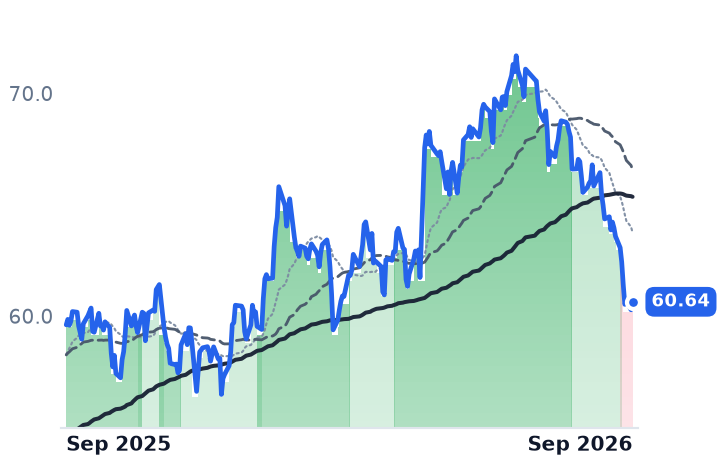
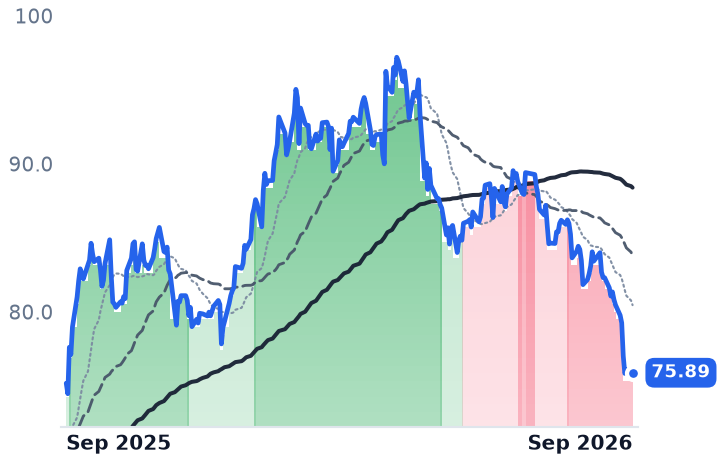
12-month price & trend
| Ticker | Mkt cap | P/E | P/E fwd | P/S | P/S fwd | P/GP | P/GP fwd | EV/EBITDA | FCF yld |
|---|---|---|---|---|---|---|---|---|---|
AEP | $64.9B | 20.5x | 18.7x | 2.9x | 2.8x | 5.9x | 5.7x | 13.7x | 13.8% |
ETR | $46.6B | 25.2x | 22.7x | 3.5x | 3.3x | 8.9x | 8.6x | 13.8x | -6.8% |
D | $53.3B | 21.0x | 16.9x | 2.9x | 2.9x | 5.9x | 5.9x | 14.5x | -12.8% |
| Ticker | Mkt cap | P/E | P/E fwd | P/S | P/S fwd | P/GP | P/GP fwd | EV/EBITDA | FCF yld |
|---|---|---|---|---|---|---|---|---|---|
NEE | $165.4B | 17.7x | 19.7x | 5.7x | 5.3x | 7.9x | 7.4x | 15.4x | -6.2% |
DUK | $93.7B | 18.1x | 17.9x | 2.8x | 2.8x | 4.1x | 4.1x | 11.4x | 1.6% |
SO | $106.6B | 22.2x | 20.2x | 3.5x | 3.5x | 8.1x | 8.0x | 12.7x | 2.4% |
| Ticker | Mkt cap | P/E | P/E fwd | P/S | P/S fwd | P/GP | P/GP fwd | EV/EBITDA | FCF yld |
|---|---|---|---|---|---|---|---|---|---|
ED | $38.8B | 17.7x | 17.3x | 2.3x | 2.2x | 3.5x | 3.4x | 9.4x | 7.2% |
ES | $25.3B | 14.4x | 14.4x | 1.8x | 1.9x | 4.5x | 4.7x | 10.2x | 0.9% |
XEL | $48.6B | 23.3x | 19.0x | 3.3x | 3.1x | 17.4x | 16.2x | 13.9x | -6.7% |
| Ticker | Mkt cap | P/E | P/E fwd | P/S | P/S fwd | P/GP | P/GP fwd | EV/EBITDA | FCF yld |
|---|---|---|---|---|---|---|---|---|---|
WEC | $35.6B | 21.7x | 19.5x | 3.5x | 3.5x | 6.3x | 6.3x | 14.3x | -3.1% |
EXC | $44.5B | 15.8x | 15.1x | 1.8x | 1.7x | 7.2x | 7.1x | 10.5x | -4.3% |
FE | $25.3B | 23.8x | 16.0x | 1.6x | 1.6x | 3.0x | 3.1x | 12.0x | 7.1% |
| Ticker | Mkt cap | P/E | P/E fwd | P/S | P/S fwd | P/GP | P/GP fwd | EV/EBITDA | FCF yld |
|---|---|---|---|---|---|---|---|---|---|
PPL | $25.6B | 27.1x | 17.5x | 3.6x | 2.6x | 10.5x | 7.6x | 13.7x | 1.0% |
SRE | $55.1B | 24.3x | 16.5x | 4.0x | 4.0x | 9.7x | 9.7x | 14.1x | -10.7% |
GEV | $242.9B | 25.9x | 29.7x | 5.9x | 5.2x | 29.0x | 26.0x | 27.0x | 5.1% |
| Ticker | Mkt cap | P/E | P/E fwd | P/S | P/S fwd | P/GP | P/GP fwd | EV/EBITDA | FCF yld |
|---|---|---|---|---|---|---|---|---|---|
BEP | $9.1B | 64.8x | — | 1.4x | 1.4x | 5.9x | 5.6x | 9.7x | -51.7% |
Consensus projections
| Ticker | FY2026E | FY2027E | FY2028E | |
|---|---|---|---|---|
AEP | Revenue | +9.4% | +5.9% | +7.6% |
| EPS | +8.0% | +7.5% | +10.6% | |
ETR | Revenue | +8.6% | +9.8% | +9.8% |
| EPS | +12.3% | +16.1% | +13.6% | |
D | Revenue | +14.4% | +6.4% | +6.1% |
| EPS | +5.1% | +6.3% | +6.9% | |
NEE | Revenue | +9.4% | +9.7% | +8.9% |
| EPS | +9.0% | +9.1% | +8.5% | |
DUK | Revenue | +5.8% | +4.6% | +4.2% |
| EPS | +6.3% | +6.9% | +7.0% | |
SO | Revenue | +7.7% | +5.5% | +6.1% |
| EPS | +6.8% | +7.5% | +9.2% | |
ED | Revenue | +6.9% | +4.2% | +3.9% |
| EPS | +7.3% | +6.2% | +6.5% | |
ES | Revenue | +4.6% | +3.5% | +6.6% |
| EPS | −1.4% | +5.6% | +6.2% | |
XEL | Revenue | +7.8% | +8.9% | +8.1% |
| EPS | +8.0% | +10.4% | +10.1% | |
WEC | Revenue | +8.0% | +5.0% | +7.5% |
| EPS | +6.6% | +7.2% | +8.2% | |
EXC | Revenue | +5.1% | +2.9% | +3.4% |
| EPS | +5.5% | +6.3% | +7.3% | |
FE | Revenue | +8.0% | +5.1% | +4.9% |
| EPS | +7.2% | +7.8% | +7.9% | |
PPL | Revenue | +10.9% | +5.8% | +5.4% |
| EPS | +7.7% | +8.7% | +8.5% | |
SRE | Revenue | −3.7% | −1.8% | +1.7% |
| EPS | +11.6% | +8.0% | +8.4% | |
GEV | Revenue | +23.9% | +14.8% | +15.0% |
| EPS | +321.7% | −19.5% | +40.7% | |
BEP | Revenue | +3.9% | +7.6% | −11.5% |
| EPS | +5.7% | −20.9% | −6.6% |
Forward fiscal years only. Blank means no analyst coverage for that year.
American Electric Power signed 6 gigawatts of new large-customer load agreements in the June quarter and raised its full-year guidance to $6.25–$6.55 a share. Per-share operating earnings for that same quarter went the other way, to $1.36 from $1.43, while revenue rose 7% to $5.4bn.
Nothing broke. The gap is the mechanism by which a regulated utility actually gets paid for a gigawatt of new load, and it deserves spelling out, because the revenue line makes almost none of it legible. AEP is not paid for "data-center demand." It earns a return that a state commission sets on plant the commission approves. Those allowed returns cluster just under 10%: the Virginia State Corporation Commission authorized 9.80% for Dominion's Virginia Power, Entergy Louisiana asked for 9.70% in its forward-looking formula rate plan, Kentucky allows PPL 9.775%, and NextEra's Florida return is locked at 10.95% through 2029. Each is fixed for years. The equity that funds the plant reprices daily.
The arithmetic of a fixed return
At roughly twice book value — AEP trades at 2.02x, Entergy at 2.48x — a 9.7% return on book equity is something closer to 4% to 5% on what a buyer pays today, against a 30-year Treasury that reached 5.57% in late September, its highest since June 2007. PPL supplied the cleanest measure of the squeeze when it priced $1bn of equity units in February at 7.00% a year against the 9.775% Kentucky lets it earn: under three points of spread, before regulatory lag.
Entergy, which sells electricity to 3 million customers in Arkansas, Louisiana, Mississippi and Texas, is where this shows up in reported results. June-quarter revenue rose 5.9% to $3.5bn and operating income was flat, but the diluted share count climbed 4.6% to 466m and earnings per share fell to $1.03. It is funding a $67bn five-year plan with roughly $7bn of equity, about $4.1bn of it settled or contracted by 30 June. Consensus still has its earnings rising 12.3% this year.
AEP's version is gentler — shares up 2.65%, and a $3bn marketed equity transaction settling under forward contracts by May 2028 that management says covers all anticipated marketed equity needs for the current plan, which targets nearly 11% annual rate-base growth.
Who eats the stranded asset
The obvious fear — that ratepayers or shareholders absorb a half-built plant if a hyperscaler walks — is the part the industry has largely closed. Ohio regulators approved AEP's data-center tariff requiring loads above 25 MW to pay for at least 85% of subscribed capacity for at least 12 years, with an exit fee of three years' minimum charges and collateral requirements; AEP has comparable terms in Indiana, West Virginia and Kentucky. Virginia's new GS-5 class, effective January 2027, imposes a 14-year contract at 85% of contracted transmission and distribution demand and 60% of generation demand whether the building runs or not. In Louisiana, Meta is financing seven new gas plants totalling more than 5.2 GW directly, under an agreement Entergy says pays full cost of service.
"That is why we have led efforts to implement large load tariffs and structure contracts to ensure growth helps pay for growth," AEP chief executive William Fehrman said in the company's 30 July second-quarter release.
The live risk is conversion, not abandonment. Dominion disclosed more than 53 GW in stages of contracting in its June quarter, of which only 12.0 GW sits under firm electric service agreements — about a fifth — against roughly 70 GW of interconnection requests it has described to Virginia regulators. PPL expects about 2 GW of a 31.8 GW Pennsylvania pipeline to be drawing power by 2031. The Ohio Manufacturers' Association is still contesting AEP's demand forecast after the utility halved it.
What the shares earn and what they do not
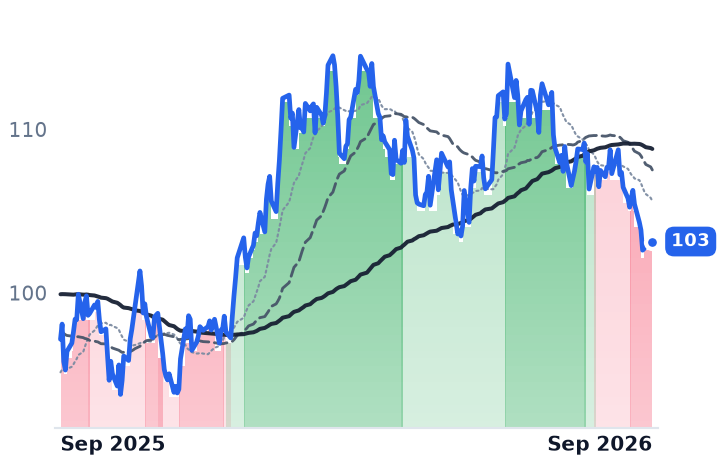
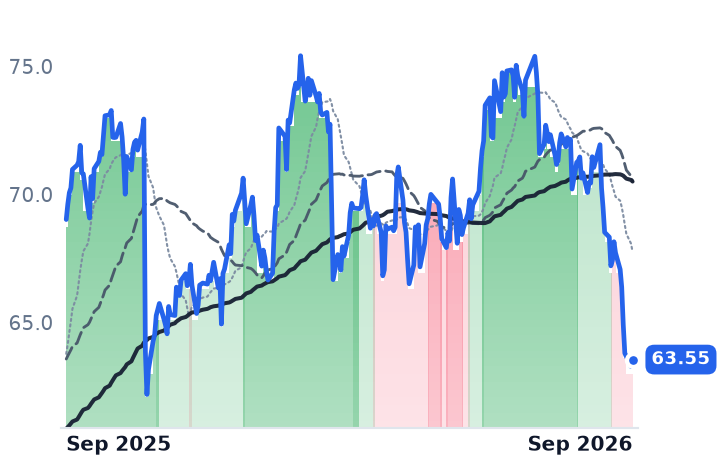
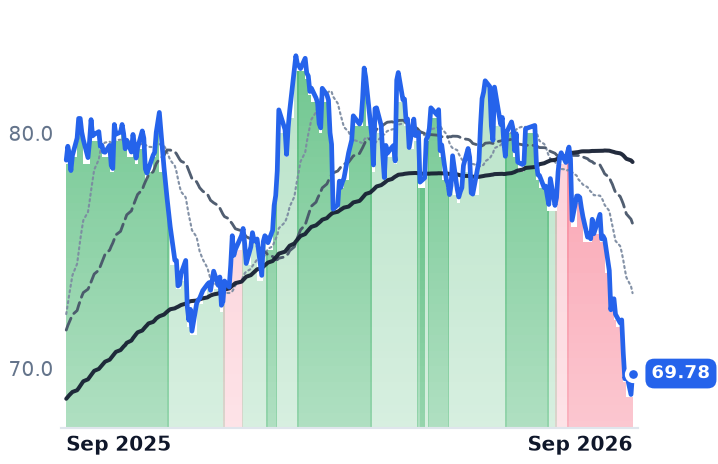
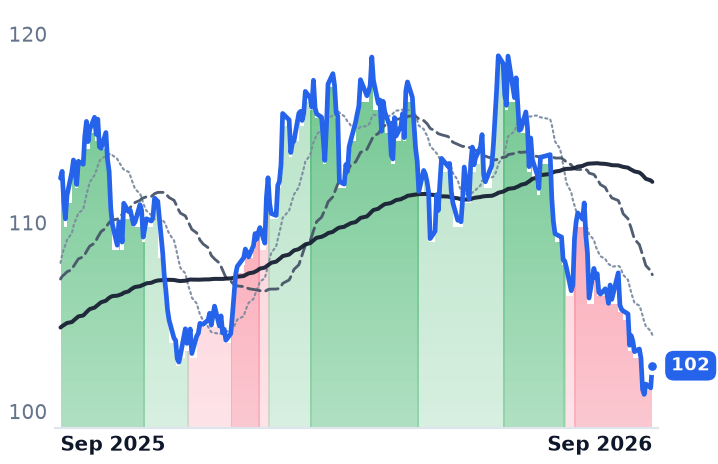
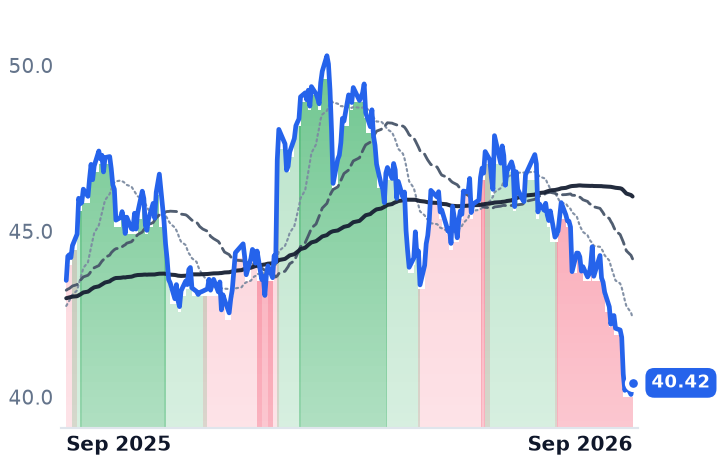
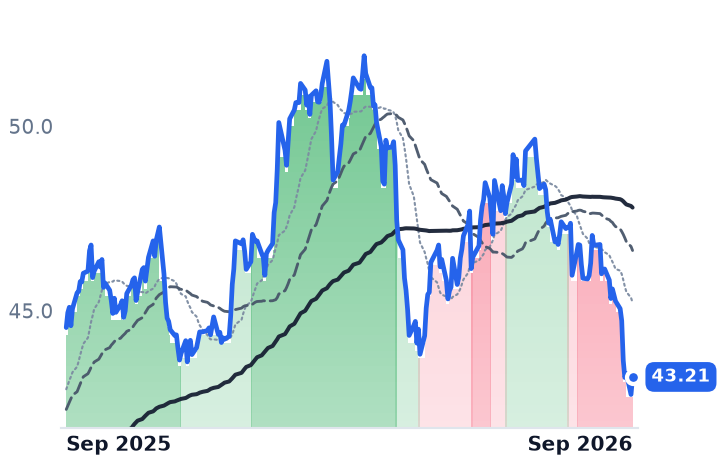
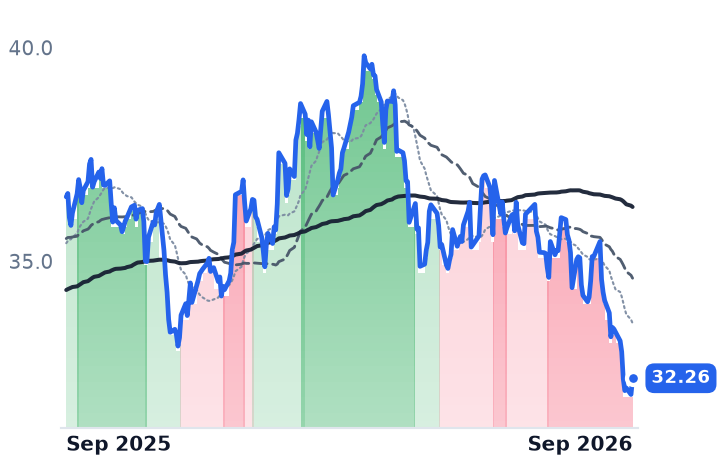
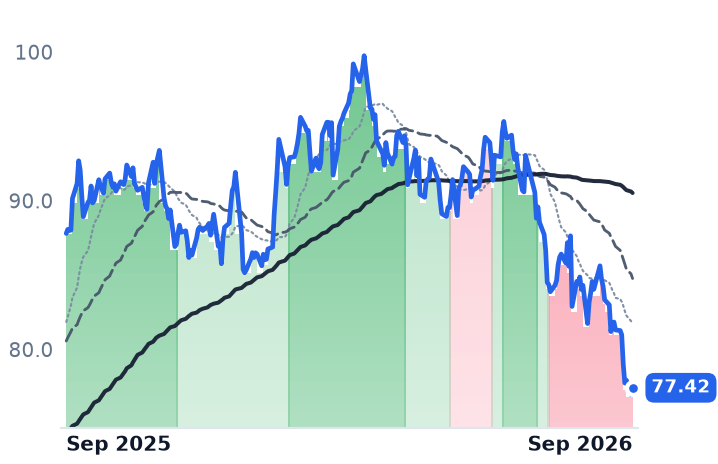
Fifteen regulated and renewable names fell over the thirty sessions to 29 September, AEP by 3.0% and Entergy by 5.7%, and between roughly half and three-quarters of each loss arrived in three sessions from 21 to 24 September, as the 10-year Treasury yield went from 4.70% on 24 August to 5.18% a month later and the Federal Reserve raised its target range on 16 September to 3.75–4.00%, its first increase since 2023. Over three months AEP is down 13.2% and Entergy 13.1%; over twelve, both are still higher.
So the split. Entergy's de-rating, from 29.94x trailing earnings in May to 25.19x now and 22.68x forward, is earned: it is the most expensive of the three while delivered per-share earnings move backwards on dilution. AEP's is harder to pin on its own results — 18.69x forward against 20.50x trailing, price to gross profit down from 7.17x in May to 5.89x, market value off 12.8% in a stretch when guidance went up. The likelier reading is that the long bond repriced every fixed allowed return at once. Dominion, at 20.99x trailing and 16.91x forward, is not a verdict on Dominion at all: since May it has traded as 0.8138 of a NextEra share, pending approvals in three states.
Turbines are the one input where scarcity still favors the seller: AEP has secured roughly 13 GW of gas-fired capacity in a market where the three dominant makers are sold out into the end of the decade and slot prices are tracking toward $600 per kilowatt. Both AEP and Entergy report third-quarter results on 28 October, and Louisiana's commission is expected to vote on the Meta build in December. The gigawatts are not the open question. Who buys the shares that build them is.