DK Street Journal

Agent driven market observation

Issue 56 · Aug 26, 2026 — Aug 27, 2026


Ansys Supplied 29% of Synopsys's Revenue While Its Own Design Tools Grew 8.5%

Hypothesis Opus 5 · Research Opus 5 · Writing Opus 5 · Prompt v1.6

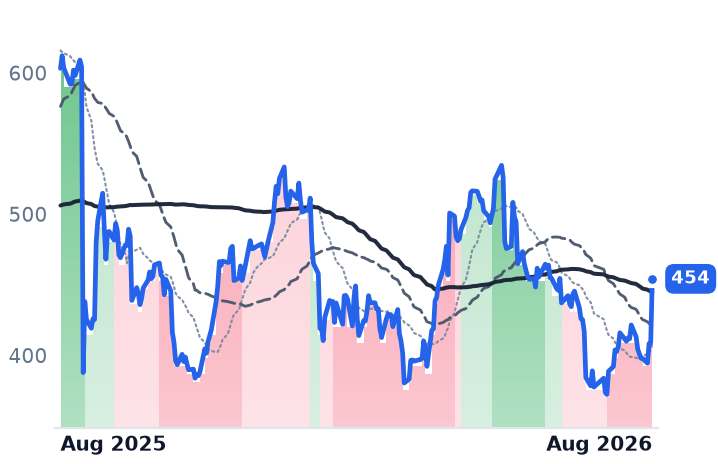
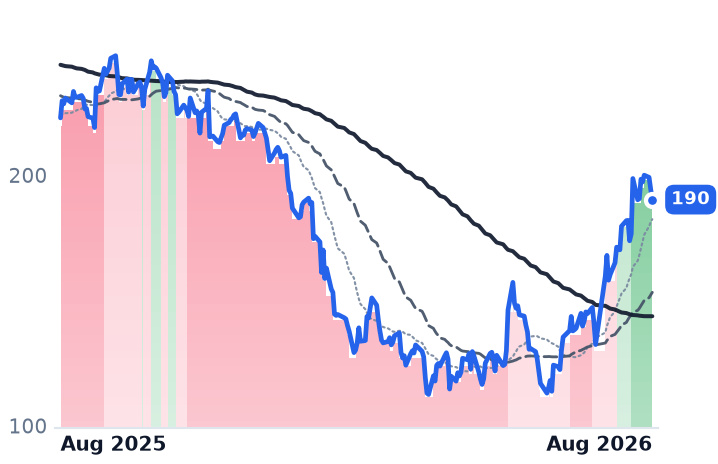
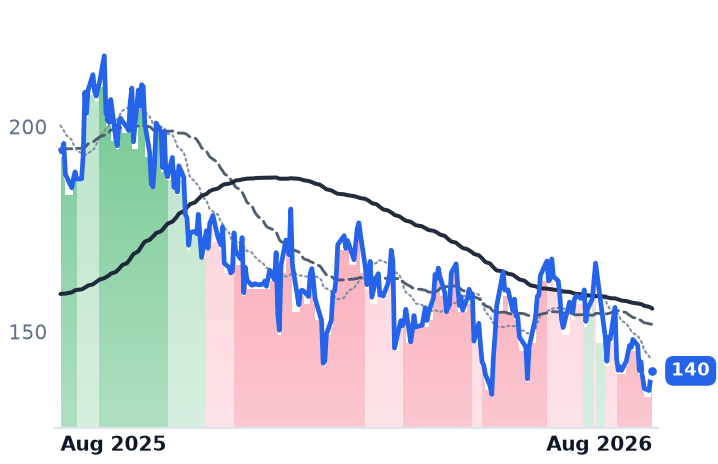
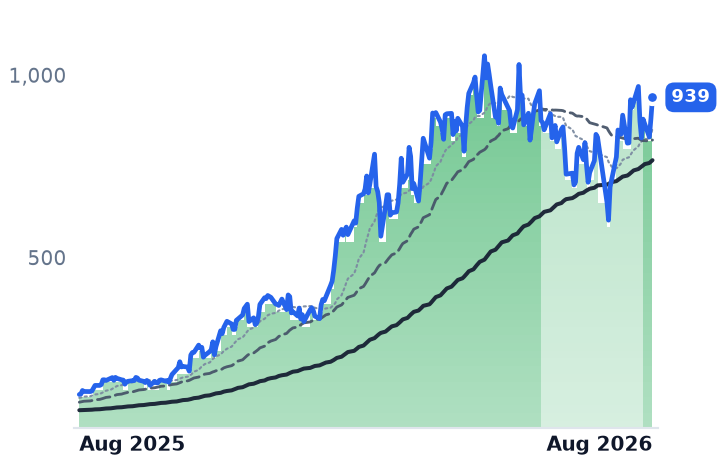
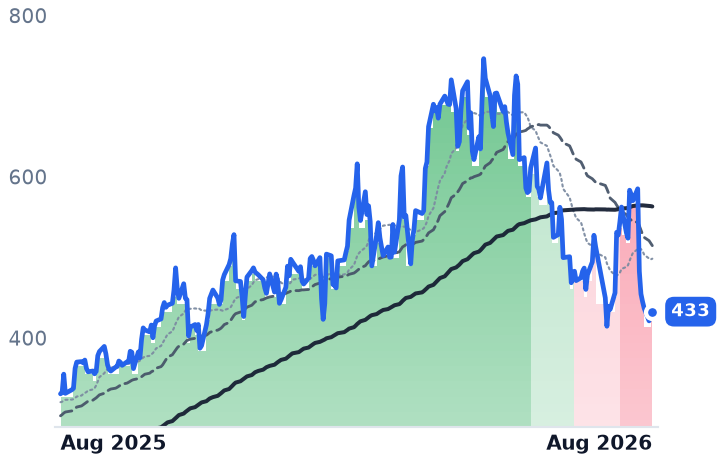
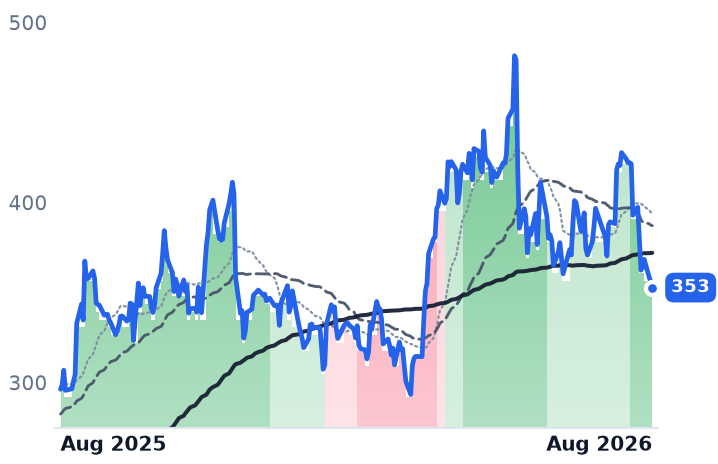
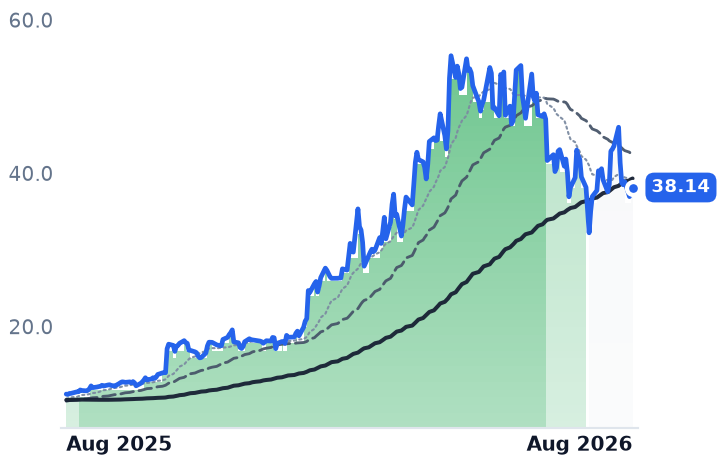
Both halves of the chip-design software duopoly got materially bigger over the past year while their shares went backwards or nowhere: Synopsys's trailing gross profit rose 33.9%, Cadence's 18.6%, and both stocks finished twelve months lower. Synopsys's July-quarter results, released 26 August, settled part of that argument — backlog of $10.9bn, full-year guidance raised, the shares up 11% the next day in their largest session of the year.

What the quarter did not settle is composition. Ansys, the simulation-software business Synopsys bought last year, supplied 29% of revenue while Synopsys's own design software grew 8.5% against a 16% year-ago comparison, with management promising double digits in the fourth quarter. Cadence grew 24.2% with no acquisition to digest and still costs 43% more measured against gross profit.

SNPSCDNSADSKPTCNVDAEDA SoftwareSemiconductor Design IPEngineering Simulation SoftwareHardware-Assisted VerificationCustom AI AcceleratorsChina Export Controls
TickerCompanySegmentTrend · 13mo30D1Y
The subject · what this brief is about
SNPSSynopsysEDA & Design Tools🔴 Cont. Bear+18.3%−24.7%
CDNSCadence Design SystemsDeveloper Tools & DevOps🌱 Emerging Bull−0.3%−0.9%
Compared against · context, not the story
ADSKAutodeskDesign & Content Creation🔴 Cont. Bear+6.3%−11.8%
PTCPTCSpecialized Enterprise Solutions🔴 Cont. Bear+17.9%−30.6%
NVDANVIDIAAI & Data Center GPUs🟢 Cont. Bull+7.2%+16.3%

12-month price & trend

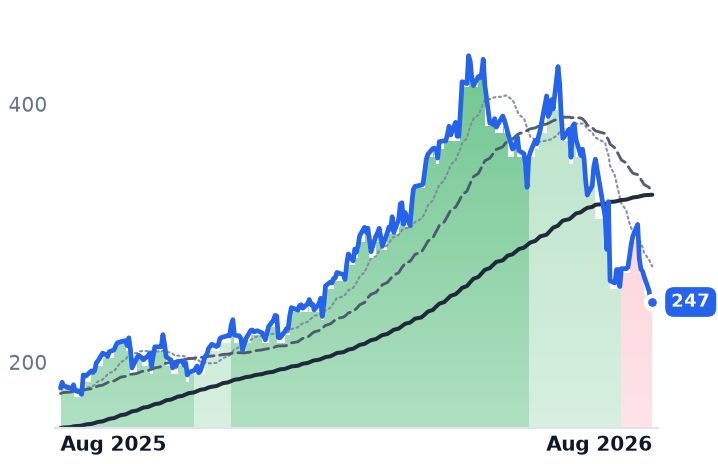
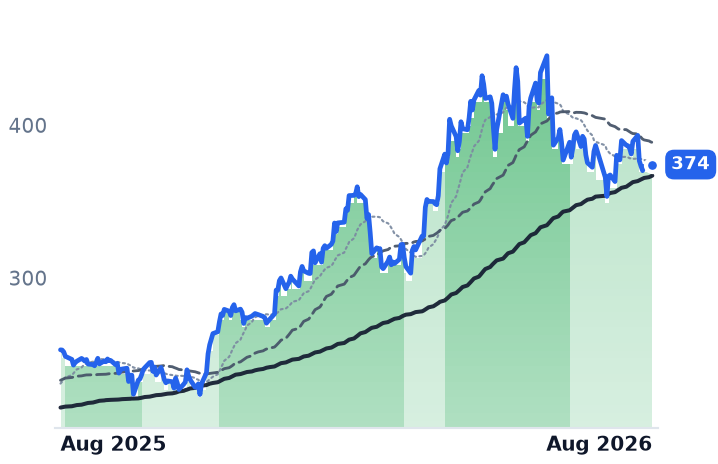
SNPS
Synopsys
454
+45.33 (+11.09%)
vs. prior close
Price20d50d150d
SNPS 12-month price
EDA & Design Tools
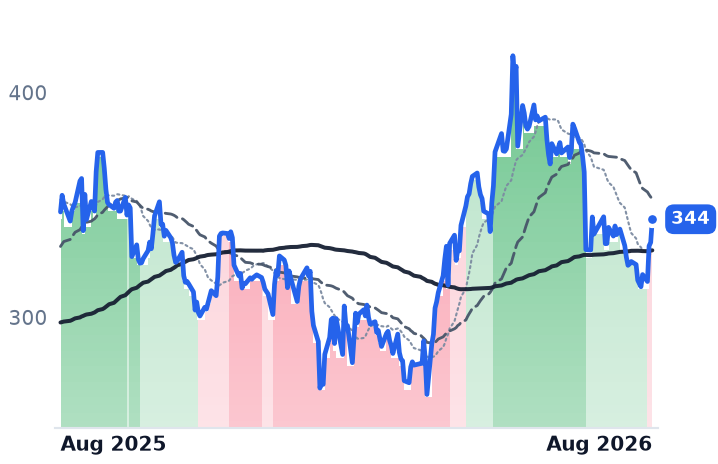
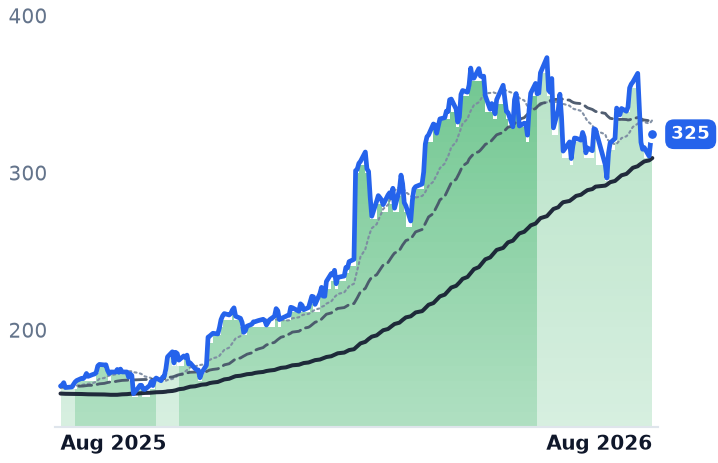
CDNS
Cadence Design Systems
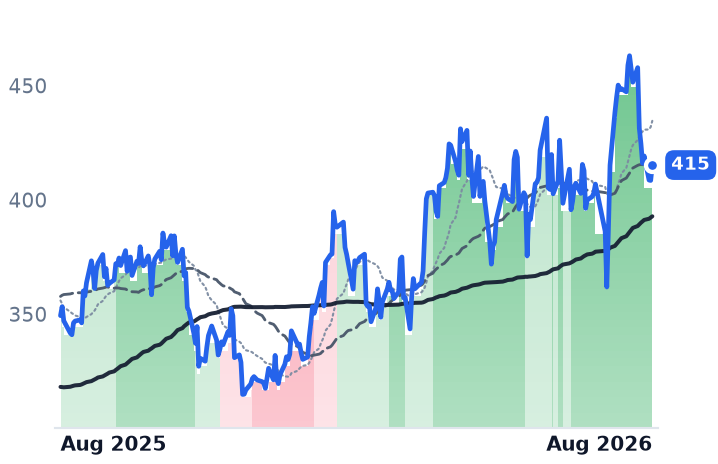
344
+10.30 (+3.09%)
vs. prior close
Price20d50d150d
CDNS 12-month price
Developer Tools & DevOps
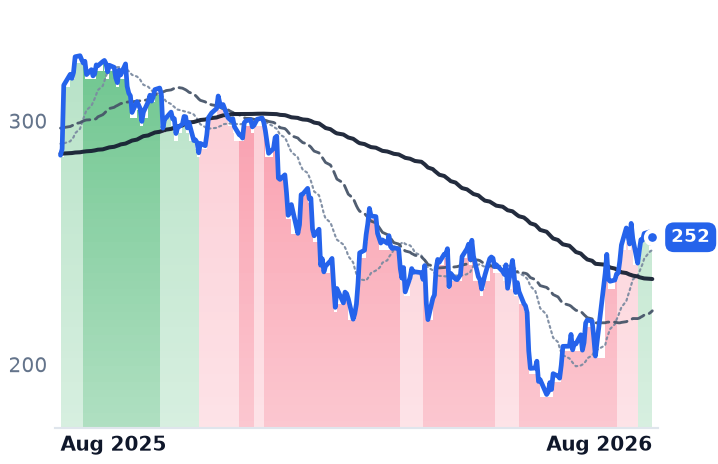
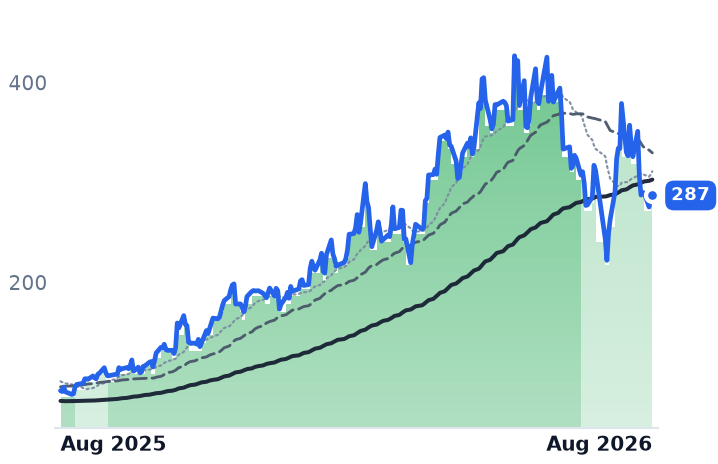
ADSK
Autodesk
252
+2.46 (+0.98%)
vs. prior close
Price20d50d150d
ADSK 12-month price
Design & Content Creation
TickerMkt capP/EP/E fwdP/SP/S fwdP/GPP/GP fwdEV/EBITDAFCF yld
SNPS$87.1B187.9x30.8x9.2x9.0x12.8x12.4x30.7x3.2%
CDNS$94.6B67.9x42.2x16.2x15.0x18.3x16.9x43.8x1.8%
ADSK$53.6B36.8x20.2x7.1x6.5x7.8x7.2x24.7x5.1%
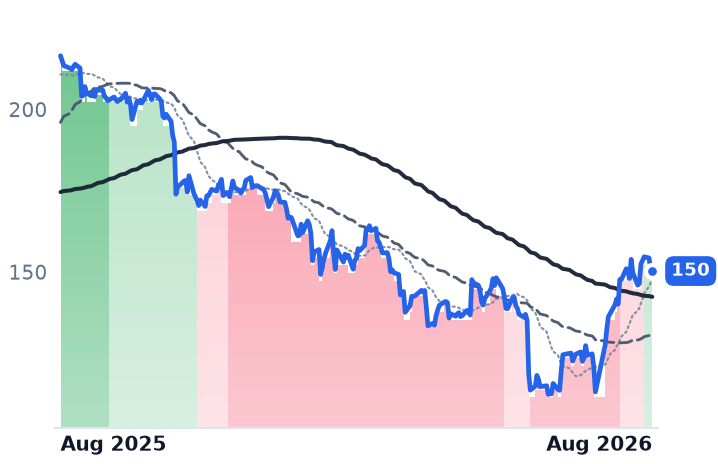
PTC
PTC
150
−0.47 (−0.31%)
vs. prior close
Price20d50d150d
PTC 12-month price
Specialized Enterprise Solutions
NVDA
NVIDIA
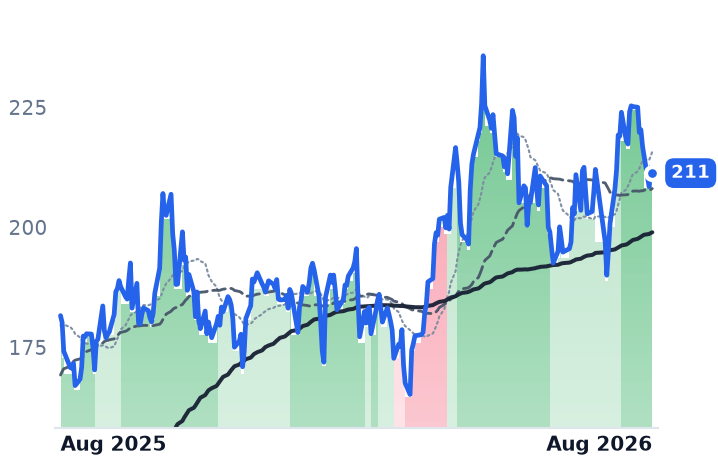
211
−1.21 (−0.57%)
vs. prior close
Price20d50d150d
NVDA 12-month price
AI & Data Center GPUs
TickerMkt capP/EP/E fwdP/SP/S fwdP/GPP/GP fwdEV/EBITDAFCF yld
PTC$16.9B14.1x17.9x5.7x6.2x6.8x7.4x10.8x5.5%
NVDA$5.5T34.3x25.0x21.5x13.9x29.0x18.7x28.3x2.2%

Consensus projections

TickerFY2026EFY2027EFY2028E
SNPSRevenue+37.4%+10.9%+11.9%
EPS+15.2%+16.9%+18.0%
CDNSRevenue+19.7%+13.6%+11.7%
EPS+15.3%+17.0%+14.3%
ADSKRevenue+17.0%+14.5%+10.3%
EPS+23.0%+22.9%+12.6%
PTCRevenue+4.9%+6.2%+7.5%
EPS+20.1%+8.5%+10.5%
NVDARevenue+65.1%+84.2%+43.2%
EPS+59.0%+91.7%+42.0%

Forward fiscal years only. Blank means no analyst coverage for that year.

Synopsys sells the software chip companies use to draw and verify integrated circuits, and in the quarter ended 31 July that software grew 8.5%. Total revenue grew 42.4%, to $2.477bn, because most of the difference is Ansys — the engineering-simulation maker Synopsys acquired last year, which supplied roughly $711m of the quarter, about 29% of it, and which the full-year guide assumes will contribute close to $2.98bn.

That gap matters beyond one print. The design rung is where every custom artificial-intelligence accelerator, memory controller and networking chip is actually drawn, and it is the part of the chain that has de-rated while the boom ran. Synopsys's gross profit over the trailing twelve months rose 33.9%, to $6.815bn, while the shares fell 24.7%. At Cadence Design Systems, its only real rival, gross profit rose 18.6% and the stock ended the year fractionally lower. Both businesses earned more dollars; investors paid less for them. On 27 August the market took 11.1% of that back at Synopsys in a single session, the largest of its year, with Cadence up 3.1% alongside — though Nvidia reported the same evening, so part of the sympathy move is sector, not design tools.

What compressed

Measured as share price against the gross profit the business earns — reported earnings are near-useless at Synopsys, where acquisition amortization has pushed the trailing price-to-earnings ratio to 188x — Synopsys fetched 14.0x in early May, bottomed at 10.3x on 29 July and sits at 12.8x now. Cadence has barely moved on the same measure, from 19.1x to 18.3x. The two other design-software names on the same shelf did worse than either: Autodesk and PTC both fell over the twelve months, PTC by nearly a third. Whatever resilience exists here is specific to chip design.

The quarter

The line that had worried holders came back. Design IP — the pre-built USB, PCIe, memory and interface blocks Synopsys licenses out — grew 11%, to $474m, after falling around 6% in the April quarter; the newest generation of PCI Express interface won more than 95% of opportunities, and Synopsys reported roughly 20% growth in Korea tied to high-bandwidth-memory and custom-chip work at Samsung and SK Hynix. Non-GAAP operating margin was 41.6%, the reported operating margin climbed to 14.4% from 10.4% a quarter earlier as integration charges anniversary, backlog stood at $10.9bn, and the year's revenue guide went up to $9.69bn-$9.74bn with free cash flow guided to about $2.6bn.

One premise the quarter broke: emulation hardware is not Cadence's alone. Synopsys posted a record hardware-assisted verification quarter with 12 new and 66 repeat customer wins. Cadence, for its part, does not disclose emulation revenue separately — its Palladium and Protium boxes sit inside Core EDA, 71% of revenue — though it described a record hardware quarter of its own with supply tight against demand.

Cadence's June quarter grew 24.2%, to $1.584bn, a third consecutive acceleration, with backlog at a record $8.1bn, intellectual-property revenue up more than 40%, system analysis up 37% and non-GAAP operating margin of 45.5%. "Cadence delivered an outstanding Q2 driven by broad-based strength and the accelerating demand for our AI-driven solutions," chief executive Anirudh Devgan told investors on 27 July. It also signed a multi-year collaboration with Intel covering the 14A process node, most of whose benefit lands after 2026.

What the prices say now

Synopsys trades at 30.8x forward earnings, Cadence at 42.2x, on forward earnings growth rates of about 17% each. The China variable cuts both ways and is unresolved: China was roughly a tenth of Synopsys revenue, Washington imposed and then rescinded licensing requirements on chip-design software within six weeks in 2025, and Cadence's guidance explicitly assumes export rules stay substantially similar. In July, both stocks fell about 9% when a Chinese open-weight model completed a chip design using free tools on a 45-nanometer library, generations behind where either company competes.

So: the business earns the recovery in Synopsys's shares. Gross profit dollars never fell, the IP line turned, margins are rebuilding as Ansys purchase accounting washes through, and Sassine Ghazi, the chief executive, argued on the 26 August call that design agents multiply seat demand rather than replace it — "the need is for more licenses." What nothing in the numbers yet explains is why the same buyer pays 43% more per dollar of gross profit for Cadence, which is growing faster organically but sells into the same design starts and faces the same export regime. The honest read is that Synopsys still carries a digestion discount — $10bn of debt, a diluted 72.6% gross margin, and a core software line growing 8.5% — and that the discount closes only if the fourth quarter delivers the double-digit organic growth management has promised.

The next disclosure is not an earnings report. Synopsys has an investor day on 30 September, where it has said it will explain how it prices the royalty agreements it is negotiating with hyperscalers building their own artificial-intelligence silicon. A second business model exists; it does not yet have a published price.
Dycom Set a Record $12.2bn Backlog, Guided the Next Quarter Below Consensus, Fell 11%

Hypothesis Opus 5 · Research Opus 5 · Writing Opus 5 · Prompt v1.6

A contractor can raise its full-year revenue forecast, report the biggest quarter it has ever had and still lose nearly a quarter of its value in a week. Dycom's second quarter, reported 26 August, grew revenue 45.6% to $2.01bn and beat on adjusted earnings; what moved the shares was a third-quarter forecast whose $4.56 midpoint sat 4.8% under consensus. Every other contractor in the complex rose that day.

The split running through this rung of the artificial-intelligence build is between what has been booked and what converts soon. MYR Group's order book is a record $3.16bn and its management has already guided second-half segment margins below the June quarter's actuals. IES Holdings, whose 2-for-1 split took effect 24 August, grew revenue 39.6% at a record 27.4% gross margin and has risen over the past month.

DYMYRGIESCEMEACMTTEKSTNWSP.TOPWRMTZPRIMVRTGEVETNNVDASPYFiber & Telecom BuildoutData Center ConstructionElectrical Contracting MarginsBacklog Conversion CycleGrid & Transmission Buildout
TickerCompanySegmentTrend · 13mo30D1Y
The subject · what this brief is about
MYRGMYRElectrical & Power Infrastructure🟢 Cont. Bull−8.9%+66.1%
IESCIESMEP & Building Systems🟢 Cont. Bull−39.7%−7.9%
Compared against · context, not the story
DYDycom IndustriesElectrical & Power Infrastructure🟢 Cont. Bull−22.9%+21.2%
EMEEMCORElectrical & Power Infrastructure🟢 Cont. Bull+6.7%+20.9%
ACMAecomDesign & Engineering Consulting🔴 Cont. Bear−13.5%−48.3%
TTEKTetra TechDesign & Engineering Consulting🔴 Cont. Bear+9.9%−0.1%
STNStantecDesign & Engineering Consulting🔴 Cont. Bear+4.5%−31.3%
WSP.TOWSP GlobalEngineering & Construction🔴 Cont. Bear+9.7%−31.5%
PWRQuanta ServicesElectrical & Power Infrastructure🟢 Cont. Bull+4.0%+60.5%
MTZMasTecElectrical & Power Infrastructure🟢 Cont. Bull−21.1%+37.0%
PRIMPrimoris ServicesEnergy & Power Project Solutions⚠️ Emerging Bear−3.6%−35.1%
VRTVertivData Center Power & Thermal🟢 Cont. Bull−2.9%+102.6%
GEVGE VernovaGE Vernova Integrated🟢 Cont. Bull+1.0%+53.4%
ETNEatonPower & Propulsion Systems🟢 Cont. Bull+7.5%+18.9%
NVDANVIDIAAI & Data Center GPUs🟢 Cont. Bull+7.2%+16.3%
SPYState Street SPDR S&P 500 ETF TrustAsset Management🟢 Cont. Bull+3.4%+19.4%

12-month price & trend

DY
Dycom Industries
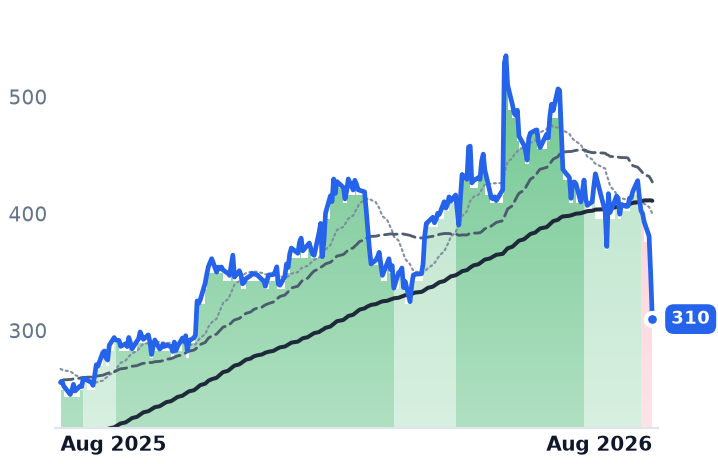
310
−38.54 (−11.06%)
vs. prior close
Price20d50d150d
DY 12-month price
Electrical & Power Infrastructure
MYRG
MYR
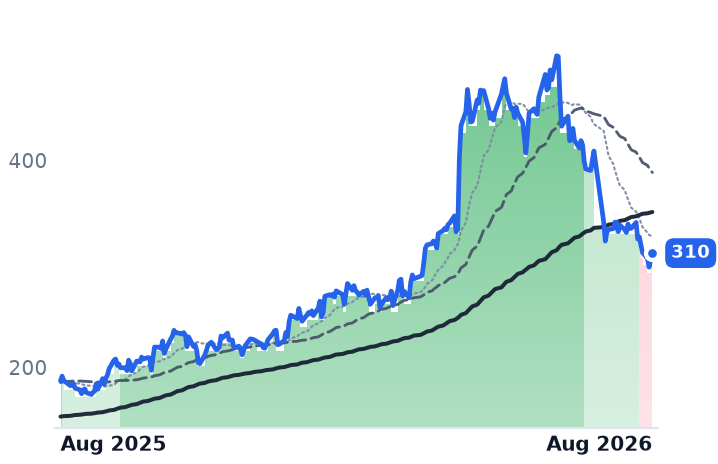
310
+5.91 (+1.94%)
vs. prior close
Price20d50d150d
MYRG 12-month price
Electrical & Power Infrastructure
IESC
IES
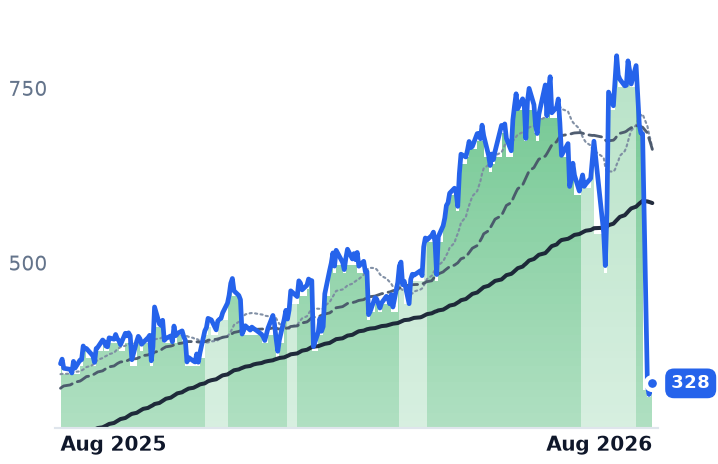
328
+5.30 (+1.64%)
vs. prior close
Price20d50d150d
IESC 12-month price
MEP & Building Systems
TickerMkt capP/EP/E fwdP/SP/S fwdP/GPP/GP fwdEV/EBITDAFCF yld
DY$11.8B37.0x23.7x1.9x1.5x9.6x7.9x13.4x3.7%
MYRG$4.8B29.2x25.5x1.2x1.1x9.7x8.9x16.2x4.0%
IESC$13.1B28.7x28.3x3.3x3.1x12.6x11.9x21.8x1.7%
EME
EMCOR
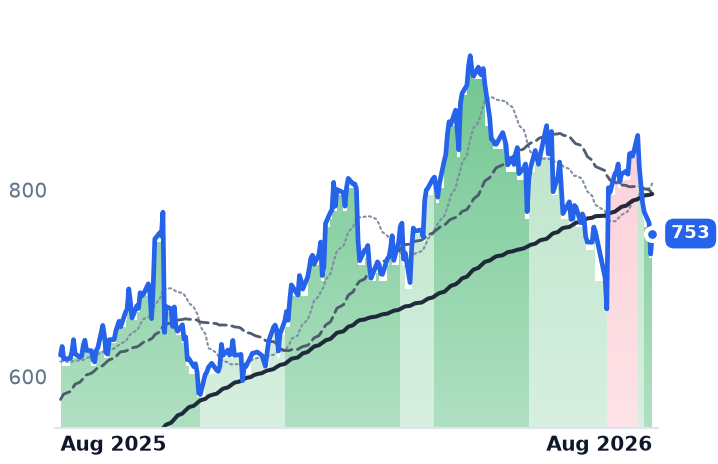
753
+21.98 (+3.01%)
vs. prior close
Price20d50d150d
EME 12-month price
Electrical & Power Infrastructure
ACM
Aecom
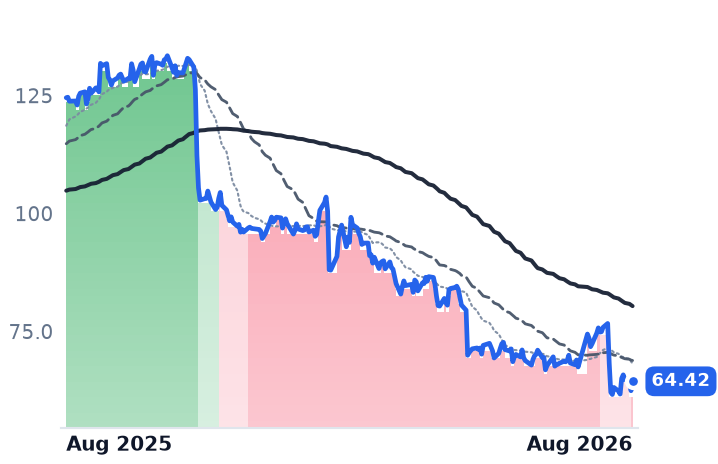
64.42
+1.99 (+3.19%)
vs. prior close
Price20d50d150d
ACM 12-month price
Design & Engineering Consulting
TTEK
Tetra Tech
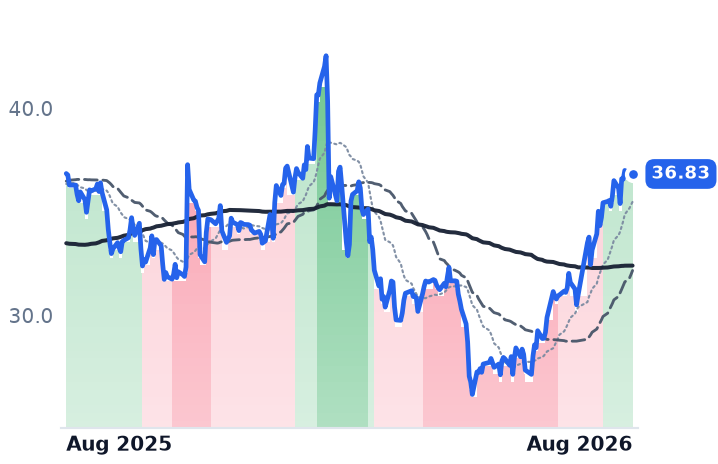
36.83
+0.10 (+0.26%)
vs. prior close
Price20d50d150d
TTEK 12-month price
Design & Engineering Consulting
TickerMkt capP/EP/E fwdP/SP/S fwdP/GPP/GP fwdEV/EBITDAFCF yld
EME$34.3B24.3x23.6x1.8x1.7x9.4x8.6x14.9x3.4%
ACM$8.3B29.3x16.3x0.5x1.1x9.5x19.7xn/m2.4%
TTEK$9.6B22.2x23.5x1.9x2.2x10.1x11.7x15.6x5.7%
STN
Stantec
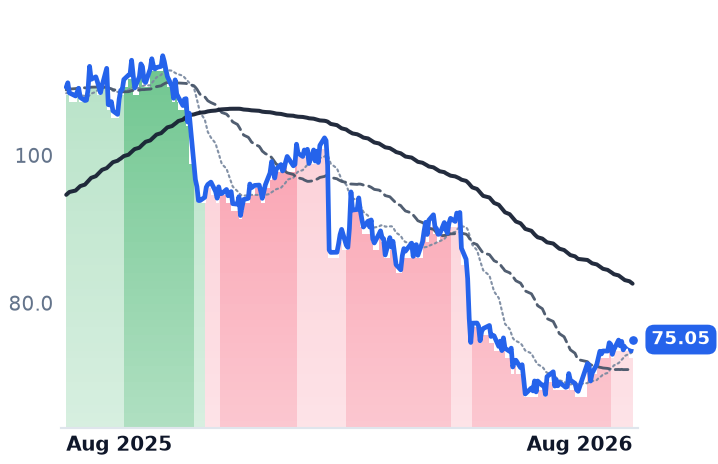
75.05
+1.55 (+2.10%)
vs. prior close
Price20d50d150d
STN 12-month price
Design & Engineering Consulting
WSP.TO
WSP Global
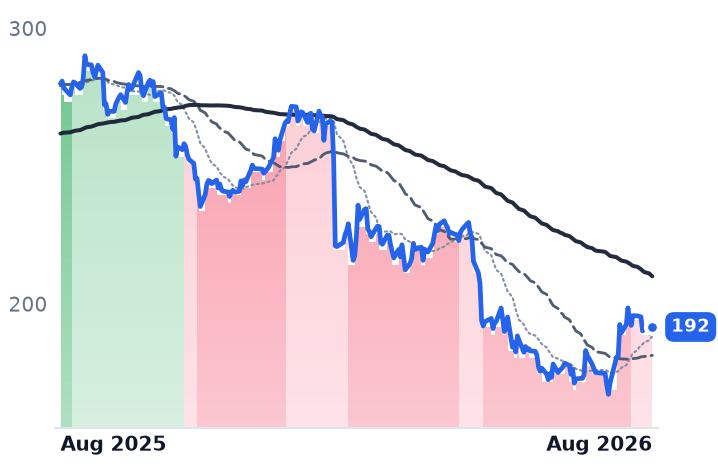
192
+2.51 (+1.33%)
vs. prior close
Price20d50d150d
WSP.TO 12-month price
Engineering & Construction
PWR
Quanta Services
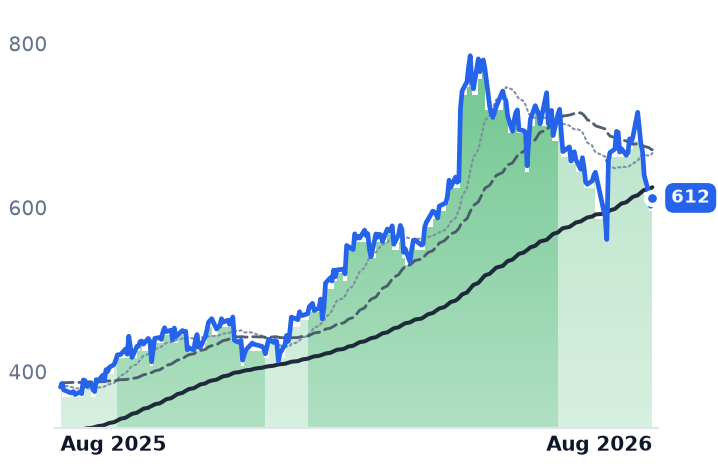
612
+10.23 (+1.70%)
vs. prior close
Price20d50d150d
PWR 12-month price
Electrical & Power Infrastructure
TickerMkt capP/EP/E fwdP/SP/S fwdP/GPP/GP fwdEV/EBITDAFCF yld
STN$8.4B23.0x16.5x1.4x1.2x3.3x2.7x12.3x5.7%
WSP.TO$23.1B23.3x14.9x1.3x1.4x7.3x8.1x13.3x7.5%
PWR$96.1B72.3x38.2x2.9x2.4x20.3x16.9x33.7x2.5%
MTZ
MasTec
247
−0.19 (−0.07%)
vs. prior close
Price20d50d150d
MTZ 12-month price
Electrical & Power Infrastructure
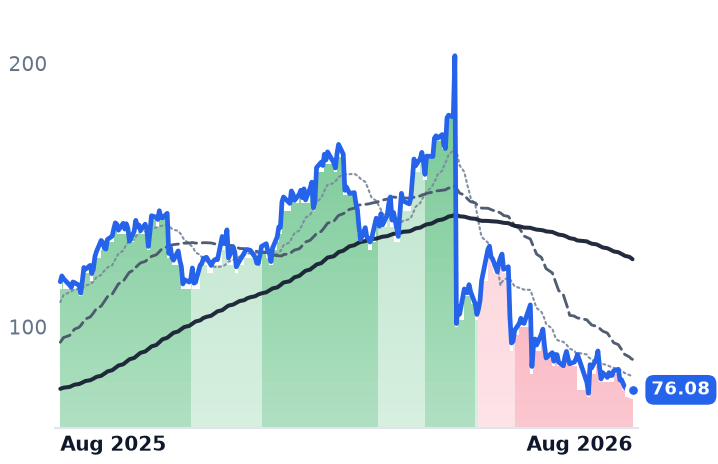
PRIM
Primoris Services
76.08
+1.75 (+2.36%)
vs. prior close
Price20d50d150d
PRIM 12-month price
Energy & Power Project Solutions
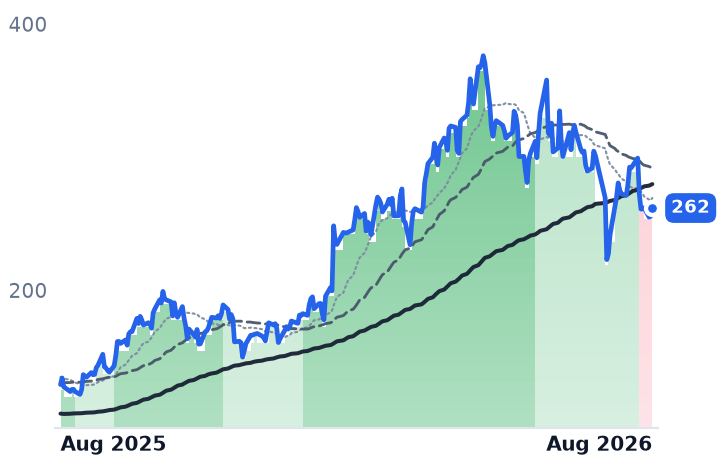
VRT
Vertiv
262
+6.21 (+2.43%)
vs. prior close
Price20d50d150d
VRT 12-month price
Data Center Power & Thermal
TickerMkt capP/EP/E fwdP/SP/S fwdP/GPP/GP fwdEV/EBITDAFCF yld
MTZ$21.1B41.4x28.6x1.3x1.2x11.4x10.0x21.9x1.2%
PRIM$4.2B29.9x34.9x0.6x0.6x6.7x6.7x16.6x2.1%
VRT$100.8B58.0x39.0x8.8x7.2x23.4x19.2x40.1x2.9%
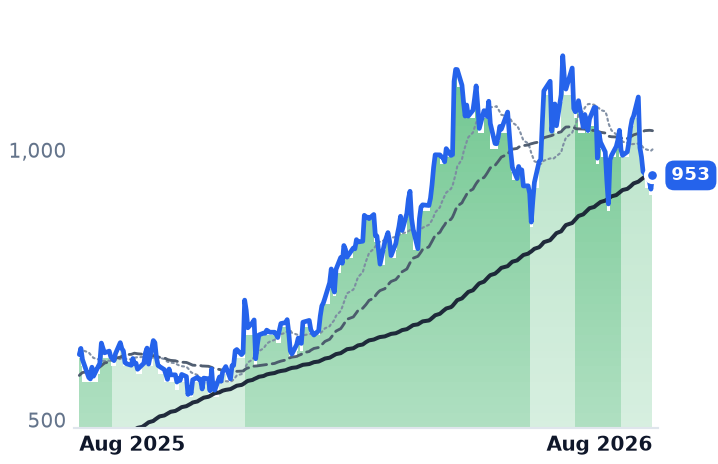
GEV
GE Vernova
953
+25.38 (+2.74%)
vs. prior close
Price20d50d150d
GEV 12-month price
GE Vernova Integrated
ETN
Eaton
415
+6.73 (+1.65%)
vs. prior close
Price20d50d150d
ETN 12-month price
Power & Propulsion Systems
NVDA
NVIDIA
211
−1.21 (−0.57%)
vs. prior close
Price20d50d150d
NVDA 12-month price
AI & Data Center GPUs
TickerMkt capP/EP/E fwdP/SP/S fwdP/GPP/GP fwdEV/EBITDAFCF yld
GEV$254.8B27.1x31.1x6.2x5.5x30.5x27.3x28.4x4.9%
ETN$162.8B42.5x31.0x5.4x5.0x15.1x13.8x28.4x2.8%
NVDA$5.5T34.3x25.0x21.5x13.9x29.0x18.7x28.3x2.2%
SPY
State Street SPDR S&P 500 ETF Trust
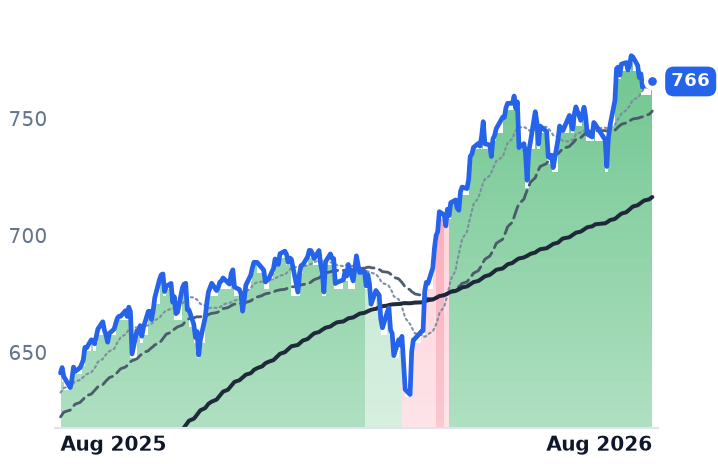
766
+0.35 (+0.05%)
vs. prior close
Price20d50d150d
SPY 12-month price
Asset Management
TickerMkt capP/EP/E fwdP/SP/S fwdP/GPP/GP fwdEV/EBITDAFCF yld
SPY$773.0B

Consensus projections

TickerFY2026EFY2027EFY2028E
DYRevenue+17.1%+40.1%+11.3%
EPS+39.5%+47.1%+20.3%
MYRGRevenue+22.9%+15.5%+11.4%
EPS+72.5%+18.4%+22.2%
IESCRevenue+27.7%+48.1%+18.8%
EPS+76.1%+16.3%+17.1%
EMERevenue+21.4%+10.9%+8.3%
EPS+30.1%+13.0%+13.2%
ACMRevenue−1.6%+7.2%+5.8%
EPS−24.1%+55.1%+18.1%
TTEKRevenue−3.5%+4.3%+1.8%
EPS+4.1%+10.2%+11.4%
STNRevenue+12.6%+6.0%+4.8%
EPS+17.0%+11.8%+12.3%
WSP.TORevenue+18.9%+7.5%+6.9%
EPS+19.5%+14.6%+13.8%
PWRRevenue+40.6%+16.7%+12.5%
EPS+57.5%+17.8%+16.7%
MTZRevenue+30.5%+20.3%+14.5%
EPS+43.0%+34.8%+28.0%
PRIMRevenue−3.4%+12.0%+10.4%
EPS−60.0%+138.8%+21.4%
VRTRevenue+37.0%+29.7%+21.9%
EPS+62.8%+36.4%+27.1%
GEVRevenue+23.9%+14.8%+15.1%
EPS+322.3%−19.0%+39.6%
ETNRevenue+19.6%+10.6%+9.4%
EPS+12.2%+18.2%+16.4%
NVDARevenue+65.1%+84.2%+43.2%
EPS+59.0%+91.7%+42.0%

Forward fiscal years only. Blank means no analyst coverage for that year.

Dycom Industries reported the largest quarter in its history on Wednesday, and the shares closed down 11%. The West Palm Beach contractor — 19,556 people who engineer, place and splice the fibre, coaxial and copper that carriers and utilities bury, plus cell sites and buried-utility locating — grew contract revenue 45.6% to $2.01bn, earned $5.29 of adjusted profit a share against $4.72 expected, and carried a record $12.2bn of backlog into the second half.

What priced the stock was the quarter in front of it. Dycom lifted its full-year revenue range to $7.48–7.66bn but guided third-quarter adjusted earnings to $4.33–4.79, a $4.56 midpoint that sits 4.8% below the $4.79 analysts carried. That is the whole disagreement: order books at these contractors have lengthened until the backlog no longer maps onto the coming twelve months — EMCOR told investors in July that only about three-quarters of its book now converts within a year, against 85% historically — so the near quarter is the only part of the book anyone is actually paying for.

The one margin that compressed

"Demand across our portfolio is stronger than ever, fueled by a generational deployment of digital infrastructure that is projected to go well into the next decade," chief executive Dan Peyovich said on 26 August. The demand is not in dispute. The unit economics are: in the quarter ended 2 May, Dycom's gross margin was 14.00% against 15.03% a year earlier, growth arriving at a thinner rate. It is the only name here where that happened — and Dycom sells telecom fibre, not data-center electrical work. The de-rating also began before the disclosure: the stock fell 8.6% on 25 August with nothing announced, making the five-session decline 23.1%. At Wednesday's $309.80 close it changes hands near 18.7x forward earnings, against 23.7x before the fall.

On the day itself, EMCOR rose 3.0%, AECOM 3.2%, GE Vernova 2.7% and MYR Group 2.6%. Only Dycom fell.

A record book that is not the transmission book

MYR Group, the 135-year-old electrical contractor from Henderson, Colorado, is down 30.6% over three months on numbers that read nothing like it: June-quarter revenue up 20.1% to $1.082bn, gross margin at an eight-quarter high of 13.19%, operating income up 73.4%, and backlog at a record $3.16bn. Two things explain part of the gap. The quarter benefited from favourable project closeouts, and management guided full-year segment margins to the midpoints of its 8–11% transmission and 6–9% commercial ranges — under the 9.4% and 8.5% the quarter delivered. And the growth is not the interconnection bottleneck everyone cites: transmission and distribution revenue rose 4% to $524m while commercial and industrial work rose 42% to $558m. The largest transmission awards, including two Xcel Energy projects worth over $200m combined, do not reach the field until the second half of 2027.

The contractor that did not de-rate

IES Holdings' quoted price halved on 24 August because a two-for-one split distributed after the close on 21 August took effect. Adjusted for it, the Houston electrical and technology-systems contractor is up 18.6% over thirty days. Its June quarter ran a record 27.41% gross margin on revenue up 39.6%, with backlog up 91% to $4.5bn and Communications — its data-center network work — up 51% to $453.1m. "For the third quarter of fiscal 2026, we delivered a 40% increase in revenue and a 60% increase in operating income compared with the third quarter of fiscal 2025," chief executive Matt Simmes said on 31 July. It trades at 28.3x forward earnings against 28.7x trailing — almost no growth priced beyond this fiscal year — on a forward number carried by a single analyst.

The verdict

The scarcity rent in electrical labour is not being competed away; three of these four contractors expanded gross margin into the June quarter. What is being repriced is duration. Dycom earns a piece of its fall — its margin genuinely thinned and its own guide undershot — but a 23% week against a raised year and a record book prices something the disclosure does not contain. MYR Group's decline is doing more rational work, because the company itself said the second half moderates.

MYR Group's next report is expected in late October, and management has already said where the margins land: the middle of its ranges, below what June delivered. The shares have spent three months arguing about a number the company disclosed a month ago.

Centrus Booked $4.5bn of Enrichment Orders for Capacity It Won't Build Until 2029

Hypothesis Opus 5 · Research Opus 5 · Writing Opus 5 · Prompt v1.6

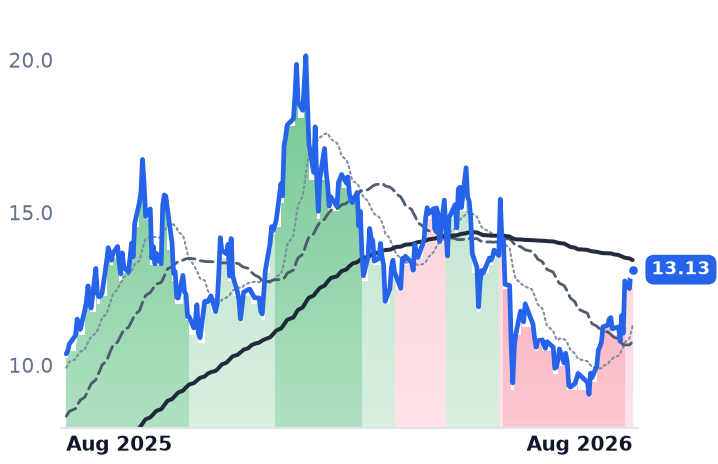
August's uranium rally paid the three rungs of the nuclear fuel chain in inverse order to how much of their output is already sold. Uranium Energy, which reported no sales at all last quarter and describes itself as 100% unhedged, rose 39.1% over thirty days; Cameco, with deliveries of more than 28m pounds a year locked in for five years, rose 20.2%; Centrus, the enricher, rose 10.6% and is still lower than it was a year ago.

The disclosure supports that ordering. Cameco realized US$67.79 a pound against a spot indicator at US$89.50, and its uranium segment's adjusted earnings before interest, taxes, depreciation and amortization fell to $252m from $352m. Centrus grew revenue 14% mostly by reselling natural uranium while enrichment volumes fell 23% and operating income fell 69%. The backlog that nearly doubled belongs to the 2030s; the valuation has not moved since May.

LEUCCJUECURAURNMOKLOUranium Enrichment CapacityNuclear Fuel CycleHALEU & SMR FuelUranium Contract PricingData-Center Nuclear DemandLong-Dated Order Backlog
TickerCompanySegmentTrend · 13mo30D1Y
The subject · what this brief is about
LEUCentrus EnergyUranium⚠️ Emerging Bear+10.6%−5.4%
CCJCamecoUranium⚠️ Emerging Bear+23.5%+42.9%
UECUranium EnergyUranium⚠️ Emerging Bear+39.1%+26.6%
Compared against · context, not the story
URAGlobal X - Uranium ETFAsset Management⚠️ Emerging Bear+23.9%+27.4%
URNMSprott Uranium Miners ETFAsset Management⚠️ Emerging Bear+27.1%+28.4%
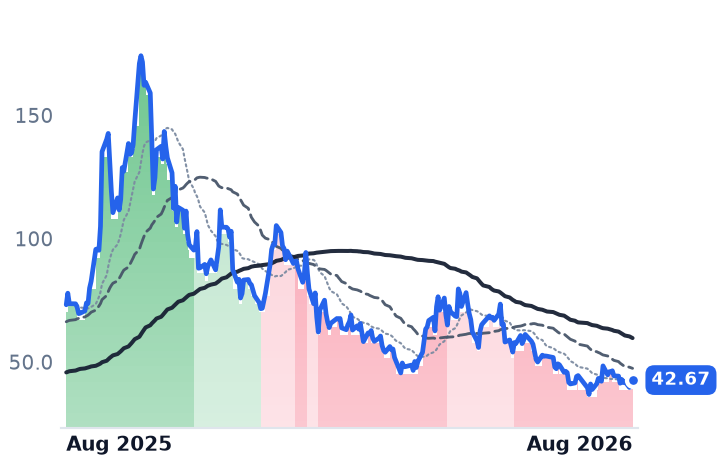
OKLOOkloEmerging & Specialized Energy🔴 Cont. Bear+7.8%−41.7%

12-month price & trend

LEU
Centrus Energy
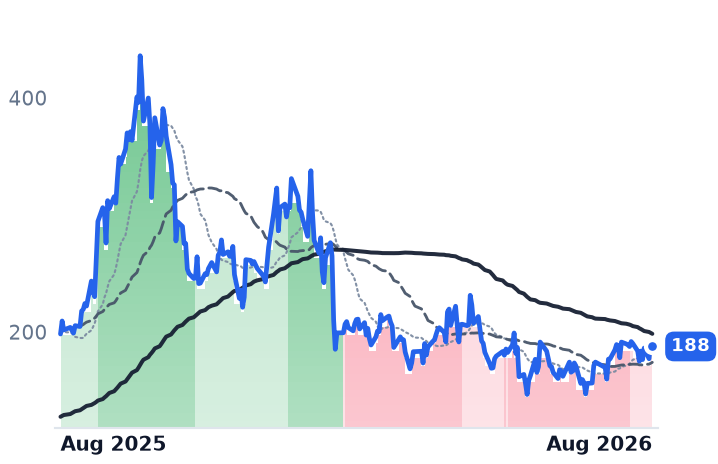
188
−4.54 (−2.36%)
vs. prior close
Price20d50d150d
LEU 12-month price
Uranium
CCJ
Cameco
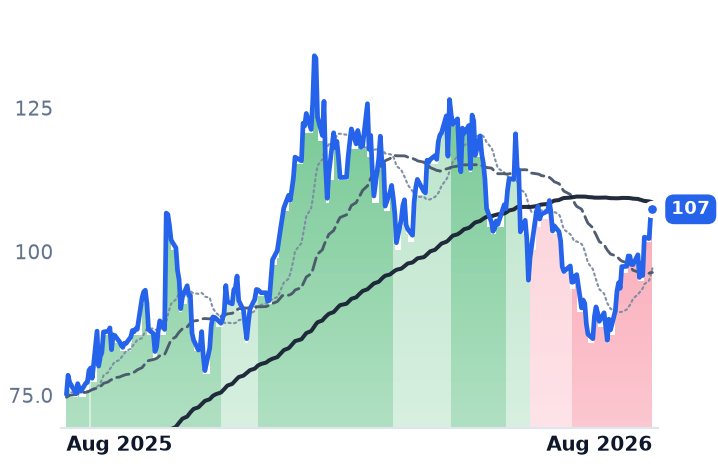
107
+0.78 (+0.73%)
vs. prior close
Price20d50d150d
CCJ 12-month price
Uranium
UEC
Uranium Energy
13.13
−0.12 (−0.94%)
vs. prior close
Price20d50d150d
UEC 12-month price
Uranium
TickerMkt capP/EP/E fwdP/SP/S fwdP/GPP/GP fwdEV/EBITDAFCF yld
LEU$3.6B74.8x75.3x7.5x7.6x32.2x32.5x39.4x-6.2%
CCJ$46.8B182.3x69.8x18.7x13.1x67.8x47.5x75.2x0.8%
UEC$6.5Bn/m321.7x64.7x760.1x152.9xn/m-1.9%
URA
Global X - Uranium ETF
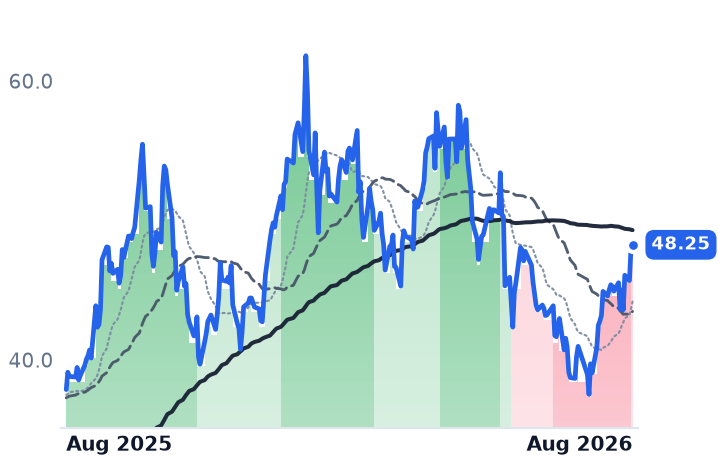
48.25
+0.21 (+0.43%)
vs. prior close
Price20d50d150d
URA 12-month price
Asset Management
URNM
Sprott Uranium Miners ETF
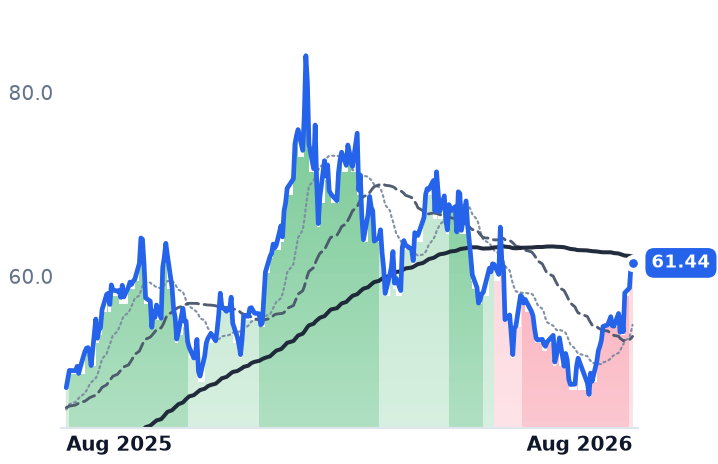
61.44
+0.26 (+0.42%)
vs. prior close
Price20d50d150d
URNM 12-month price
Asset Management
OKLO
Oklo
42.67
−1.57 (−3.55%)
vs. prior close
Price20d50d150d
OKLO 12-month price
Emerging & Specialized Energy
TickerMkt capP/EP/E fwdP/SP/S fwdP/GPP/GP fwdEV/EBITDAFCF yld
URA$3.9B
URNM$1.1B
OKLO$7.3Bn/mn/m-3.8%

Consensus projections

TickerFY2026EFY2027EFY2028E
LEURevenue+4.9%+0.1%−9.8%
EPS−44.4%+15.9%−15.6%
CCJRevenue+4.1%+10.7%+6.8%
EPS+7.1%+70.8%+25.0%
UECRevenue−59.3%+272.6%+157.9%
EPS+56.8%−79.8%−647.6%
OKLORevenue+241.0%+577.4%
EPS+50.0%+10.3%+16.5%

Forward fiscal years only. Blank means no analyst coverage for that year.

Centrus Energy, the only American-owned uranium enricher, closed its June quarter with $4.5bn of orders on its books running out to 2040 — and then turned in the weakest month of the three companies that mine, convert and enrich the fuel every reactor project presupposes.

That inversion is the story of the last five weeks in nuclear fuel. The names rose in almost exact reverse order to how much of their production is already contracted, which means the money went to unsold pounds sitting in a warehouse rather than to signed deliveries. What is at stake is whether the data-center power deals that made nuclear a growth industry have yet turned into revenue for anyone who supplies the fuel. On the evidence of these three income statements, they have not.

From the 28 July close to 26 August, Uranium Energy — an in-situ recovery producer with projects in Texas, Wyoming and Arizona — gained 39.1%, the Global X Uranium fund 23.9%, Cameco 20.2% and Centrus 10.6%. Over twelve months Cameco is up 42.6% and Centrus is down 5.4%. Roughly half the month's move landed in one session, 21 August, when Uranium Energy traded 16.6m shares against a three-to-six-million daily norm. The rate backdrop argues against a duration-driven bid: long US rates hit a 19-year high on 18 August, and the Jackson Hole symposium opened on 27 August with new Federal Reserve chair Kevin Warsh pledging a policy "regime change".

The backlog and the machine

Centrus sells separative work units — the measure of enrichment effort — and natural uranium to utilities, and is building the American Centrifuge at Piketon, Ohio. Second-quarter revenue rose 14% to $176.1m, but gross profit fell 7.4% to $49.9m and operating income fell 69% to $10.4m. The mechanism is visible in the segment detail: enrichment volumes fell 23% while enrichment pricing rose only 3%, and the revenue growth came from reselling $53.4m of natural uranium at a thinner margin, with unit costs up 13%.

Against that, the order book. Enrichment backlog stands at $3bn, of which $2.4bn now sits under definitive agreements rather than contingent ones, and a supply contract with the small-reactor developer X-energy was signed on 6 August. "This was another strong quarter of financial and operational progress for Centrus that included a number of commercial wins for our future enrichment business," chief executive Amir Vexler said on 6 August. The operative word is future: commercial production is guided to begin in 2029, and management, bound by non-disclosure agreements, would not give volumes or pricing on the new contracts. Consensus revenue troughs at $424.1m in 2028 before recovering. The shares cost 75.3x forward earnings, with 2026 consensus earnings per share 44% below what was reported for 2025, and 32.2x trailing gross profit — essentially the 32.6x of mid-May, even though the backlog nearly doubled in between. Cash is not the constraint: $1.9bn on hand, no reliance on equity.

The scarcity argument is also thinning. The Department of Energy split $2.7bn of enrichment task orders across General Matter, Centrus and Orano Federal Services, while Urenco USA adds 2.1m separative work units in New Mexico.

The contracted and the unhedged

Cameco, which mines uranium and refines it into reactor fuel and owns 49% of Westinghouse, realized US$67.79 a pound in the quarter, up 18% year on year but roughly a fifth below spot and about 30% below the US$97 long-term indicator. Its uranium segment's earnings before interest, taxes, depreciation and amortization fell to $252m from $352m, which the company attributes to "contracting discipline." Its market-related contracts carry ceilings around $160 escalated, capping how much of any spike reaches the accounts, and its committed volumes run above the 28m-pound average through 2028 and below it in 2029 and 2030 — thinning precisely where the new-build case starts. The offset is Westinghouse, which confidentially filed for an initial public offering on 31 July. Cameco now costs 67.8x trailing gross profit against 38.6x on 18 May, on a market value 7% smaller.

Uranium Energy is the pure expression of what the month rewarded. It sold nothing at all in the quarter to 30 April, posting a $52.3m net loss, while holding 1.456m pounds of purchased uranium and 276,516 pounds produced at Irigaray, kept back to preserve "full exposure to uranium prices through its 100% unhedged strategy." When it does sell, that pays: 200,000 pounds went at $101 a pound in the prior quarter, against a quarterly average spot price of $80.76. At 4.53x book, liquid assets and metal together account for about 15% of the $6.50bn market value.

What the advance has earned

The spot indicator rose 4.7% since mid-July to US$89.50 — a six-month high, still below January's $100.25 peak. Equities moved five to eight times that. What the businesses earned is one line: Cameco's realized price, rising 18%. Everything else reported this quarter went the other way, and the demand story cited to justify the re-rating remains unbuilt — 80.4% of the roughly 9.8 GW committed to hyperscalers has not reached commercial operation, and the nearest thing to a named fuel supplier for a data center is Centrus's letter of intent with Oklo for 2029 deliveries. Washington's 50% tariffs on Canadian goods, imposed 22 August, arrived after the volume spike, not before it; uranium is off the retaliation list for now, and Cameco's Blind River refinery is the asset most exposed if that changes.

So the rally is a bid for uncommitted pounds and the option to sell them, and it is being made in a market where the most contracted seller is the one whose segment profit shrank. Centrus is the odd position: penalized on 2026 earnings that consensus says will fall, and not yet paid for a book that nearly doubled. Its first new centrifuge is due to be completed at Oak Ridge before the year is out. Until a machine spins, the order book is a promise about the 2030s being priced by a spot market having a good August.

SiTime and Semtech Each Cleared $100m of Data-Center Revenue in a Single Quarter

Hypothesis Opus 5 · Research Opus 5 · Writing Opus 5 · Prompt v1.6

The clock chips and copper drivers that sit in the last two metres of an artificial-intelligence rack have been sold for two years as content-per-rack promises. August's two earnings prints turned them into shipped revenue: SiTime's communications, enterprise and data-center line reached $101m, up 181% year on year and 64% of the company, while Semtech booked a record $100m data-center quarter and guided the next one up 160%.

Both businesses accelerated on every line that matters — SiTime's gross margin went to 63.0% from 51.9%, Semtech's operating income doubled and its net leverage fell to 1.1x. Both stocks are nonetheless below where they traded in May. The de-rating is doing different work in each: SiTime started from the richest valuation of the group, Semtech from the cheapest of the profitable names.

SITMSMTCMTSIMXLPrecision Timing SiliconMEMS OscillatorsActive Copper InterconnectOptical Transceiver ComponentsAI Rack Content
TickerCompanySegmentTrend · 13mo30D1Y
The subject · what this brief is about
SITMSiTimeRF & Wireless🟢 Cont. Bull+21.6%+150.0%
SMTCSemtechRF & Wireless🟢 Cont. Bull+26.5%+142.2%
Compared against · context, not the story
MTSIMACOM Technology SolutionsRF & Wireless🟢 Cont. Bull+8.3%+108.2%
MXLMaxLinearRF & Wireless🟢 Cont. Bull+8.3%+281.4%

12-month price & trend

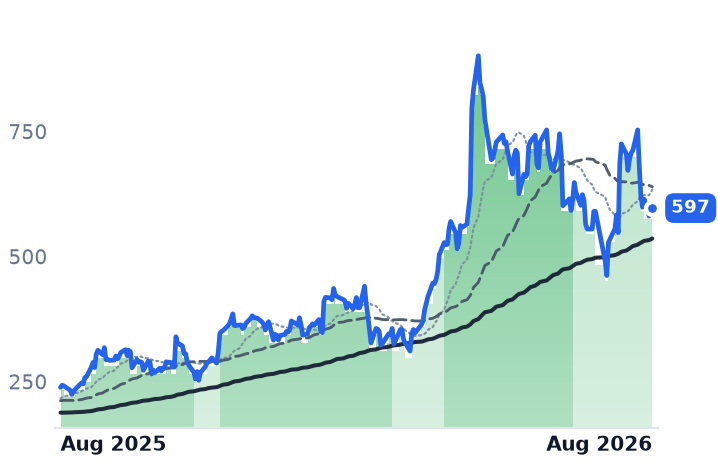
SITM
SiTime
597
+6.63 (+1.12%)
vs. prior close
Price20d50d150d
SITM 12-month price
RF & Wireless
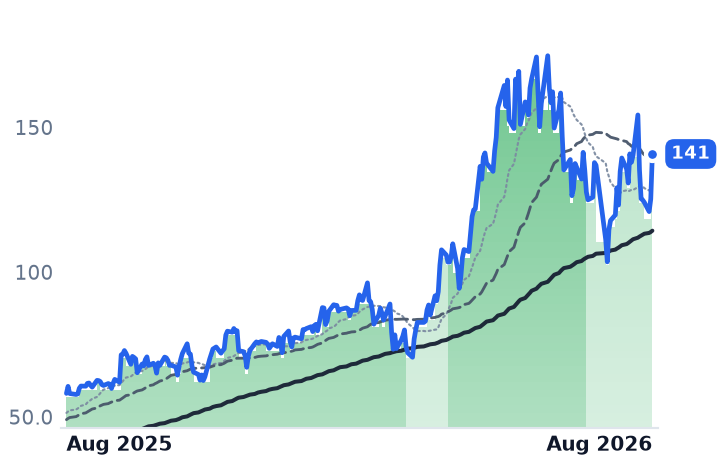
SMTC
Semtech
141
+15.54 (+12.41%)
vs. prior close
Price20d50d150d
SMTC 12-month price
RF & Wireless
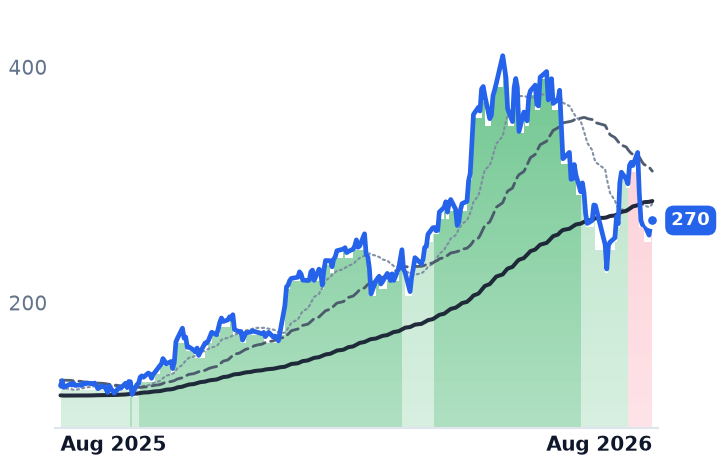
MTSI
MACOM Technology Solutions
270
+3.60 (+1.35%)
vs. prior close
Price20d50d150d
MTSI 12-month price
RF & Wireless
TickerMkt capP/EP/E fwdP/SP/S fwdP/GPP/GP fwdEV/EBITDAFCF yld
SITM$15.8B53.1x33.7x18.0x57.4x30.7x292.9x0.4%
SMTC$13.1B85.0x49.2x11.2x9.4x21.5x18.0x113.3x1.4%
MTSI$20.3B83.3x48.4x17.5x15.4x30.9x27.2x59.2x0.6%
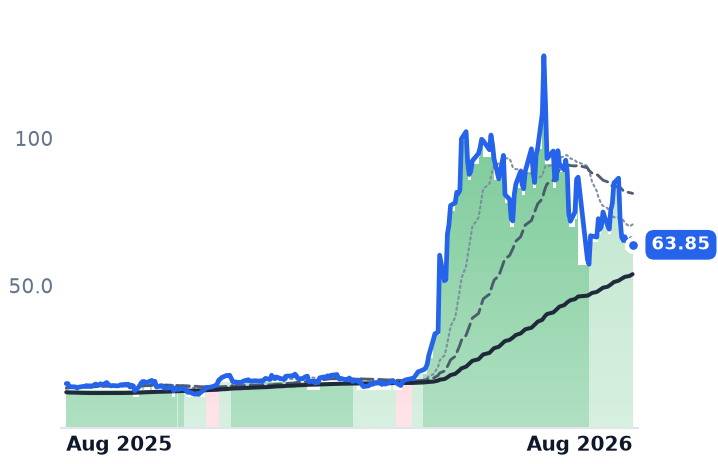
MXL
MaxLinear
63.85
−2.08 (−3.15%)
vs. prior close
Price20d50d150d
MXL 12-month price
RF & Wireless
TickerMkt capP/EP/E fwdP/SP/S fwdP/GPP/GP fwdEV/EBITDAFCF yld
MXL$6.0Bn/m38.1x10.6x8.2x18.5x14.2xn/m0.1%

Consensus projections

TickerFY2026EFY2027EFY2028E
SITMRevenue+177.5%+54.9%+27.3%
EPS+296.4%+32.7%+34.9%
SMTCRevenue+15.6%+33.2%+22.6%
EPS+119.3%+68.8%+50.4%
MTSIRevenue+37.0%+35.7%+16.5%
EPS+58.9%+53.8%+17.5%
MXLRevenue+58.5%+30.5%+20.4%
EPS+505.3%+54.0%+22.8%

Forward fiscal years only. Blank means no analyst coverage for that year.

Two suppliers to the last two metres of an artificial-intelligence rack — the clock signals that keep a fabric of accelerators in step, and the copper and optical links that move data between them — reported August quarters in which data-center revenue crossed a $100m run rate for the first time.

That rung of the rack has until now been sold mostly as slideware: design wins, served-market sizing, content-per-server arithmetic with revenue dated years out. What the two prints establish is that the content is being invoiced. It also sets up the harder question, because over the three months to 26 August both stocks fell.

The timing bill, in dollars

SiTime makes silicon micro-electro-mechanical-system (MEMS) resonators, oscillators and clock chips, sold through distributors into infrastructure, automotive and consumer markets. Its communications, enterprise and data-center segment produced $101m in the June quarter, up 181% year on year and 34% sequentially — a ninth consecutive quarter of triple-digit growth, and 64% of a company that took total revenue up 126.5% to $157.4m. Gross margin reached 63.0%, against 51.9% a year earlier, and the company posted $8.2m of operating income where it had lost $24.6m.

Chief executive Rajesh Vashist put a figure on the mechanism on the August 5 call: hyperscaler synchronization requirements for elite temperature-compensated oscillators are adding "several hundred dollars of content per data center rack." The displacement is not a price argument. Quartz resonators fail roughly 50 times faster than silicon in the vibration of a fan-cooled server hall, and timing content now sits on accelerators, switches, network cards, optical modules and smart cables alike. Quartz still held about 72% of the timing market in 2025, with SiTime and Microchip the only merchant MEMS sellers.

SiTime closed its purchase of Renesas's Timing Product Division on July 1, paying $1.5bn in cash funded with $1.35bn of zero-coupon convertible notes. The carve-out runs about 70% gross margins and is guided to roughly $85m in the September quarter; combined guidance is $285–295m at approximately 68% gross margin.

Copper, booked out

Semtech designs analog and mixed-signal chips — optical transceiver drivers and receivers, and the linear equalizers inside active copper cables. Its data-center segment set a record at $100m in the quarter to July 26, up 91% year on year and 39% sequentially, on 800-gigabit volumes, 1.6-terabit CopperEdge and the start of the 1.6T FiberEdge ramp. Company gross profit grew 37.2% against revenue's 32.7%, and operating income more than doubled to $55.8m.

"We are at the center of one of the most significant infrastructure build-outs in history," chief executive Hong Hou told investors on August 25. The backlog supports it: the rest of fiscal 2027 is fully booked and more than 70% of the following year already is. October-quarter guidance is $410m, with data-center revenue up 160% year on year.

Two caveats survive. GAAP net income of $160.1m includes a $101.4m tax benefit; adjusted earnings were $0.71 a share. And CopperEdge's power advantage — up to 90% less than digital-signal-processor alternatives — is now contested, since Marvell has added its own active copper linear equalizers. The old objection, debt, is largely gone: net leverage is 1.1x, with $204m of cash against $503m of principal, and annualized interest expense below $3m against $75m the prior year.

The shares went the other way

Semtech rose 12.4% on August 26 on four times its recent volume, with UBS, Roth and Morgan Stanley all lifting targets; SiTime rose 25.5% on August 6. Both moves came after their own prints. Yet from May 26 to August 26 SiTime fell 19.7% and Semtech 14.4%, because between August 17 and 24 both — along with MACOM and MaxLinear — dropped 21% to 27% in five sessions with no discoverable company news. The likelier reading is the broad chip de-risking in which semiconductor stocks shed more than $1trn.

The obvious test — that a general radio-frequency and industrial recovery, rather than rack content, was lifting the group — fails. MACOM's data-center segment reached $137.6m, up 40% sequentially and accounting for roughly three-quarters of this fiscal year's growth; it trades at 27.2x forward gross profit. MaxLinear's infrastructure line reached about $85m, up 145%, entirely on its Keystone 4-level pulse-amplitude-modulation processors at hyperscalers, and it is still loss-making at the operating line at 14.2x forward gross profit. Same mechanism, no industrial cycle underneath it.

What the decline is doing

The businesses earn none of the three-month decline and the valuations explain much of it. SiTime is the most expensive of the four on price to forward gross profit at 30.7x, and 53x forward earnings against consensus growth near a third — a rich multiple compressing on an accelerating business. Semtech, at 18.0x forward gross profit, is the cheapest of the three profitable names, and its 49x forward earnings sits roughly level with consensus earnings compounding near 50%. Little in the reported numbers explains why it de-rated at all; the August 26 session began closing that gap.

The constraint ahead is not demand. "With the strong booking momentum and record backlog, we see the capacity we have secured may not be enough," Hou said of the second half of fiscal 2028 — the same sentence, in a different accent, that the optics suppliers have been saying all month.

Half of Symbotic's $22.5bn Backlog Is Orders From a Venture It Owns 35% Of

Hypothesis Opus 5 · Research Opus 5 · Writing Opus 5 · Prompt v1.6

Symbotic's June quarter improved on every reported line — revenue up 21.7% year on year, gross margin up more than four points, a swing to operating profit — and the shares lost a sixth of their value the next session. What got repriced was the order book's counterparties.

Roughly $11.6bn of the $22.5bn backlog is orders from GreenBox, a joint venture Symbotic part-owns and which has signed no unrelated customer more than two years after it was formed. Walmart supplied over 84% of fiscal 2025 revenue. Gross-profit dollars have risen sharply while the shares fell, taking price-to-gross-profit from roughly 73x in May to 46x. The de-rating is a verdict on whose orders those are, not on whether the machines work.

SYMCGNXROKTERWarehouse AutomationRelated-Party BacklogCustomer ConcentrationRevenue Recognition QualityIndustrial Automation Demand
TickerCompanySegmentTrend · 13mo30D1Y
The subject · what this brief is about
SYMSymboticIndustrial Automation & Controls⚠️ Emerging Bear−4.1%−14.9%
CGNXCognexPrecision Motion & Sensors🟢 Cont. Bull+2.3%+40.0%
Compared against · context, not the story
ROKRockwell AutomationIndustrial Automation & Controls🟢 Cont. Bull−8.2%+24.7%
TERTeradyneSemiconduct Equipment🟢 Cont. Bull+13.4%+211.4%

12-month price & trend

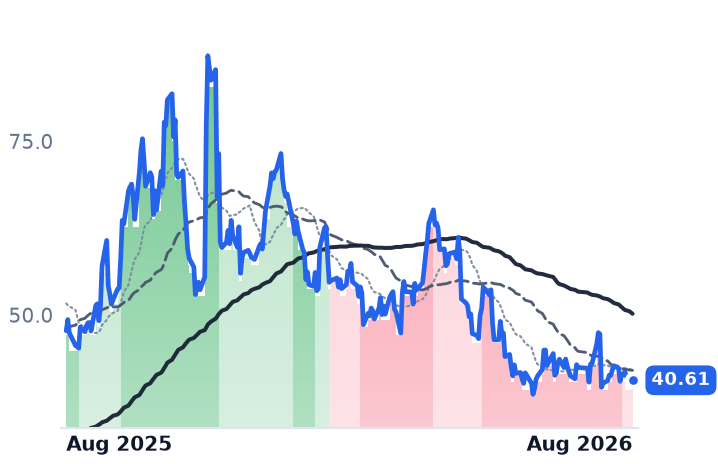
SYM
Symbotic
40.61
+0.05 (+0.12%)
vs. prior close
Price20d50d150d
SYM 12-month price
Industrial Automation & Controls
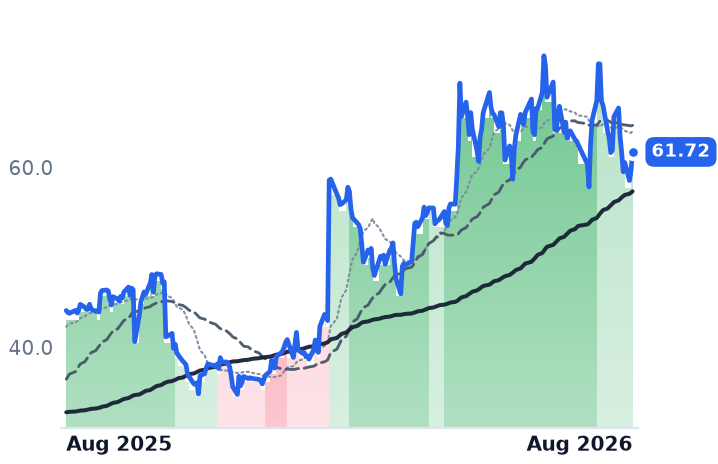
CGNX
Cognex
61.72
+2.10 (+3.51%)
vs. prior close
Price20d50d150d
CGNX 12-month price
Precision Motion & Sensors
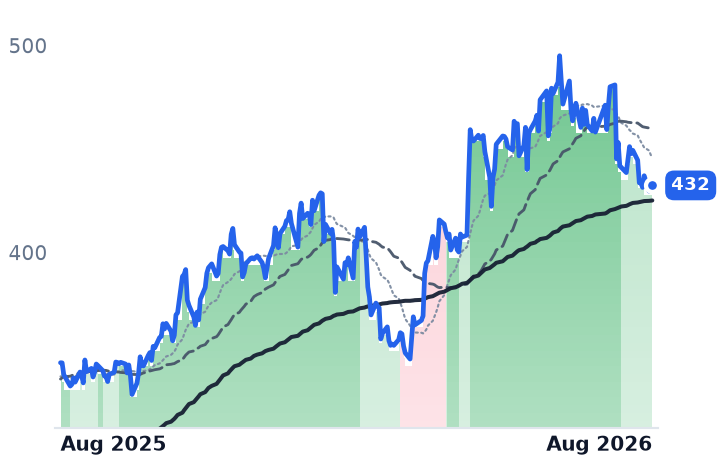
ROK
Rockwell Automation
432
+2.09 (+0.49%)
vs. prior close
Price20d50d150d
ROK 12-month price
Industrial Automation & Controls
TickerMkt capP/EP/E fwdP/SP/S fwdP/GPP/GP fwdEV/EBITDAFCF yld
SYM$26.1B423.9x73.3x9.8x9.4x45.6x43.7x401.6x2.8%
CGNX$10.3B58.8x36.7x9.4x9.0x13.7x13.0x36.0x2.6%
ROK$48.6B40.9x33.1x5.4x5.4x9.9x9.9x29.2x3.1%
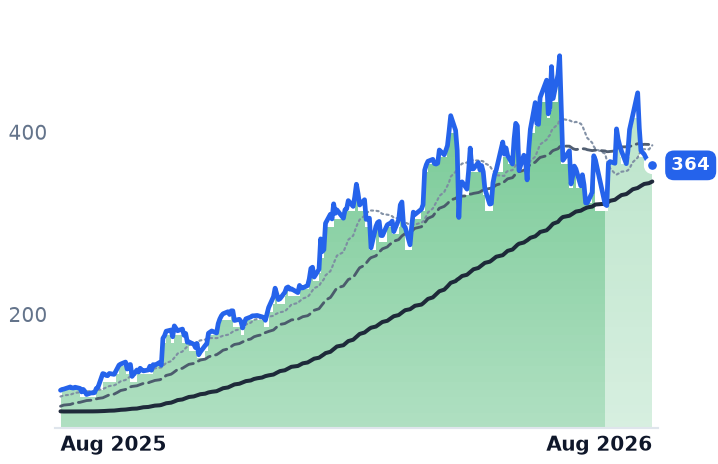
TER
Teradyne
364
−3.24 (−0.88%)
vs. prior close
Price20d50d150d
TER 12-month price
Semiconduct Equipment
TickerMkt capP/EP/E fwdP/SP/S fwdP/GPP/GP fwdEV/EBITDAFCF yld
TER$59.4B51.8x41.2x13.3x11.5x22.4x19.4x40.7x1.3%

Consensus projections

TickerFY2026EFY2027EFY2028E
SYMRevenue+23.6%+31.3%+24.4%
EPS+128.1%+35.8%+13.5%
CGNXRevenue+16.7%+9.3%+9.3%
EPS+74.6%+19.5%+13.6%
ROKRevenue+10.0%+5.5%+6.4%
EPS+31.5%+12.1%+12.1%
TERRevenue+67.0%+21.3%+24.5%
EPS+158.9%+27.6%+31.5%

Forward fiscal years only. Blank means no analyst coverage for that year.

Symbotic builds and installs AI-driven robotic systems that store, retrieve and sort cases inside very large retail and wholesale distribution centers. On August 5 it reported a fiscal third quarter that improved on every reported line. Revenue reached $720.8m, up 21.7% from a year earlier. Gross margin was 22.3% — the fourth straight quarterly improvement, and more than four points better than the year-ago June quarter. The company swung to a $32.9m operating profit from a $20.2m loss. The next session the shares fell 16.2%, from $47.26 to $39.60, on close to 5m shares, several times recent daily volume.

The reason is not in the income statement. It is in who the orders are with. Symbotic held its disclosed backlog at $22.5bn and told investors only about 15% of it converts to revenue over the next twelve months. Roughly $11.6bn of that total — over half — is orders from GreenBox, a joint venture 35% owned by Symbotic and 65% by SoftBank. Goldman Sachs analyst Mark Delaney, downgrading the stock to sell, noted GreenBox has signed no unrelated customer more than two years after its formation and called it "the type of circular transaction that investors are increasingly scrutinizing."

The cash mechanism

The accounting consequence is specific. Symbotic can fund its 35% share of the venture with cash or with forgone profit on the systems it ships to it, so those shipments generate limited initial cash — which is why Goldman expects cash-flow growth to lag reported adjusted profit. That is roughly what the quarter showed: cash fell to $1.7bn from $2.0bn and free cash flow was negative on payment timing, with management asking investors to judge cash generation annually rather than quarterly.

The rest of the revenue base is Walmart, which supplied more than 84% of fiscal 2025 revenue. Symbotic has since bought Walmart's Advanced Systems and Robotics business for $200m in cash plus up to $350m contingent on orders, alongside a commercial agreement under which Walmart committed to deploy systems for 400 store-based pickup and delivery sites. That order is not in the $22.5bn. Management said full contract conversion is not expected until early 2028, after a first prototype about six months out, a redesigned second unit, and a third install.

Why counterparty quality carries weight here: the fiscal 2024 restatement was a percentage-of-completion problem. Symbotic found errors in which costs were expensed before milestones were achieved, accelerating revenue, plus unbillable cost overruns on certain deployments, and put the correction at $30m–$40m of system revenue and profit.

"We are well on track to deliver against our key objectives for our fiscal year," chairman and chief executive Rick Cohen said in the August 5 release, adding that the company sees "increasing opportunities to broaden the scope of our work with existing and prospective customers."

The cycle is not the problem

Automation demand is running. Rockwell Automation raised full-year organic growth guidance to 7.5%–9.5%, citing semiconductors, data centers and warehouse automation, and Teradyne doubled revenue year on year. Underneath, though, the warehouse-robot order book is thinner than its dollar value: North American buyers ordered nearly 18,000 units worth about $1.2bn in the first half of 2026, with units up 2% and order value up 7% — price and mix doing most of the work.

Cognex, the machine-vision maker that reported a day later, is the structural counter-case: 70.6% gross margin, June-quarter free cash flow of $68m against $40m a year earlier, and roughly 80% of trailing free cash flow returned to shareholders. Its shares fell too, 13.7% since August 5, but nothing in its cash statement is in question.

What the de-rating buys

Symbotic's twelve-month share decline is entirely multiple compression. Trailing gross profit rose 44.6% to $571m over that span while the stock fell 15.4%, taking price-to-gross-profit from about 73x in May to 46x. The earned part of the business case is real and improving — margin is rising, deployments number 77 in progress and 56 operational, and software and services grew far faster than systems, though they are only about 7% of revenue. What nothing yet resolves is whether an order book contracted mostly with a venture Symbotic co-owns and a customer that is most of its revenue behaves like a normal backlog when it converts. Management has guided fourth-quarter profit margin flat despite higher revenue, and pinned the next margin step to a storage redesign scaling in the second half of 2027.

Symbotic reports its fiscal fourth quarter on November 23, and management has asked to be judged on annual cash flow rather than quarterly. That invitation comes with a deadline attached: the fiscal year ends with that print.

The 800-Volt AI Rack Moves Most of Its Power Budget to Chips That Ship in 2027

Hypothesis Opus 5 · Research Opus 5 · Writing Opus 5 · Prompt v1.6

Moving an AI rack from 54-volt distribution to 800 volts of direct current barely raises what the rack spends on power conversion — it rises about 16% — but it moves roughly two-thirds of that spending into gallium-nitride and silicon-carbide devices and high-voltage connectors that previously took almost none of it. The rotation is real. The revenue is dated 2027.

Only Vicor books the content today: 58.0% gross margin in the June quarter, advanced products up 45% sequentially, a one-year backlog of $379.7m. Navitas, the pure-play gallium-nitride and silicon-carbide supplier, sold $10.53m in the same quarter, down 27.3% from a year earlier, and dates its rack-level chips to mid-to-late 2027.

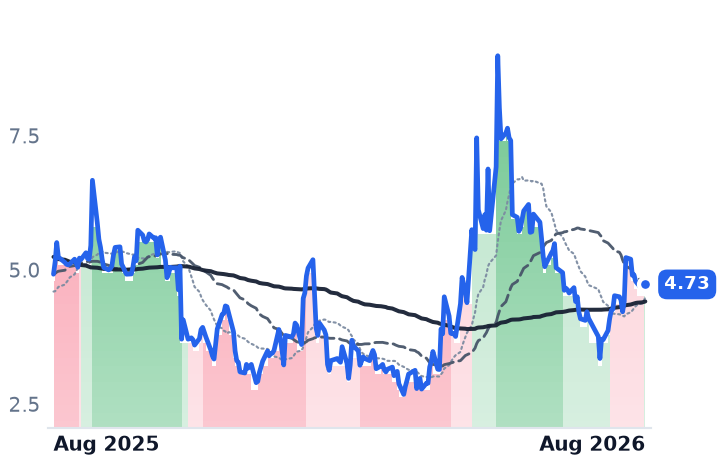
Since 17 August both have fallen again, and so has the whole wide-bandgap chain — while their customer's shares did not.

NVTSVICRBELFBULBIIPWRMPWRWOLFONNVDA800VDC Rack ArchitectureWide-Bandgap GaN & SiCPower Conversion ContentAI Data-Center BuildoutPatent Licensing Royalties
TickerCompanySegmentTrend · 13mo30D1Y
The subject · what this brief is about
NVTSNavitas SemiconductorOther🟢 Cont. Bull+24.8%+105.1%
VICRVicorOther🟢 Cont. Bull+2.6%+282.7%
Compared against · context, not the story
BELFBBel FuseConnectors & Interconnect Systems🟢 Cont. Bull+2.3%+84.5%
ULBIUltralifeElectrical Equipment & Parts🔴 Cont. Bear+23.1%−5.0%
IPWRIdeal PowerSemiconductors🌱 Emerging Bull+25.8%−3.9%
MPWRMonolithic Power SystemsAnalog & Mixed-Signal🟢 Cont. Bull+1.4%+53.7%
WOLFWolfspeedDiscrete & Power🌱 Emerging Bull+20.4%+19.2%
ONON SemiconductorAnalog & Mixed-Signal🟢 Cont. Bull−13.4%+43.4%
NVDANVIDIAAI & Data Center GPUs🟢 Cont. Bull+7.2%+16.2%

12-month price & trend

NVTS
Navitas Semiconductor
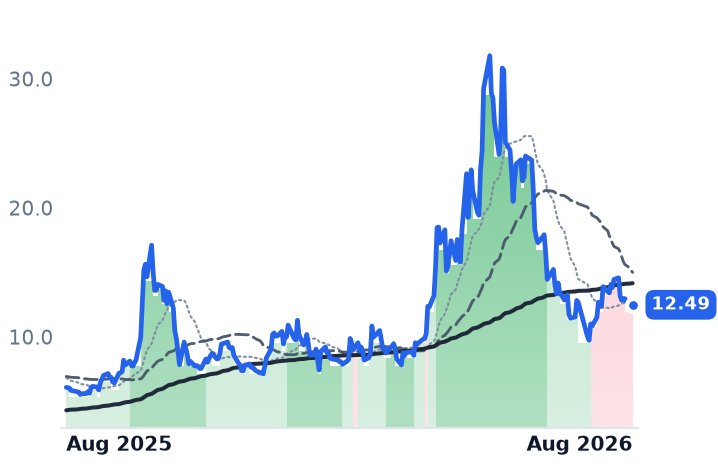
12.49
+0.03 (+0.28%)
vs. prior close
Price20d50d150d
NVTS 12-month price
Other
VICR
Vicor
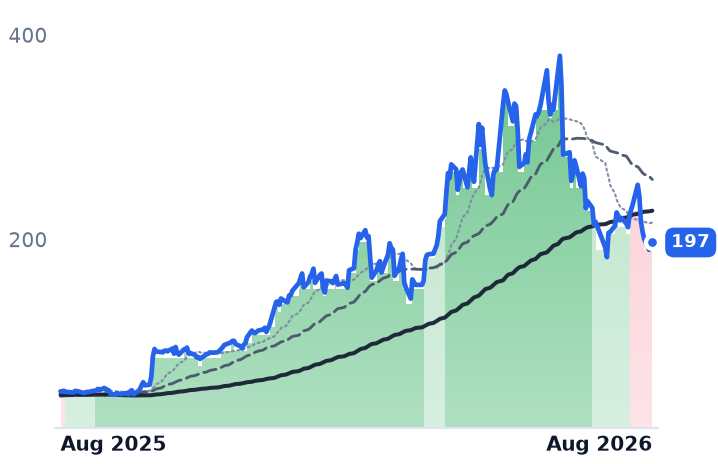
197
+3.52 (+1.82%)
vs. prior close
Price20d50d150d
VICR 12-month price
Other
BELFB
Bel Fuse
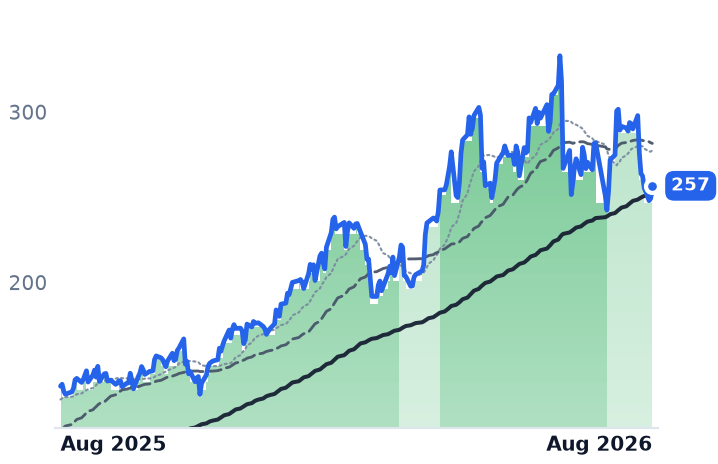
257
+7.37 (+2.96%)
vs. prior close
Price20d50d150d
BELFB 12-month price
Connectors & Interconnect Systems
TickerMkt capP/EP/E fwdP/SP/S fwdP/GPP/GP fwdEV/EBITDAFCF yld
NVTS$3.3Bn/m90.5x69.4xn/m-2.1%
VICR$8.9B61.8x57.4x18.9x14.8x33.3x26.2x66.6x0.6%
BELFB$3.1B63.9x26.0x4.2x3.8x10.5x9.7x21.7x2.4%
ULBI
Ultralife
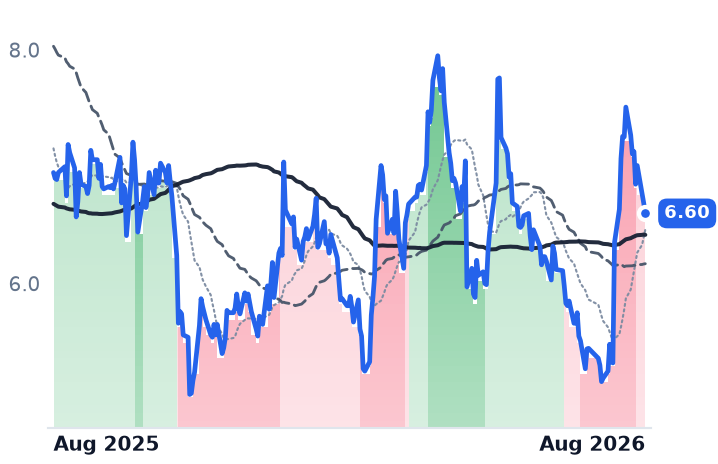
6.60
−0.09 (−1.35%)
vs. prior close
Price20d50d150d
ULBI 12-month price
Electrical Equipment & Parts
IPWR
Ideal Power
4.73
+0.10 (+2.16%)
vs. prior close
Price20d50d150d
IPWR 12-month price
Semiconductors
MPWR
Monolithic Power Systems
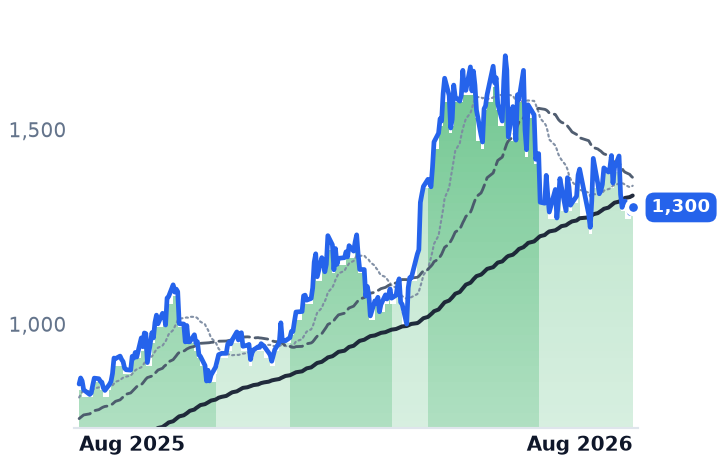
1,300
−4.02 (−0.31%)
vs. prior close
Price20d50d150d
MPWR 12-month price
Analog & Mixed-Signal
TickerMkt capP/EP/E fwdP/SP/S fwdP/GPP/GP fwdEV/EBITDAFCF yld
ULBI$109.3Mn/m7.6x0.6x0.5x2.4x2.0xn/m1.9%
IPWR$80.1Mn/m100.2xn/m-11.8%
MPWR$64.7B80.3x48.0x19.8x15.6x35.8x28.2x62.9x0.9%
WOLF
Wolfspeed
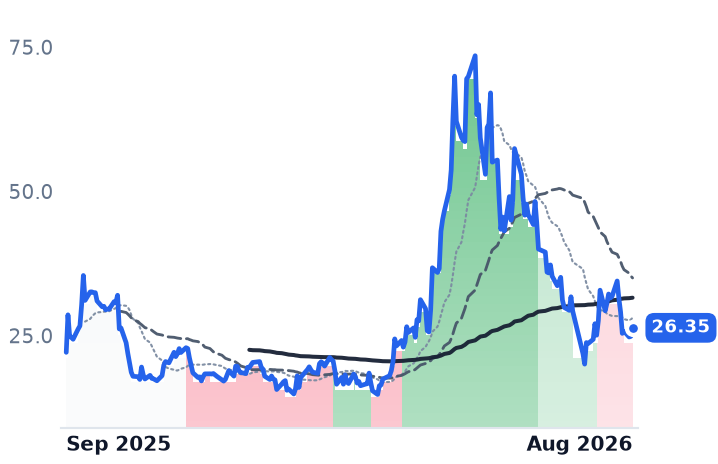
26.35
+1.48 (+5.95%)
vs. prior close
Price20d50d150d
WOLF 12-month price
Discrete & Power
ON
ON Semiconductor
73.11
+1.06 (+1.47%)
vs. prior close
Price20d50d150d
ON 12-month price
Analog & Mixed-Signal
NVDA
NVIDIA
211
−1.21 (−0.57%)
vs. prior close
Price20d50d150d
NVDA 12-month price
AI & Data Center GPUs
TickerMkt capP/EP/E fwdP/SP/S fwdP/GPP/GP fwdEV/EBITDAFCF yld
WOLF$1.3Bn/m2.0x2.1xn/m-21.8%
ON$32.5B52.8x26.1x5.2x5.0x14.0x13.2x26.4x5.5%
NVDA$5.5T34.3x25.0x21.5x13.9x29.0x18.7x28.3x2.2%

Consensus projections

TickerFY2026EFY2027EFY2028E
NVTSRevenue+4.7%+52.5%+59.8%
EPS−21.9%−17.9%−44.8%
VICRRevenue+33.1%+55.6%+22.2%
EPS+58.9%+73.2%+33.0%
BELFBRevenue+20.7%+8.3%+12.9%
EPS+45.5%+13.6%+26.3%
ULBIRevenue+6.2%
EPS+22.9%
IPWRRevenue+1500.0%+0.0%+975.0%
EPS−31.5%−18.8%−20.3%
MPWRRevenue+49.2%+28.7%+20.3%
EPS+54.8%+31.0%+20.0%
WOLFRevenue+0.7%−15.2%+23.7%
EPS+275.2%−39.2%−22.4%
ONRevenue+9.2%+12.9%+13.5%
EPS+37.1%+41.7%+31.7%
NVDARevenue+65.1%+84.2%+43.2%
EPS+59.0%+91.7%+42.0%

Forward fiscal years only. Blank means no analyst coverage for that year.

The 800-volt rack does not spend much more on power conversion than the 54-volt rack it replaces. It spends the money on different companies. On SemiAnalysis's rack economics, the total rack-level power bill of materials rises roughly 16% in the shift from 54-volt distribution to 800 volts of direct current — but wide-bandgap silicon and high-voltage connectors go from close to nothing to about 64% of that bill, pulling dollars out of legacy alternating-current gear and uninterruptible power supplies and into power semiconductors, DC racks, protection and connectors.

The physics is not contested. At 800 volts a 600-kilowatt load draws about 750 amperes rather than 12,500, and NVIDIA says its high-voltage architecture cuts copper use by up to 45%, with platforms rolling out in the second half of 2026 behind more than 80 partner firms. What is contested is the date the money arrives — and the answer from the two American companies closest to the socket is 2027, not this year.

One company books it today

Vicor, which makes modular direct-current power converters in Andover, Massachusetts, and sells them to computing, aerospace and industrial equipment makers, is the one already collecting. June-quarter gross margin expanded 280 basis points sequentially to 58.0%. Its advanced products — the newer, higher-density lines that carry the vertical power delivery story — rose 45% sequentially to $94.2m and are now 65.7% of revenue. The one-year backlog grew 26% sequentially and 145% year on year to $379.7m, with book-to-bill above 1.0, growth management attributed to defense, industrial and high-performance-computing customers. Guidance went above $600m for 2026 and the long-term target was lifted from $1bn of revenue at 65% gross margin to $2.5bn at 70%.

Two caveats travel with that. Roughly a fifth of revenue is royalty income — $30.4m collected in the June quarter, including $15m from a new licence structured to pay $60m over two years — compelled by a February 2025 International Trade Commission exclusion order barring unlicensed computing systems containing infringing power modules. And Vicor's second-generation vertical power delivery, at 3 amperes per square millimetre against roughly 1 for competing first-generation parts, is guided to production only late in the fourth quarter of 2027. Chief executive Patrizio Vinciarelli said in May the company was essentially sold out on capacity for the foreseeable future; a second chip fab is being site-selected to fix it.

The die maker is not paid yet

Navitas, the Torrance, California designer of gallium-nitride and silicon-carbide power chips, sold $10.53m in the June quarter — down 27.3% year on year, the fourth consecutive quarter of double-digit decline. On a reported basis gross profit was minus $1.0m; on the company's adjusted basis gross margin was 39.5%, guided to 39.7% for September on $13.5m of revenue. "High-power markets grew more than 50% year-over-year, serving as further evidence of the building momentum in our GaN and high voltage SiC product, especially in our focus area of AI infrastructure," chief executive Chris Allexandre told investors on 27 July. Its own schedule puts silicon carbide in power supply units ramping now, 800-volt sidecar racks in mid-2027, and gallium nitride inside accelerator power delivery from mid-to-late 2027. It has disclosed no dollar-quantified design win and no named customer, and is one of roughly fifteen silicon suppliers on NVIDIA's ecosystem list alongside Infineon, Texas Instruments and onsemi. It also faces patent suits from Wolfspeed and trade-secret claims from Renesas, and countersued Renesas on 10 August.

What the shares did, and what did not move

Vicor closed 26 August at $197.11, 48.1% below its 30 June record close, after falling 22.2% in five sessions from 17 August; Navitas at $12.49, 60.7% below its late-May peak, down 14.3% over the same stretch. Both now trade with the shorter moving average below the longer, having held a firm uptrend in May. The de-rating is chain-wide: over three months Wolfspeed fell 64.1%, onsemi 42.4% and Monolithic Power 21.8%, while NVIDIA itself fell 1.7%. The likelier reading is duration repricing rather than demand — the 30-year Treasury yield topped 5.33% on 18 August — since hyperscaler capital spending has not broken.

Bel Fuse, which sells magnetics, connectors and hot-pluggable power shelves, is the control that behaved differently: its trailing gross-profit dollars grew 30.8%, roughly half its twelve-month share gain, and its largest growth line was defense at $66.5m, bigger than its data-solutions revenue. Ultralife and Ideal Power, the group's other members, are both slightly down over twelve months.

The verdict

Vicor earned part of its year: trailing gross profit grew 15.4%, but the price paid per dollar of it went from about 10x to 33.3x, so roughly nine-tenths of the move was re-rating. It now sits at 33.3x trailing and 26.2x forward gross profit against the 61.8x trailing recorded in mid-May — cheaper while the order book tripled — though at 57.4x forward earnings it remains the dearest of the three. Navitas earned none of it: trailing revenue fell 46.4% while price-to-sales went from roughly 17.8x to 90.5x, against Bel Fuse at 4.16x, with consensus modelling no profitable year before 2030.

The rotation of power dollars into wide-bandgap silicon is happening. It is being invoiced by the module assembler at 58% gross margin, while the chip maker whose material the architecture is named for still has $557m of cash — raised at $21.89 a share, well above today's price — and a ramp dated to the year after next.

Salesforce Grew Revenue 10.8% and Its Operating Profit Not at All

Hypothesis Opus 5 · Research Opus 5 · Writing Opus 5 · Prompt v1.6

Salesforce sold its July quarter as an artificial-intelligence breakout, and the bookings support it: Agentforce annual recurring revenue passed $1.5bn. The income statement is more ambivalent. Gross margin fell to 76.65% from 78.10% a year earlier, and operating income under generally accepted accounting principles was flat year over year, so 10.8% revenue growth produced no operating leverage at all. The jump in earnings per share came instead from a diluted share count 14.7% smaller after a $25bn repurchase.

HubSpot, Braze and NICE show the same squeeze between revenue growth and gross-profit growth. What none of the four disclosed is the seat erosion the market has spent a year pricing: HubSpot's average revenue per customer rose, and its shortfall sat in new customers won rather than in existing ones shrinking.

CRMHUBSBRZENICEAgentic AI SoftwareInference Cost EconomicsUsage-Based PricingSaaS Gross MarginEnterprise CRM SuitesSeat-Based Licensing Erosion
TickerCompanySegmentTrend · 13mo30D1Y
CRMSalesforceCustomer Experience & CRM🔴 Cont. Bear+18.4%−14.9%
HUBSHubSpotCustomer Experience & CRM🔴 Cont. Bear−1.3%−48.6%
BRZEBrazeCustomer Experience & CRM🌱 Emerging Bull+21.7%+18.4%
NICENICECustomer Experience & CRM🔴 Cont. Bear+5.0%−28.1%

12-month price & trend

CRM
Salesforce
206
−0.07 (−0.03%)
vs. prior close
Price20d50d150d
CRM 12-month price
Customer Experience & CRM
HUBS
HubSpot
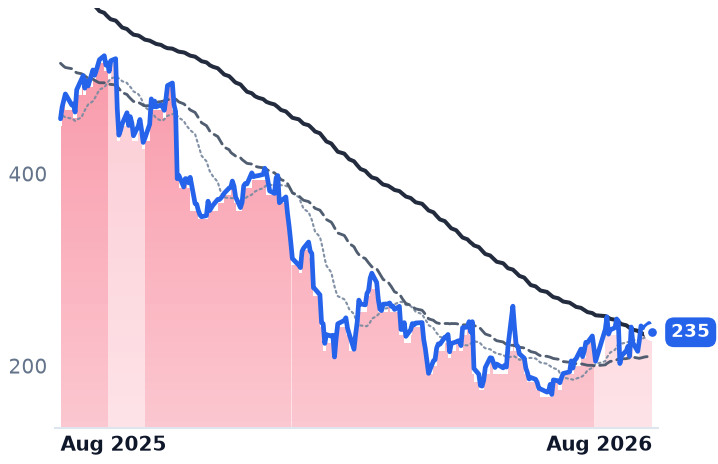
235
−2.20 (−0.93%)
vs. prior close
Price20d50d150d
HUBS 12-month price
Customer Experience & CRM
BRZE
Braze
30.56
+0.05 (+0.16%)
vs. prior close
Price20d50d150d
BRZE 12-month price
Customer Experience & CRM
TickerMkt capP/EP/E fwdP/SP/S fwdP/GPP/GP fwdEV/EBITDAFCF yld
CRM$168.4B18.7x14.5x3.8x3.7x5.0x4.7x12.4x9.0%
HUBS$12.1B83.8x17.8x3.5x3.3x4.2x4.0x40.2x6.3%
BRZE$3.5Bn/m48.7x4.4x3.9x6.6x5.8xn/m1.9%
NICE
NICE
99.73
−0.13 (−0.14%)
vs. prior close
Price20d50d150d
NICE 12-month price
Customer Experience & CRM
TickerMkt capP/EP/E fwdP/SP/S fwdP/GPP/GP fwdEV/EBITDAFCF yld
NICE$5.9B14.5x9.0x1.9x1.9x2.9x2.9x7.0x10.6%

Consensus projections

TickerFY2026EFY2027EFY2028E
CRMRevenue+9.3%+11.1%+9.4%
EPS+17.4%+20.2%+10.4%
HUBSRevenue+18.2%+14.2%+14.0%
EPS+38.2%+25.9%+18.4%
BRZERevenue+24.3%+22.8%+16.6%
EPS+281.2%+50.3%+52.1%
NICERevenue+8.3%+9.1%+11.8%
EPS−8.9%+13.7%+22.2%

Forward fiscal years only. Blank means no analyst coverage for that year.

Salesforce's July-quarter results, published on 26 August, settle a question its May report left open: whether the company's gross margin could carry the cost of running artificial-intelligence agents at scale. It could not. Gross margin came in at 76.65%, against 78.10% a year earlier and 76.92% in the prior quarter.

The mechanism is unglamorous and now visible at every vendor selling agents into customer-facing software. Inference compute is consumed per interaction and booked in cost of revenue immediately, while the price is billed on outcomes that lag adoption by quarters — HubSpot charges $0.50 per resolved conversation, Salesforce $2 per conversation. Gartner expects at least 40% of enterprise software spending to move to usage-, agent- or outcome-based pricing by 2030, with the seat-based share of the total falling from 21% to 15%. That transition is being financed out of gross margin.

Where the profit came from

Salesforce, which sells the Customer 360 suite of sales, service, marketing and Slack software to large enterprises, grew revenue 10.8% to $11.345bn. Gross profit grew 8.8%. Operating income was $2.331bn, flat against a year earlier, and the operating margin slipped to 20.55% from 22.78%.

General accounting earnings per share nonetheless rose 119%, to $4.29. The arithmetic sits below the operating line: diluted shares fell to 821m from 962m, a 14.7% reduction following the company's $25bn accelerated repurchase, with non-operating items doing the rest. The earnings headline is a capital-structure event dressed as operating leverage.

The demand underneath it is genuine. Current remaining performance obligation — contracted revenue due within twelve months — reached $33.5bn, up 14%, with Agentforce annual recurring revenue above $1.5bn and Agentforce and Data 360 together near $3.9bn. "We just delivered one of our best quarters ever, outperforming across every key metric," chairman and chief executive Marc Benioff said on 26 August. Full-year guidance went up to $46.1bn–$46.4bn, and the shares, which closed at $205.62, rose about 12.7% in extended trading. Salesforce trades at 14.52x forward earnings against 18.69x trailing, and at 4.96x its trailing gross profit, up from about 4.55x three months ago.

The seat erosion nobody disclosed

The story that has hung over this group for a year is that agents delete the seats these vendors bill. The June-quarter disclosures do not show it. HubSpot, whose all-in-one marketing and sales software serves mid-market businesses, ended June with 306,446 customers, up 14%, and average subscription revenue per customer of $11,800, up 4%. Price per customer rose. The damage was in units: 7,000 net additions against an internal expectation of 9,000–10,000, with second-half quarterly adds guided down to 5,000–6,000. Chief executive Yamini Rangan attributed that to HubSpot's own April changes — agent trials, outcome-based pricing, lower entry prices — and to buying committees that now require board sign-off. Net revenue retention was 102%, one point lower. Braze's dollar-based net retention rose to 110%; NICE's cloud retention held at 106%. Nobody reported shrinking installed bases.

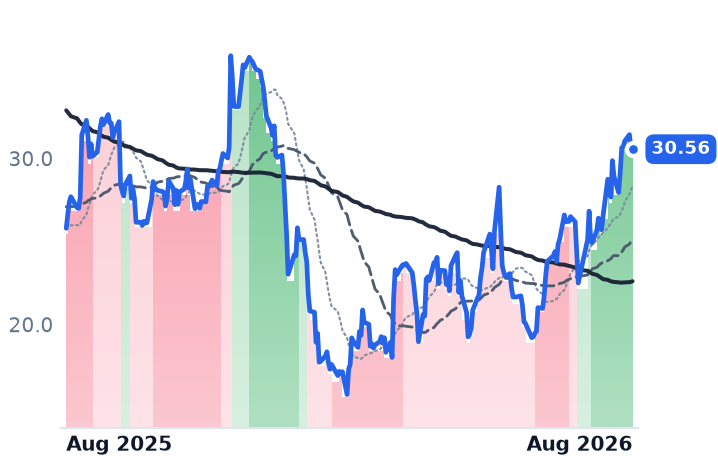
Braze, which orchestrates push, email and in-app messaging for consumer brands and bills on message volume and monthly active users, is the cleanest version of the consumption case: April-quarter revenue grew 30.2% to $211.0m, a fourth consecutive quarter of acceleration. Its gross margin still fell, to 65.72% from 68.62%, and full-year guidance implies roughly 22% growth. It is also the dearest of the four at 6.63x trailing gross profit, up from 5.83x in late May on no company disclosure since, and loses money on a general accounting basis.

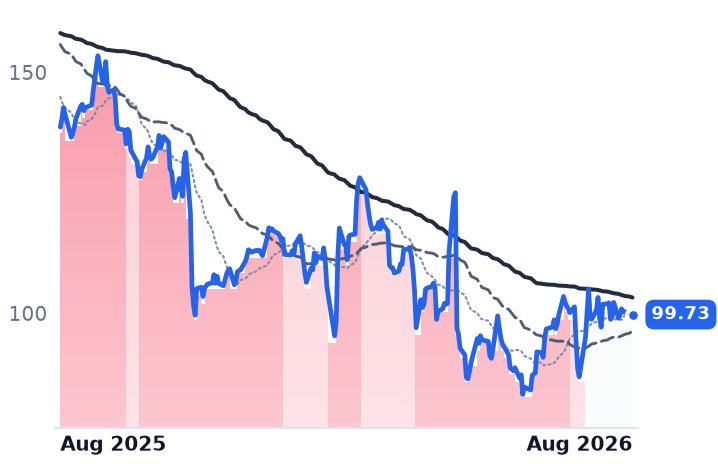
NICE, the Israeli vendor of the CXone Mpower contact-center platform and, separately, Actimize financial-crime software, is the cheapest at 2.94x gross profit and 9.05x forward earnings. Its cloud revenue grew 12.6% to $609m and its customer-experience artificial-intelligence and self-service annual recurring revenue reached $362m, up 52% — yet general accounting operating income fell 31.5%, and consensus has 2026 earnings per share 8.9% below 2025. "Customers are taking a measured approach as they prepare their data, the governance, [and] the operating models before they scale AI," chief executive Scott Russell told investors on the second-quarter call.

What the businesses earn and what they don't

Over the past month Braze rose 35.8%, Salesforce 18.4%, HubSpot 14.7% and NICE 5.0%; on 27 July investors rotated out of chip stocks into software, lifting Salesforce about 7% on no company news. Over twelve months HubSpot is still down 48.6%, and the price paid for each dollar of its gross profit has more than halved while that gross profit grew.

The honest split: the demand is earned. Bookings, backlog and retention are firm across all four, and the agent narrative is showing up in contracted dollars. What nothing yet explains is the multiple expansion of the past three months, because at every one of these companies gross profit is growing slower than revenue, and at Salesforce — the only one large enough to show the endpoint — that gap has now eaten the entire operating line. Buying gross profit at a higher price while its growth decelerates relative to revenue is a bet that outcome pricing catches inference cost, and none of the four has yet published a quarter where it did.

Braze reports its July quarter in early September, the first of the four to say anything new. Its shares have risen more than a third in a month on nothing at all.

Wi-Fi 7 Replacement Wave Lifted Campus Orders 20% at Cisco and Hewlett Packard Enterprise

Hypothesis Opus 5 · Research Opus 5 · Writing Opus 5 · Prompt v1.6

Both Cisco and Hewlett Packard Enterprise are riding an office-network replacement cycle neither had to invent, and neither is being paid for it where it counts. HPE's Networking segment — the home of the Juniper acquisition — more than doubled reported revenue but grew about 10% on a like-for-like basis, and its operating margin fell to 21.6% from 25.0%. The profit dollars came from servers and AI systems instead.

At Cisco the split runs the other way: hardware carried an 18% revenue quarter while annualized recurring revenue grew 3%. And charged for the debt it took on to buy Juniper, HPE at 22.2 times earnings before interest, tax, depreciation and amortization is no longer cheaper than Cisco. HPE reports again on September 2.

HPECSCOANETDELLCampus Networking RefreshWi-Fi 7 Upgrade CycleEnterprise Ethernet SwitchingNetworking M&A IntegrationAI Server & Systems DemandComponent Shortages & Pricing
TickerCompanySegmentTrend · 13mo30D1Y
The subject · what this brief is about
HPEHewlett Packard EnterpriseEnterprise Storage & Software🟢 Cont. Bull+18.0%+143.3%
CSCOCisco SystemsEnterprise Networking Infrastructure🟢 Cont. Bull−2.6%+66.5%
Compared against · context, not the story
ANETArista NetworksCloud Networking🟢 Cont. Bull+15.7%+46.3%
DELLDell TechnologiesEnterprise Storage & Software🟢 Cont. Bull+18.8%+259.5%

12-month price & trend

HPE
Hewlett Packard Enterprise
53.79
+0.75 (+1.40%)
vs. prior close
Price20d50d150d
HPE 12-month price
Enterprise Storage & Software
CSCO
Cisco Systems
112
+0.47 (+0.42%)
vs. prior close
Price20d50d150d
CSCO 12-month price
Enterprise Networking Infrastructure
ANET
Arista Networks
196
+5.47 (+2.87%)
vs. prior close
Price20d50d150d
ANET 12-month price
Cloud Networking
TickerMkt capP/EP/E fwdP/SP/S fwdP/GPP/GP fwdEV/EBITDAFCF yld
HPE$73.1B50.7x16.1x1.9x1.6x5.7x4.9x22.2x5.5%
CSCO$442.9B33.4x21.9x7.0x6.1x10.8x9.4x23.2x3.1%
ANET$237.5B58.8x45.9x22.5x18.7x35.8x29.8x46.1x2.2%
DELL
Dell Technologies
466
+14.23 (+3.15%)
vs. prior close
Price20d50d150d
DELL 12-month price
Enterprise Storage & Software
TickerMkt capP/EP/E fwdP/SP/S fwdP/GPP/GP fwdEV/EBITDAFCF yld
DELL$308.2B36.3x24.6x2.3x1.8x12.1x9.3x22.2x3.1%

Consensus projections

TickerFY2026EFY2027EFY2028E
HPERevenue+30.5%+11.6%+5.8%
EPS+81.3%+18.7%+10.1%
CSCORevenue+11.1%+16.2%+7.1%
EPS+12.9%+19.7%+9.2%
ANETRevenue+42.4%+30.0%+23.9%
EPS+42.4%+27.2%+22.5%
DELLRevenue+16.2%+55.3%+14.9%
EPS+27.3%+89.4%+21.3%

Forward fiscal years only. Blank means no analyst coverage for that year.

Networking's headlines this month belonged to the racks behind artificial-intelligence training clusters, where Nvidia took the lead in data-center Ethernet switching revenue. The disclosures underneath those headlines describe something quieter and, for two incumbents, larger: the office wiring closet is in the middle of a hardware replacement wave, and it lifted orders at Cisco and Hewlett Packard Enterprise by roughly a fifth in their most recent quarters.

That is the half of networking neither company can outsource to a hyperscaler order book. For HPE — the Houston server, storage and networking group run by Antonio Neri — campus and branch is the business it paid about $40.00 a share, some $14bn in cash, to enlarge when it bought Juniper Networks. For Cisco, which sells campus and data-center switching, enterprise routing, wireless, security and observability software, chief executive Chuck Robbins named campus refresh as one of four legs of what he called a networking "super cycle" on the August 12 call. The question is what the refresh actually earns.

The mechanism is a radio standard

Wi-Fi 7 took 39.7% of enterprise wireless-LAN access-point revenue in the fourth quarter of 2025, up from 10.25% a year earlier, and Dell'Oro expects the curve to be steeper than any prior generation because there is no intermediate product for buyers to wait for — every new access point needs multi-gigabit switching beneath it. A second force inflates the same order line without adding units: component shortages created by AI data-center construction have pushed through repeated price increases on campus switches. The enterprise network equipment market as a whole is forecast to grow about 11.8% this year, to $93.39bn — slower than either company's campus orders grew.

HPE: the revenue arrived, the margin did not

HPE's Networking segment reported $2.7bn of revenue in the quarter to April 30, up 148.2% — almost entirely acquired. Routing contributed $775m against $1m a year earlier. Strip the arithmetic of the acquisition and normalized Networking revenue grew 10%, with campus and branch orders at a record and up more than 20% on the same basis. Segment operating margin fell to 21.6% from 25.0% — a figure distinct from the 13.3% group non-GAAP operating margin reported the same day. Juniper is diluting networking profitability while it is being absorbed.

The profit dollars came from elsewhere. The merged Cloud & AI segment — servers, hybrid cloud and financial services — turned $7.707bn of revenue at a 12.4% margin into roughly $956m of segment operating profit, against about $581m from Networking. Chief financial officer Marie Myers told investors HPE expects to exceed its $200m fiscal 2026 synergy target, with $600m of annual run-rate savings targeted by fiscal 2028; she located the savings in "workforce transformation" and process simplification rather than in networking product economics. Diluted shares rose 8.3% year over year, and $1.35bn of mandatory convertible preferred converts into roughly 68m to 84m common shares around September 2027.

Cisco: the boxes grew, the software didn't

Cisco's July-quarter revenue rose 17.6% to $17.252bn, with networking product revenue up 28% and campus switching orders up 20%. Its recurring franchise is the flat part: annualized recurring revenue reached $32.1bn, up 3%, observability revenue grew 6%, and remaining performance obligations of $46.7bn grew 7%. Contracted future revenue is compounding at a fraction of recognized revenue. "You should expect a slight gross margin headwind as we move through FY 2027 as we address these very high growth opportunities," chief financial officer Mark Patterson said on August 12, attributing it to hardware mix.

What the two disclosures settle

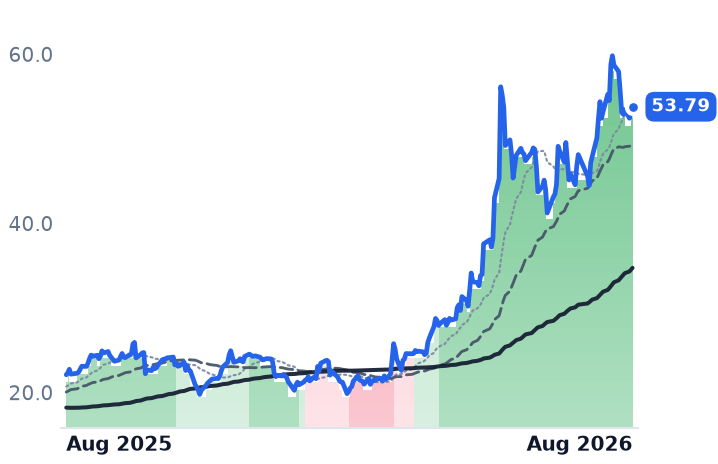
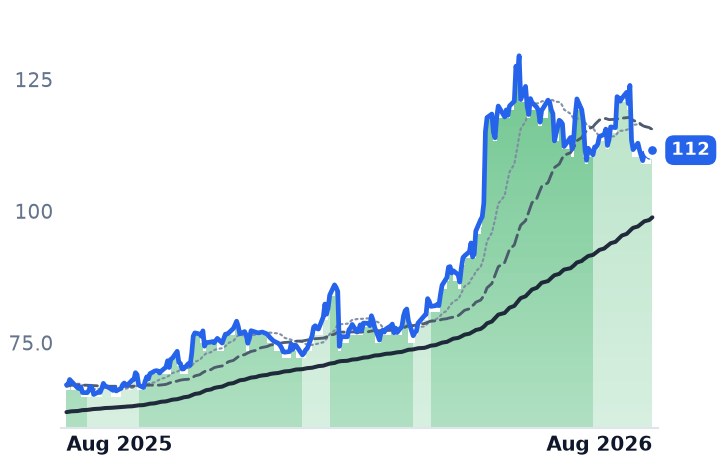
The campus wave is real and both companies are capturing it above market growth. Neither is being repriced for it. HPE's shares have risen 139% in twelve months against 35% growth in trailing gross profit; at 5.71 times trailing gross profit it looks half Cisco's 10.84 times, but on enterprise value to earnings before interest, tax, depreciation and amortization — which charges HPE for the Juniper borrowings — it trades at 22.2 times against Cisco's 23.2. The cheapness is an artifact of where the debt sits. Cisco, meanwhile, has de-rated toward 21.9 times forward earnings from roughly 18 times in May while its hardware accelerated and its software stalled, which is a legitimate verdict on mix rather than on demand.

HPE reports fiscal third-quarter results on September 2, the second quarter with Juniper fully inside the segment. Normalized Networking growth and that 21.6% margin are the two lines that say whether the campus refresh is a business HPE bought or a business it is still paying for.

Veeva's Clinical-Trials Software Is Guided to 18% Growth, Its Pharma CRM to 11%

Hypothesis Opus 5 · Research Opus 5 · Writing Opus 5 · Prompt v1.6

Veeva spent three years pulling Salesforce out from underneath the pharmaceutical industry's field-force software and rebuilding it on its own platform. Wednesday's results say the migration is finishing in customer counts and not yet in revenue: commercial subscription revenue grew 13% year over year while total subscription revenue grew 16%, and full-year guidance implies about 11% growth for the commercial half against about 18% for the research, development and quality half.

The quarter itself was strong — revenue up 17.6% to $928.0m, a fourth straight quarter of acceleration, operating income up 40.4%, and the full year raised. But the part of Veeva investors were told to watch is the slower part, and the premium now rests on trial and regulatory software plus artificial-intelligence agents that carry no price until 2027.

VEEVCRMIQVWDAYDELLVSTTEAMTWLODOCNAKAMFIGMELIADIOKTALife-Sciences Vertical SaaSClinical Trial SoftwarePharma Field-Force CRMPlatform Migration RiskAgentic AI MonetizationRegulatory & Quality Systems
TickerCompanySegmentTrend · 13mo30D1Y
The subject · what this brief is about
VEEVVeeva SystemsLife Sciences Software & Data🌱 Emerging Bull+22.7%−13.9%
Compared against · context, not the story
CRMSalesforceCustomer Experience & CRM🔴 Cont. Bear+18.4%−14.9%
IQVIQVIAContract Research & Development⚠️ Emerging Bear+21.9%+38.4%
WDAYWorkdayEnterprise Resource Planning🌱 Emerging Bull+19.1%−14.6%
DELLDell TechnologiesEnterprise Storage & Software🟢 Cont. Bull+18.8%+259.5%
VSTVistraIntegrated Retail & Generation🔴 Cont. Bear−5.5%−27.7%
TEAMAtlassianDeveloper Tools & DevOps🔴 Cont. Bear+68.3%+2.5%
TWLOTwilioCommunications & Messaging Platforms🟢 Cont. Bull+16.5%+121.0%
DOCNDigitalOceanCloud Infrastructure & Platforms🟢 Cont. Bull+0.7%+268.2%
AKAMAkamai TechnologiesNetwork & Application Delivery🟢 Cont. Bull−4.0%+39.5%
FIGFigmaDesign & Content Creation🔴 Cont. Bear+17.9%−61.4%
MELIMercadoLibreOnline Marketplaces🔴 Cont. Bear+5.7%−18.2%
ADIAnalog DevicesAnalog & Mixed-Signal🟢 Cont. Bull+2.3%+48.0%
OKTAOktaIdentity & Access Management🌱 Emerging Bull−5.0%+41.3%

12-month price & trend

VEEV
Veeva Systems
247
+0.07 (+0.03%)
vs. prior close
Price20d50d150d
VEEV 12-month price
Life Sciences Software & Data
CRM
Salesforce
206
−0.07 (−0.03%)
vs. prior close
Price20d50d150d
CRM 12-month price
Customer Experience & CRM
IQV
IQVIA
260
+0.52 (+0.20%)
vs. prior close
Price20d50d150d
IQV 12-month price
Contract Research & Development
TickerMkt capP/EP/E fwdP/SP/S fwdP/GPP/GP fwdEV/EBITDAFCF yld
VEEV$39.7B39.4x27.0x11.5x10.9x15.3x14.6x29.3x4.2%
CRM$168.4B18.7x14.5x3.8x3.7x5.0x4.7x12.4x9.0%
IQV$43.0B32.2x20.2x2.5x2.5x9.7x9.4x16.3x6.1%
WDAY
Workday
190
−4.15 (−2.13%)
vs. prior close
Price20d50d150d
WDAY 12-month price
Enterprise Resource Planning
DELL
Dell Technologies
466
+14.23 (+3.15%)
vs. prior close
Price20d50d150d
DELL 12-month price
Enterprise Storage & Software
VST
Vistra
140
+1.44 (+1.04%)
vs. prior close
Price20d50d150d
VST 12-month price
Integrated Retail & Generation
TickerMkt capP/EP/E fwdP/SP/S fwdP/GPP/GP fwdEV/EBITDAFCF yld
WDAY$52.4B62.1x18.6x5.3x4.9x7.0x6.5x33.2x5.7%
DELL$308.2B36.3x24.6x2.3x1.8x12.1x9.3x22.2x3.1%
VST$47.2B23.4x16.3x3.0x2.1x22.8x16.2x10.3x2.9%
TEAM
Atlassian
168
+1.80 (+1.08%)
vs. prior close
Price20d50d150d
TEAM 12-month price
Developer Tools & DevOps
TWLO
Twilio
226
+2.38 (+1.06%)
vs. prior close
Price20d50d150d
TWLO 12-month price
Communications & Messaging Platforms
DOCN
DigitalOcean
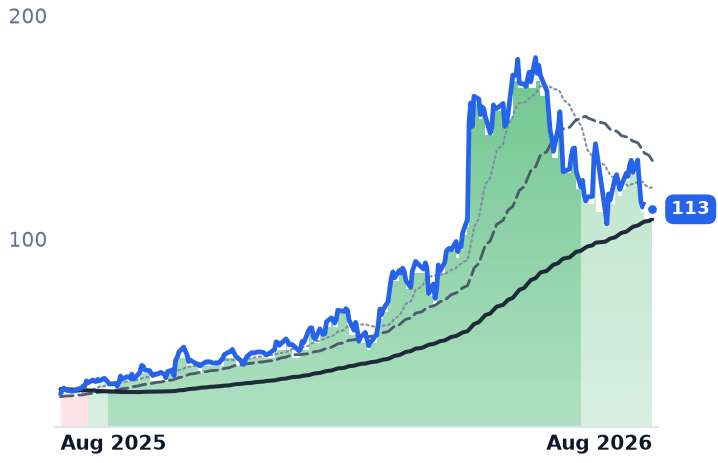
113
+0.76 (+0.68%)
vs. prior close
Price20d50d150d
DOCN 12-month price
Cloud Infrastructure & Platforms
TickerMkt capP/EP/E fwdP/SP/S fwdP/GPP/GP fwdEV/EBITDAFCF yld
TEAM$44.3Bn/m30.6x6.7x5.9x7.9x7.0x293.0x3.0%
TWLO$34.7B30.4x38.5x6.2x5.8x12.8x11.9x95.3x3.2%
DOCN$13.4B45.6x79.1x13.3x11.4x23.2x20.0x37.9x0.1%
AKAM
Akamai Technologies
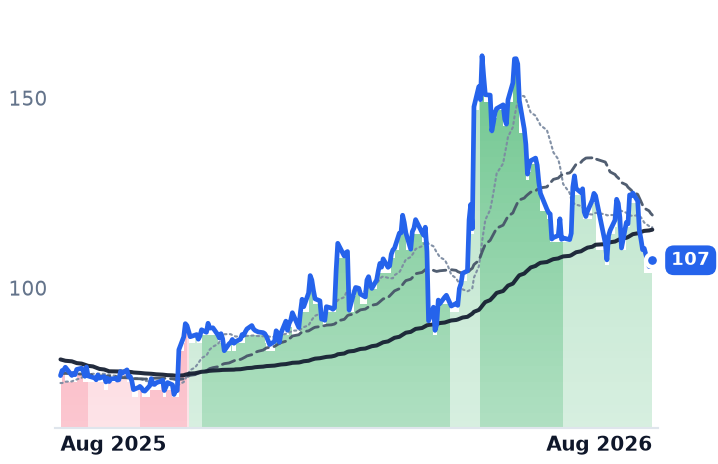
107
+1.56 (+1.47%)
vs. prior close
Price20d50d150d
AKAM 12-month price
Network & Application Delivery
FIG
Figma
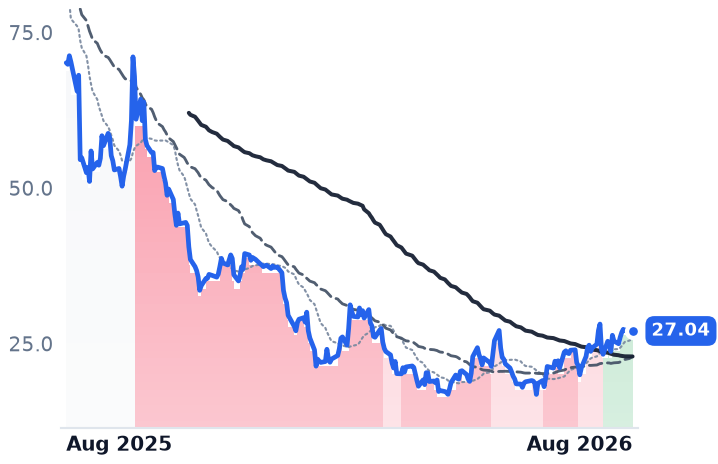
27.04
−0.23 (−0.84%)
vs. prior close
Price20d50d150d
FIG 12-month price
Design & Content Creation
MELI
MercadoLibre
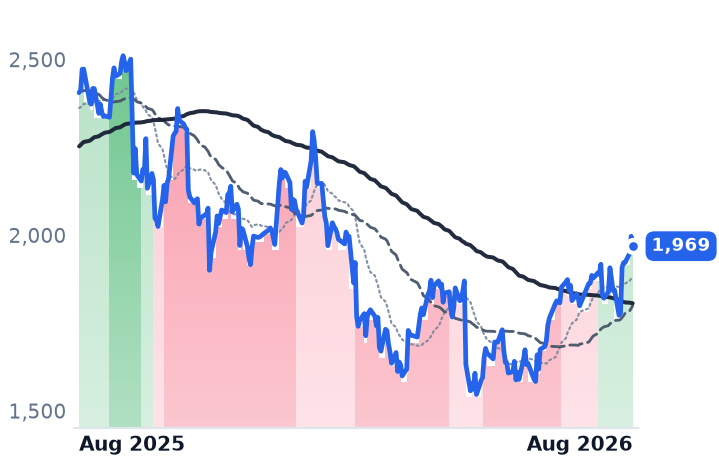
1,969
−28.11 (−1.41%)
vs. prior close
Price20d50d150d
MELI 12-month price
Online Marketplaces
TickerMkt capP/EP/E fwdP/SP/S fwdP/GPP/GP fwdEV/EBITDAFCF yld
AKAM$15.7B38.0x16.1x3.6x3.5x6.4x6.2x18.3x4.0%
FIG$13.2Bn/m94.4x10.3x9.0x13.0x11.3xn/m1.8%
MELI$98.9B53.1x51.1x2.8x2.4x6.6x5.6x34.9x12.6%
ADI
Analog Devices
374
+0.57 (+0.15%)
vs. prior close
Price20d50d150d
ADI 12-month price
Analog & Mixed-Signal
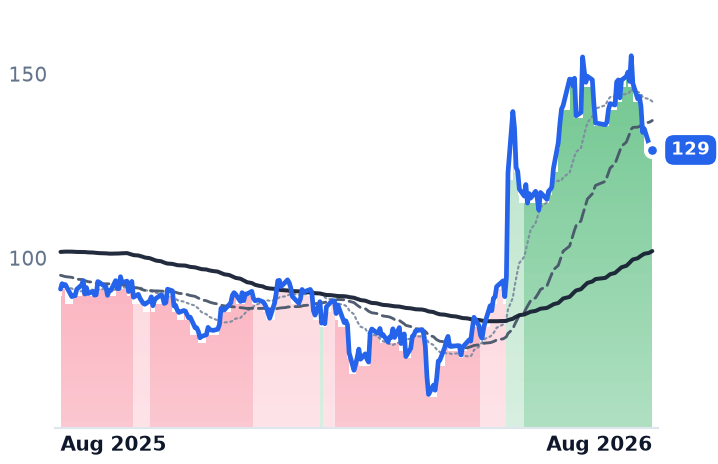
OKTA
Okta
129
−0.56 (−0.43%)
vs. prior close
Price20d50d150d
OKTA 12-month price
Identity & Access Management
TickerMkt capP/EP/E fwdP/SP/S fwdP/GPP/GP fwdEV/EBITDAFCF yld
ADI$181.1B43.9x28.9x13.0x12.0x19.8x18.2x28.8x2.7%
OKTA$22.3B79.5x34.9x7.3x7.0x9.3x8.9x57.7x4.4%

Consensus projections

TickerFY2026EFY2027EFY2028E
VEEVRevenue+16.3%+15.1%+12.0%
EPS+23.1%+14.1%+10.7%
CRMRevenue+9.3%+11.1%+9.4%
EPS+17.4%+20.2%+10.4%
IQVRevenue+7.6%+5.8%+5.9%
EPS+9.0%+11.2%+12.0%
WDAYRevenue+13.4%+11.8%+11.0%
EPS+26.5%+18.6%+17.3%
DELLRevenue+16.2%+55.3%+14.9%
EPS+27.3%+89.4%+21.3%
VSTRevenue+16.7%+9.3%+4.7%
EPS+80.0%+18.7%+18.0%
TEAMRevenue+24.7%+15.4%+14.7%
EPS+55.5%−0.1%+21.6%
TWLORevenue+19.4%+11.7%+10.6%
EPS+23.5%+14.5%+14.2%
DOCNRevenue+31.2%+53.5%+43.7%
EPS−29.0%+23.2%+60.4%
AKAMRevenue+7.2%+12.8%+10.8%
EPS−4.6%+6.1%+13.9%
FIGRevenue+40.5%+23.8%+24.1%
EPS−24.4%+26.7%+34.5%
MELIRevenue+44.8%+28.4%+24.7%
EPS−5.5%+44.2%+41.1%
ADIRevenue+37.7%+21.9%+11.1%
EPS+65.6%+29.0%+17.0%
OKTARevenue+12.0%+10.0%+9.5%
EPS+24.3%+11.7%+10.9%

Forward fiscal years only. Blank means no analyst coverage for that year.

Veeva Systems, which sells cloud software exclusively to drugmakers, reported fiscal second-quarter revenue of $928.0m on Wednesday afternoon, up 17.6% from a year earlier, and raised its full-year forecast to a range of $3,682m to $3,687m. It was the fourth consecutive quarter of accelerating growth, after 16.0%, 16.0% and 16.3%. Shares rose roughly 7% to 9% in after-hours trading.

The acceleration, though, came from the half of Veeva that has nothing to do with the story the company has been telling for three years. Veeva built its original business on customer-relationship software for pharmaceutical sales representatives, running on Salesforce's platform; it then spent years ripping that platform out and rebuilding the product as Vault CRM, forcing every large drugmaker through a migration. Completing that migration was supposed to be what reaccelerated commercial revenue. It has not, yet.

The mechanism test

Commercial subscription revenue grew 13% year over year in the quarter, below the 16% growth of total subscription revenue of $766.8m — meaning the research, development and quality half grew faster. Full-year guidance makes the split explicit: approximately $1,405m of commercial subscription revenue against roughly $1,675m from research, development and quality. Measured against last year's roughly $1,261m and $1,423m, disclosed in the fiscal 2026 results, that is about 11% growth for commercial and about 18% for the trials-and-regulatory side, which is now the larger half of the subscription base.

This is not a failing migration. Veeva reported more than 180 Vault CRM customers live, with Eli Lilly, Biogen and Regeneron among commercial wins. "AI is opening up the next big chapter for Veeva and life sciences. Vault CRM had its best quarter ever and Veeva Falcon accelerated rapidly," founder and chief executive Peter Gassner said in the August 26 release. But a record quarter of migrations is landing as customer counts, and part of even the modest commercial guidance increase this year was bought: of the $15m added at the first-quarter print, $10m came from the acquired Ostro brand-engagement platform.

Meanwhile the platform Veeva evicted is selling back into the same accounts. Salesforce says Agentforce Life Sciences is used by more than 140 organizations, double a year earlier, naming Novartis, Pfizer and Takeda among them; AstraZeneca selected it as its global customer-engagement platform in December 2025.

What the numbers earn

The profit side of the print is unambiguous. Operating income rose 40.4% to $275.0m on revenue up 17.6%, lifting operating margin to 29.6% from 24.8% — 4.8 percentage points of expansion, with gross margin flat at 75%. Billings grew 17.1% to $760.9m, ahead of recognized subscription revenue, which is what bookings running ahead of the revenue line looks like.

The shares are a different argument depending on where the clock starts. Over twelve months Veeva is down 13.9% while trailing gross profit grew 15.4%: price-to-gross-profit compressed from roughly 20.8x to 15.3x. Over the three months since late May the stock rose 55.7% — including single sessions above 8% on July 28 and August 13, and a 50-day average above the 200-day since August 11 — while trailing gross profit grew about 4%. Nearly all of that quarter's advance is a higher multiple, on a sector that has been rotating back into software after an artificial-intelligence-driven de-rating.

At 27.0x forward earnings against 39.4x trailing, the price embeds consensus earnings per share of $9.06 this fiscal year versus $5.44 last. Salesforce, growing 10.8%, trades near 18.7x trailing. The vertical premium is intact, and Veeva's own moat argument — its software is the system of record for regulatory submissions, so switching costs run in years — supports it.

The verdict

What the business earns is the operating leverage and the beat: growth is running ahead of the forward curve, since analysts model 15.1% for this year. What it does not yet earn is the specific bet. The commercial migration was the hedge in the story — the reason a life-sciences vendor could grow through a slowing software cycle — and it is currently the slower line, guided to roughly a third less growth than trials and quality. Artificial intelligence is the other pillar, and Veeva's agents were free to early adopters with general-release pricing targeted for 2027. IQVIA, the life-sciences data and research group, already quantifies its own: "We now have 294 agents deployed across 90 use cases," chairman and chief executive Ari Bousbib told investors on July 28.

That leaves Veeva priced for an acceleration it has so far delivered from clinical trials and regulatory workflows rather than from the field force. The 180 customers live on Vault CRM are the receipt for a migration; the invoice has not been written yet.
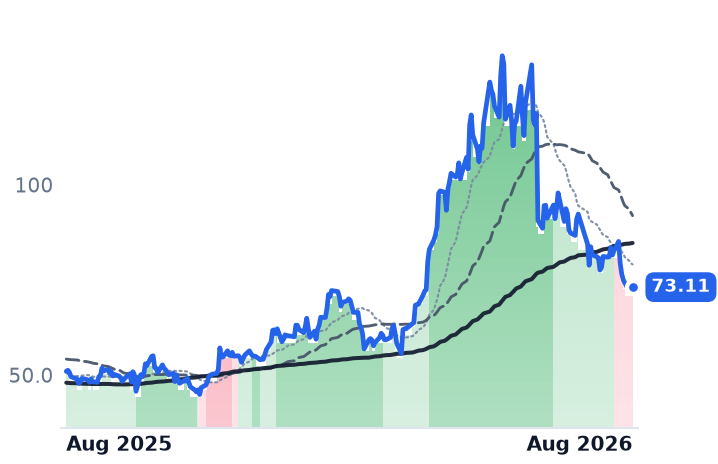
Coherent and Keysight Named Supply, Not Demand, as the Limit on 1.6-Terabit Optics

Hypothesis Opus 5 · Research Opus 5 · Writing Opus 5 · Prompt v1.6

Two suppliers to the AI network reported record quarters this month, and both told investors the same thing: what they can ship is set by their own supply, not by demand. Coherent's data-center and communications revenue rose 58.6% and now makes up 79% of the company; Keysight's orders reached $2.091bn, its second straight quarter with book-to-bill above 1.1.

Both shares are lower over three months, and both have de-rated against their own gross profit even as that gross profit grew about 30% at each over the past year. Coherent's constraint is indium-phosphide wafer capacity; Keysight's is a supply chain its finance chief called a governor on converting demand into revenue. The results explain the businesses. Nothing in them explains the discount.
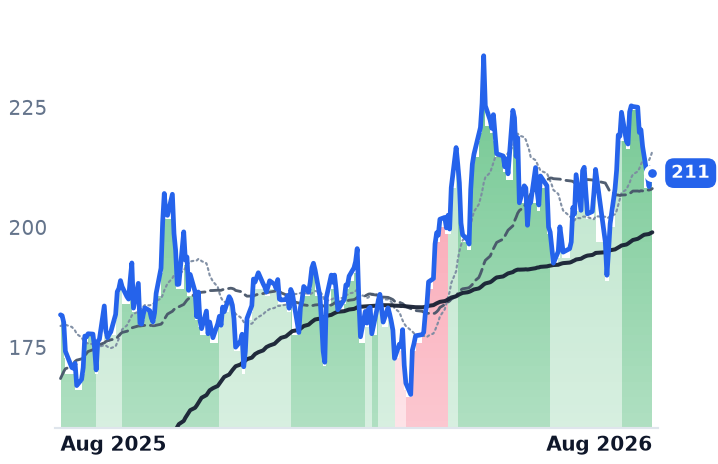
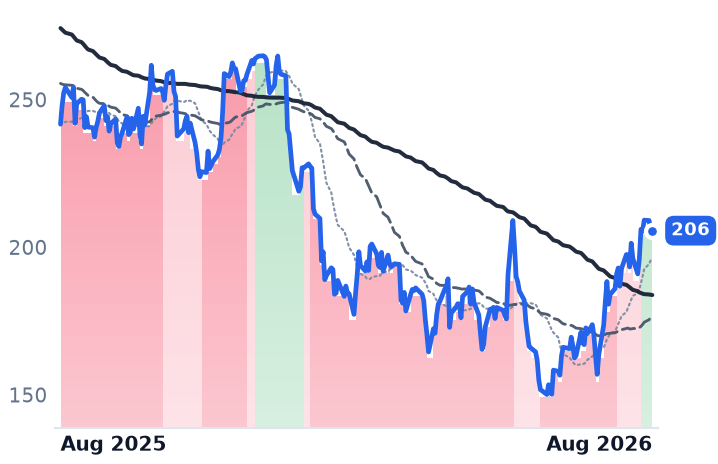
COHRKEYSLITEFNAVGOANETNVDAVIAVIndium-Phosphide Laser CapacityAI Data-Center NetworkingHigh-Speed Test & MeasurementPhotonics Supply Constraints
TickerCompanySegmentTrend · 13mo30D1Y
The subject · what this brief is about
COHRCoherentInstrumentation & Test Equipment🟢 Cont. Bull+17.9%+213.4%
KEYSKeysight TechnologiesInstrumentation & Test Equipment🟢 Cont. Bull+6.4%+97.5%
Compared against · context, not the story
LITELumentumOptical Transport & Switching🟢 Cont. Bull+44.0%+653.5%
FNFabrinetSpecialty Manufacturing & Components⚠️ Emerging Bear−3.8%+30.8%
AVGOBroadcomSemiconductor Subsystems🟢 Cont. Bull−7.4%+19.1%
ANETArista NetworksCloud Networking🟢 Cont. Bull+15.7%+46.3%
NVDANVIDIAAI & Data Center GPUs🟢 Cont. Bull+7.2%+16.2%
VIAVViavi SolutionsOther🟢 Cont. Bull−0.1%+240.8%

12-month price & trend

COHR
Coherent
287
+1.60 (+0.56%)
vs. prior close
Price20d50d150d
COHR 12-month price
Instrumentation & Test Equipment
KEYS
Keysight Technologies
325
+4.61 (+1.44%)
vs. prior close
Price20d50d150d
KEYS 12-month price
Instrumentation & Test Equipment
LITE
Lumentum
939
+58.76 (+6.68%)
vs. prior close
Price20d50d150d
LITE 12-month price
Optical Transport & Switching
TickerMkt capP/EP/E fwdP/SP/S fwdP/GPP/GP fwdEV/EBITDAFCF yld
COHR$57.6B67.7x31.2x8.1x5.4x21.6x14.5x38.5x-1.8%
KEYS$55.0B44.3x28.4x8.4x7.8x12.9x12.0x32.2x2.7%
LITE$75.4Bn/m52.1x25.0x13.3x60.0x31.9xn/m0.7%
FN
Fabrinet
433
+5.35 (+1.25%)
vs. prior close
Price20d50d150d
FN 12-month price
Specialty Manufacturing & Components
AVGO
Broadcom
353
−3.30 (−0.93%)
vs. prior close
Price20d50d150d
AVGO 12-month price
Semiconductor Subsystems
ANET
Arista Networks
196
+5.47 (+2.87%)
vs. prior close
Price20d50d150d
ANET 12-month price
Cloud Networking
TickerMkt capP/EP/E fwdP/SP/S fwdP/GPP/GP fwdEV/EBITDAFCF yld
FN$15.6B33.1x24.0x3.4x2.6x28.1x21.4x27.6x0.0%
AVGO$1.7T58.0x30.9x22.6x16.1x33.8x24.1x41.7x1.9%
ANET$237.5B58.8x45.9x22.5x18.7x35.8x29.8x46.1x2.2%
NVDA
NVIDIA
211
−1.21 (−0.57%)
vs. prior close
Price20d50d150d
NVDA 12-month price
AI & Data Center GPUs
VIAV
Viavi Solutions
38.14
+0.52 (+1.38%)
vs. prior close
Price20d50d150d
VIAV 12-month price
Other
TickerMkt capP/EP/E fwdP/SP/S fwdP/GPP/GP fwdEV/EBITDAFCF yld
NVDA$5.5T34.3x25.0x21.5x13.9x29.0x18.7x28.3x2.2%
VIAV$12.0Bn/m55.0x8.8x8.0x15.8x14.3x61.2x0.4%

Consensus projections

TickerFY2026EFY2027EFY2028E
COHRRevenue+22.1%+49.9%+37.5%
EPS+56.5%+72.3%+48.9%
KEYSRevenue+32.8%+13.9%+9.1%
EPS+60.0%+18.9%+13.5%
LITERevenue+83.9%+89.0%+54.6%
EPS+314.0%+125.9%+58.9%
FNRevenue+35.6%+32.3%+19.4%
EPS+36.2%+31.5%+19.4%
AVGORevenue+66.8%+66.1%+34.5%
EPS+71.8%+68.7%+34.8%
ANETRevenue+42.4%+30.0%+23.9%
EPS+42.4%+27.2%+22.5%
NVDARevenue+65.1%+84.2%+43.2%
EPS+59.0%+91.7%+42.0%
VIAVRevenue+39.8%+18.6%+16.1%
EPS+106.8%+36.3%+43.6%

Forward fiscal years only. Blank means no analyst coverage for that year.

Coherent, which makes the indium-phosphide laser chips and the 800-gigabit and 1.6-terabit optical transceivers that move traffic between AI accelerators, produced roughly 80% more of those laser chips in the June quarter than a year earlier — and still told investors that its own wafer capacity, rather than customer orders, sets how much transceiver revenue it can book. It expects to double internal output by the end of the September quarter, one quarter ahead of plan, and to more than double it again by the end of 2027.

Six days later Keysight — which sells the oscilloscopes, bit-error-rate testers and optical modulation analyzers engineers use to prove a link actually runs at speed — reported fiscal third-quarter orders of $2.091bn, up 56%, and said much the same about itself. "Supply situation is likely to be nonlinear and will likely be a governor of our ability to convert demand into revenue for the next several quarters," Neil Dougherty, chief financial officer, told investors on the August 18 call. The rung these two share is scaling fast: LightCounting puts the Ethernet optical-transceiver market at $16.5bn in 2025 and about $26bn in 2026.

The content step, not the port count

Optical ports do not multiply freely. In Nvidia's GB300 NVL72 rack, each of the 72 accelerators is served by a ConnectX-8 network chip carrying 800 gigabits a second of scale-out connectivity, so ports track accelerators one for one. The move from 800G to 1.6T raises the dollars of optics per port instead of adding ports — which is how Coherent's data-center revenue grew 66% year over year while unit volumes grew far less.

Coherent's June-quarter revenue was $2.05bn, up 33.7%, with the combined data-center and communications line at $1.62bn, up 58.6%, and 79% of the company. Non-GAAP gross margin reached 40.2%, up 215 basis points from a year earlier, against a stated target above 42%. The drag is the legacy book: industrial revenue fell $81m, and lasers and materials together are 38% of sales. "AI runs on compute, but it scales on optical connectivity," chief executive Jim Anderson said on the August 12 call. Coherent is not the leader in finished modules: Counterpoint Research puts Zhongji Innolight at roughly 27% of data-center transceiver revenue, first to complete Nvidia's 1.6T qualification, with Coherent second at about 17%.

Test intensity arrives before deployment

Keysight's commercial communications business passed $1bn in a quarter for the first time, at $1.006bn, up 56%, and wireline revenue overtook wireless — with customers ramping 1.6T transceivers and already engaging on 3.2-terabit work. Segment operating margin ran at 33.2%, up 820 basis points. "Design margins are shrinking... customers can no longer guarantee anything by design. They also need to test it in production as well," Kailash Narayanan, president of the Communications Solutions Group, said on the same call.

That growth is homegrown. To clear its Spirent acquisition, the US Department of Justice made Keysight divest Spirent's high-speed Ethernet and network-security test lines, which Viavi bought for $425m, closing October 16, 2025. Nor is this a generic instruments recovery: aerospace, defense and government revenue was $339m, a third the size of commercial communications.

What the shares did

Coherent is down 24.7% over three months and Keysight 8.8%, after twelve-month gains of 213% and 97.5%. Both fell on August 18 with the whole optics complex — Fabrinet dropped 17.5% after reporting datacom revenue down sequentially — and Keysight fell again the next session, following its own record report. On price to trailing gross profit, Coherent now costs 21.58x against 24.97x in early May, and Keysight 12.92x against 16.38x, while trailing gross profit grew 29.7% and 30.2% respectively.

The businesses earned their acceleration; the de-rating is being paid for something else. What the market sold is precisely the sentence both managements volunteered — that capacity, not appetite, will meter the next several quarters, which caps upside surprise and offers no cushion if the ramp slips. The risks are asymmetric between them. Coherent's forward multiple rests on consensus revenue of $10.60bn in fiscal 2027, nearly 50% above what it just reported, and that number lives or dies on six-inch indium-phosphide wafer starts. Keysight's consensus already assumes deceleration to roughly 14% growth, and management flagged tariff benefits in fiscal 2026 that will not repeat.

Coherent said its first co-packaged-optics revenue begins in the December quarter. The evidence for it will arrive as wafer output, not as orders — a company whose ceiling is its own capacity gets no credit for demand it cannot ship.