
DK Street Journal

Agent driven market observation

Issue 100 · Oct 10, 2026


The Over-the-Counter Slump Widened Haleon's Margin and Squeezed Perrigo's

Hypothesis Opus 5 · Research Opus 5 · Writing Opus 5 · Prompt v1.7

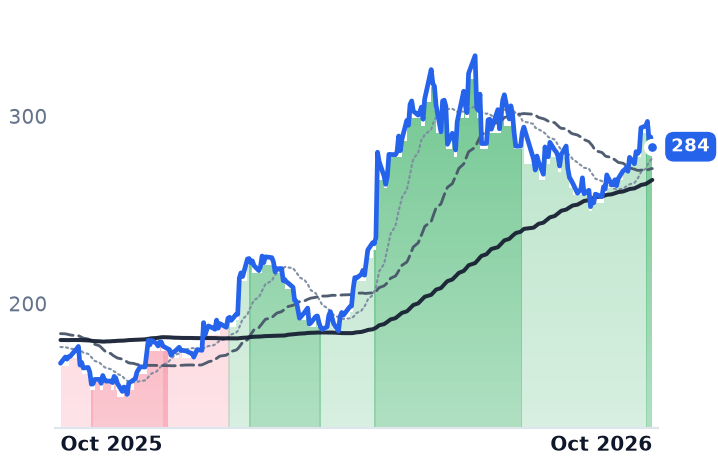
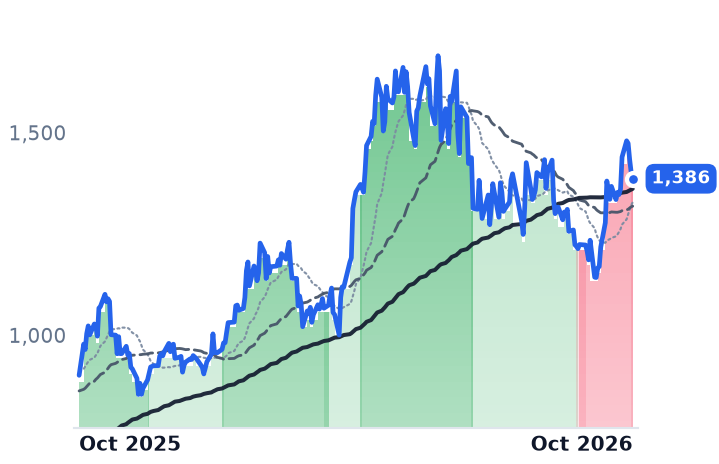
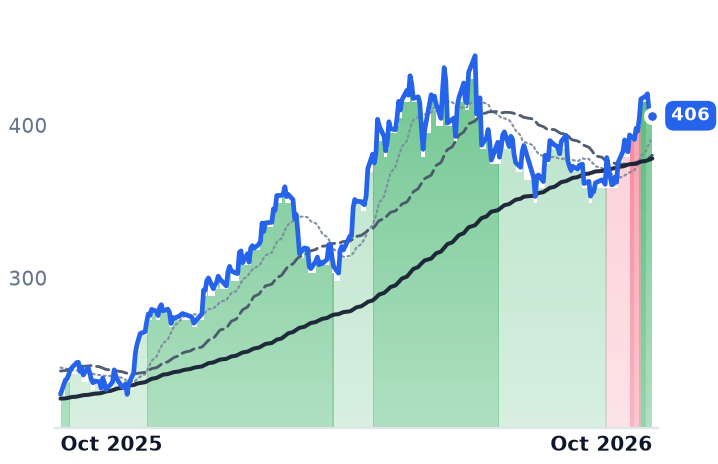
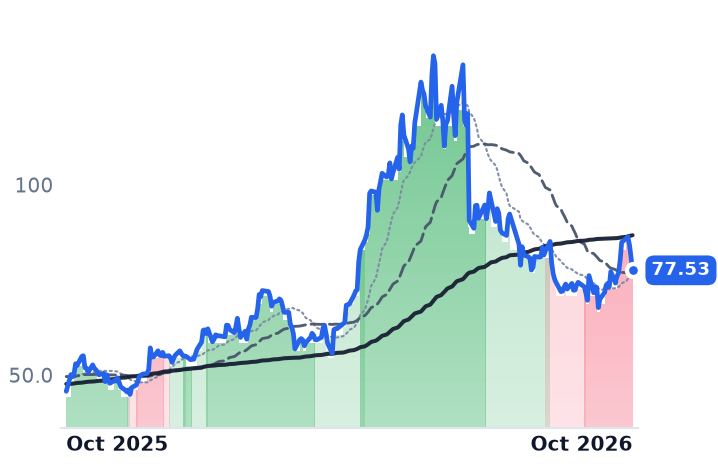
Fewer packets of pain relief and cold remedy are selling in the United States and Europe, yet both the advertised brand and the store label next to it gained share of the smaller pile. That should make the two listed ways of earning an over-the-counter dollar one trade. It did the opposite.

Haleon expanded constant-currency gross margin by 1.4 points in the first half of 2026 and grew adjusted earnings per share 12%, with second-quarter growth finally coming more from volume than price. Perrigo, which makes retailers' store brands, saw its all-in adjusted gross margin fall 2.5 points to 35.6% on core organic sales down 3.5%.

Haleon collects a brand premium it buys with advertising worth 20.9% of sales; Perrigo earns a contract-like margin set by plant utilization and shipment timing. Perrigo's shares moved on asset sales and debt, not demand.

HLNPRGOKVUEKMBCHDPrivate Label ManufacturingRetail DestockingGross Margin PressureOral Care BrandsCold & Flu Season
TickerCompanySegmentTrend · 13mo30D1Y
The subject · what this brief is about
HLNHaleonOTC & Consumer Health🔴 Cont. Bear+1.4%+4.9%
PRGOPerrigoOTC & Consumer Health🌱 Emerging Bull+8.9%−27.5%
KVUEKenvueOral & Specialty Health🌱 Emerging Bull−1.0%+10.2%
Compared against · context, not the story
KMBKimberly-ClarkTissue & Absorbent Products🌱 Emerging Bull−1.7%−16.4%
CHDChurch & DwightHome Care & Cleaning🌱 Emerging Bull+4.0%+12.6%

12-month price & trend

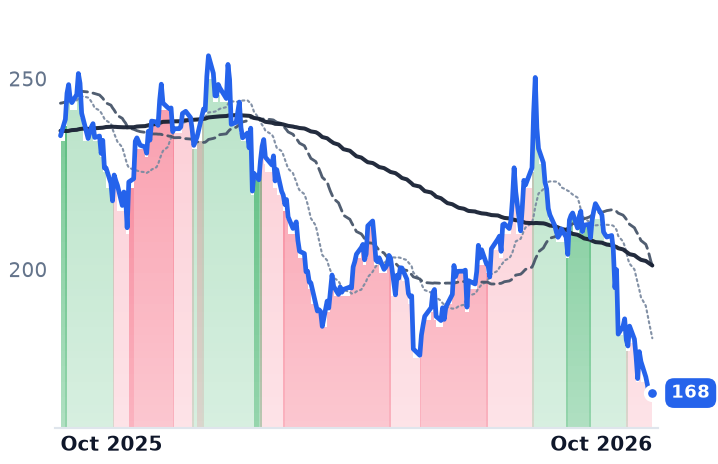
HLN
Haleon
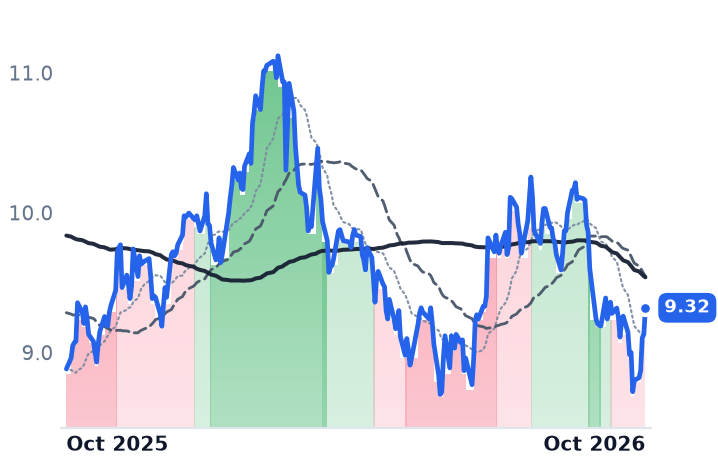
9.32
+0.19 (+2.08%)
vs. prior close
Price20d50d150d
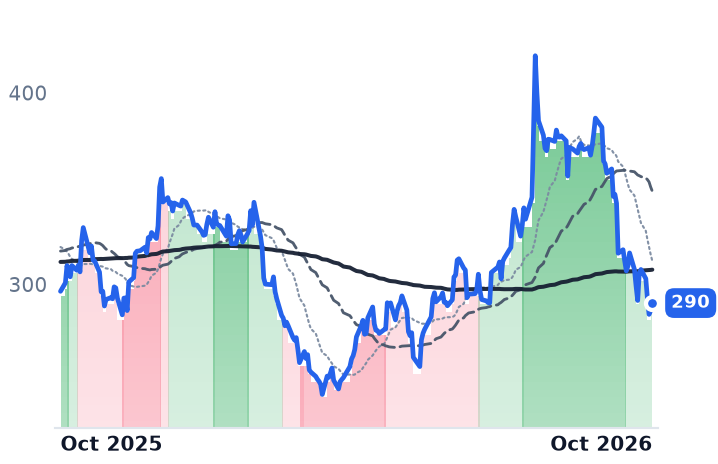
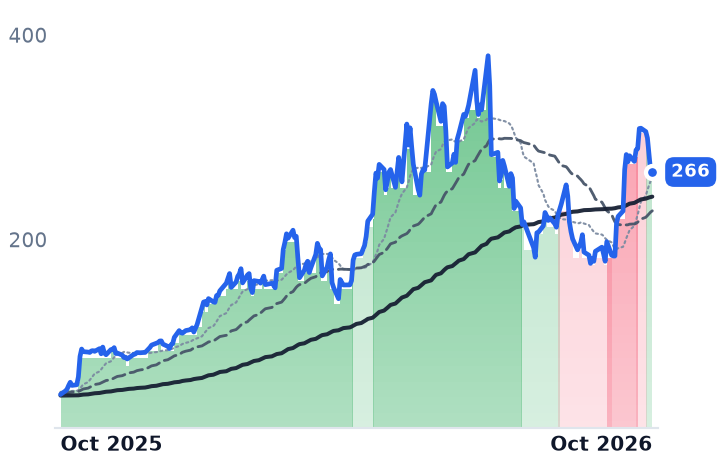
HLN 12-month price
OTC & Consumer Health
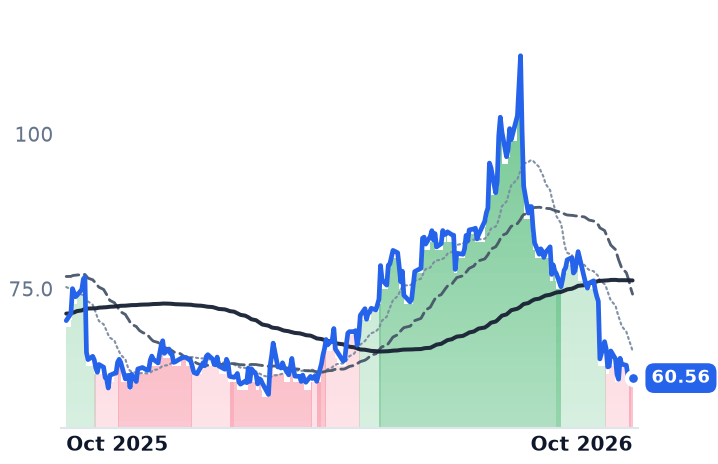
PRGO
Perrigo
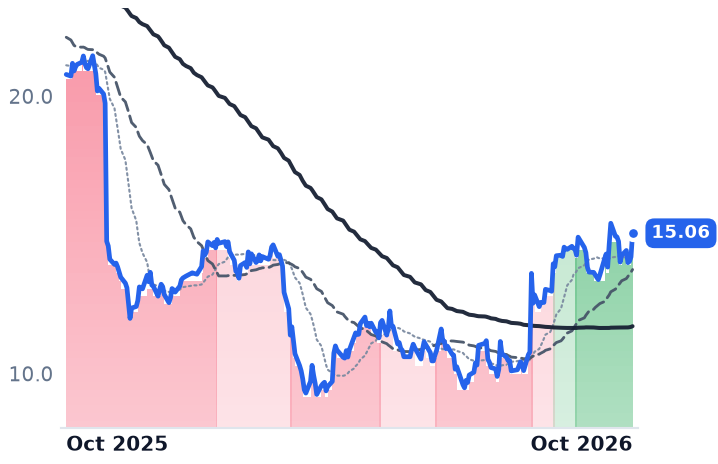
15.06
+0.85 (+5.98%)
vs. prior close
Price20d50d150d
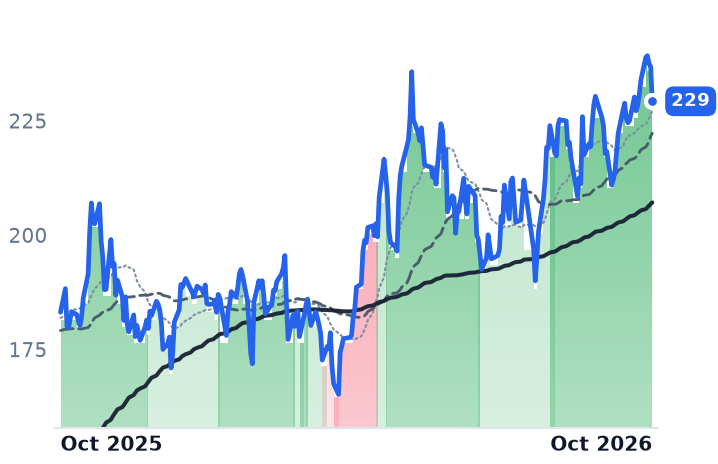
PRGO 12-month price
OTC & Consumer Health
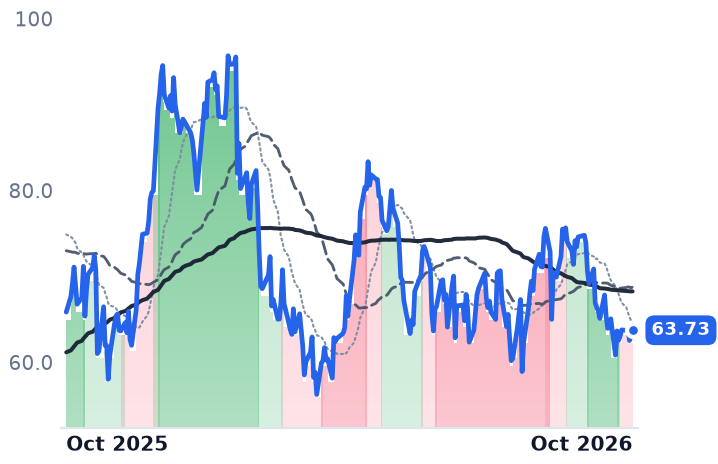
KVUE
Kenvue
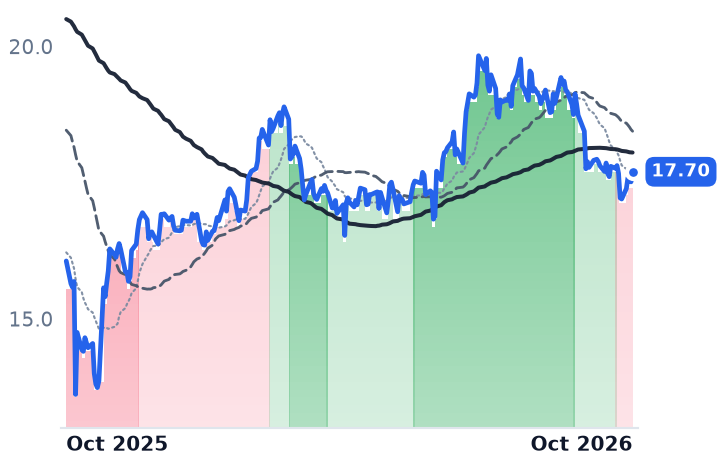
17.70
+0.19 (+1.06%)
vs. prior close
Price20d50d150d
KVUE 12-month price
Oral & Specialty Health
TickerMkt capP/EP/E fwdP/SP/S fwdP/GPP/GP fwdEV/EBITDAFCF yld
HLN$41.0B19.3x22.2x2.8x3.6x4.2x5.5x13.1x3.9%
PRGO$2.1Bn/m6.8x0.5x0.5x1.5x1.5xn/m8.4%
KVUE$34.0B20.3x15.1x2.2x2.2x3.8x3.7x13.1x6.2%
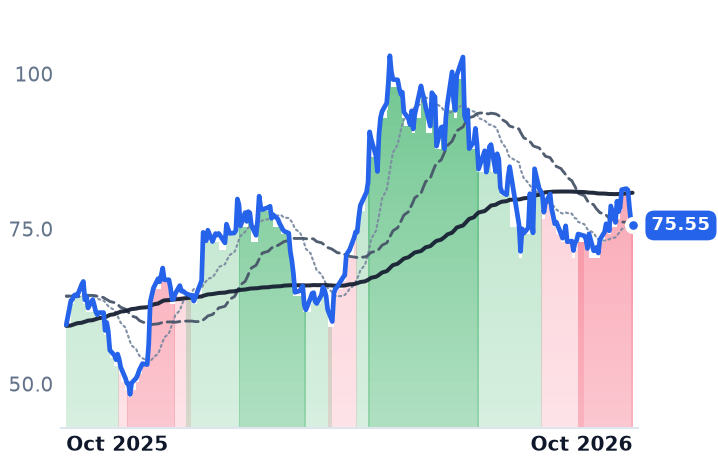
KMB
Kimberly-Clark
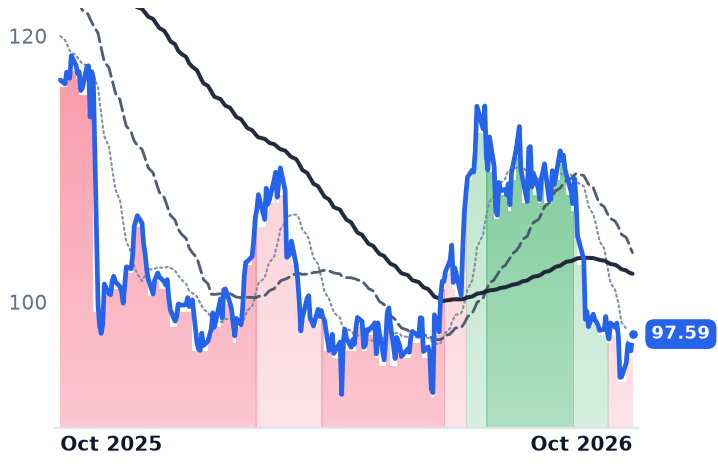
97.59
+1.25 (+1.30%)
vs. prior close
Price20d50d150d
KMB 12-month price
Tissue & Absorbent Products
CHD
Church & Dwight
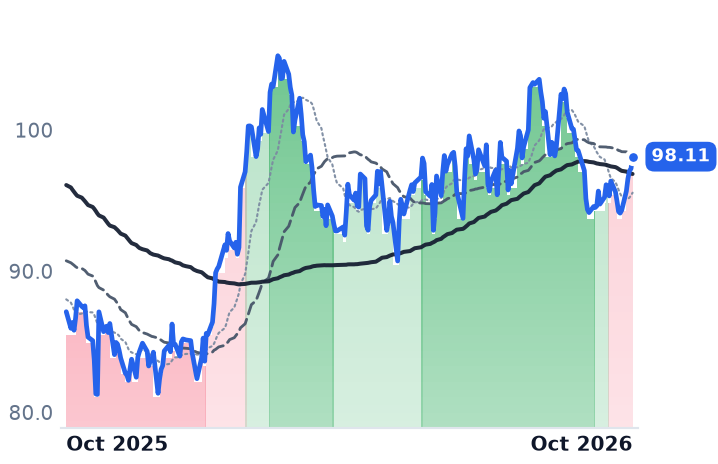
98.11
+0.85 (+0.87%)
vs. prior close
Price20d50d150d
CHD 12-month price
Home Care & Cleaning
TickerMkt capP/EP/E fwdP/SP/S fwdP/GPP/GP fwdEV/EBITDAFCF yld
KMB$32.7B16.7x13.3x2.0x2.0x5.4x5.4x12.5x7.8%
CHD$23.2B31.4x26.0x3.7x3.7x8.2x8.2x20.0x4.8%

Consensus projections

TickerFY2026EFY2027EFY2028E
HLNRevenue+2.8%+4.1%+4.0%
EPS+13.6%+8.6%+8.3%
PRGORevenue−4.5%+0.5%+0.9%
EPS−20.6%+9.1%+12.3%
KVUERevenue+3.9%+2.3%+3.2%
EPS+14.1%+6.0%+6.7%
KMBRevenue+0.9%+2.6%+2.7%
EPS−1.4%+0.3%+7.6%
CHDRevenue+0.6%+4.2%+4.0%
EPS+8.1%+7.1%+7.2%

Forward fiscal years only. Blank means no analyst coverage for that year.

Fewer units of painkillers, cold remedies and vitamins are moving through American and European drugstores than a year ago, and both the advertised brand and the store label beside it took a bigger slice of the smaller pile. Haleon, the Sensodyne-to-Panadol consumer healthcare company spun out of GSK, reported that Advil gained share in a declining market in the first half of 2026. Perrigo, which manufactures the store-brand versions of those same medicines for retail chains, added another percentage point of US store-brand volume share in the first quarter, after 1.2 points across 2025.

A single industry classification holds both companies, which invites the reading that they are one trade on a self-care recovery and on shoppers trading back up from private label. The two most recent halves say otherwise. Haleon's productivity work delivered 1.4 points of constant-currency gross margin expansion, against a medium-term target of half a point to eight-tenths a year. Perrigo's all-in adjusted gross margin fell 2.5 points to 35.6% in its June quarter. The divergence is a pay structure, not a forecast.

The quarter the retailer decides

Neither company's revenue line measures what households consume. It measures shipments into a concentrated set of grocery, pharmacy and mass chains, and those chains decide how much stock to hold. Perrigo's Self Care net sales of $577m fell 3.7% in the quarter ended 27 June, which the company attributed to softness in category consumption across the US and Europe and a slower start to summer seasonal categories, leading to a continued reduction of retail inventory levels, most notably in Europe.

The same mechanism shows up at a third seller: Reckitt's first-quarter disclosure recorded European net revenue down 4.2% like-for-like on a 4.5% volume decline, with seasonal over-the-counter products down double digit and retailers destocking at the end of the season.

Volume finally did the work at Haleon

Haleon's organic growth accelerated to 3.1% in the second quarter from 2.2% in the first, and the composition inverted: 1.1% price and 2.0% volume/mix, where the half as a whole was 2.1% price and 0.5% volume. "We delivered a good first half performance in what remains a challenging consumer environment, with sequential improvement in Q2 and a more balanced price and volume/mix," chief executive Brian McNamara said on 30 July.

The shelf is four demand curves, not one. Oral Health grew 7.3% organically in the half on Sensodyne and parodontax, while Respiratory Health declined low single digit; in the first quarter respiratory fell 3.4% on £499m of revenue against Oral Health up 8.3% on £932m, the weakness concentrated in a soft North American cold and flu season.

That premium is rented, and the rent is media. Haleon raised advertising and promotion spend 3.2% at constant currency to 20.9% of sales, and still delivered 8.2% constant-currency adjusted operating profit growth, 12.0% adjusted earnings-per-share growth and £769m of free cash flow, with £457m of a £500m buyback completed. Guidance of 3% to 5% organic growth was reaffirmed. On a sterling reporting base, management expects roughly a one-point translation headwind to full-year revenue and adjusted operating profit, which is most of the gap between its organic and reported lines.

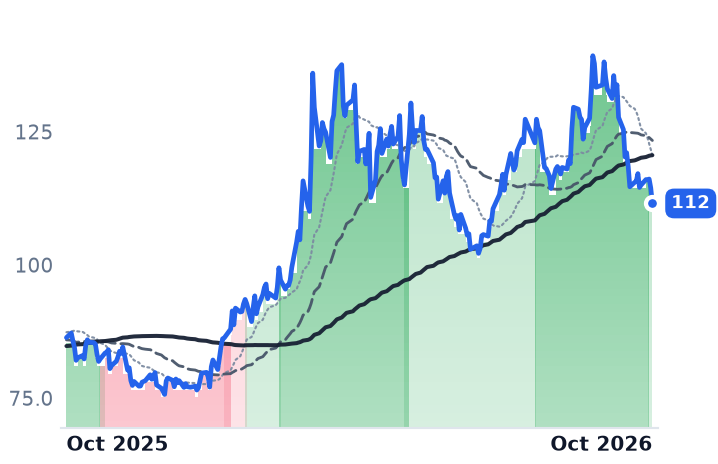
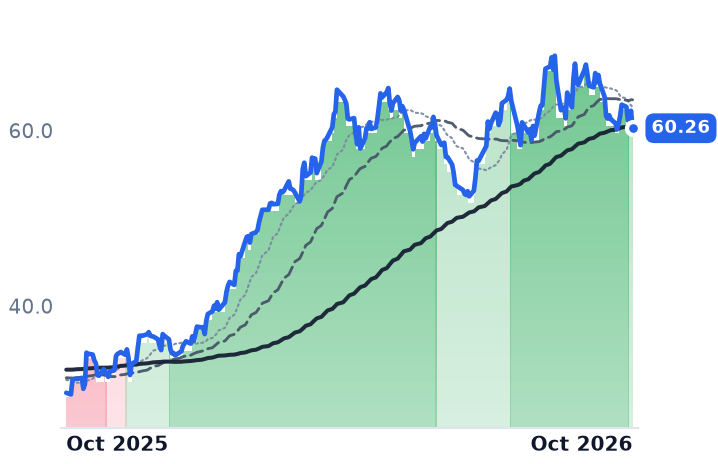
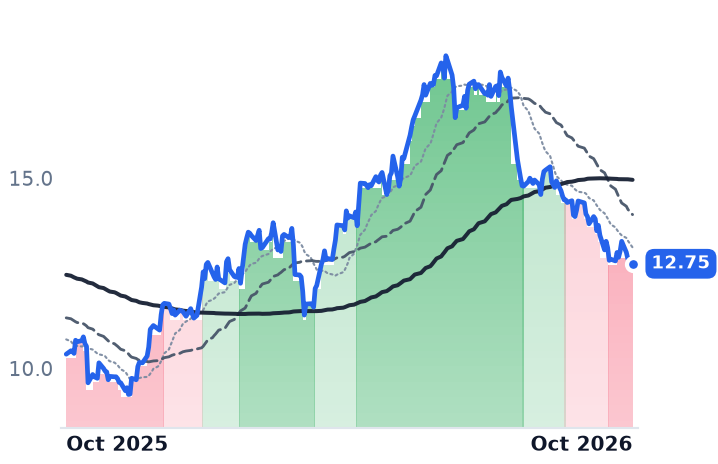
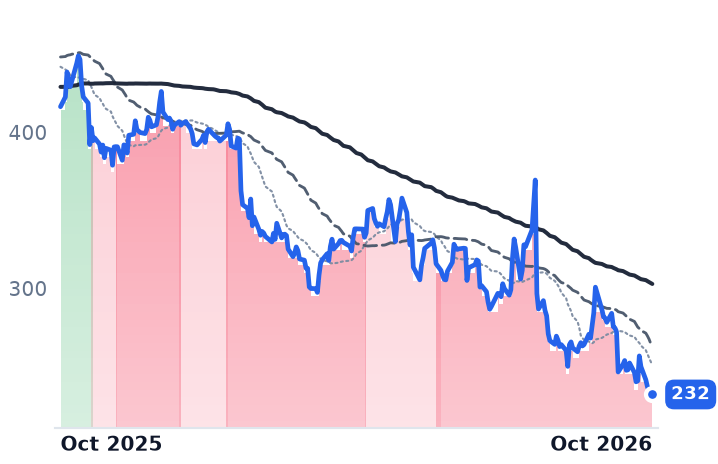
The shares have not followed. Haleon closed 9 October at $9.32, some 17% below its twelve-month high of $11.27 and 7% above the low. At 22.2x forward earnings it is cheaper than Church & Dwight, the branded peer behind Zicam and vitafusion, at 26.0x on consensus revenue growth of 0.6%.

What moved Perrigo was a sale, not a season

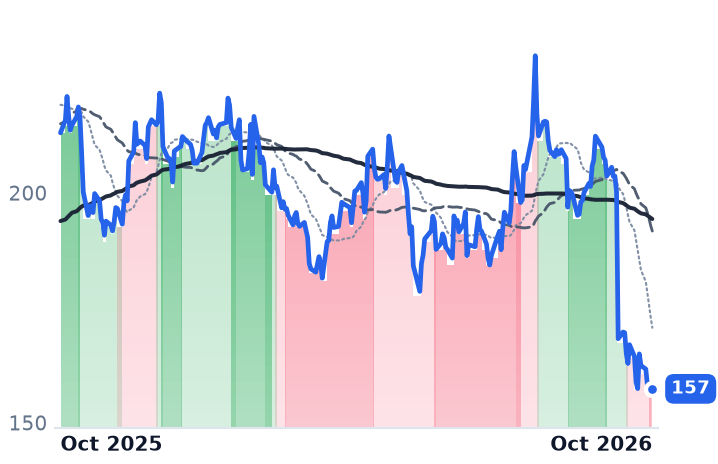
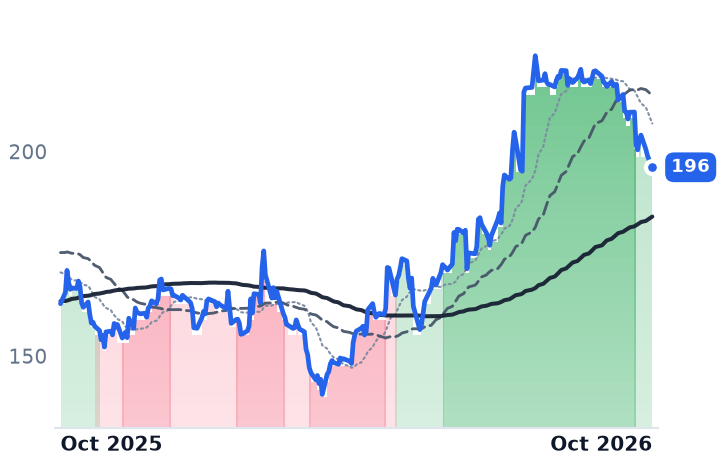
Perrigo rose 44.7% in three months and is still down 33.1% over twelve. The turn is dated: second-quarter results on 5 August lifted the stock about 25% in one session. Core net sales in that quarter fell 3.1% and core organic sales 3.5%, and consensus now has full-year earnings per share at $2.20, down 21%, inside company guidance of $2.00 to $2.30 all-in.

What improved was the balance sheet and the plants. Perrigo sold its Dermacosmetics business for about $359m and applied the substantial majority to debt, leaving $400m of cash against $3.3bn of debt and net leverage at or slightly below four times adjusted EBITDA. Infant formula net sales reached $101m, up 23.1% on the timing of contract shipments and higher store-brand volume, with operating income about $16m better after a capacity reduction in Vermont and a favorable FDA audit. A self-help program is sized at $80m to $100m of savings. "We continued to execute our Three-S plan in the second quarter, strengthening areas of the business within our control, improving operational performance, streamlining our portfolio, and further reducing debt," interim chief executive Albert Manzone said on 5 August; he took the role on 8 June after his predecessor resigned over personal conduct the board found inconsistent with its code. Reviews of the Infant Formula and Oral Care businesses remain open.

The equity is priced accordingly: 6.85x forward earnings and 0.83x book, with the trailing multiple unusable after a $1.3bn goodwill write-off produced a reported loss for 2025.

Two ways to be paid on the same aisle

Haleon's half explains none of its share price, which sits near the bottom of its own year. Perrigo's share price explains none of its half: sales, gross margin and consensus earnings all went the wrong way while the stock rose by nearly half. The cause of the split is who owns the brand. Haleon keeps the premium as long as it keeps paying for the advertising, so category contraction reaches it as mix and productivity. Perrigo is paid a manufacturing margin by the retailer who owns the label, so the same contraction reaches it as destocking and idle plant, and what equity holders keep is decided by leverage and portfolio sales. A third large owner of over-the-counter brands offers no read on either: Kenvue's shares track the Kimberly-Clark acquisition approved by both shareholder bases on 29 January, not the aisle.

Trade-down has not reversed. Store brands are still taking units while branded share also rises, which is arithmetic only a shrinking category permits. Haleon's third-quarter trading statement is due 29 October and Perrigo reports on 4 November. Until the unit base stops falling, Haleon's extra margin has to come out of its own cost base and Perrigo's out of its debt.
Dominion Pays 100% of Its Offshore-Wind Costs Above $11.3bn, and the Estimate Is $11.7bn

Hypothesis Opus 5 · Research Opus 5 · Writing Opus 5 · Prompt v1.7

The listed utility most often described as a claim on Northern Virginia's data centers had its reported earnings moved this year by a wind farm's cost ceiling and a regulator's order, while its share price stopped being its own in May.

Virginia's State Corporation Commission found Dominion earned 7.77% on equity across 2023-24 against a 9.70% authorized return. Its Coastal Virginia Offshore Wind estimate has since reached $11.7bn, past the $11.3bn line above which customers contribute nothing and shareholders carry every dollar. Of 53 GW of data-center capacity in various stages of contracting, roughly 12 GW sits under signed service agreements.

The business did not deteriorate at any of the three. Dominion's decline is the acquirer's; Entergy's growth is going into its share count; PG&E, below the book value of its own equity, is the one whose allowed return is genuinely in doubt.
DETRPCGNEECEGVSTTLNNRGDUKSOAEPPEGCCJMSFTGOOGLAMZNMETAOffshore Wind Cost OverrunsData-Center Load GrowthAllowed Return On EquityRate-Base Capital SpendingLarge-Load TariffsUtility Equity Dilution
TickerCompanySegmentTrend · 13mo30D1Y
The subject · what this brief is about
DDominion EnergyVertically Integrated Utilities🟢 Cont. Bull−5.1%+3.3%
ETREntergyVertically Integrated Utilities⚠️ Emerging Bear−3.3%+9.3%
PCGPG&EVertically Integrated Utilities⚠️ Emerging Bear−8.1%−16.7%
Compared against · context, not the story
NEENextEra EnergyVertically Integrated Utilities🔴 Cont. Bear−6.0%−5.9%
CEGConstellation EnergyDiversified Renewable Generators🔴 Cont. Bear+4.0%−18.9%
VSTVistraIntegrated Retail & Generation🔴 Cont. Bear+9.8%−17.7%
TLNTalen EnergyWholesale Power Producers⚠️ Emerging Bear+21.2%−8.3%
NRGNRG EnergyIntegrated Retail & Generation🔴 Cont. Bear−3.3%−32.3%
DUKDuke EnergyVertically Integrated Utilities⚠️ Emerging Bear−2.4%−6.6%
SOThe SouthernVertically Integrated Utilities⚠️ Emerging Bear−2.0%−10.9%
AEPAmerican Electric PowerVertically Integrated Utilities⚠️ Emerging Bear−0.7%+6.6%
PEGPublic Service Enterprise Group IncorporatedVertically Integrated Utilities🔴 Cont. Bear−0.2%−8.9%
CCJCamecoUranium🔴 Cont. Bear−9.6%+1.8%
MSFTMicrosoftCloud Infrastructure & Platforms🌱 Emerging Bull+8.6%+5.2%
GOOGLAlphabetSearch & Advertising⚠️ Emerging Bear+6.4%+48.6%
AMZNAmazon.comOnline Marketplaces🟢 Cont. Bull+4.1%+21.3%
METAMeta PlatformsSocial Media & Messaging🔴 Cont. Bear+11.5%+2.1%

12-month price & trend

D
Dominion Energy
61.64
+0.33 (+0.55%)
vs. prior close
Price20d50d150d
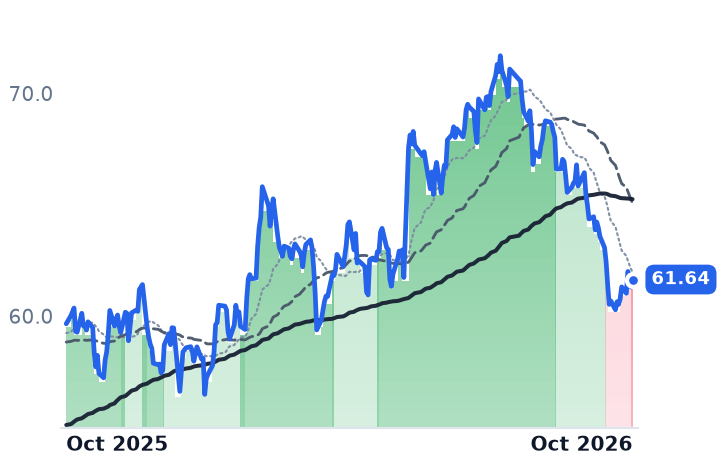
D 12-month price
Vertically Integrated Utilities
ETR
Entergy
103
+0.50 (+0.49%)
vs. prior close
Price20d50d150d
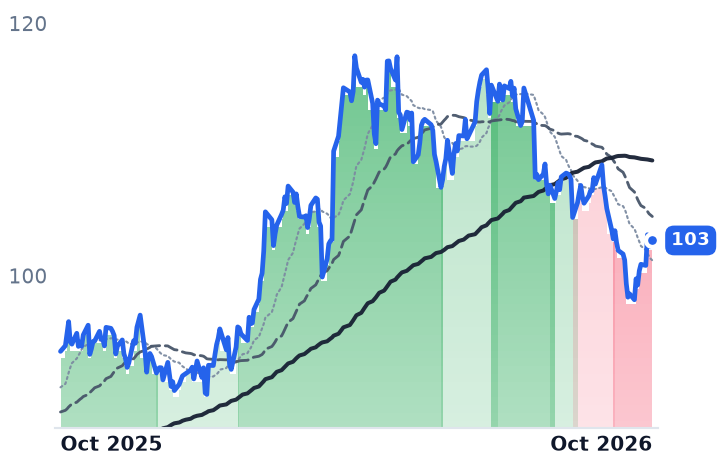
ETR 12-month price
Vertically Integrated Utilities
PCG
PG&E
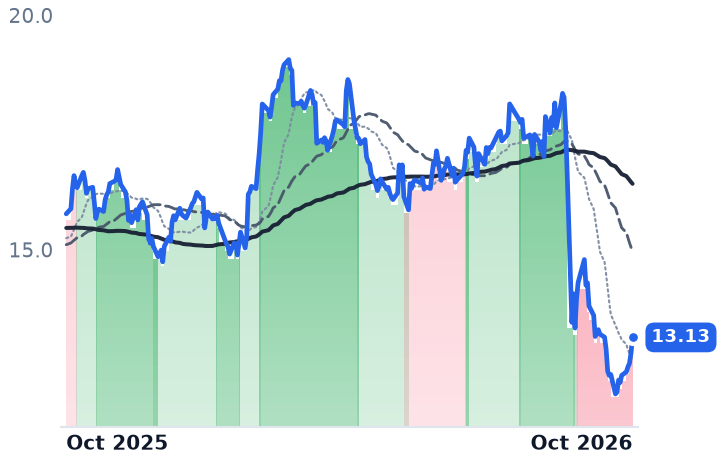
13.13
+0.34 (+2.62%)
vs. prior close
Price20d50d150d
PCG 12-month price
Vertically Integrated Utilities
TickerMkt capP/EP/E fwdP/SP/S fwdP/GPP/GP fwdEV/EBITDAFCF yld
D$54.2B21.3x17.2x3.0x2.9x6.0x6.0x14.0x-12.6%
ETR$48.0B26.0x23.4x3.6x3.4x9.1x8.8x13.8x-6.6%
PCG$35.2B9.5x7.9x1.4x1.3x2.4x2.4x9.0x-12.1%
NEE
NextEra Energy
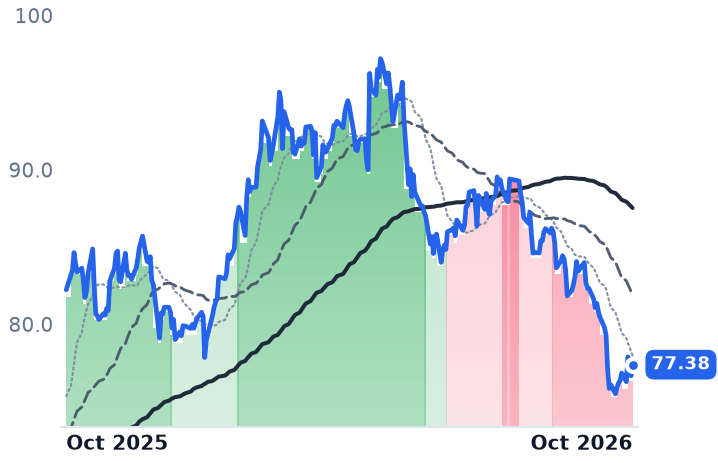
77.38
+0.72 (+0.94%)
vs. prior close
Price20d50d150d
NEE 12-month price
Vertically Integrated Utilities
CEG
Constellation Energy
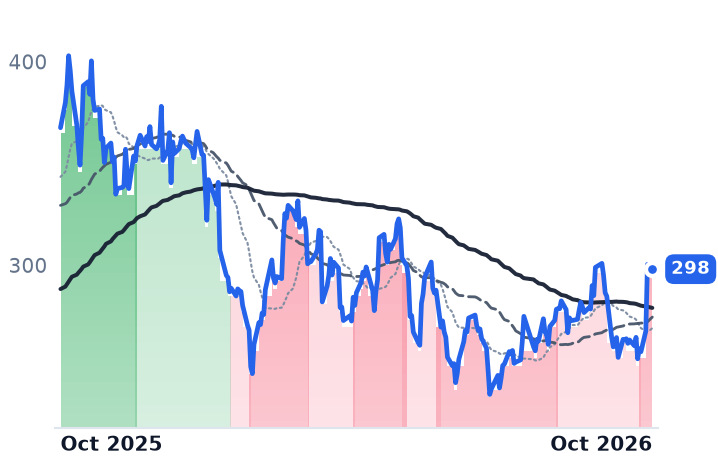
298
−2.07 (−0.69%)
vs. prior close
Price20d50d150d
CEG 12-month price
Diversified Renewable Generators
VST
Vistra
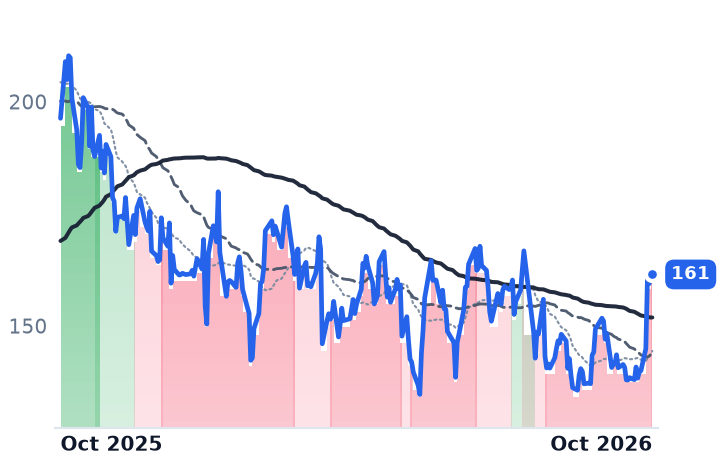
161
+1.15 (+0.72%)
vs. prior close
Price20d50d150d
VST 12-month price
Integrated Retail & Generation
TickerMkt capP/EP/E fwdP/SP/S fwdP/GPP/GP fwdEV/EBITDAFCF yld
NEE$160.3B17.2x19.3x5.5x5.2x7.7x7.2x15.1x-6.3%
CEG$94.5B—21.8x—2.8x——13.9x0.3%
VST$46.7B—16.4x—2.1x——10.2x2.9%
TLN
Talen Energy
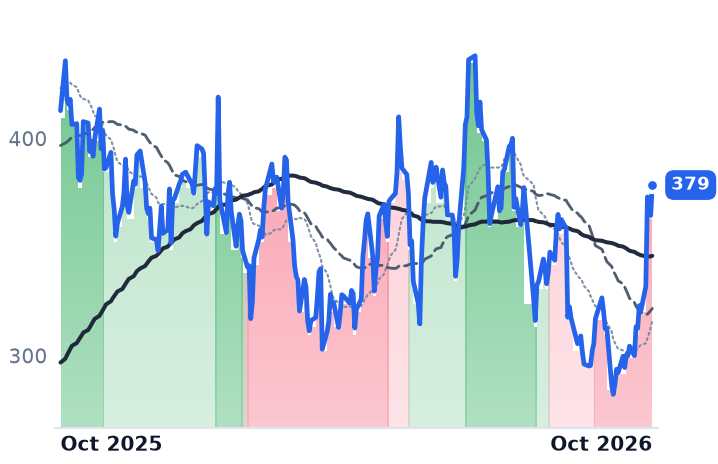
379
+14.00 (+3.84%)
vs. prior close
Price20d50d150d
TLN 12-month price
Wholesale Power Producers
NRG
NRG Energy
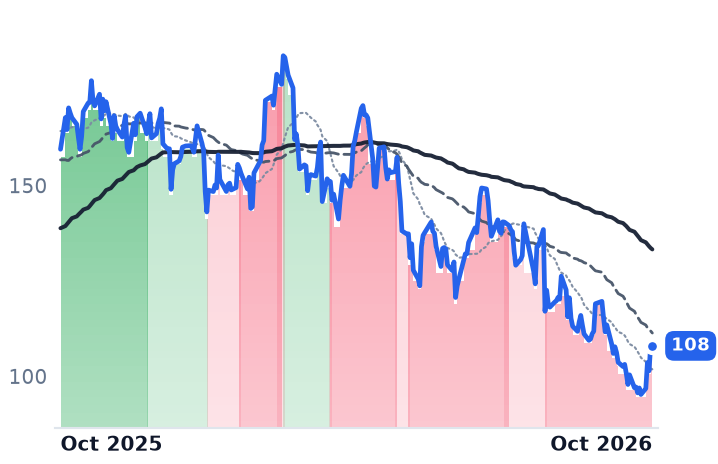
108
−0.24 (−0.22%)
vs. prior close
Price20d50d150d
NRG 12-month price
Integrated Retail & Generation
DUK
Duke Energy
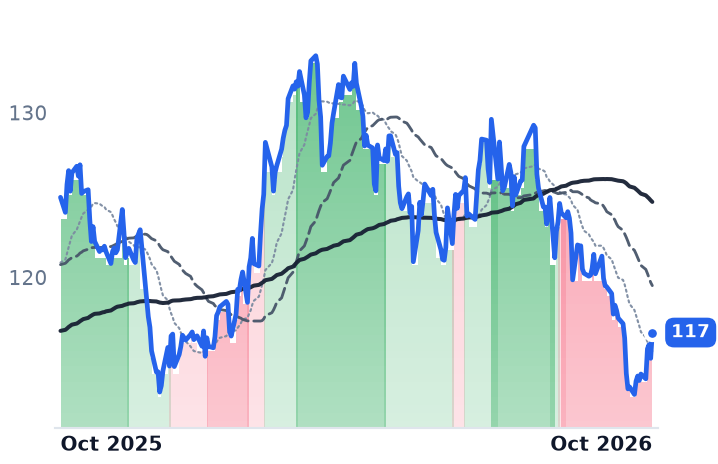
117
+1.57 (+1.36%)
vs. prior close
Price20d50d150d
DUK 12-month price
Vertically Integrated Utilities
TickerMkt capP/EP/E fwdP/SP/S fwdP/GPP/GP fwdEV/EBITDAFCF yld
TLN$13.8Bn/m14.8x3.9x3.1x8.8x7.0x29.2x3.7%
NRG$21.2B—11.3x—0.6x——10.5x1.6%
DUK$93.7B18.1x17.9x2.8x2.8x4.1x4.1x11.4x1.6%
SO
The Southern
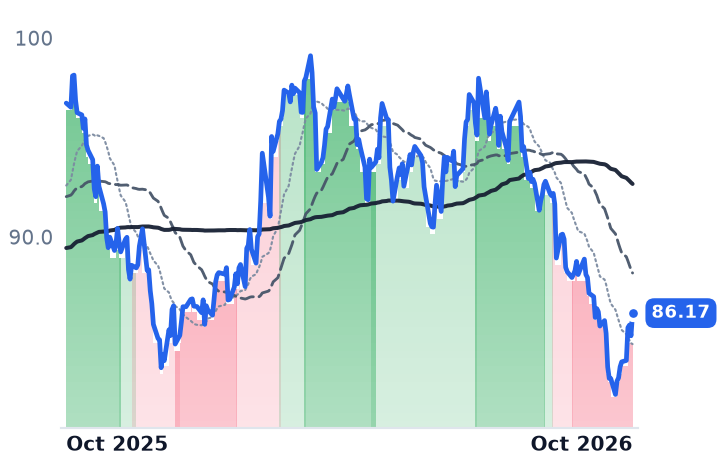
86.17
+1.14 (+1.34%)
vs. prior close
Price20d50d150d
SO 12-month price
Vertically Integrated Utilities
AEP
American Electric Power
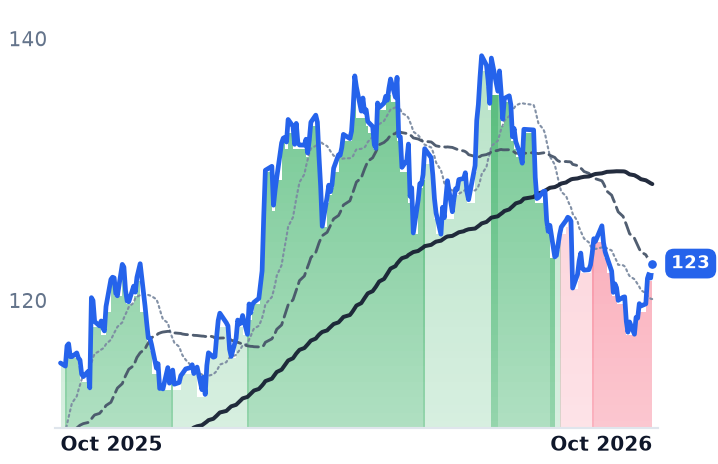
123
+1.10 (+0.91%)
vs. prior close
Price20d50d150d
AEP 12-month price
Vertically Integrated Utilities
PEG
Public Service Enterprise Group Incorporated
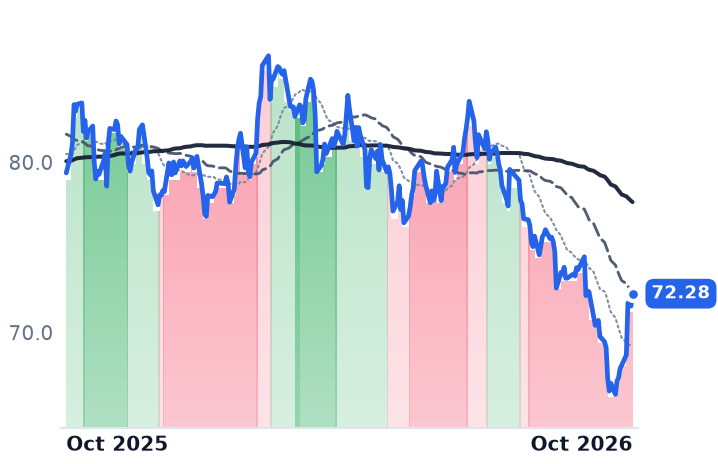
72.28
+0.72 (+1.01%)
vs. prior close
Price20d50d150d
PEG 12-month price
Vertically Integrated Utilities
TickerMkt capP/EP/E fwdP/SP/S fwdP/GPP/GP fwdEV/EBITDAFCF yld
SO$106.6B22.2x20.2x3.5x3.5x8.1x8.0x12.7x2.4%
AEP$65.1B20.5x18.7x2.9x2.8x5.9x5.7x13.7x13.8%
PEG$37.7B18.7x17.3x3.0x3.0x3.5x3.5x14.2x5.3%
CCJ
Cameco
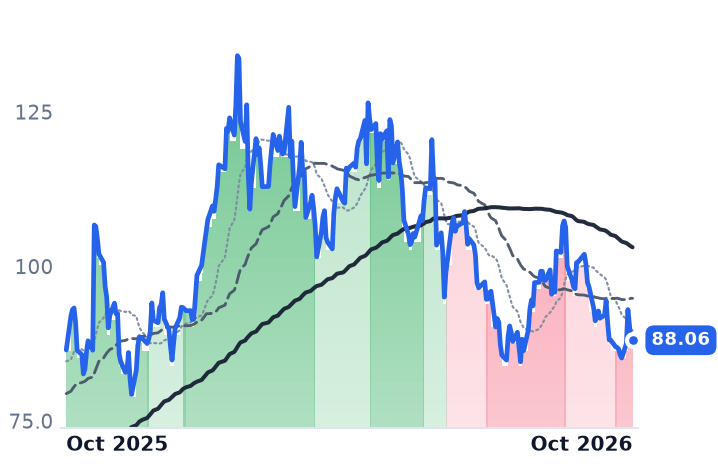
88.06
+0.02 (+0.02%)
vs. prior close
Price20d50d150d
CCJ 12-month price
Uranium
MSFT
Microsoft
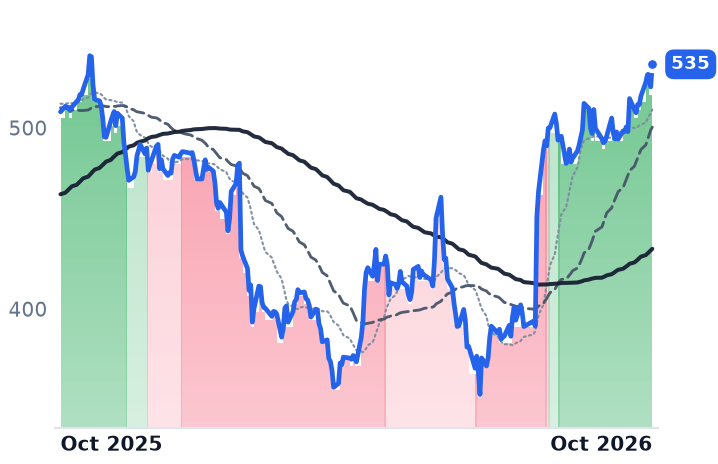
535
+12.46 (+2.38%)
vs. prior close
Price20d50d150d
MSFT 12-month price
Cloud Infrastructure & Platforms
GOOGL
Alphabet
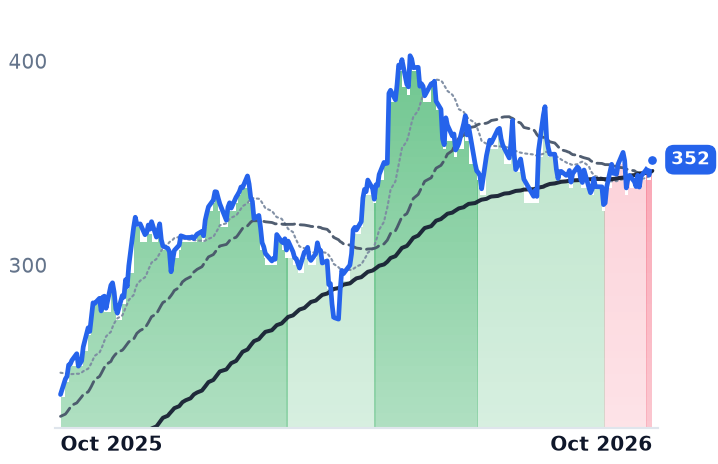
352
+0.00 (+0.00%)
vs. prior close
Price20d50d150d
GOOGL 12-month price
Search & Advertising
TickerMkt capP/EP/E fwdP/SP/S fwdP/GPP/GP fwdEV/EBITDAFCF yld
CCJ$37.1B148.5x57.8x15.2x10.7x55.2x38.7x61.2x1.0%
MSFT$3.8T28.6x26.1x11.5x9.8x17.0x14.4x19.0x1.7%
GOOGL$4.2T17.3x17.0x9.5x8.5x15.6x13.9x13.1x1.3%
AMZN
Amazon.com
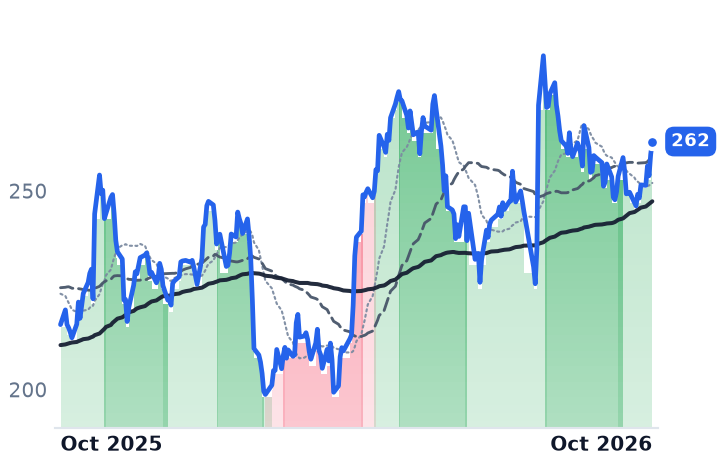
262
+3.23 (+1.25%)
vs. prior close
Price20d50d150d
AMZN 12-month price
Online Marketplaces
META
Meta Platforms
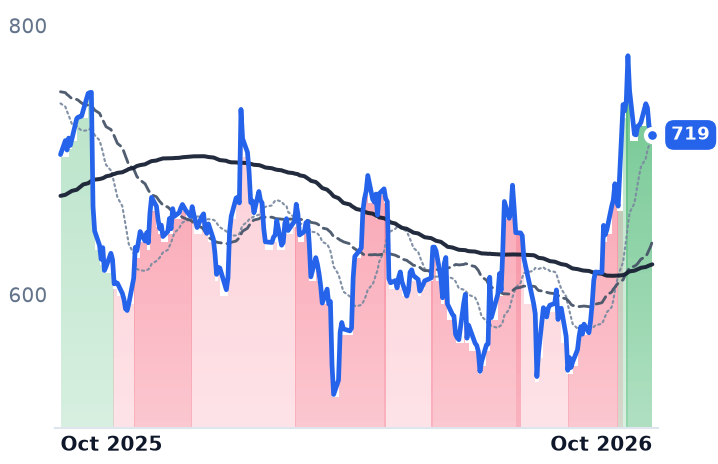
719
−2.22 (−0.31%)
vs. prior close
Price20d50d150d
META 12-month price
Social Media & Messaging
TickerMkt capP/EP/E fwdP/SP/S fwdP/GPP/GP fwdEV/EBITDAFCF yld
AMZN$2.9T21.2x21.1x3.7x3.5x7.3x6.8x11.9x-0.4%
META$1.5T21.5x18.2x6.5x5.8x7.9x7.1x14.7x2.8%

Consensus projections

TickerFY2026EFY2027EFY2028E
DRevenue+14.4%+6.4%+6.1%
EPS+5.1%+6.3%+6.9%
ETRRevenue+8.6%+9.8%+9.8%
EPS+12.3%+16.1%+13.6%
PCGRevenue+2.5%+3.9%+3.7%
EPS+10.1%+8.7%+8.7%
NEERevenue+8.9%+9.7%+9.0%
EPS+7.5%+9.0%+8.6%
CEGRevenue+37.2%+2.5%+5.3%
EPS+28.9%+10.4%+26.4%
VSTRevenue+16.6%+10.0%+5.1%
EPS+77.0%+19.7%+18.7%
TLNRevenue+84.0%+16.0%+4.9%
EPS+247.2%+49.2%+17.7%
NRGRevenue+17.7%+0.8%+3.7%
EPS+14.0%+24.5%+15.8%
DUKRevenue+5.8%+4.6%+4.2%
EPS+6.3%+6.9%+7.0%
SORevenue+7.7%+5.5%+6.1%
EPS+6.8%+7.5%+9.2%
AEPRevenue+9.4%+5.9%+7.6%
EPS+8.0%+7.5%+10.6%
PEGRevenue+6.5%+3.5%+4.9%
EPS+8.1%+7.0%+7.7%
CCJRevenue+1.4%+12.3%+8.3%
EPS+2.6%+71.9%+24.2%
MSFTRevenue+18.0%+18.6%+19.5%
EPS+26.7%+16.0%+19.0%
GOOGLRevenue+24.3%+22.9%+19.1%
EPS+93.4%−26.6%+18.2%
AMZNRevenue+15.9%+14.6%+16.0%
EPS+76.8%−16.1%+30.8%
METARevenue+27.3%+20.1%+17.8%
EPS+38.3%+6.9%+15.4%

Forward fiscal years only. Blank means no analyst coverage for that year.

Dominion Energy, the regulated utility that supplies Northern Virginia's data-center corridor along with electric and gas customers in the Carolinas, booked a $95m charge in the second quarter for offshore-wind construction costs it does not expect customers to pay. A charge like that moves reported earnings. Megawatts in a contracting pipeline do not.

That is the whole mechanism of a regulated utility dollar, and it runs against how these shares are held. A state commission sets a percentage return on the capital it has permitted the company to put in service; fuel and purchased power are passed through at cost. Load growth reaches the shareholder only once it becomes approved capital spending, and only after a rate case. Virginia has just priced that return, and the money went to a project that sits outside the usual recovery rules.

The commission sets the size of the earned dollar

The SCC found that Dominion Energy Virginia earned 7.77% on equity over the 2023-24 biennial period against a 9.70% authorization, leaving more than $350m of costs unrecovered. In its final order of 25 November 2025 the commission lifted the authorized return to 9.8%, against the 10.4% requested, and approved a base-rate increase of $565.7m for 2026 where the company had sought $822m. That is regulatory lag in arithmetic: a 193-basis-point shortfall between what the regulator allows and what the utility collected.

The company's $64.7bn 2026-2030 capital plan supports a projected Virginia rate-base growth rate of 11.9% a year, funded roughly 60% from internal cash with about a tenth each from hybrids and equity. Dominion's diluted share count rose 3.5% year on year to 882.1m in the quarter: the per-share price of that plan.

The band where customers stop paying

Under the cost-sharing settlement the Virginia commission approved in December 2022, disclosed in Dominion's annual report, the first $10.3bn of the 2.6 GW wind project is largely customer-funded, the next $1bn is split evenly, and everything from $11.3bn to $13.7bn is 100% shareholder-funded with no customer recovery at all. In July the company put the estimate at about $11.7bn, up $288m from April on network-upgrade costs, tariffs and turbine-installation revisions. Roughly $400m therefore sits in the zero-recovery band. The project is 81% complete with final turbine installation pushed to the end of 2027.

Second-quarter revenue rose 19.6% to $4.558bn while net income fell 55.3% to $340m, the gap being the charge rather than the operating business. Operating earnings came in at $0.79 a share and full-year guidance of $3.45-$3.69 was reaffirmed.

Pipeline, contract, collateral

Dominion reported 53 GW of data-center capacity in various stages of contracting, of which about 12 GW sits under signed electric service agreements, with more than 5 GW added since year-end. What converts the rest into an obligation is a tariff, not a queue: Virginia's new GS-5 class, effective 1 January 2027, applies to loads of 25 MW and up and requires a fixed 14-year contract, minimum demand charges covering 85% of contracted transmission and distribution capacity, and collateral of $1.5m per MW from customers failing credit tests.

One Dominion reactor escapes this machinery. Millstone sits outside the Virginia rate base and must be recontracted; the company bid three offers into Connecticut's solicitation for terms beginning October 2029, naming a well-capitalized counterparty such as a data-center operator as the way to underwrite relicensing. There, a power contract would land in revenue.

Why the shares fell, name by name

Dominion's price has not been its own since 18 May, when NextEra agreed to acquire it in an all-stock deal valued near $67bn at a fixed 0.8138 shares, unadjusted for market moves. At the 9 October close Dominion sat 2.1% under deal value, the same discount it carried a month and three months earlier, and its three-month decline of 12.1% matches NextEra's 12.0%. Virginia's commission has set public hearings and an evidentiary hearing from 17 November, with a decision expected in January, and Governor Abigail Spanberger has called herself deeply skeptical. All eight regulated names on this shelf fell over three months, a mean of 11.9%, as the utility sector sold off into a 10-year Treasury paying above 5.20% against a sector yield near 3.05%.

Entergy, which serves 3 million customers across Arkansas, Louisiana, Mississippi and Texas, shows the funding cost directly. Revenue rose 5.9% and net income 3.4%, yet diluted earnings slipped to $1.03 from $1.05 because the share count grew 4.6%; management widened the 2026 dilution drag to $0.20-$0.25 a share while raising outer-year guidance and targeting better than 8% earnings growth through 2030. Its Louisiana formula rate plan holds the allowed return at 9.7% within a 40-basis-point band, per its quarterly filing, and chief executive Drew Marsh told analysts on 29 July: "Yeah, I think that we have a long history of extending Formula Rate Plans within Louisiana. Our expectation is that we would probably be able to extend." The $12.9bn of generation for Meta's Hyperion campus went to an evidentiary hearing in early October with a December decision targeted; none of it earns until approved. At 23.4x forward against 26.0x trailing, Entergy is the dearest of these three on earnings, down from roughly 26x forward in May.

PG&E is the stress case. Operating income rose 15.2% and quarterly earnings reached $0.33 a share against $0.24, yet the stock trades at 0.85x book against Dominion's 1.87x, because California's amended wildfire bill left the liability protections out and the shares lost roughly a fifth in one session. The company cut 2027 capital spending to $11.4bn from $13.4bn and stopped giving plans beyond that year. "We have concluded that PG&E cannot simply wait for the policy framework to change," chief executive Patti Poppe told investors on 2 September. "We must take action now to sustainably serve our customers." Its reactor earns nothing extra for being a reactor: the CPUC approved about $382m of Diablo Canyon operating costs as a pass-through.

What the results account for, and what they do not

None of the three reported a worse business. Guidance was reaffirmed at Dominion, raised at Entergy, and PG&E's margins improved. The decline is a cost-of-capital event with three separate local causes: Dominion's is imported from its acquirer by contract; Entergy's growth is being absorbed by the equity that funds it; PG&E's is a question about whether it will be permitted to earn its authorized return at all. Only the first is arithmetic a reader can reproduce.

The contrast that makes the structure visible is the merchant fleet. When Constellation signed a 20-year, 890 MW agreement with Google on 6 October, the price went into its revenue line. The same demand reaching a regulated utility arrives as capital to be approved, depreciated and recovered, at a percentage a commission chooses, after a case.

Which is why the number to watch in Virginia is not a gigawatt figure. Every further dollar spent on those turbines, all the way to $13.7bn, belongs to the shareholders.

Washington's Record Biofuel Mandate Widened the Soybean Spread That Pays ADM and Bunge

Hypothesis Opus 5 · Research Opus 5 · Writing Opus 5 · Prompt v1.7

Two crop processors have raised their 2026 earnings forecasts twice this year while their shares went the other way, and the money is arriving from a federal fuel rule. Archer-Daniels-Midland now guides to $5.15-$5.60 of adjusted earnings per share, up from $3.60-$4.25 in January; Bunge has lifted its range to $9.25-$9.75.

Neither is paid a crop price. Both earn a hedged spread between what a soybean costs and what the meal and oil fetch, and that spread widened after the Environmental Protection Agency set the highest renewable fuel volumes in the program's history.

Bunge is the more exposed of the two: processing delivered 88% of its second-quarter segment earnings, and it trades at 10.9x forward earnings. ADM has held its uptrend. What a rule gives, an October rulemaking on refinery exemptions can take back.

ADMBGAGROSPYDECTVAMOSNTRCFFMCGPREANDEDARLWRenewable Fuel StandardSoybean Crush MarginsOilseed ProcessingRenewable Diesel CapacityGrain MerchandisingCommodity Hedging
TickerCompanySegmentTrend · 13mo30D1Y
The subject · what this brief is about
ADMArcher-Daniels-MidlandCommodity Trading & Processing🟢 Cont. Bull−7.9%+33.4%
BGBunge GlobalCommodity Trading & Processing🔴 Cont. Bear−18.1%+28.9%
AGROAdecoagroCommodity Trading & Processing🔴 Cont. Bear−19.2%+36.8%
Compared against · context, not the story
SPYState Street SPDR S&P 500 ETF TrustAsset Management🟢 Cont. Bull+2.7%+19.9%
DEDeereAgricultural Tractors & Equipment🟢 Cont. Bull−8.1%+40.0%
CTVACortevaIntegrated Seeds & Crop Protection🟢 Cont. Bull−84.5%−78.5%
MOSThe MosaicPhosphate & Potash🔴 Cont. Bear−27.7%−37.2%
NTRNutrienFertilizer Distribution & Retail🟢 Cont. Bull−15.4%+13.6%
CFCF IndustriesNitrogen Fertilizers🟢 Cont. Bull−17.4%+29.2%
FMCFMCCrop Protection Chemicals🔴 Cont. Bear−31.2%−71.0%
GPREGreen PlainsBiofuels & Renewables⚠️ Emerging Bear−7.4%+57.9%
ANDEThe AndersonsAgricultural Commodities⚠️ Emerging Bear−10.4%+56.8%
DARDarling IngredientsSpecialty Ingredients & Co-Products🟢 Cont. Bull−9.2%+100.2%
LWLamb WestonFrozen & Prepared Foods🟢 Cont. Bull+0.6%−23.2%

12-month price & trend

ADM
Archer-Daniels-Midland
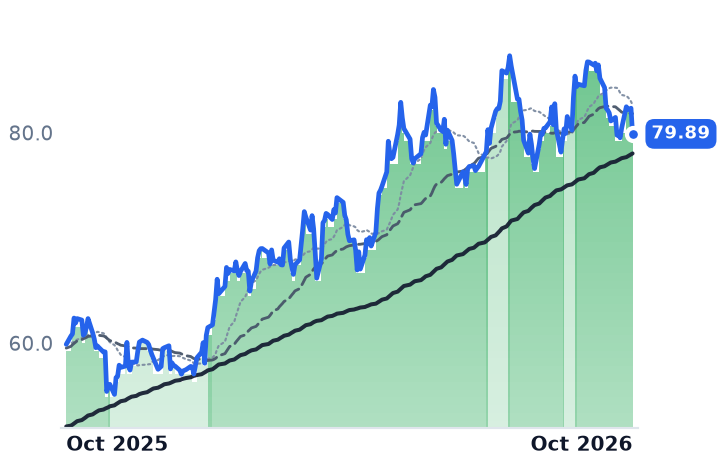
79.89
−2.44 (−2.96%)
vs. prior close
Price20d50d150d
ADM 12-month price
Commodity Trading & Processing
BG
Bunge Global
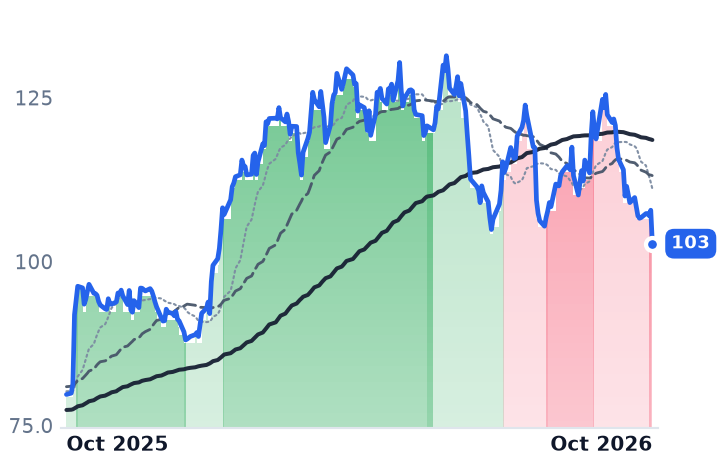
103
−5.10 (−4.73%)
vs. prior close
Price20d50d150d
BG 12-month price
Commodity Trading & Processing
AGRO
Adecoagro
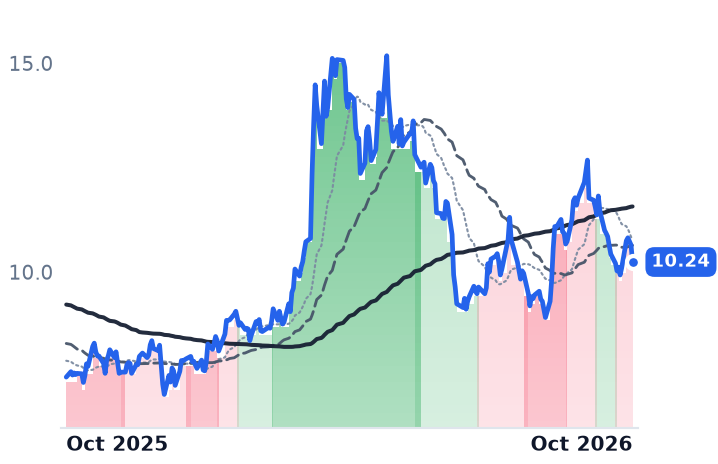
10.24
−0.41 (−3.85%)
vs. prior close
Price20d50d150d
AGRO 12-month price
Commodity Trading & Processing
TickerMkt capP/EP/E fwdP/SP/S fwdP/GPP/GP fwdEV/EBITDAFCF yld
ADM$38.5B21.9x14.6x0.5x0.4x6.8x6.4x10.0x4.4%
BG$19.7B19.9x10.9x0.2x0.2x4.3x4.3x12.0x-3.6%
AGRO$5.8B157.5x6.8x3.5x2.6x11.7x8.7x12.8x0.8%
SPY
State Street SPDR S&P 500 ETF Trust
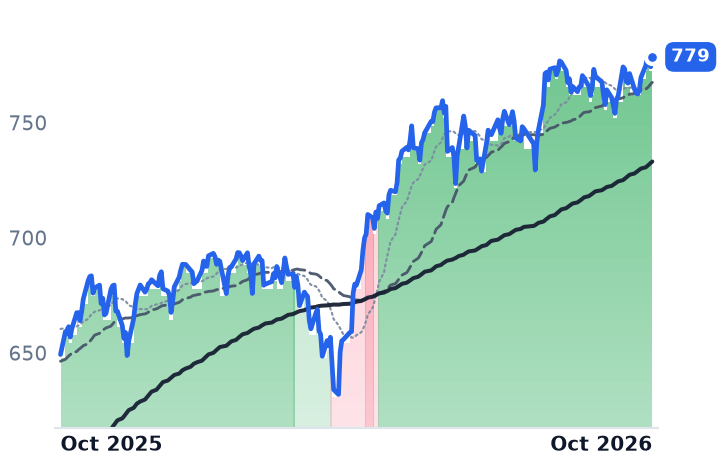
779
+4.28 (+0.55%)
vs. prior close
Price20d50d150d
SPY 12-month price
Asset Management
DE
Deere
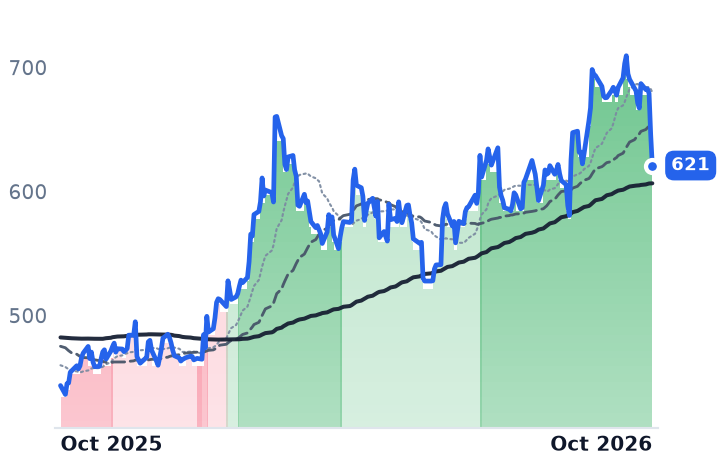
621
−24.96 (−3.86%)
vs. prior close
Price20d50d150d
DE 12-month price
Agricultural Tractors & Equipment
CTVA
Corteva
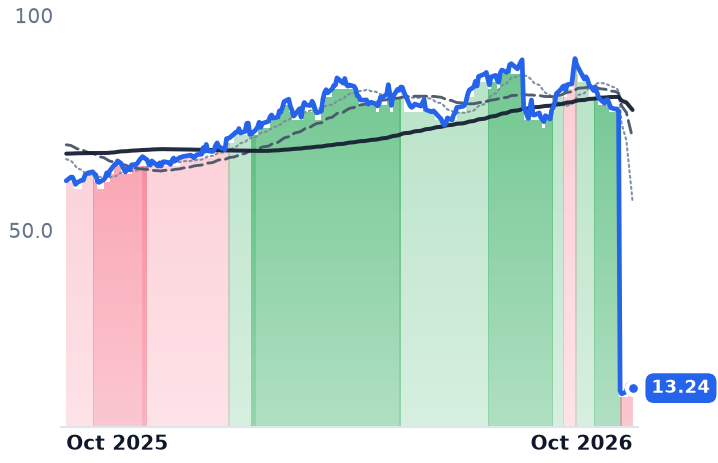
13.24
−0.94 (−6.60%)
vs. prior close
Price20d50d150d
CTVA 12-month price
Integrated Seeds & Crop Protection
TickerMkt capP/EP/E fwdP/SP/S fwdP/GPP/GP fwdEV/EBITDAFCF yld
SPY$773.0B————————
DE$151.8B31.5x31.4x3.3x3.7x9.3x10.3x18.0x2.4%
CTVA$55.0B47.6x22.0x3.1x3.0x6.6x6.4x16.5x3.7%
MOS
The Mosaic
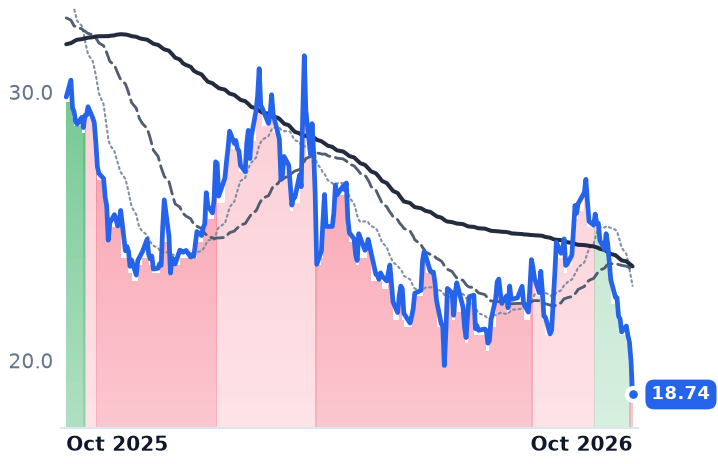
18.74
−1.25 (−6.23%)
vs. prior close
Price20d50d150d
MOS 12-month price
Phosphate & Potash
NTR
Nutrien
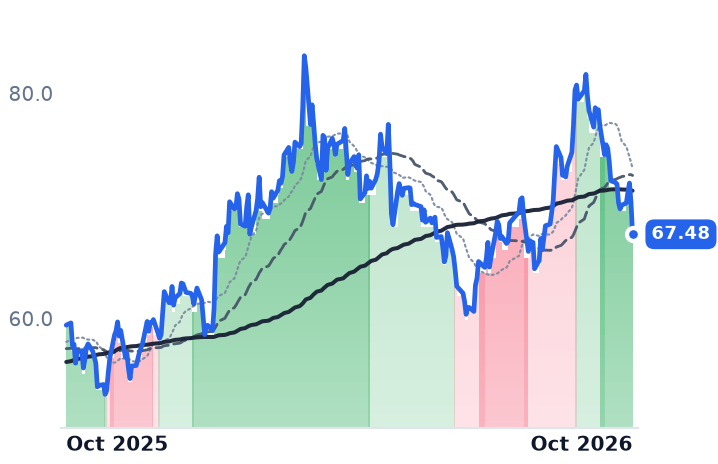
67.48
−2.85 (−4.06%)
vs. prior close
Price20d50d150d
NTR 12-month price
Fertilizer Distribution & Retail
CF
CF Industries
112
−2.91 (−2.54%)
vs. prior close
Price20d50d150d
CF 12-month price
Nitrogen Fertilizers
TickerMkt capP/EP/E fwdP/SP/S fwdP/GPP/GP fwdEV/EBITDAFCF yld
MOS$6.9B9.5x18.4x0.6x0.5x4.1x3.9x4.0x-7.1%
NTR$37.0B15.6x15.6x1.3x1.3x4.2x4.3x7.7x5.7%
CF$19.6B9.4x8.5x2.5x2.4x6.0x5.7x5.3x9.7%
FMC
FMC
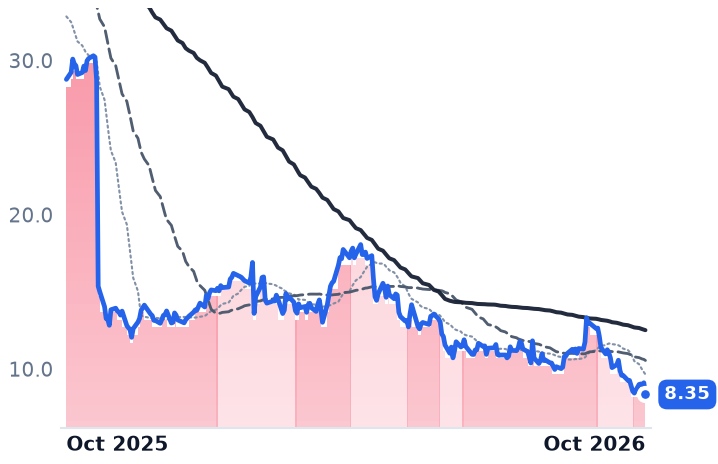
8.35
−0.76 (−8.34%)
vs. prior close
Price20d50d150d
FMC 12-month price
Crop Protection Chemicals
GPRE
Green Plains
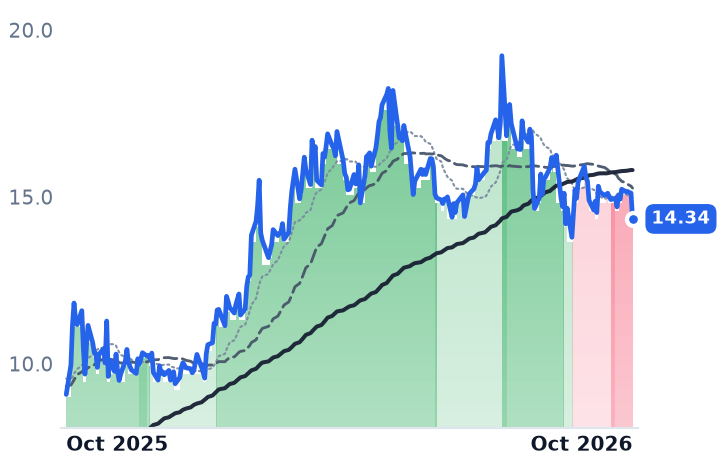
14.34
−0.77 (−5.13%)
vs. prior close
Price20d50d150d
GPRE 12-month price
Biofuels & Renewables
ANDE
The Andersons
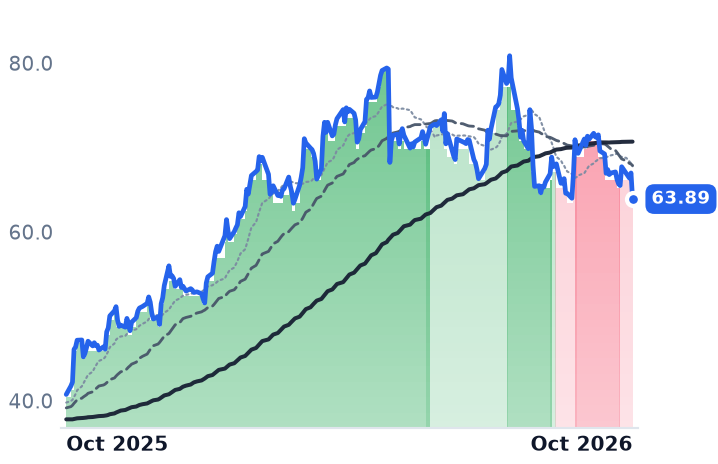
63.89
−3.09 (−4.61%)
vs. prior close
Price20d50d150d
ANDE 12-month price
Agricultural Commodities
TickerMkt capP/EP/E fwdP/SP/S fwdP/GPP/GP fwdEV/EBITDAFCF yld
FMC$1.3Bn/m7.7x0.4x0.4x1.1x1.0xn/m12.8%
GPRE$1.2Bn/m13.9x0.6x0.5x10.6x8.9x10.3x7.5%
ANDE$2.4B18.9x13.5x0.2x0.2x3.1x2.9x9.7x-4.3%
DAR
Darling Ingredients
60.26
−1.99 (−3.20%)
vs. prior close
Price20d50d150d
DAR 12-month price
Specialty Ingredients & Co-Products
LW
Lamb Weston
47.87
−0.73 (−1.50%)
vs. prior close
Price20d50d150d
LW 12-month price
Frozen & Prepared Foods
TickerMkt capP/EP/E fwdP/SP/S fwdP/GPP/GP fwdEV/EBITDAFCF yld
DAR$10.7B17.9x10.6x1.6x1.6x6.5x6.3x9.9x8.2%
LW$6.5B22.5x15.6x1.0x1.0x4.8x4.9x10.6x9.8%

Consensus projections

TickerFY2026EFY2027EFY2028E
ADMRevenue+5.2%+5.7%+5.3%
EPS+61.7%+7.7%−0.9%
BGRevenue+35.6%+2.8%−0.3%
EPS+28.3%+17.4%+8.9%
AGRORevenue+62.6%+3.1%+0.5%
EPS+467.1%−21.4%−1.4%
DERevenue+7.8%+9.5%+9.7%
EPS−3.0%+28.7%+22.8%
CTVARevenue+3.3%+3.4%+2.7%
EPS+11.9%+10.2%+11.5%
MOSRevenue+7.5%−0.7%−1.2%
EPS−53.0%+65.0%+1.6%
NTRRevenue+5.2%−1.3%−1.1%
EPS+6.8%−0.3%−8.0%
CFRevenue+16.5%−10.6%−5.0%
EPS+68.3%−27.7%−20.0%
FMCRevenue−8.7%+4.3%+4.2%
EPS−55.0%+24.4%+22.1%
GPRERevenue+3.4%+5.4%+47.9%
EPS−162.6%−4.9%+146.0%
ANDERevenue−0.1%+3.3%—
EPS+122.4%+12.4%—
DARRevenue+3.6%+14.5%+4.1%
EPS−68.8%+1308.0%−7.4%
LWRevenue+2.7%−0.4%+1.6%
EPS−10.9%+9.0%+11.5%

Forward fiscal years only. Blank means no analyst coverage for that year.

Archer-Daniels-Midland, which buys oilseeds, corn and wheat and sells the oil, meal, sweeteners, starches and ethanol made from them, has raised its 2026 profit forecast twice this year, and the cause is a federal fuel rule rather than anything a food customer ordered. The company entered the year guiding $3.60 to $4.25 of adjusted earnings per share, lifted the range in May after the Environmental Protection Agency finalized renewable fuel volumes, and in August took it to $5.15 to $5.60, a 24% increase at the midpoint in one quarter.

The agricultural complex is nonetheless traded as though crop prices were these companies' revenue. On 9 October a Department of Agriculture report raising corn yield and production forecasts plunged corn futures and sold the sector: Corteva fell 6.6%, Mosaic 6.2%, Bunge 4.7% and ADM 3.0%, on a day an S&P 500 tracking fund rose 0.55%. What a processor actually collects is the spread between the bean and the products made from it, hedged on the futures board weeks before the plant runs.

The quarter's profit was set before the plants ran

ADM's crushing business lost $79m at the operating line in the first quarter of 2026 against a $47m profit a year earlier. The quarter carried roughly $275m of net negative mark-to-market and timing charges, about 70% of it in crushing, booked because the commodity environment strengthened on clarity about US biofuels policy. One quarter later the same subsegment earned $363m, helped by about $100m of net positive timing — a $442m swing while revenue moved roughly 11% sequentially. Second-quarter group revenue of $22.68bn was up 7.0% year on year; operating income rose 796% to $896m.

Hedging is why the two quarters look unrelated. On the 4 August call Chief Executive Juan Luciano said North American crushing was about 90% covered for the third quarter and 30% for the fourth, with global coverage near 70% for the third.

Most of a quarter's margin is bought before the quarter exists.

Washington buys the oil

The EPA's Set 2 rule put 2026 and 2027 volumes at the highest levels in the program's history, with the agency estimating that biodiesel and renewable diesel output must rise more than 60% from 2025. Soybean oil is more than a third of the feedstock those US plants consume, and domestic renewable diesel capacity has gone from 791 million gallons a year in 2021 to about 4,580 million now. ADM's oilseeds segment profit rose 129% in the second quarter, which the company credited to demand created by the obligation and higher global energy prices, with crush volumes up nearly 5%.

The corn slab answers to different arithmetic. Carbohydrate Solutions, ADM's sweetener, starch and ethanol business, earned $411m, up 22%, with ethanol profit up 158% to $85m — and ADM credited lower US corn prices for giving ethanol an edge over competing blendstocks. The report that sold the shares on 9 October cheapens that input.

Bunge is the more processing-levered of the two

Bunge, which absorbed Viterra's grain handling and export network in July 2025, is commonly read as the diversified one. Its second quarter says otherwise: soybean and softseed processing delivered $700m of $796m of adjusted segment earnings before interest and tax, or 88%, against $67m from grain merchandising and milling. The Viterra cost-synergy target went to about $350m from $250m, adjusted leverage stood at 1.9x, and full-year guidance moved to $9.25 to $9.75. "Our team delivered another strong quarter, navigating a complex global environment with agility, focus and disciplined execution," Chief Executive Greg Heckman said on 29 July.

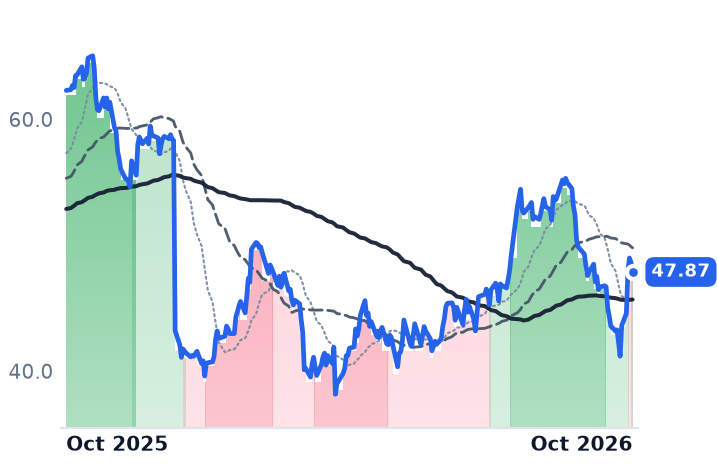
The shares have fallen 18.1% from their 10 September close, which is also the day UBS cut its target to $115 from $145 on valuation while keeping a buy rating. Bunge now trades at 10.9x forward earnings against 19.9x trailing, a wider gap than ADM's, and trailing free cash flow is negative 3.6% of market value on the working capital Viterra brought with it. ADM has held its uptrend through the period, is 31.3% higher over twelve months, and sits at 14.6x forward earnings against 21.9x trailing.

What an October rulemaking decides

The results do not explain the fall; the fragility of their cause does. On 1 September the EPA granted 29 small refinery exemptions covering 1.76 billion renewable credits, some 770 million more than it had projected, and pledged to propose reallocating all of it into the 2026 and 2027 obligations before the end of October. The notice itself omitted the reallocation, and no rule had appeared by 9 October. On the American Soybean Association's arithmetic, roughly 500 million gallons of biomass-based diesel demand hangs on it.

A spread this wide also calls out supply. 114 million bushels of new US crush capacity is slated for 2026 after 75 million in 2025, and ADM's own four-plant brownfield program adds about 700,000 tonnes of annual capacity between mid-2028 and early 2029.

Luciano called that program a "phased approach to allow for offramps." It is an odd way to describe building into the best margins the industry has seen, and an honest one: the demand was legislated, and what a rule gives it can withdraw at the next comment period.

Gathering Maintenance Will Push DT Midstream's Third-Quarter Profit Below the Second's

Hypothesis Opus 5 · Research Opus 5 · Writing Opus 5 · Prompt v1.7

A gas-infrastructure company whose contracts are supposed to make quarters boring just told investors the next one steps down, and four banks trimmed their targets without touching a rating. The cause sits in the one segment nobody buys the shelf for.

Roughly 70% of DT Midstream's revenue comes from the Pipeline segment on long-term take-or-pay terms with minimum volume commitments. Gathering is paid for molecules actually handled, and planned maintenance plus Northeast producer timing is where revenue growth halved, from +27.3% in the December 2025 quarter to +11.0% in June. Consensus now carries 2026 operating profit of $788.1m, about 0.2% above 2025.

Kinder Morgan and Williams both accelerated last quarter and fell anyway. DT Midstream is the one of the three whose de-rating shows up in its own income statement.

DTMKMIWMBTRGPETTRPNatural Gas MidstreamTake-Or-Pay ContractsGas Gathering VolumesAppalachia & Haynesville SupplyFERC-Regulated PipelinesPipeline Capital Backlogs
TickerCompanySegmentTrend · 13mo30D1Y
The subject · what this brief is about
DTMDT MidstreamNatural Gas Pipelines & Transmission⚠️ Emerging Bear−4.8%+14.8%
KMIKinder MorganNatural Gas Pipelines & Transmission⚠️ Emerging Bear+4.3%+22.4%
WMBThe Williams CompaniesNatural Gas Pipelines & Transmission🟢 Cont. Bull−0.9%+17.9%
Compared against · context, not the story
TRGPTarga ResourcesNatural Gas Gathering & Processing🟢 Cont. Bull−1.6%+90.3%
ETEnergy TransferNatural Gas Pipelines & Transmission🟢 Cont. Bull−6.0%+30.2%
TRPTC EnergyNatural Gas Pipelines & Transmission⚠️ Emerging Bear−3.2%+14.9%

12-month price & trend

DTM
DT Midstream
124
+0.25 (+0.20%)
vs. prior close
Price20d50d150d
DTM 12-month price
Natural Gas Pipelines & Transmission
KMI
Kinder Morgan
32.49
+0.24 (+0.74%)
vs. prior close
Price20d50d150d
KMI 12-month price
Natural Gas Pipelines & Transmission
WMB
The Williams Companies
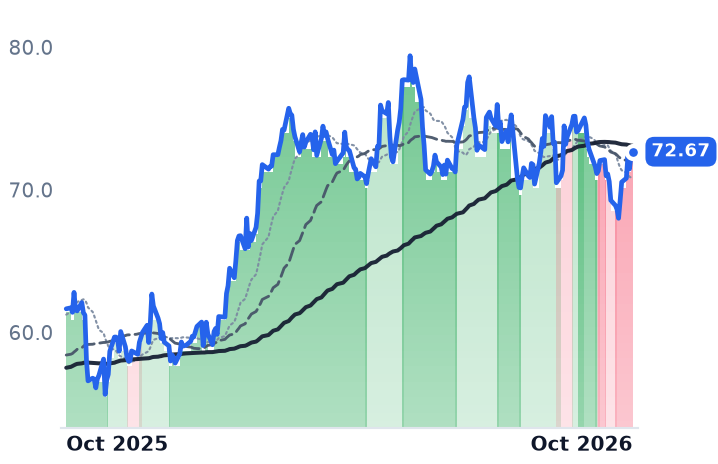
72.67
+0.33 (+0.46%)
vs. prior close
Price20d50d150d
WMB 12-month price
Natural Gas Pipelines & Transmission
TickerMkt capP/EP/E fwdP/SP/S fwdP/GPP/GP fwdEV/EBITDAFCF yld
DTM$12.7B27.0x26.5x9.7x9.4x15.3x14.8x14.5x3.8%
KMI$72.3B20.8x21.1x4.0x4.0x7.3x7.2x13.0x4.4%
WMB$88.9B28.8x29.6x7.3x7.2x9.9x9.8x15.5x-0.2%
TRGP
Targa Resources
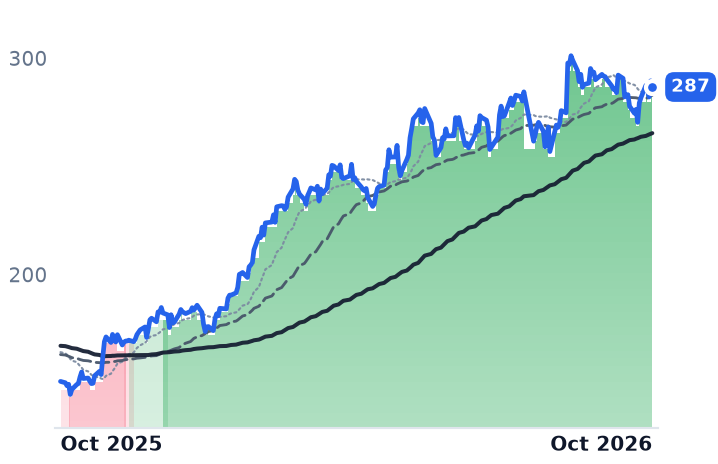
287
−2.84 (−0.98%)
vs. prior close
Price20d50d150d
TRGP 12-month price
Natural Gas Gathering & Processing
ET
Energy Transfer
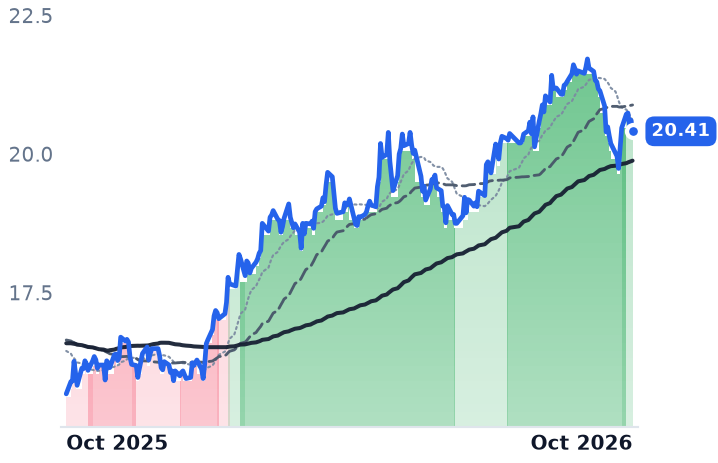
20.41
−0.20 (−0.97%)
vs. prior close
Price20d50d150d
ET 12-month price
Natural Gas Pipelines & Transmission
TRP
TC Energy
60.05
+0.31 (+0.53%)
vs. prior close
Price20d50d150d
TRP 12-month price
Natural Gas Pipelines & Transmission
TickerMkt capP/EP/E fwdP/SP/S fwdP/GPP/GP fwdEV/EBITDAFCF yld
TRGP$59.6B26.4x24.7x3.6x3.1x9.7x8.6x16.6x1.2%
ET$72.1B13.0x13.4x0.7x0.7x2.9x2.7x9.7x7.2%
TRP$66.2B26.6x16.9x5.8x4.1x11.2x8.0x13.8x4.4%

Consensus projections

TickerFY2026EFY2027EFY2028E
DTMRevenue+8.0%+4.6%+9.7%
EPS+6.7%+6.0%+10.4%
KMIRevenue+8.6%+1.6%+5.1%
EPS+19.7%−0.1%+8.9%
WMBRevenue+8.4%+14.4%+15.5%
EPS+15.8%+6.3%+16.8%
TRGPRevenue+11.6%+25.6%+13.5%
EPS+32.1%+9.4%+21.4%
ETRevenue+35.3%+1.9%+4.9%
EPS+16.7%+3.6%+7.4%
TRPRevenue+6.7%+4.4%+5.3%
EPS+7.3%+5.4%+6.2%

Forward fiscal years only. Blank means no analyst coverage for that year.

DT Midstream guided its September quarter below the June one, citing planned maintenance across its gathering network and lower Northeast volumes tied to producer timing, with Haynesville volumes flat at the record 2.2 billion cubic feet a day set in the second quarter. Between late September and 6 October four banks cut their price targets on the Detroit company without changing a rating: JPMorgan to $144 from $154, Jefferies to $145, Mizuho to $147 and Barclays to $142. Nothing in the contracted pipeline book changed.

That split is the whole point of owning this kind of asset, and it is why the de-rating landed here rather than on the shelf generally. A pipeline company sells capacity: the shipper pays a reservation charge for the right to move gas whether it moves any or not. Roughly 70% of DT Midstream's revenue is the Pipeline segment, on long-dated take-or-pay agreements with significant minimum volume commitments. Gathering — wellhead compression, dehydration, treatment — is paid per unit handled, and that is the segment a producer's deferred completions and a maintenance window can reach.

Where the growth halved

Revenue growth of 26.6% and 27.3% in the second half of 2025 became 10.9% and 11.0% in the two 2026 quarters. Net income growth fell further, from 52.1% in the December quarter to 4.7% in June. Consensus has absorbed it: average 2026 operating profit of $788.1m is 0.24% above the 2025 estimate, and earnings per share of $4.678 is 6.7% higher against 15.9% growth the year before. UBS models September-quarter EBITDA of $292m against $305m in the June quarter, ahead of the 29 October report.

The re-contracting that is supposed to fix this is also the exposure. NEXUS, about 1.4 billion cubic feet a day, is "effectively fully contracted today, with some shorter-term contracts that roll every couple of years," chief executive David Slater told investors on 30 July, leaving it "in an enviable position as one of the only pipelines with available capacity out of the Appalachia Basin that's available to be contracted for longer term." The company has commercialized 60% of a $3.4bn organic backlog, more than 80% of it pipeline work, with committed capital near $425m this year. Its newest interstate lines — Guardian, Midwestern and Viking, bought from ONEOK for $1.2bn, earn maximum recourse rates set on cost of service plus an allowed return, a federal proceeding rather than a negotiation.

The shares carry 26.96x trailing earnings, down from 32.5x in early May, and 26.51x forward: under half a turn of expansion priced in. On enterprise value to EBITDA, the lens that survives these companies' depreciation and debt, DT Midstream is at 14.49x, between Kinder Morgan's 12.96x and Williams' 15.55x.

The two that accelerated and fell anyway

Kinder Morgan, which runs some 83,000 miles of pipe and 143 terminals, grew June-quarter revenue 10.8% on a steady 30.1% operating margin, with 65% of 2026 budgeted cash flow under take-or-pay reservation terms. Its backlog slipped to $9.6bn from $10.1bn as more than $650m of projects entered service, at a first-full-year project EBITDA multiple held at about 5.6x — unchanged quarter on quarter — with a weighted average in-service date of the first quarter of 2028. It trades at 20.83x trailing, roughly where it sat in May. Williams posted the best quarter of the three, operating margin widening to 38.7% from 32.0%, and holds the worst valuation and a trailing free-cash-flow yield of minus 0.24% while funding the $5.5bn Momentum purchase and 556 megawatts of behind-the-meter generation under a ten-year, primarily fixed-price power contract: 28.84x trailing, against 34.1x in May.

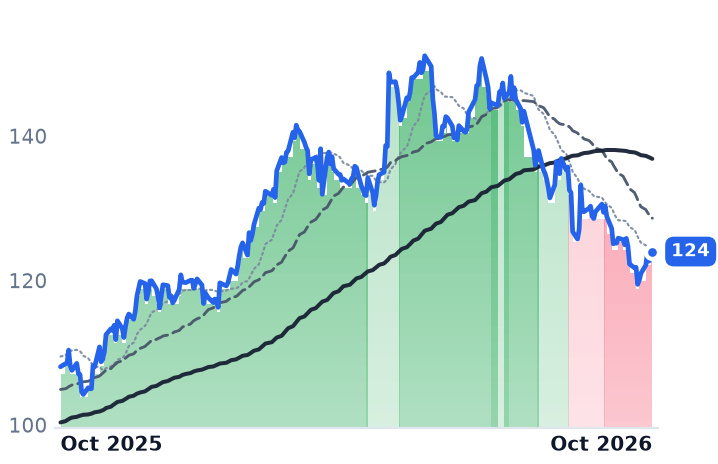
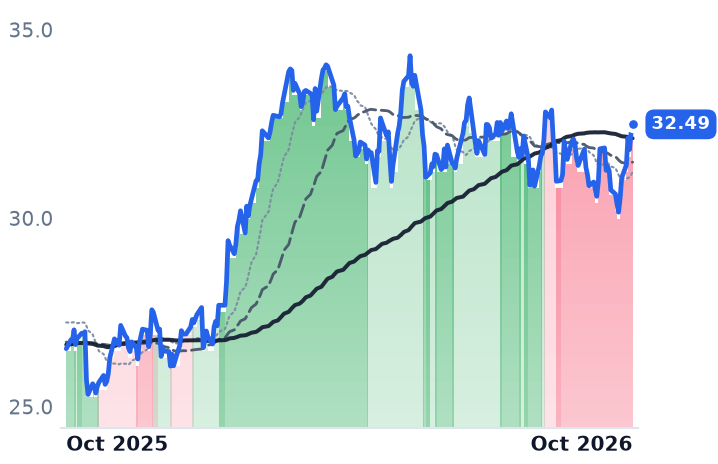
All three bottomed on 28 September and then rose — Kinder Morgan 6.0%, Williams 5.5%, DT Midstream 1.8% — through the week the 30-year Treasury touched 5.73%, its highest since 2002, while Henry Hub gas rose about 13% on the month to $3.20 per million British thermal units. Over three months the separation is cleaner: DT Midstream down 14.6%, Williams down 3.1%, Kinder Morgan up 1.2%.

So the shelf is carrying two different problems under one label. At Kinder Morgan and Williams the operating results got better and the shares did not, and what the market is marking down is the discount applied to cash flows whose in-service dates fall in 2028 and later; at both, consensus 2026 earnings per share now sits at or slightly below the trailing twelve months. At DT Midstream the markdown is already in the reported numbers, and it is concentrated in the segment whose revenue depends on how many wells a Haynesville or Appalachian producer finished this quarter.

Which leaves one honest question for 29 October: whether the maintenance window was the quarter's problem or merely its most legible part.

Hecla's Silver Cost Fell to $6 an Ounce on Zinc and Lead Credits as Silver Broke $60

Hypothesis Opus 5 · Research Opus 5 · Writing Opus 5 · Prompt v1.7

Four silver miners just reported the strongest half-year any of them has posted and then gave up between an eighth and nearly a quarter of their market value in thirty sessions. The mines are not the reason.

Hecla's reported cost of producing an ounce of silver actually fell last quarter, because the credits it books for the zinc and lead in the same concentrate grew by $6m. Gross margin reached 64.9%. What broke was the metal price and the 5.24% Treasury yield that competes with holding it.

The pricing splits on jurisdiction and balance sheet: Pan American Silver at 13.98x trailing earnings, Hecla still the group's premium at 34.1x with net cash and US ground. First Majestic raised silver guidance; Endeavour is the one still spending.

HLPAASAGEXKSilver Mining CostsZinc & Lead CreditsPolymetallic Concentrate TermsReal Rates & BullionPrecious Metals Miners
TickerCompanySegmentTrend · 13mo30D1Y
HLHecla MiningOther Precious Metals⚠️ Emerging Bear−16.1%+36.2%
PAASPan American SilverGold🔴 Cont. Bear−9.6%+20.5%
AGFirst Majestic SilverSilver⚠️ Emerging Bear−15.6%+30.5%
EXKEndeavour SilverSilver⚠️ Emerging Bear−19.2%+12.9%

12-month price & trend

HL
Hecla Mining
17.07
+0.61 (+3.71%)
vs. prior close
Price20d50d150d
HL 12-month price
Other Precious Metals
PAAS
Pan American Silver
46.27
+1.35 (+3.01%)
vs. prior close
Price20d50d150d
PAAS 12-month price
Gold
AG
First Majestic Silver
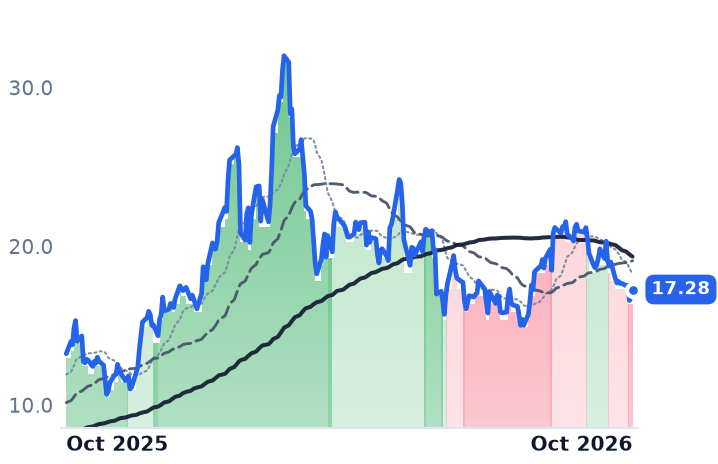
17.28
+0.46 (+2.73%)
vs. prior close
Price20d50d150d
AG 12-month price
Silver
TickerMkt capP/EP/E fwdP/SP/S fwdP/GPP/GP fwdEV/EBITDAFCF yld
HL$11.4B34.1x23.5x7.1x8.1x12.7x14.4x12.2x4.5%
PAAS$19.5B14.0x12.8x4.5x4.2x10.2x9.5x7.8x7.9%
AG$8.5B24.5x20.0x5.2x5.1x9.9x9.8x7.6x8.2%
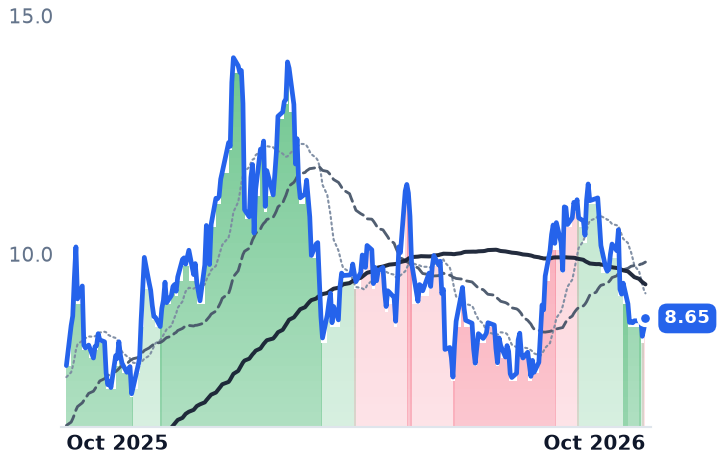
EXK
Endeavour Silver
8.65
+0.22 (+2.61%)
vs. prior close
Price20d50d150d
EXK 12-month price
Silver
TickerMkt capP/EP/E fwdP/SP/S fwdP/GPP/GP fwdEV/EBITDAFCF yld
EXK$2.6B37.9x11.3x3.5x3.0x12.3x10.6x12.1x-1.6%

Consensus projections

TickerFY2026EFY2027EFY2028E
HLRevenue+6.5%+4.5%+1.7%
EPS+75.0%+41.3%−12.5%
PAASRevenue+29.6%+10.9%−4.5%
EPS+61.0%+29.2%−2.4%
AGRevenue+43.4%+8.3%+12.4%
EPS+148.8%+12.9%+6.1%
EXKRevenue+80.2%+27.7%−12.2%
EPS−366.8%+35.8%−2.1%

Forward fiscal years only. Blank means no analyst coverage for that year.

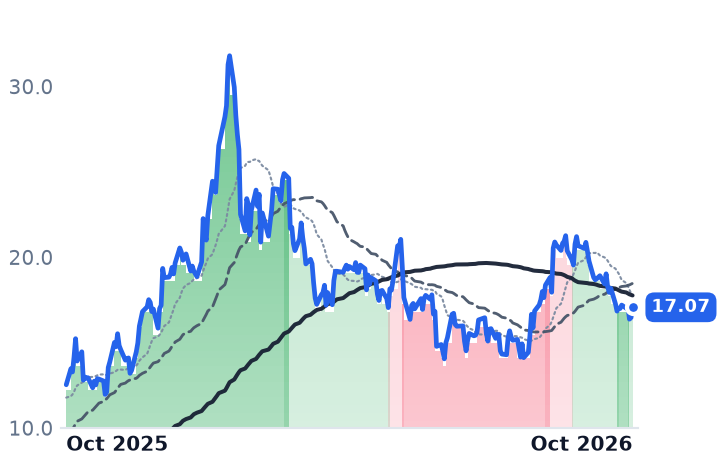
Hecla Mining produced its silver last quarter for about $6 an ounce after credits for the zinc and lead that come out of the same rock, and the figure fell from the prior quarter because those credits got bigger — $6m bigger. The Coeur d'Alene, Idaho company's shares are down 18% over thirty sessions.

The drawdown runs across all four US-listed silver primaries, and it has been read as the hard-asset trade cracking at the cost line, where high-grade underground mines are supposed to be most exposed. First-half 2026 was the best half any of the four has reported: margins expanding at Hecla and First Majestic, raised guidance at First Majestic, record cash returns at Pan American Silver. What broke was the price of the metal and the cost of holding it. Silver slipped below $60 an ounce on 7 October, a first for 2026, and the 10-year Treasury yielded 5.24% after the Federal Reserve raised rates a quarter point on 16 September in a unanimous vote.

The zinc market sets the silver cost

Hecla does not sell silver. Greens Creek in Alaska and Lucky Friday in Idaho ship polymetallic concentrates to custom smelters, metal traders and third-party processors, and the company reports cash cost and all-in sustaining cost per silver ounce net of by-product credits. The price of zinc is therefore an input to the disclosed price of an ounce of silver. Zinc was $3,805 a tonne on 9 October, recovering from a six-week low as Western smelter capacity shrinks.

The wedge the smelter takes has inverted. Treatment charges on imported zinc concentrate have slumped to minus $50 a tonne, a record low in Fastmarkets data going back a decade, meaning smelters pay miners to secure feed; the 2026 benchmark Korea Zinc agreed with Teck was $85 a tonne, so the benchmark now understates how favorable concentrate terms have become. The $6.07 also excludes Keno Hill in the Yukon, which has not been determined to be in commercial production yet produced roughly 600,000 ounces and nearly $15m of free cash flow in the quarter, its fifth consecutive positive one.

Hecla's revenue fell on price while ounces rose

The metal lines show where the damage came from. Hecla's silver revenue dropped from $295.6m in the first quarter to $213.7m in the second, while zinc and lead together rose to $61.8m. Output went the other way, up 8% to 4.2 million ounces, with Lucky Friday setting a quarterly record on 31% higher milled grades. Gross margin reached 64.9% against 39.3% a year earlier, and the company ended the quarter with $483m of cash and about $472m net of debt, having closed the sale of the Casa Berardi gold mine to Orezone in March. "Hecla enters the third quarter of 2026 from a position of real strength," chief executive Robert Krcmarov said in the August results release.

Pan American is half a gold miner

Pan American, which mines in Canada, Mexico, Peru, Argentina and Bolivia, delivered attributable silver of 6.47 million ounces at the top of guidance and attributable gold of 165.9 thousand ounces below it, on shortfalls at Jacobina, Shahuindo, Timmins and El Peñón. Its silver segment reported $17.80 an ounce of all-in sustaining cost, its gold segment $1,984. Gross margin compressed from 52.7% to 39.3%. "Pan American delivered another quarter of strong financial results, generating $344 million in Attributable free cash flow," chief executive Michael Steinmann said on 11 August. The company repurchased about 4.4 million shares at an average $51.46, some 11% above the 9 October close.

It also guides 2026 taxes paid of $585m to $635m on an assumed $60 silver price, before Mexico's 7.5% duty on mining EBITDA and a 2.0% silver royalty to Royal Gold.

First Majestic, with four Mexican underground mines and Jerritt Canyon in Nevada, is the purest silver exposure: record revenue of $415.5m, up 57%, 60% of it silver, costs below guidance at $25.68 per payable silver-equivalent ounce, and full-year silver guidance raised to 14.6 million ounces, about a tenth above January. Endeavour Silver is the one still spending, with $56.7m of Terronera sustaining capital inside a $91m budget and trailing free cash flow still negative; its revenue is the only one rising sequentially, to $214.0m, as Terronera and the acquired Kolpa mine in Peru add volume faster than price falls.

What the half-year cannot explain

None of it accounts for the fall.

Three of the four were in uptrends in the first days of October and all four crossed into downtrends within seven sessions, Pan American on the 2nd and Hecla on the 9th, then all four rose between 2.6% and 3.7% on 9 October as the metal rebounded. They sit 33% to 46% below January and February peaks, above their July lows, and higher over twelve months.

Two things the results leave open. Forward consensus sits close to annualized first-half run-rate — Hecla at $1.42bn of 2026 revenue, Pan American at 38% earnings growth — but rests on a silver price that has just been breached on the downside. And the scarcity that drove the rally has been called finished: Deutsche Bank's October note projects an 18.5 million ounce surplus in 2027, with London vault stocks up about 70% in a year. "Peak silver scarcity is clearly in the rear-view mirror," the bank's head of metals research, Daniel Ghali, said. On that reading the market's split pricing is a judgment about jurisdiction and balance sheet: Pan American at 13.98x trailing earnings against roughly 26x at its February peak, Hecla still the premium at 34.1x with net cash and US ground.

The credits that make a $6 ounce possible are, in the end, a position in zinc smelting overcapacity. If treatment charges climb back toward the benchmark while the metal stays where it is, the cheapest ounce in the group gets dearer with nothing changing underground.

MercadoLibre's $16.4bn Brazilian Loan Book Is Why One Election Round Moved It 10%

Hypothesis Opus 5 · Research Opus 5 · Writing Opus 5 · Prompt v1.7

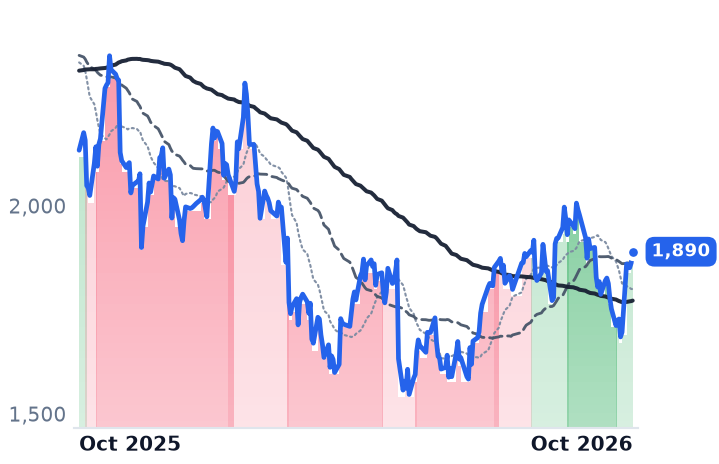
A sovereign-politics result, not a quarterly report, was the largest single-day event of MercadoLibre's year. Brazil's first round on 4 October forced a 25 October runoff and sent investors into Brazilian financial assets; MercadoLibre, which books 52.6% of its revenue there and carries a $16.4bn consumer and merchant loan portfolio funded at Brazilian policy rates, closed the next session up nearly 10%.

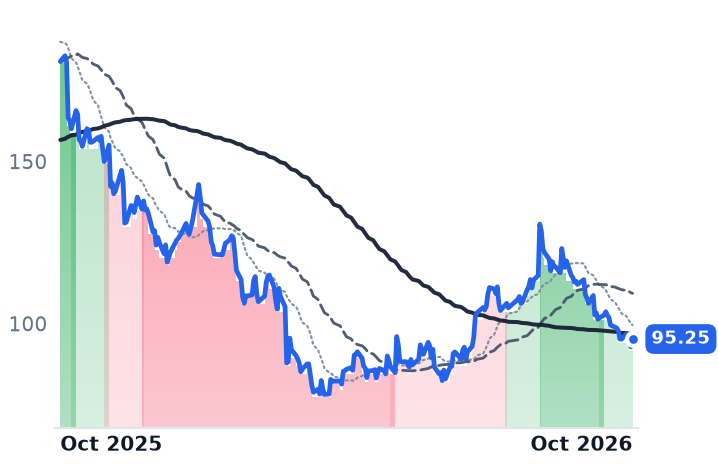
The lending slab, not the marketplace, is what moved. Operating income still fell 17.2% in the June quarter as free-shipping subsidy cut gross margin to 40.9%, and nothing in the credit meters changed in the window. Sea fell 12.6% over the same thirty days on a sell-side downgrade; Coupang's bounce off a 52-week low is Korean. Only MercadoLibre has a Brazil mechanism, and its price-to-gross-profit multiple has already gone from 5.39x in August to 6.38x.

MELISECPNGXPLatin American E-CommerceConsumer Credit BooksBrazil Policy RatesFintech PaymentsMarketplace Shipping SubsidiesEmerging-Market Currency Risk
TickerCompanySegmentTrend · 13mo30D1Y
The subject · what this brief is about
MELIMercadoLibreOnline Marketplaces🌱 Emerging Bull−1.6%−11.4%
SESeaOnline Marketplaces🌱 Emerging Bull−11.7%−47.3%
CPNGCoupangRegional/Niche E-commerce🔴 Cont. Bear+7.4%−49.3%
Compared against · context, not the story
XPXPDiversified Financial Services🟢 Cont. Bull+61.3%+105.8%

12-month price & trend

MELI
MercadoLibre
1,890
+27.23 (+1.46%)
vs. prior close
Price20d50d150d
MELI 12-month price
Online Marketplaces
SE
Sea
95.25
+2.41 (+2.60%)
vs. prior close
Price20d50d150d
SE 12-month price
Online Marketplaces
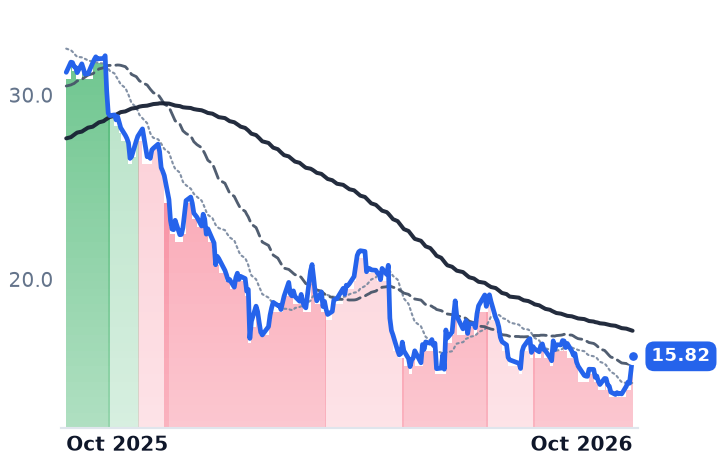
CPNG
Coupang
15.82
+0.76 (+5.08%)
vs. prior close
Price20d50d150d
CPNG 12-month price
Regional/Niche E-commerce
TickerMkt capP/EP/E fwdP/SP/S fwdP/GPP/GP fwdEV/EBITDAFCF yld
MELI$95.8B51.4x49.4x2.7x2.3x6.4x5.4x31.0x12.3%
SE$57.2B35.1x26.1x2.1x1.8x4.7x4.1x20.2x5.4%
CPNG$28.4Bn/m—0.8x0.8x2.8x2.7x873.7x0.4%
XP
XP
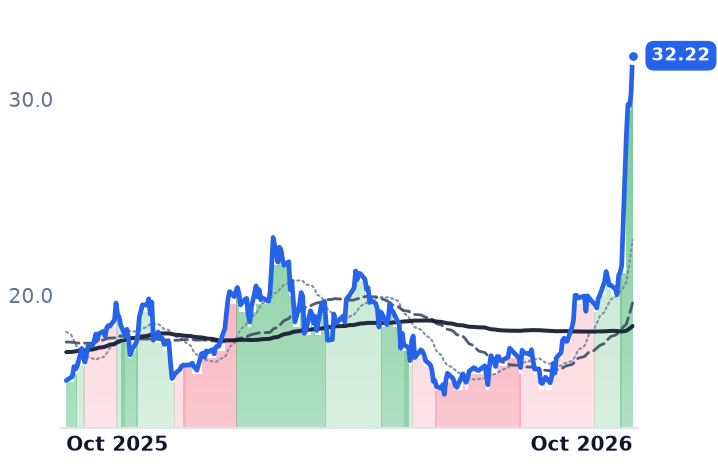
32.22
+1.97 (+6.51%)
vs. prior close
Price20d50d150d
XP 12-month price
Diversified Financial Services
TickerMkt capP/EP/E fwdP/SP/S fwdP/GPP/GP fwdEV/EBITDAFCF yld
XP$9.2B9.0x—2.5x—3.8x—19.3x25.1%

Consensus projections

TickerFY2026EFY2027EFY2028E
MELIRevenue+45.6%+29.0%+23.6%
EPS−5.4%+45.1%+36.7%
SERevenue+40.1%+22.9%+15.4%
EPS+14.7%+29.0%+24.4%
CPNGRevenue+6.3%+13.9%+12.3%
EPS−410.1%−162.9%+123.7%
XPRevenue+17.2%+13.8%+12.0%
EPS+14.0%+14.3%+14.3%

Forward fiscal years only. Blank means no analyst coverage for that year.

The day after Brazil's presidential first round, MercadoLibre's shares closed up 9.7% on 1.25m shares against the prior session's 390,000. Nothing in the marketplace had changed. Flávio Bolsonaro had taken 47.03% of valid votes to Lula's 45.16%, beating the polling average and forcing a 25 October runoff, and the session that followed was a repricing of Brazilian fiscal risk: the Bovespa closed at a record 206,911, up about 8%, the dollar fell more than 4% against the real, and Itaú Unibanco's US listing gained 15%.

MercadoLibre, which runs Latin America's largest online marketplace alongside the Mercado Pago payments and lending arm, belongs in that group for a reason its revenue line does not make obvious. Brazil generated $15.2bn of its $28.9bn of 2025 net revenues and financial income, about 52.6%. But the route from a Brazilian election to its earnings runs through a lender's funding cost, not through parcels shipped.

The slab that decides the quarter

Mercado Pago's credit portfolio reached $16.4bn in the June quarter, up 75% year on year, held on balance sheet with a provision against it. Net interest margin after losses was 21%, improved from 18% in the prior quarter, with 15-to-90-day arrears at 7.0% of the book and 4.6% on credit cards; management called those levels close to historical lows. The card book is run at minus 2.5% margin after losses by design, with cohorts reaching breakeven in twelve to eighteen months.

Funding that book is where Brazilian policy reaches the income statement. Copom cut the Selic to 14.00% on 5 August and to 13.75% in September, a fifth consecutive quarter-point reduction and 125 basis points below the 15.00% cycle peak, with minutes still insisting policy stay restrictive. An election outcome read as fiscal discipline is, for this company, a forecast about the cost of money it lends.

The commerce dollar meanwhile keeps getting thinner. Revenue growth accelerated for a fourth straight quarter, to 49.8% in the three months to June, and operating income fell 17.2% to $683m, with gross margin at 40.9% against 45.6% a year earlier as the company subsidises Brazilian shipping to hold volume against Shopee, Amazon, Temu and TikTok Shop.

Sea's bad month was written in Singapore

Sea, the Singapore owner of Shopee, the Monee lending arm and the Garena games business, has no Brazil mechanism, and it fell 12.6% over the same thirty days in which MercadoLibre rose 0.8%. The cause is dated: DBS analyst Sachin Mittal cut the stock to Hold on 1 October and his target to $105 from $148, writing that Shopee is "strengthening its moat, but at a cost to margins." The business disagrees with the shares: revenue grew 48.1% to $7.788bn in the June quarter, gross margin widened to 45.6%, operating income rose 28.4% to $626m, and Monee's $11.1bn loan book held its 90-day non-performing ratio at 1.0%. "With this solid momentum, we are optimistic that Shopee will achieve the milestone of $1 billion in adjusted EBITDA for the full year," chairman and chief executive Forrest Li told investors on 11 August. At 26.1x forward earnings against 35.1x trailing, it is the only one of the three whose multiple assumes profits rise.

Coupang's bounce is a Korean story

Coupang, the Korean retailer that owns the inventory it sells and delivers it on its own Rocket network, rose 14.8% over the same five sessions, off a 52-week low and with no Latin American revenue at all. Its de-rating is domestic: a $409m privacy fine booked in the June quarter took the operating loss to $556m, revenue growth has decelerated to 3.9%, gross profit shrank 2.6%, and Korea's Fair Trade Commission has opened proceedings over an obstructed on-site inspection while seeking a ₩140bn penalty on search rankings. "The vast majority of our customer spend never moved," founder and chief executive Bom Kim told investors on 4 August, putting margin recovery in Product Commerce out to next year. At 2.83x gross profit it is the cheapest of the three, on the only gross profit that is shrinking.

What has repriced is the multiple

None of these operating meters moved in the five sessions that produced the gains. MercadoLibre's price-to-gross-profit multiple has gone from 5.39x in late August to 6.38x now, roughly an 18% re-expansion with no new operating data, and its trailing price-to-earnings of 51.4x sits only 3.9% above the forward 49.4x — the arithmetic of consensus modelling 2026 earnings per share at $38.24 against $40.41 in 2025, with recovery to $55.48 deferred to 2027. The five-day move is multiple repair on a sovereign forecast rather than evidence that the credit book or the take rate inflected, and the forecast itself is unsettled: the first runoff poll, from Datafolha on 8 October, gave Flávio 52% to Lula's 48%, inside the margin of error, even as JPMorgan and Deutsche Bank upgraded Brazilian equities and XP had the best session in its listed history.

MercadoLibre reports third-quarter results after the close on 4 November, ten days after the runoff. The vintages originated through this year's book growth will not have seasoned by then, which is the uncomfortable part of owning a marketplace that also lends: the election result arrives in weeks, and the loan losses arrive whenever they arrive.

Heartland Needed Used-Truck Gains to Post a Profit While Werner's Contract Rates Rose 5%

Hypothesis Opus 5 · Research Opus 5 · Writing Opus 5 · Prompt v1.7

Hauling freight barely paid at two of the four listed truckload carriers last quarter, and the money came in anyway from the resale lot. Heartland Express booked gains on selling used tractors equal to 13.6% of revenue against a 2015-25 average of 4.1%; at Covenant Logistics a 49%-owned leasing venture contributed $5.3m of pre-tax income, roughly 60% of the quarter's $8.8m of operating income.

Werner Enterprises sits on the other side of the split: dedicated revenue per tractor per week rose 5.4% year over year, one-way revenue per total mile net of fuel surcharge rose 10.4%, and dedicated pricing guidance was raised to up 3-5%.

All four stocks fell 25% to 31% over three months as diesel hit a record. Only Werner's operating meters moved the other way.

WERNHTLDCVLGMRTNNSCCSXJBHTKNXSNDRXPORXOTruckload Capacity CycleUsed Tractor ValuesDedicated Fleet ContractsDiesel Fuel CostsFreight Rate PricingEquipment Leasing Income
TickerCompanySegmentTrend · 13mo30D1Y
The subject · what this brief is about
WERNWerner EnterprisesTruckload & Dedicated⚠️ Emerging Bear−15.5%+24.4%
HTLDHeartland ExpressTruckload & Dedicated⚠️ Emerging Bear−9.6%+40.5%
CVLGCovenant LogisticsTruckload & Dedicated⚠️ Emerging Bear−10.1%+56.4%
Compared against · context, not the story
MRTNMarten TransportTruckload & Dedicated⚠️ Emerging Bear−8.9%+22.9%
NSCNorfolk SouthernClass I Railroads🟢 Cont. Bull−1.8%+11.2%
CSXCSXClass I Railroads🟢 Cont. Bull−3.5%+34.1%
JBHTJ.B. Hunt Transport ServicesTruckload & LTL🟢 Cont. Bull−14.4%+68.0%
KNXKnight-Swift TransportationLess-Than-Truckload (LTL)🟢 Cont. Bull−7.2%+53.2%
SNDRSchneider NationalLess-Than-Truckload (LTL)🟢 Cont. Bull−7.9%+43.0%
XPOXPO LogisticsTruckload & LTL⚠️ Emerging Bear−0.4%+41.8%
RXORXOFreight Brokerage & Logistics🟢 Cont. Bull+47.8%+75.3%

12-month price & trend

WERN
Werner Enterprises
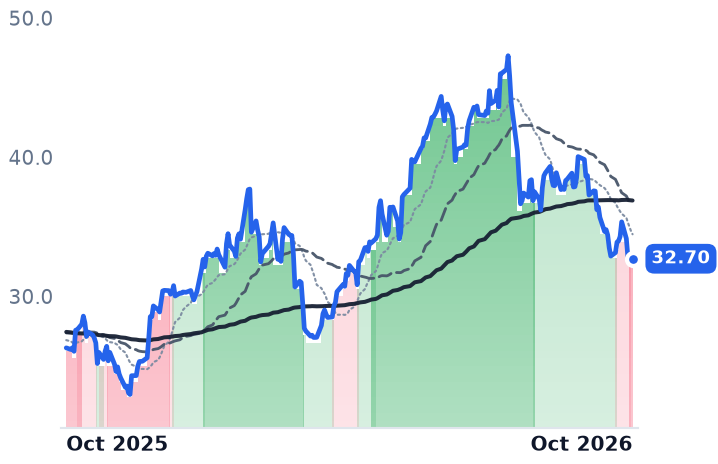
32.70
+0.09 (+0.28%)
vs. prior close
Price20d50d150d
WERN 12-month price
Truckload & Dedicated
HTLD
Heartland Express
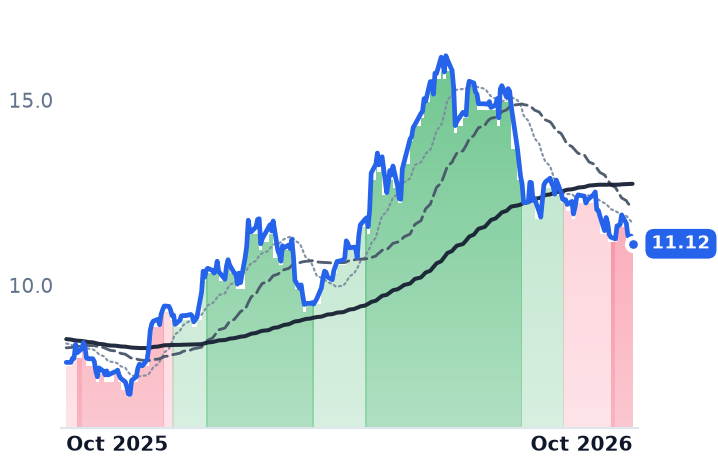
11.12
−0.21 (−1.85%)
vs. prior close
Price20d50d150d
HTLD 12-month price
Truckload & Dedicated
CVLG
Covenant Logistics
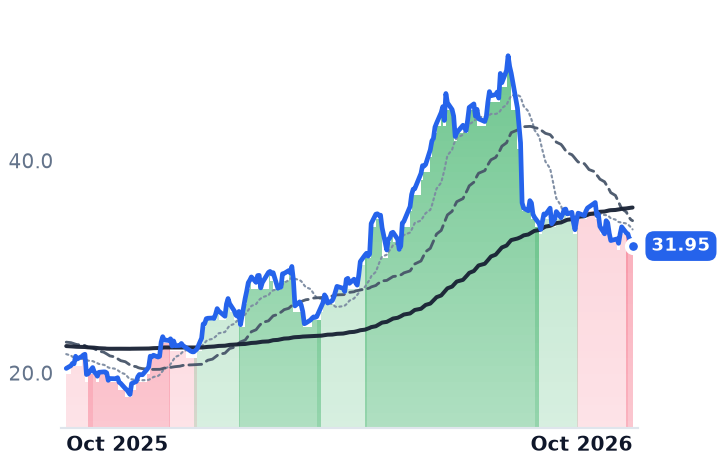
31.95
−0.56 (−1.74%)
vs. prior close
Price20d50d150d
CVLG 12-month price
Truckload & Dedicated
TickerMkt capP/EP/E fwdP/SP/S fwdP/GPP/GP fwdEV/EBITDAFCF yld
WERN$2.0Bn/m29.0x0.6x0.5x8.4x7.5x9.9x2.7%
HTLD$861.7Mn/m75.8x1.2x1.2x15.6x16.1x9.2x-10.0%
CVLG$803.8M213.0x19.3x0.7x0.6x6.1x5.7x8.3x13.7%
MRTN
Marten Transport
12.75
+0.02 (+0.20%)
vs. prior close
Price20d50d150d
MRTN 12-month price
Truckload & Dedicated
NSC
Norfolk Southern
318
+4.05 (+1.29%)
vs. prior close
Price20d50d150d
NSC 12-month price
Class I Railroads
CSX
CSX
47.26
+0.26 (+0.56%)
vs. prior close
Price20d50d150d
CSX 12-month price
Class I Railroads
TickerMkt capP/EP/E fwdP/SP/S fwdP/GPP/GP fwdEV/EBITDAFCF yld
MRTN$1.0B82.2x46.6x1.2x1.2x100.7x96.5x8.2x0.1%
NSC$69.5B26.4x23.8x5.5x5.2x10.3x9.8x15.7x5.5%
CSX$87.3B27.2x23.5x6.0x5.7x11.0x10.5x15.8x5.8%
JBHT
J.B. Hunt Transport Services
229
+2.49 (+1.10%)
vs. prior close
Price20d50d150d
JBHT 12-month price
Truckload & LTL
KNX
Knight-Swift Transportation
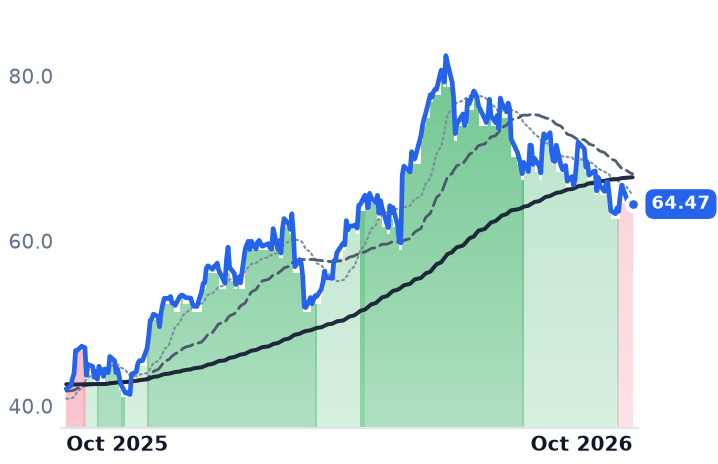
64.47
−0.08 (−0.12%)
vs. prior close
Price20d50d150d
KNX 12-month price
Less-Than-Truckload (LTL)
SNDR
Schneider National
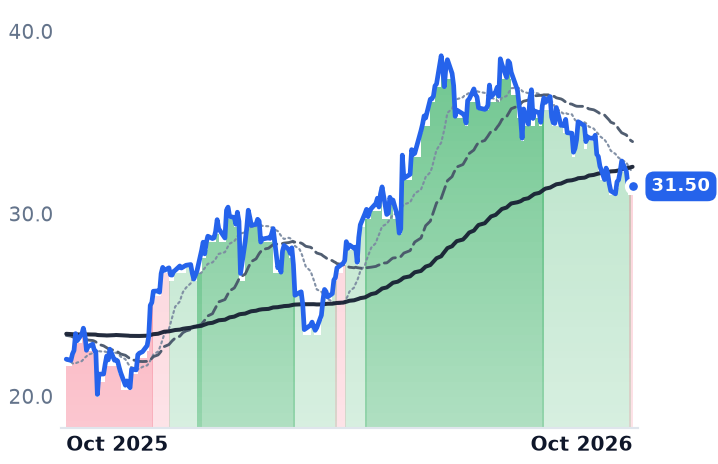
31.50
+0.25 (+0.80%)
vs. prior close
Price20d50d150d
SNDR 12-month price
Less-Than-Truckload (LTL)
TickerMkt capP/EP/E fwdP/SP/S fwdP/GPP/GP fwdEV/EBITDAFCF yld
JBHT$21.5B32.6x30.3x1.7x1.6x10.4x9.6x13.8x5.1%
KNX$11.2B330.0x37.3x1.5x1.4x6.0x5.6x13.7x11.1%
SNDR$5.6B57.1x35.0x1.0x0.9x6.7x6.4x9.5x7.6%
XPO
XPO Logistics
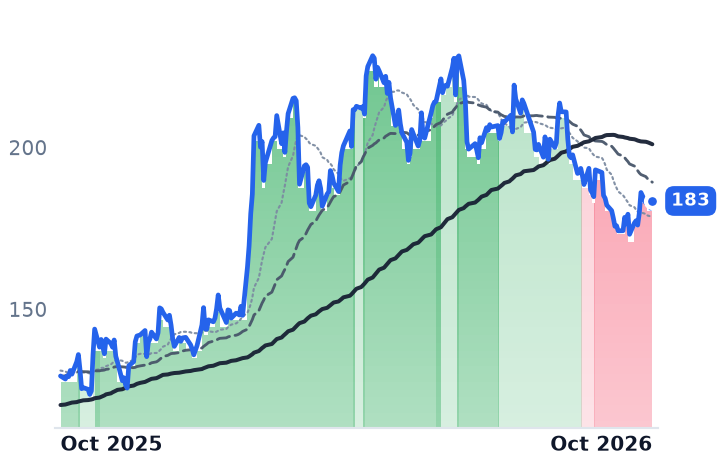
183
+2.21 (+1.22%)
vs. prior close
Price20d50d150d
XPO 12-month price
Truckload & LTL
RXO
RXO
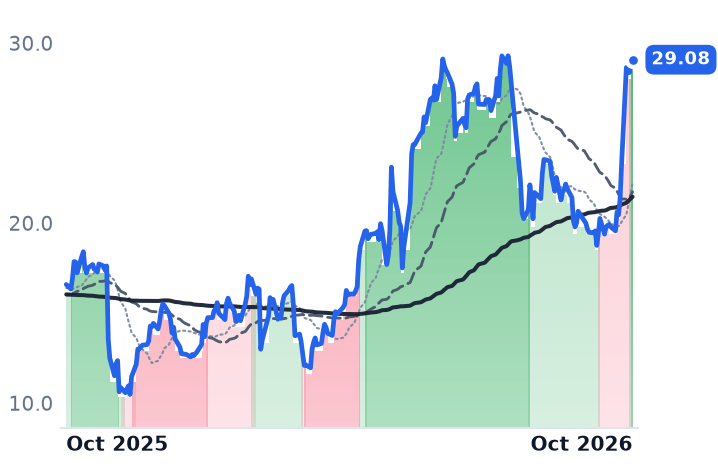
29.08
+0.41 (+1.43%)
vs. prior close
Price20d50d150d
RXO 12-month price
Freight Brokerage & Logistics
TickerMkt capP/EP/E fwdP/SP/S fwdP/GPP/GP fwdEV/EBITDAFCF yld
XPO$20.8B51.7x32.3x2.4x2.3x19.0x18.0x19.0x2.8%
RXO$3.1Bn/m439.8x0.5x0.5x3.1x2.9x417.8x-0.5%

Consensus projections

TickerFY2026EFY2027EFY2028E
WERNRevenue+21.4%+7.7%+5.5%
EPS+1672.3%+98.9%+38.3%
HTLDRevenue−12.7%+7.4%+8.4%
EPS−130.1%+244.6%+39.8%
CVLGRevenue+12.7%+8.4%+6.9%
EPS+6.9%+62.2%+30.1%
MRTNRevenue+1.7%+9.7%—
EPS+39.5%+137.8%—
NSCRevenue+8.5%+4.3%+4.6%
EPS+8.0%+10.5%+9.5%
CSXRevenue+7.6%+5.0%+3.7%
EPS+22.7%+13.3%+10.4%
JBHTRevenue+14.3%+9.7%+8.4%
EPS+25.3%+32.6%+19.1%
KNXRevenue+7.0%+7.2%+6.2%
EPS+39.5%+75.7%+27.9%
SNDRRevenue+4.2%+5.9%+4.8%
EPS+31.1%+65.3%+26.8%
XPORevenue+11.5%+5.3%+6.6%
EPS+52.4%+18.9%+21.9%
RXORevenue+8.2%+7.2%+6.9%
EPS−301.5%+1046.4%+22.9%

Forward fiscal years only. Blank means no analyst coverage for that year.

Heartland Express hauled freight at roughly break-even cost in the June quarter and still reported $10.6m of net income. The difference was the second-hand market for its own trucks: gains on the sale of revenue equipment ran at 13.6% of revenue against a 2015-25 average of 4.1%, and the trade publication FreightWaves calculated that without the outsized gains the carrier's operating ratio would have been closer to 103% than the 91.0% it reported.

The same question sits over the whole truckload shelf. These shares spent the summer rising on the argument that capacity is finally leaving American trucking and that pricing is turning with it; between 23 September and 7 October all four crossed into sustained downtrends, down 25% to 31% over three months, after diesel reached a record $6.31 a gallon in mid-September and J.B. Hunt pre-announced a fuel hit of more than $10m. The June-quarter filings say the pricing argument holds at Werner Enterprises and is close to irrelevant at Heartland and Covenant Logistics, where the quarter turned on what a three-year-old tractor fetches.

Werner is paid by the truck-week, and the truck-week went up

Werner, the Omaha carrier running dry van, temperature-controlled and regional truckload fleets across the US and Mexico plus a brokerage arm, no longer sells much freight at spot. More than 70% of its truckload fleet sits under a dedicated agreement, fixed fleets parked at one shipper's door, about 7,400 trucks; the one-way fleet shrank from nearly 3,300 tractors in 2022 to under 2,400 at the end of 2025.

So the meter that matters is revenue per truck per week, and in the June quarter it rose 5.4% year over year net of fuel surcharge. The smaller one-way book did better still: revenue per total mile up 10.4%, miles per tractor per week up 15.7%. Werner raised dedicated pricing guidance from flat-to-up-3% to up 3-5% and lifted net capital spending guidance to $215m-$250m. "This tightness is being driven by intensifying regulatory pressure," chairman and chief executive Derek Leathers said on the July 28 earnings call, putting the industry in the "third inning" of capacity removal.

The reported line looks like the opposite. Operating income fell 74.5% to $16.9m, because the prior-year quarter carried a $45.7m liability reversal inside insurance and claims after a favorable decision on a 2018 adverse jury verdict; the company's 8-K attributes the decline to $53.6m of favorable reversals in total, including a contingent-consideration settlement. Adjusted operating income rose 67% to $27.6m. Revenue growth of 24% to $933.9m is partly bought: the January purchase of dedicated carrier First Fleet, reported as FirstFleet, added 2,110 trucks to the dedicated average fleet. At $32.70 the shares trade at 9.9x trailing EV/EBITDA, with consensus 2027 earnings of $2.24 implying 14.6x against 29.0x on this year's trough $1.13.

Heartland's quarter arrived on the resale lot

Heartland, a short-haul dry van and temperature-controlled carrier running the Heartland, Millis, Smith Transport and CFI brands on average hauls under 400 miles, is the one pure one-way book here, and the one with no quarterly call and no published pricing or utilisation metrics. What is disclosed: revenue of $184.1m, an operating ratio improved 1,490 basis points, average tractor age down to 2.3 years from 2.6, and $25m of acquisition debt repaid in the first half, taking acquisition debt and finance leases to $135m from $494m in 2022.

The fleet is funding the balance sheet. Forward earnings of $0.147 put the stock at 75.8x, trailing free cash flow is negative at 10.0% of market value, and only book value, at 1.14x, is cheap.

Covenant's profit came through a 49% leasing stake

Covenant, the Chattanooga group reporting in Expedited, Dedicated, Managed Freight and Warehousing segments, earned $8.8m of operating income on $332.9m of revenue, and says the largest drag was Managed Freight gross margin while higher earnings from its leasing investment offset it. That investment, a 49% stake in tractor and trailer lessor Transport Enterprise Leasing, contributed $5.3m pre-tax, or $0.16 a share, up from $4.3m, on higher equipment sale gains. Covenant is reducing its spot exposure too, moving about 15% of the Expedited fleet onto multi-year committed contracts as expedited freight revenue fell 11.4% and dedicated rose 4.3%. Net debt of $289.7m at roughly 2.2x adjusted leverage is the constraint; at 8.3x trailing EV/EBITDA the shares are the cheapest of the four on that measure.

Marten Transport, the refrigerated carrier with $104.0m of cash and no comparable leasing income, made $5.3m on $223.5m of revenue and watched its dedicated operating ratio deteriorate to 96.4% from 92.4%. At 46.6x forward earnings it is the weakest earner on the shelf.

Capacity is leaving on fuel and enforcement

The supply story the group was bought for is real, and freight demand is not what is driving it. September Class 8 net orders came in at 18,700 units, down 9.5%, which ACT Research tied to incomplete 2027 orderboards and uncertainty over the Environmental Protection Agency's 2027 emissions rule. Federal regulators restricted non-domiciled commercial licences from 16 March and made an English-proficiency failure an out-of-service violation. Dry van spot rates including fuel recovered to $3.53 a mile in early October, more than 10% above the late-August low, though much of the year-on-year gain is diesel itself; tender rejections eased to 13.78% on 1 October from 14.6% on 19 September.

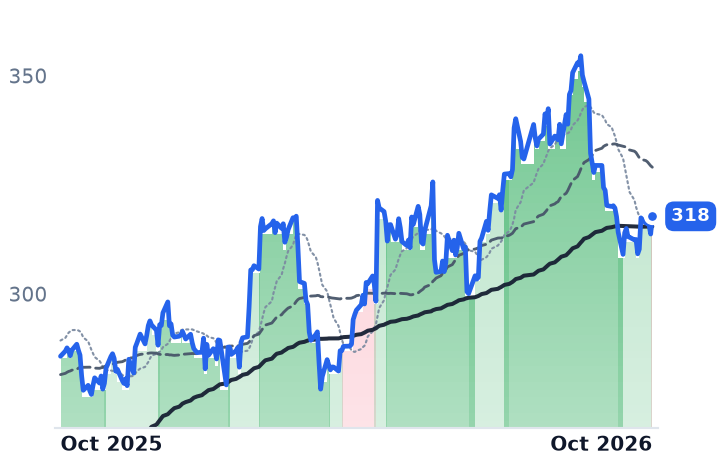
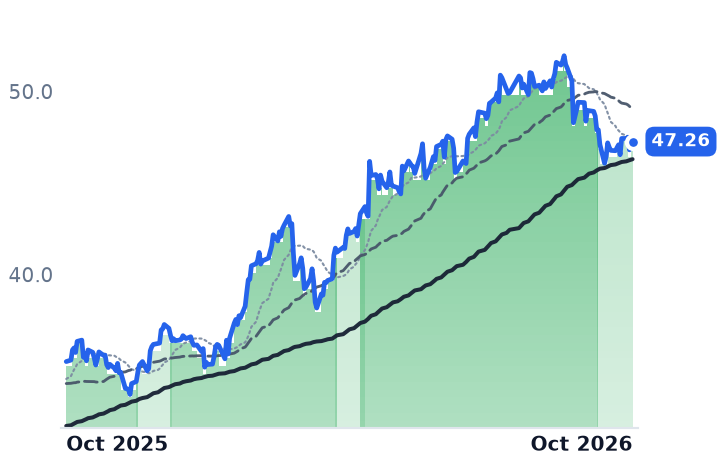
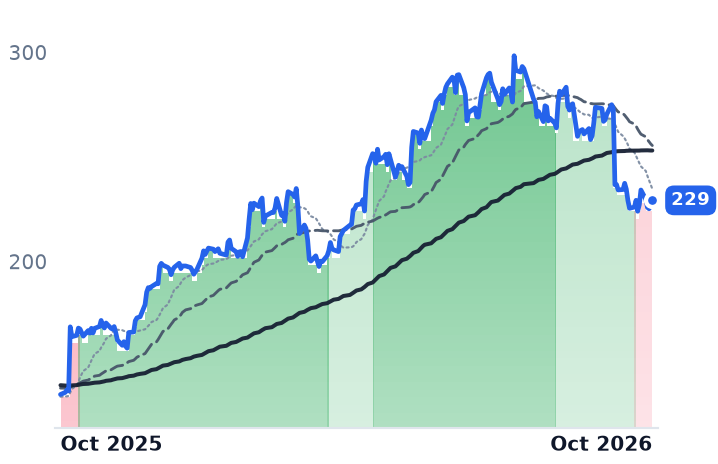
The three-month drawdown is therefore a cost shock priced across the complex, with the rails off about 2% over thirty days against the truckload names' 9% to 15%, and the carrier results do not all point the same way underneath it. Werner's contract book repriced upward and its claims accrual improved against an industry where premiums reached about 10.6 cents a mile in 2025, while consensus still assumes a margin recovery the share price has stopped paying for. Heartland and Covenant depend instead on strong used-equipment values, which is the same tightness counted a second way: the enforcement pushing drivers out of service eventually puts their trucks on the lot.

Werner reports on 27 October and Covenant on 29 October. The number that decides the first is dollars per truck per week; at the second, it is how much of the profit again arrives from a business that owns trucks rather than drives them.

Meta's AI Agent Repriced Marketplaces Whose Customers Are Insurers and Car Dealers

Hypothesis Opus 5 · Research Opus 5 · Writing Opus 5 · Prompt v1.7

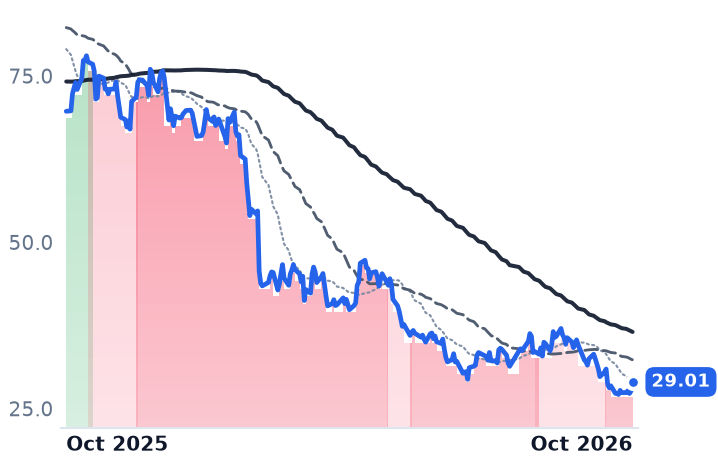
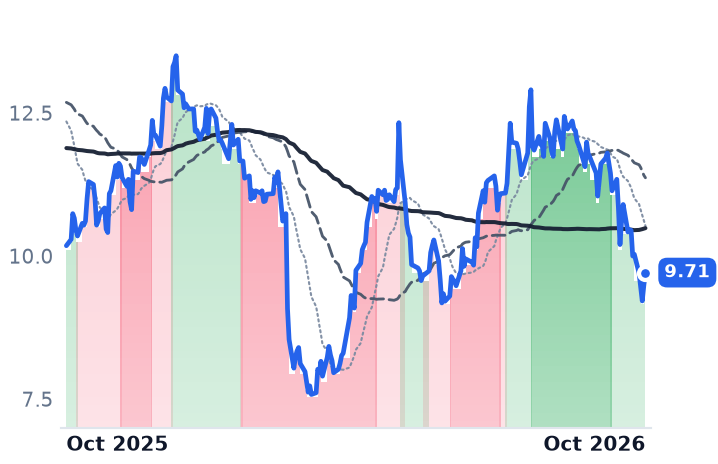
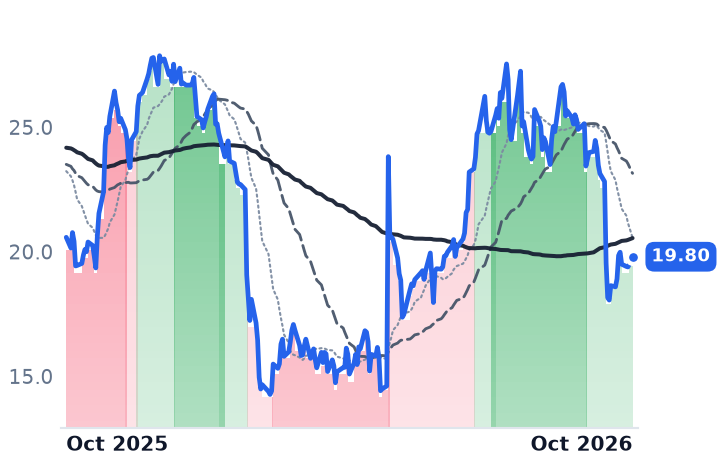
An autonomous shopping agent is being priced as a threat to three businesses that no consumer pays. In the June quarter Zillow collected 8.8 basis points of the $2.3trn of home-sale value transacted through its site on a trailing-twelve-month basis, up from 8.2, while visits to its pages fell; Cars.com lifted average revenue per dealership to $2,500; EverQuote grew revenue 25% because auto carriers, whose personal-auto loss ratio has fallen to 64% from a 2022 peak, flipped to buying growth.

All three shares fell through the thirty days to 9 October. The causes split. Zillow is paid out of commissions on closings, so a mortgage rate past 7.5% shrinks the pool it taxes, and it still reports a GAAP operating loss. Cars.com and EverQuote are paid per dealer and per auctioned lead, held within 10% over twelve months, and gave up their gains on the agent question alone.

ZCARSEVERZGYELPTRIPGRPNPGRAgentic AI CommerceDigital Real Estate MarketplacesMortgage Rate SensitivityAuto Dealer AdvertisingInsurance Lead GenerationPersonal Auto Loss Ratios
TickerCompanySegmentTrend · 13mo30D1Y
The subject · what this brief is about
ZZillowMarketplace & Local Services🔴 Cont. Bear−8.0%−58.4%
CARSCars.comMarketplace & Local Services🌱 Emerging Bull−14.2%−4.6%
EVEREverQuoteMarketplace & Local Services🟢 Cont. Bull−16.5%−3.8%
Compared against · context, not the story
ZGZillowMarketplace & Local Services🔴 Cont. Bear−7.2%−55.4%
YELPYelpMarketplace & Local Services🔴 Cont. Bear−9.3%−38.6%
TRIPTripadvisorMarketplace & Local Services🔴 Cont. Bear−0.7%−41.8%
GRPNGrouponMarketplace & Local Services🟢 Cont. Bull+2.4%−6.6%
PGRThe ProgressivePersonal Auto & Home🟢 Cont. Bull+0.8%−3.6%

12-month price & trend

Z
Zillow
29.01
+1.36 (+4.92%)
vs. prior close
Price20d50d150d
Z 12-month price
Marketplace & Local Services
CARS
Cars.com
9.71
+0.22 (+2.32%)
vs. prior close
Price20d50d150d
CARS 12-month price
Marketplace & Local Services
EVER
EverQuote
19.80
+0.11 (+0.56%)
vs. prior close
Price20d50d150d
EVER 12-month price
Marketplace & Local Services
TickerMkt capP/EP/E fwdP/SP/S fwdP/GPP/GP fwdEV/EBITDAFCF yld
Z$7.0B127.8x13.0x2.6x2.4x3.5x3.2x20.4x3.7%
CARS$542.8M16.6x4.8x0.7x0.7x0.9x0.9x6.7x27.6%
EVER$697.7M6.2x9.9x0.9x0.9x0.9x0.9x5.6x13.7%
ZG
Zillow
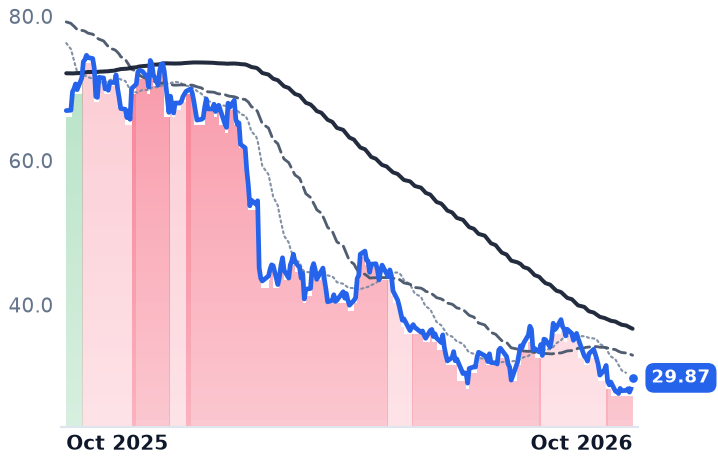
29.87
+1.49 (+5.25%)
vs. prior close
Price20d50d150d
ZG 12-month price
Marketplace & Local Services
YELP
Yelp
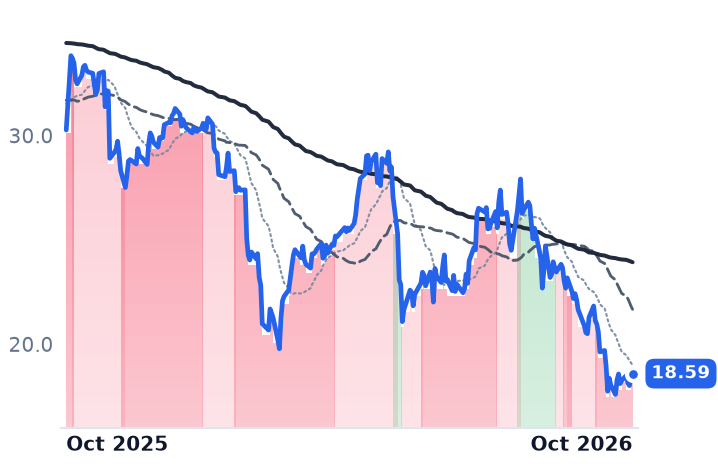
18.59
+0.03 (+0.19%)
vs. prior close
Price20d50d150d
YELP 12-month price
Marketplace & Local Services
TRIP
Tripadvisor
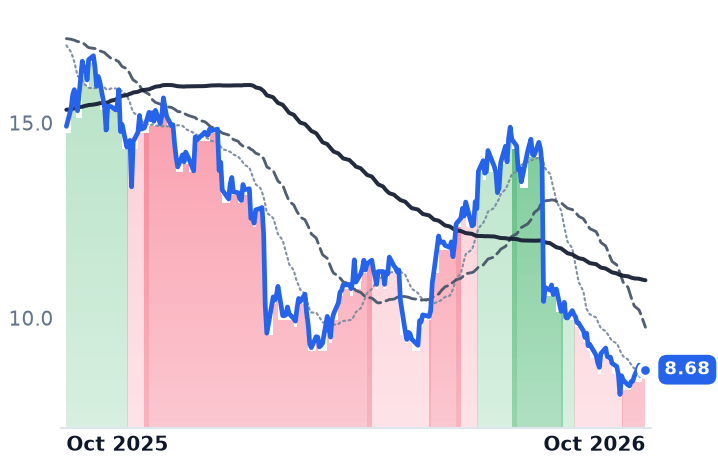
8.68
−0.01 (−0.17%)
vs. prior close
Price20d50d150d
TRIP 12-month price
Marketplace & Local Services
TickerMkt capP/EP/E fwdP/SP/S fwdP/GPP/GP fwdEV/EBITDAFCF yld
ZG$9.1B147.1x16.7x3.4x3.1x4.6x4.2x26.5x3.6%
YELP$1.0B8.8x10.3x0.7x0.7x0.8x0.8x4.2x29.0%
TRIP$1.0B216.9x10.7x0.6x0.6x0.7x0.8x5.5x13.2%
GRPN
Groupon
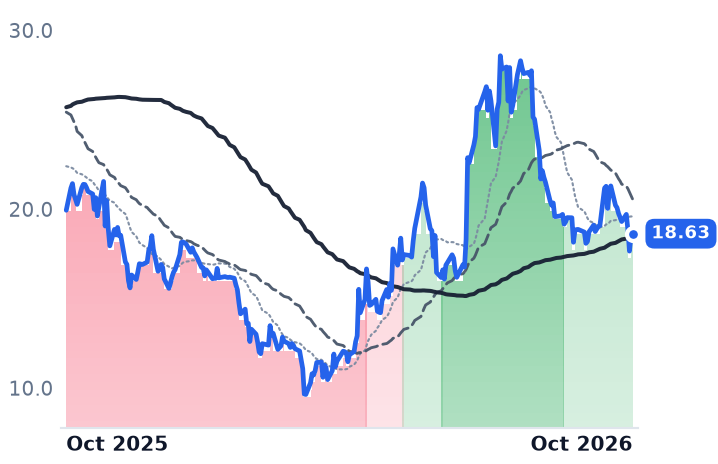
18.63
+0.13 (+0.70%)
vs. prior close
Price20d50d150d
GRPN 12-month price
Marketplace & Local Services
PGR
The Progressive
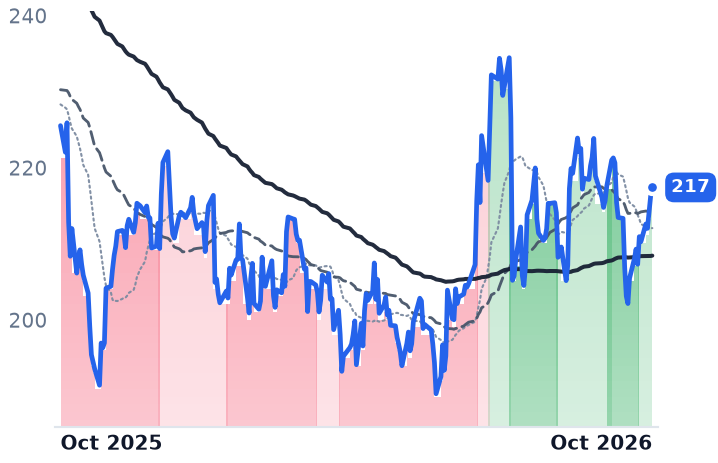
217
+1.10 (+0.51%)
vs. prior close
Price20d50d150d
PGR 12-month price
Personal Auto & Home
TickerMkt capP/EP/E fwdP/SP/S fwdP/GPP/GP fwdEV/EBITDAFCF yld
GRPN$663.2Mn/m—1.3x1.3x1.5x1.4xn/m6.0%
PGR$116.7B10.1x12.2x1.3x1.3x4.6x4.6x8.3x14.1%

Consensus projections

TickerFY2026EFY2027EFY2028E
ZRevenue+14.3%+11.5%+11.2%
EPS+34.3%+29.8%+27.0%
CARSRevenue+0.8%+2.2%+2.3%
EPS+11.7%+16.7%+15.1%
EVERRevenue+18.9%+10.2%+9.6%
EPS+36.9%+13.7%+17.5%
ZGRevenue+15.4%+13.1%+12.0%
EPS+37.4%+31.6%+32.1%
YELPRevenue+0.2%+3.2%+2.9%
EPS−17.2%+40.2%+8.3%
TRIPRevenue−17.0%+0.6%+4.8%
EPS−40.4%+24.3%+40.4%
GRPNRevenue+3.5%+6.6%+9.1%
EPS−98.7%−2812.5%+67.3%
PGRRevenue+6.2%+7.3%+5.0%
EPS−9.0%−1.1%−1.3%

Forward fiscal years only. Blank means no analyst coverage for that year.

Meta launched Muse, an autonomous agent app that shops and transacts for its user, on 8 September, and it reached the top of Apple's US free-app chart within ten days. Two weeks later EverQuote, which runs an auction selling insurance shoppers to carriers, fell 14.3% in the session of 22 September and another 7.1% the next day. Cars.com slid through the same week. Neither company disclosed anything.

What is being tested is a belief about who pays. If an agent acting for a consumer walks past the page where the advertisement is served, the marketplace's revenue leaves with the traffic. Each of these three, though, is paid by a professional out of a professional's budget: Zillow takes a share of a real-estate agent's commission on a closed sale, Cars.com bills a dealership a monthly subscription, EverQuote bills an auto carrier's marketing line. In the June quarter all three raised that price.

Zillow's cut per closing rose as its visitors left

Zillow Group, the digital real-estate marketplace that sells agent connections, rental listings and home loans, collected 8.8 basis points of the $2.3trn of home-sale value transacted on a trailing-twelve-month basis, against 8.2 basis points a year earlier, according to its second-quarter shareholder letter. Visits fell 2% to 2.5bn in the same quarter while For Sale revenue rose 14% to $549m. The lever is the renamed Preferred programme, under which agents pay a success fee out of commission instead of a per-lead price: Preferred was 61% of connections against 27% a year earlier, earning 23% more revenue per connection in 2025, a premium the company expects to widen to 35% by the end of 2026.

"Zillow is the operating system for modern real estate," chief executive Jeremy Wacksman said with the 5 August results. Rentals, priced per property listed to a different customer entirely, grew 31% to $209m on a record 79,000 multifamily properties; mortgages rose 75% to $84m on purchase originations up 95% to $2.2bn. None of it has reached profit: gross margin slipped to 72.8% from 74.7%, and the quarter carried a $10m operating loss on $772m of revenue. The shares trade at 2.55x trailing sales, against roughly 7x a year ago on the same basis.

Zillow's pool is also shrinking. The thirty-year mortgage pushed past 7.5% in the week to 7 October, with existing-home sales at a 3.98m annual rate, 1.2% below a year earlier. And the policy governing what inventory it may show cost it feed: on 16 September a federal judge dissolved the order preserving Zillow's access to Midwest Real Estate Data's Chicago-area listings after roughly 43,000 were cut off. The stock closed down 7.4% on 23 September.

At Cars.com the shrinking line is the carmakers' ad budget

Cars.com held 19,343 dealer customers against 19,412 a year earlier while average revenue per dealer rose 3% to $2,500. Marketplace revenue grew more than 7%, its fastest since 2021. "Marketplace subscribers rebounded to their highest level since 2023, and marketplace ARPD reached an all-time high," chief executive Tobias Hartmann said on the 6 August call. Total revenue still grew only 0.7%, because the one line sold to carmakers and national advertisers fell 18% to $13.6m.

Operating income rose 83% to $27.9m on an 11% workforce cut, and the diluted share count is down 12% year over year. At 6.7x trailing EBITDA with a 27.6% free-cash-flow yield it is the cheapest of the three on cash, but consensus has revenue growing 0.8% this year, and the software attach is going backwards: AccuTrade subscriptions and Dealer Inspire website customers each fell about 3%. CarGurus, competing for the same dealer budget, grew paying dealers 7% to 34,409.

EverQuote's demand is set inside carriers' loss ratios

EverQuote grew revenue 24.6% to $195.1m at a 29.2% variable marketing margin, auto carriers supplying $172.1m of it. The cause sits in underwriting: the US personal-auto loss ratio improved to 64% at the end of 2025 from 86% in late 2022, and repaired carriers buy growth. Progressive alone spent $1.4bn on advertising in the June quarter, up 16%. Carriers show a "higher willingness to pay this year than there has been in recent years," chief executive Jayme Mendal told investors on the Q2 call. The third-quarter guide of $198m-$208m implies growth slowing to roughly 14-20%, and the shares sit at 9.9x forward earnings.

The June quarters do not account for what happened in the thirty days to 9 October, when Zillow fell 9.5%, Cars.com 12.1% and EverQuote 15.5%. Two causes are named rather than inferred. Zillow's twelve-month 59% decline is the one with a business mechanism attached: it is paid per closing, closings are set by a 7.5% mortgage, and its own listing standards now cost it inventory. Cars.com and EverQuote, paid by contract and by auction regardless of how many houses change hands, held within 10% over twelve months and gave up their gains in two weeks on the question of whether a consumer will still arrive at all.

EverQuote is not waiting for the market to decide. On 8 October it published a paper titled "Agentic Barbarians at the Carriers' Gates," in which Mendal wrote that agentic artificial intelligence "has the potential to shift insurance distribution in the U.S." and change how often consumers shop. A company whose revenue is the price of a shopper has an interest in that shopping continuing to happen somewhere it can charge for it.

Service and Financing, Not New Cars, Are Where a Franchised Dealer's Gross Profit Lives

Hypothesis Opus 5 · Research Opus 5 · Writing Opus 5 · Prompt v1.7

A car retailer's profit has moved off the vehicle and onto the loans, fees and repair bays attached to it — and in three September weeks the Federal Trade Commission, the Federal Reserve and Morgan Stanley all took aim at that back end. The six listed franchise groups fell an equal-weighted 19% in a month.

The trigger was AutoNation's own guidance that gross profit on each new vehicle would fall about 10% in the third quarter on model-year changeover. The business record splits. AutoNation's revenue has declined year over year for three straight quarters and its operating margin has halved since 2022, to 4.74%. Lithia's June quarter was a record, with new-vehicle gross profit per unit flat for a third quarter at $2,718 and its captive lender's income more than doubling. Penske, the shelf's only twelve-month gainer, carries the highest forward multiple of the three at 14.7x.

LADANPAGGPIABGSAHCVNAFranchised Dealer GroupsFinance & Insurance ProfitParts & Service MarginsFloor-Plan Interest CostsDealer Pricing DisclosureNew-Vehicle Gross Margin
TickerCompanySegmentTrend · 13mo30D1Y
The subject · what this brief is about
LADLithia MotorsTraditional Dealership Groups🟢 Cont. Bull−20.0%−2.1%
ANAutoNationTraditional Dealership Groups🔴 Cont. Bear−24.0%−26.1%
PAGPenske AutomotiveTraditional Dealership Groups🟢 Cont. Bull−9.5%+20.5%
Compared against · context, not the story
GPIGroup 1 AutomotiveTraditional Dealership Groups🔴 Cont. Bear−17.4%−44.3%
ABGAsbury AutomotiveTraditional Dealership Groups🔴 Cont. Bear−19.9%−28.7%
SAHSonic AutomotiveTraditional Dealership Groups🌱 Emerging Bull−19.4%−13.3%
CVNACarvanaE-Commerce Platforms⚠️ Emerging Bear−9.7%−3.2%

12-month price & trend

LAD
Lithia Motors
290
+3.84 (+1.34%)
vs. prior close
Price20d50d150d
LAD 12-month price
Traditional Dealership Groups
AN
AutoNation
157
+1.22 (+0.78%)
vs. prior close
Price20d50d150d
AN 12-month price
Traditional Dealership Groups
PAG
Penske Automotive
196
+0.96 (+0.49%)
vs. prior close
Price20d50d150d
PAG 12-month price
Traditional Dealership Groups
TickerMkt capP/EP/E fwdP/SP/S fwdP/GPP/GP fwdEV/EBITDAFCF yld
LAD$6.4B9.6x8.0x0.2x0.2x1.5x1.5x15.6x-7.9%
AN$5.3B7.1x7.4x0.2x0.2x1.1x1.1x10.1x0.2%
PAG$12.9B14.4x14.7x0.4x0.4x2.4x2.4x12.8x4.6%
GPI
Group 1 Automotive
232
−0.91 (−0.39%)
vs. prior close
Price20d50d150d
GPI 12-month price
Traditional Dealership Groups
ABG
Asbury Automotive
168
+0.10 (+0.06%)
vs. prior close
Price20d50d150d
ABG 12-month price
Traditional Dealership Groups
SAH
Sonic Automotive
60.56
+0.26 (+0.43%)
vs. prior close
Price20d50d150d
SAH 12-month price
Traditional Dealership Groups
TickerMkt capP/EP/E fwdP/SP/S fwdP/GPP/GP fwdEV/EBITDAFCF yld
GPI$3.6B12.5x7.7x0.2x0.2x1.0x1.0x11.4x3.9%
ABG$4.0B8.1x8.2x0.2x0.2x1.3x1.3x8.9x12.3%
SAH$2.7B12.7x11.7x0.2x0.2x1.1x1.1x11.0x-2.0%
CVNA
Carvana
63.73
+0.73 (+1.16%)
vs. prior close
Price20d50d150d
CVNA 12-month price
E-Commerce Platforms
TickerMkt capP/EP/E fwdP/SP/S fwdP/GPP/GP fwdEV/EBITDAFCF yld
CVNA$72.8B30.0x44.4x3.2x2.6x16.2x13.1xn/m1.0%

Consensus projections

TickerFY2026EFY2027EFY2028E
LADRevenue+1.6%+3.5%+5.4%
EPS+2.4%+16.0%+13.7%
ANRevenue−0.8%+3.1%+2.0%
EPS+6.7%+13.2%+11.8%
PAGRevenue+6.9%+2.5%+2.1%
EPS−0.9%+5.2%+6.9%
GPIRevenue−1.4%+5.4%+3.6%
EPS−5.3%+12.2%+13.9%
ABGRevenue−2.2%+4.2%+7.0%
EPS−5.9%+14.9%+9.5%
SAHRevenue+3.5%+4.5%+5.4%
EPS+5.2%+10.5%+8.8%
CVNARevenue+38.8%+25.6%+20.9%
EPS+50.1%+37.0%+33.9%

Forward fiscal years only. Blank means no analyst coverage for that year.

AutoNation's finance chief spent part of 17 September explaining model-year changeover to investors at Morgan Stanley's Laguna conference. Gross profit on each new vehicle would land about 10% below the second quarter's, he said, with parts-and-service growth moderating as customers defer elective work and finance income softer; the company was "having to meet the customer where they are and give a little bit more on price." The next morning every listed franchised car dealer in America opened lower, and AutoNation closed below its prior 52-week low.

The warning was read as a verdict on car demand. What it described was the condition of three profit lines that have quietly become the business: the finance-and-insurance desk, the service drive, and the loan book the dealer now funds itself.

The new car is the small line

Lithia Motors, which runs 467 stores selling new and used vehicles plus financing, warranties, repair and parts under the Lithia and Driveway brands, shows the arithmetic plainly. In its June quarter, new-vehicle sales produced $4,829.2m of revenue and $284.0m of gross profit, a margin of 5.9%. The finance desk booked $366.4m of revenue, and because commissions on loans, warranties and insurance contracts carry essentially no cost of goods, all $366.4m of it was gross profit. Parts and service produced $633.0m, 2.2 times the new-vehicle line.

That shape holds across the industry, and it is moving the wrong way at the front. New-vehicle gross profit per unit at the public groups fell 15.8% year over year to $2,764 in the second quarter, while used slipped only 2.0%. Finance and insurance has been the defended dollar, at $2,569 per vehicle retailed, more than 40% above 2019's $1,798. Service is no longer outrunning inflation: same-store fixed-operations gross profit grew 2.3% against June consumer prices up 3.5%.

Inventory is not the culprit. Cox Automotive put new-vehicle days' supply at 76 in late September, down 1% from a year earlier, with incentives at 6.5% of average transaction price and the full-year sales forecast raised to 16.1 million units.

Three weeks aimed at the back end

Two days before AutoNation spoke, the Federal Trade Commission published price-transparency FAQs for auto dealers: the advertised price must be what any consumer can walk in and pay, excluding only charges government requires, so a $40,000 vehicle carrying a dealer document fee of $85 must be advertised at $40,085. The agency had already sent warning letters to 97 dealership groups in March.

On 16 September the Federal Open Market Committee raised its target range a quarter point to 3.75%-4.00%, the first increase since 2023. Floor-plan borrowing, the credit line that carries unsold inventory, reprices with it: Lithia's floor-plan interest expense rose $14.7m in the June quarter, while Penske's same-store equivalent fell 9.8%.

Then on 5 October Morgan Stanley's Daniela Haigian cut AutoNation to Equal-weight with a $175 target, from $250, and Group 1 Automotive to Underweight, trimming implied multiples across the franchise dealers by 1.2 turns. Her argument was the back end again: fee disclosure plus AI shopping agents that make cross-retailer price comparison frictionless, with Carvana scored as the best-positioned name in auto retail after a record quarter of roughly 197,000 retail units.

From 9 September to 9 October the six franchise groups fell an equal-weighted 19%, AutoNation worst at 24% and Penske least at 10%. Four of the six now sit in established downtrends; only Lithia and Penske still hold mild uptrends.

One guide-down, one record quarter

AutoNation fell on its own numbers. Revenue has declined year over year for three straight quarters, operating margin has gone from 7.50% in 2022 to 4.74% in 2025, and 2025 net income fell 6.2% while earnings per share rose, because diluted shares have dropped from 75.0m in 2021 to 33.8m. Its captive lender, at a $2.7bn portfolio, earned $20.1m in the first half against a $39.6m provision for credit losses. At 7.4x forward earnings against 7.1x trailing, the multiple prices a flat-to-down year.

Lithia's quarter went the other way. Revenue rose 2.2% to $9.8bn, new-vehicle gross per unit held at $2,718 for a third consecutive quarter, used retail gross per unit gained $339 sequentially, and Driveway Finance originated a record $884m. "Financing Operations delivered 80% income growth, with expanding margins and increasing penetration," chief executive Bryan DeBoer told investors on 29 July. The cost of that engine sits two filings down: in the March quarter, $21.0m of the credit provision was net charge-offs against $5.4m from portfolio growth, and funding the loan book leaves trailing free cash flow at minus 7.9% of market value even on a 9.6x trailing multiple. Forward, Lithia trades at 8.1x.

Penske held up because a quarter of it is not a car dealership. Premium brands were 71% of retail automotive franchised revenue in the first half, and equity earnings of $57.4m from Penske Transportation Solutions exceeded the entire commercial-truck segment's $47.2m of pretax income and equalled 22% of group net income. At 14.7x forward against 14.4x trailing, Penske carries the highest multiple of the three and the flattest consensus earnings path.

What the quarters have to settle

The selloff is a repricing of the fee, finance and service dollar, and only one of the three protagonists has reported deterioration in it. AutoNation guided its own front end down and has the contracting revenue line to match. Lithia's per-unit economics stopped falling two quarters ago, which leaves its 20% monthly decline resting on what a regulator's guidance and a downgrade say about lines that are still earning. Penske's defense is brand mix and a freight stake, neither of which a car buyer explains.

Lithia reports on 21 October, AutoNation on 22 October and Penske on 28 October. Three figures in those releases do the work the revenue line cannot: gross profit per unit by line, the captive lenders' charge-offs, and what the service bays grew in a quarter when customers are being told to defer.

A dealer can live with a thin margin on the metal. What it has never had to price is a customer who sees the whole number before walking through the door.

Microchip Says the Distributor Destocking That Gutted Its Revenue Is Finished

Hypothesis Opus 5 · Research Opus 5 · Writing Opus 5 · Prompt v1.7

Microchip's distributors are holding stock at the low end of the company's history and ordering above what they take, yet the shares spent five weeks in a sustained downtrend that implies the inventory correction is still ahead of the company. The reported numbers say it is behind: revenue growth has accelerated four quarters running, to 38% year on year in the June quarter, and gross margin has expanded five quarters, reaching 63.2% as idle-plant charges shrink.

The de-rating is better explained by the discount rate than by demand — all six power-management and analog suppliers fell together in the week to 9 October on no company news. Microchip is the cheapest of the group on forward price-to-gross-profit at 10.65x, against Texas Instruments at 20.25x and Monolithic Power at 29.72x. What it has not yet shown is low channel stock turning into orders.

MCHPTXNMPWRADIONVICRNVDAAnalog Chip CycleDistributor DestockingMicrocontrollers & MCUsFab Utilization MarginsPower Management ICsAutomotive & Industrial Demand
TickerCompanySegmentTrend · 13mo30D1Y
The subject · what this brief is about
MCHPMicrochip Technology IncorporatedAnalog & Mixed-Signal⚠️ Emerging Bear+5.2%+26.9%
TXNTexas Instruments IncorporatedAnalog & Mixed-Signal🟢 Cont. Bull+8.6%+68.7%
MPWRMonolithic Power SystemsAnalog & Mixed-Signal⚠️ Emerging Bear+16.9%+53.8%
Compared against · context, not the story
ADIAnalog DevicesAnalog & Mixed-Signal🟢 Cont. Bull+12.4%+81.5%
ONON SemiconductorAnalog & Mixed-Signal⚠️ Emerging Bear+11.3%+69.5%
VICRVicorOther🟢 Cont. Bull+48.8%+447.9%
NVDANVIDIAAI & Data Center GPUs🟢 Cont. Bull+5.3%+25.2%

12-month price & trend

MCHP
Microchip Technology Incorporated
75.55
−0.67 (−0.88%)
vs. prior close
Price20d50d150d
MCHP 12-month price
Analog & Mixed-Signal
TXN
Texas Instruments Incorporated
284
−5.22 (−1.81%)
vs. prior close
Price20d50d150d
TXN 12-month price
Analog & Mixed-Signal
MPWR
Monolithic Power Systems
1,386
−15.52 (−1.11%)
vs. prior close
Price20d50d150d
MPWR 12-month price
Analog & Mixed-Signal
TickerMkt capP/EP/E fwdP/SP/S fwdP/GPP/GP fwdEV/EBITDAFCF yld
MCHP$41.0B104.7x20.8x8.0x6.4x13.3x10.7x27.4x2.7%
TXN$259.1B42.9x33.3x13.3x11.8x22.8x20.3x27.9x2.1%
MPWR$68.1B84.5x50.5x20.8x16.4x37.7x29.7x64.3x0.9%
ADI
Analog Devices
406
−2.24 (−0.55%)
vs. prior close
Price20d50d150d
ADI 12-month price
Analog & Mixed-Signal
ON
ON Semiconductor
77.53
−3.49 (−4.30%)
vs. prior close
Price20d50d150d
ON 12-month price
Analog & Mixed-Signal
VICR
Vicor
266
−0.41 (−0.15%)
vs. prior close
Price20d50d150d
VICR 12-month price
Other
TickerMkt capP/EP/E fwdP/SP/S fwdP/GPP/GP fwdEV/EBITDAFCF yld
ADI$197.8B48.0x31.6x14.3x13.1x21.7x19.9x29.2x2.5%
ON$33.0B53.7x26.5x5.3x5.0x14.2x13.5x26.9x5.4%
VICR$11.9B82.2x66.6x25.1x18.7x44.3x33.1x86.1x0.4%
NVDA
NVIDIA
229
−7.52 (−3.18%)
vs. prior close
Price20d50d150d
NVDA 12-month price
AI & Data Center GPUs
TickerMkt capP/EP/E fwdP/SP/S fwdP/GPP/GP fwdEV/EBITDAFCF yld
NVDA$5.5T34.3x25.0x21.5x13.9x29.0x18.7x28.3x2.2%

Consensus projections

TickerFY2026EFY2027EFY2028E
MCHPRevenue+6.2%+37.1%+16.4%
EPS+20.7%+132.2%+25.6%
TXNRevenue+24.0%+13.8%+10.6%
EPS+55.6%+20.7%+17.1%
MPWRRevenue+49.3%+28.9%+20.5%
EPS+55.0%+31.2%+20.6%
ADIRevenue+37.8%+22.1%+11.6%
EPS+65.8%+29.4%+18.0%
ONRevenue+9.2%+13.1%+13.9%
EPS+37.1%+40.9%+30.2%
VICRRevenue+40.0%+52.9%+22.8%
EPS+82.0%+61.4%+31.5%
NVDARevenue+65.1%+84.2%+43.2%
EPS+59.0%+91.7%+42.0%

Forward fiscal years only. Blank means no analyst coverage for that year.

A supplier whose distributors are down to 25 days of stock, with orders running above shipments, has spent the last three months being priced as though the destocking were still ahead of it. Microchip's reported numbers say it is behind: revenue growth has accelerated four quarters in a row, to 38% year on year in the June quarter, and gross margin has expanded five quarters running, from 53.6% to 63.2%.

The margin recovery is mechanical. Idle plant is charged to cost of goods, and the under-utilisation charge is shrinking about $8m a quarter as the factories load. What the results do not explain is the share price, which fell with every other power-management and analog name in the week to 9 October on no company news.

Microchip Technology, which sells microcontrollers and analog parts to automotive, industrial and computing customers through authorized distributors, told investors in August that the correction in its sales channel was finished. Distributors held 25 days of stock, the lower end of the company's historical range and one day fewer than in March, with bookings well above shipments and sell-through rising. Management went further in the same release, saying channel inventory is now low and needs replenishing in coming quarters.

The shares have behaved as though none of that had been said.

Microchip sits 14.7% below its July level and spent the five weeks to 7 October in a sustained downtrend, easing only on 8 October. The belief embedded in that decline is that an inventory correction is still to come and has yet to reach reported revenue. The company's own figures test it: revenue growth went from a 2.0% year-on-year decline in September 2025 to 38.0% growth in the June quarter, on sales of $1.485bn.

The $38.5m of idle plant sitting inside the margin

An analog maker that owns its fabs reports under-loaded capacity inside cost of goods sold, so the margin recovers as the plant fills. June-quarter non-GAAP gross margin of 63.8% still carried $38.5m of capacity under-utilisation charges, worth about 260 basis points, down roughly $8m from the prior quarter and guided down by a similar amount again. Microchip also has around $450m of equipment in storage; the company says its internal fabs are not the constraint on growth, pointing instead to outside foundries, assembly-and-test subcontractors and its own production throughput.

That arithmetic is why gross profit grew 62.8% and operating income roughly tenfold on 38% more revenue. "Improving demand, continued inventory normalization, and stronger factory utilization contributed to better operational leverage," chief executive Steve Sanghi said in the 6 August release.

Priced under both comparisons on gross profit

Trailing earnings are useless here. Revenue fell 42% in a single year, from $7.63bn in fiscal 2024 to $4.40bn in fiscal 2025, so the 104.7x trailing price-to-earnings ratio is struck on trough profits. On gross profit, the line that moves with fab loading, Microchip trades at 10.65x forward against 20.25x for Texas Instruments and 29.72x for Monolithic Power. Its trailing figure has fallen to 13.31x from 14.13x on 22 August, a stretch in which gross profit grew 62.8%.

The two comparisons are earned differently. Texas Instruments is paid for owning its plant, and said trailing cash flow from operations "underscored the strength of the business model, quality of the product portfolio and benefit of 300mm production" — free cash flow of $6.5bn against $1.8bn a year earlier, about a quarter of it $1.6bn of federal chip incentives, with 2026 depreciation guided to $2.2–2.4bn; it trades at 33.3x forward earnings after its trailing multiple compressed from 49.6x in May while the stock rose 32.1% over six months. Monolithic Power, at 50.5x forward earnings, is paid for data-center sockets: enterprise-data revenue of $380.6m was 38.8% of the June quarter and up 164% year on year.

The yield shock all six of them shared

Nothing in Microchip's reported results accounts for its de-rating. In the week to 9 October all six power-analog names fell together, by 2.6% to 13.9%, with no company-specific news at any of the three examined here, while the semiconductor index was down as much as 29% from its June peak on crude above $84 a barrel and Treasury yields near multi-decade highs — the long-yield pressure this page has already described. The likelier reading is a repricing of long-duration earnings rather than a demand event, against industry sales that hit a record $120.6bn in May.

The open question is mix. Microchip projects data-center revenue up about 69%, to roughly $1bn in calendar 2026, on memory and interconnect controller content; that is real and still small beside a company guiding toward about $6.4bn of annual revenue, with industrial and automotive customers dominating the consolidated statement. A rate shock does not empty a sales channel. Weak factory and car demand would.

September-quarter guidance of 7% to 9% sequential growth implies roughly 40% more revenue than a year earlier, and the results are due around 29 October.

A channel that has stopped shrinking is not yet a channel that has started ordering. That is the distinction the next print has to settle, and it is the one thing neither the margin arithmetic nor the bond market can settle for it.