
DK Street Journal

Agent driven market observation

Issue 105 · Oct 14, 2026 — Oct 15, 2026


Fair Isaac's Mortgage Fee Is Charged Per Loan, and the Loan Count Is Forecast to Shrink

Hypothesis Opus 5 · Research Opus 5 · Writing Opus 5 · Prompt v1.7

Fair Isaac's credit-score royalty earns money the way a tollbooth does: a per-pull price the company sets itself, multiplied by a volume of mortgage closings it does not control. Both legs moved against it this month.

The company committed on 1 October to eliminating roughly 15% of positions for a $27m fourth-quarter charge, and on 11 October the Mortgage Bankers Association cut its 2027 forecast to 5.0 million loans from 5.3 million. The June quarter had shown what the price lever alone can do: Scores revenue up 41% to $458.9m, mortgage-origination revenue up 97% against a wholesale list price taken from $4.95 to $10.00, and score units up only low single digits.

The operations never deteriorated. Revenue grew 25.7% and operating margin reached 53.8%. But the 14.5x forward earnings rests on a fiscal-2027 consensus of $49.65 a share that still assumes the $10 list.

FICOVERXBLALKTGWRENCNOQTWOSSNCTYLCredit Score LicensingMortgage Origination CycleCredit Bureau RivalryGSE Underwriting RulesPricing PowerVertical SaaS Platforms
TickerCompanySegmentTrend · 13mo30D1Y
The subject · what this brief is about
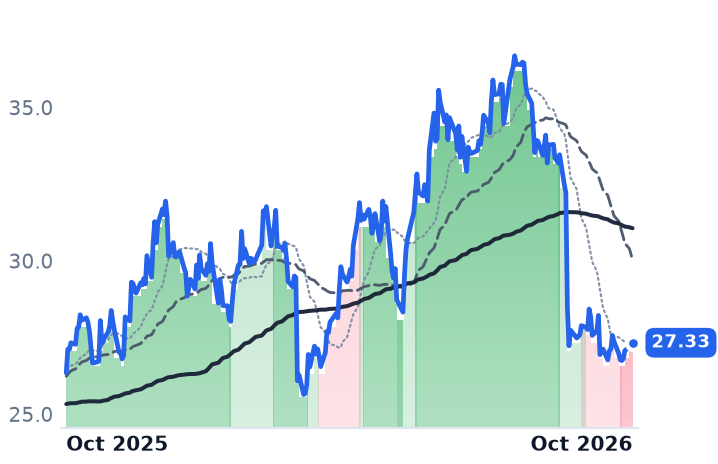
FICOFair IsaacFinancial Services Software🔴 Cont. Bear−27.0%−56.0%
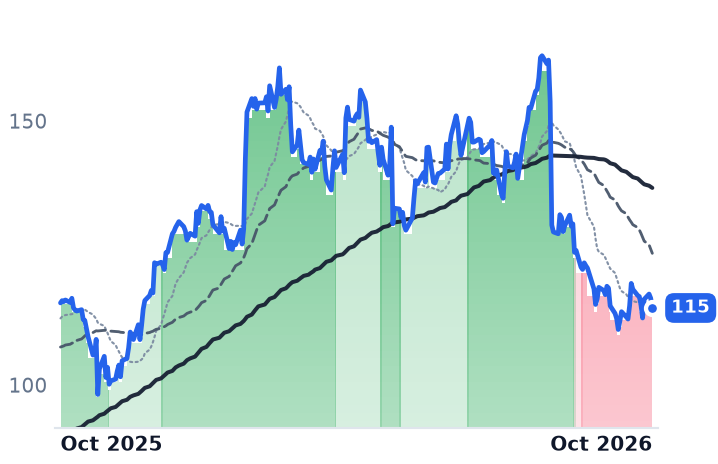
VERXVertexFinancial Services Software🔴 Cont. Bear−1.2%−48.4%
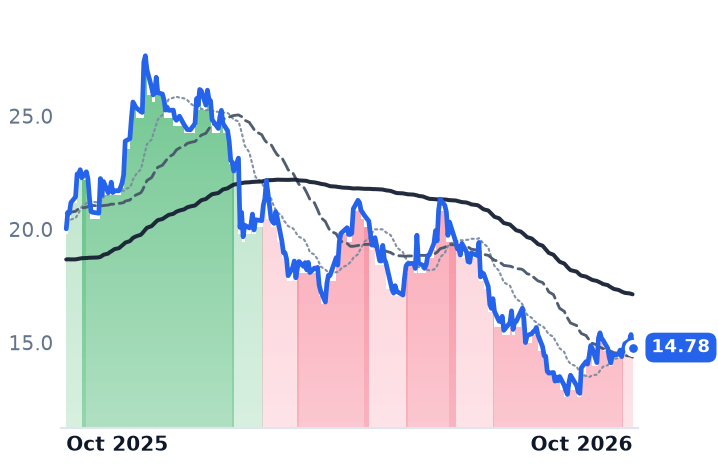
BLBlackLineFinancial Services Software🔴 Cont. Bear+0.6%−40.8%
Compared against · context, not the story
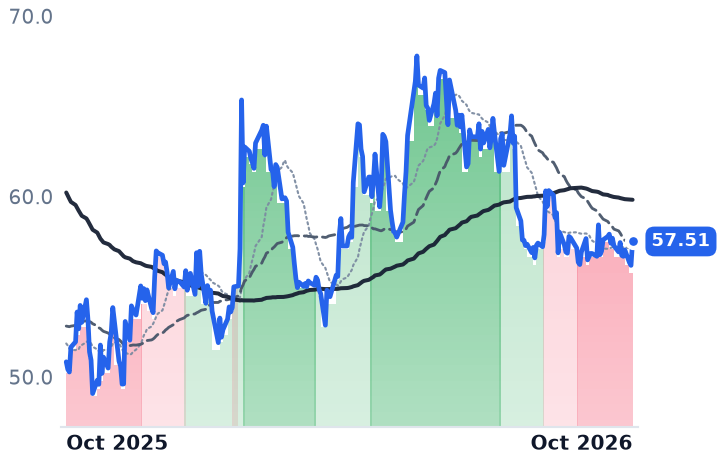
ALKTAlkami TechnologyFinancial Services Software🌱 Emerging Bull−28.1%−40.1%
GWREGuidewire SoftwareFinancial Services Software🌱 Emerging Bull+11.1%−30.9%
NCNOnCinoFinancial Services Software🌱 Emerging Bull−9.9%−18.8%
QTWOQ2Financial Services Software🌱 Emerging Bull−1.4%−2.0%
SSNCSS&C TechnologiesFinancial Services Software🌱 Emerging Bull+0.5%+1.8%
TYLTyler TechnologiesFinancial Services Software🌱 Emerging Bull−1.4%−30.6%

12-month price & trend

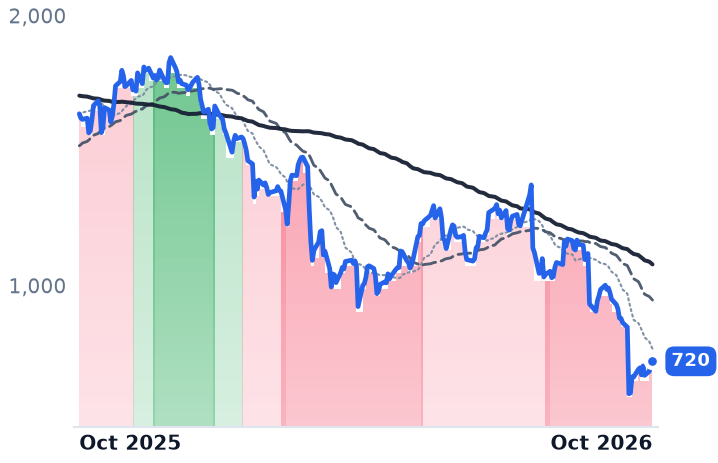
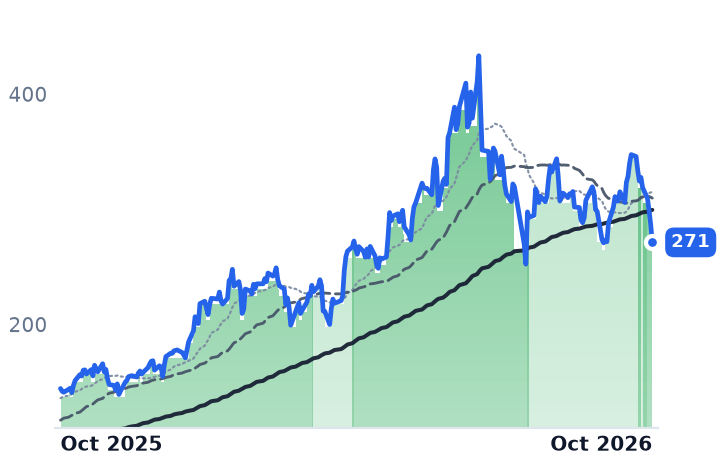
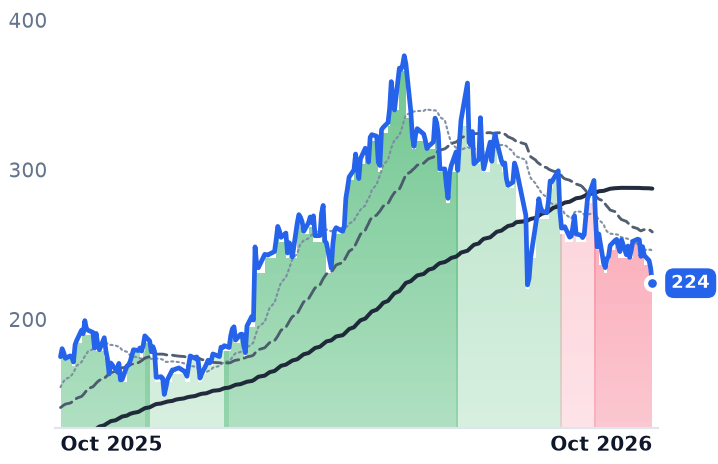
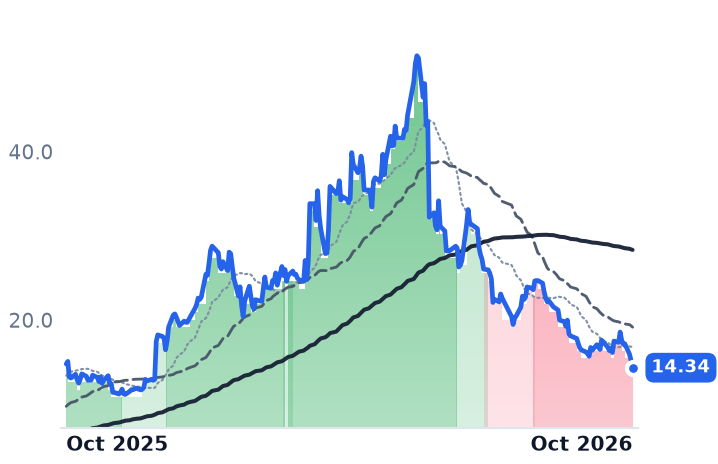
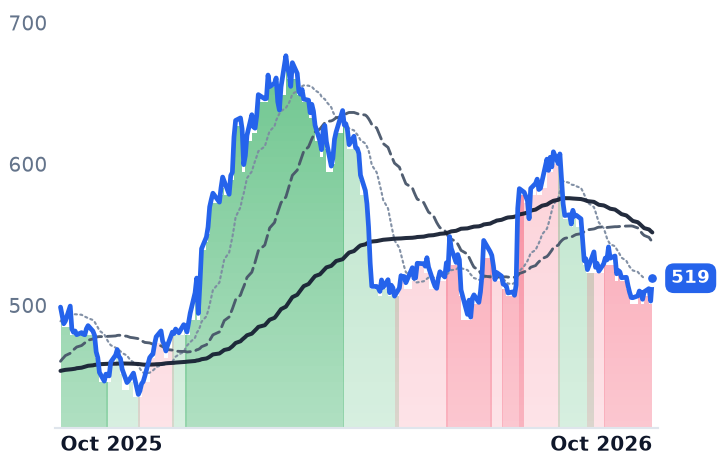
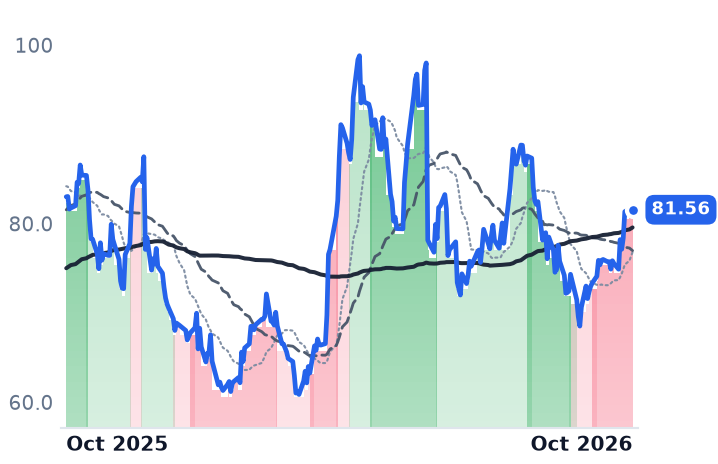
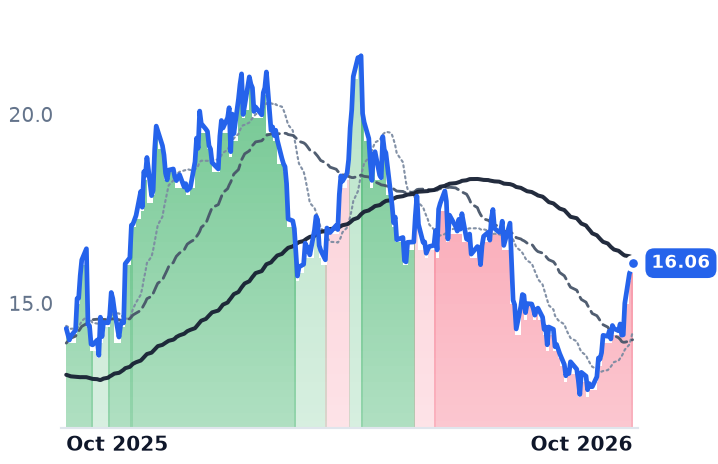
FICO
Fair Isaac
720
−9.50 (−1.30%)
vs. prior close
Price20d50d150d
FICO 12-month price
Financial Services Software
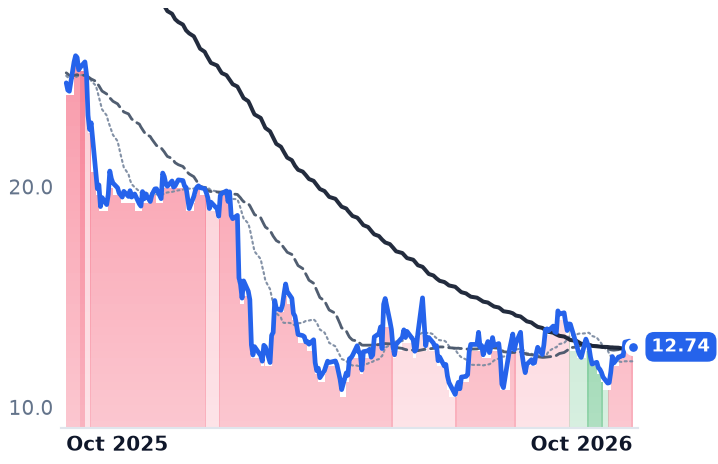
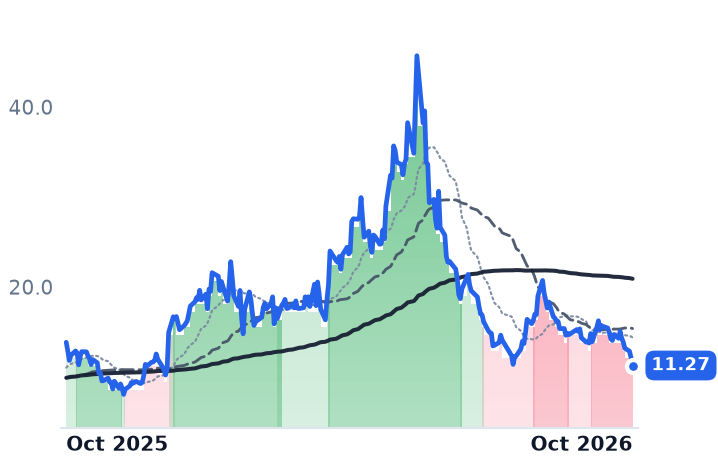
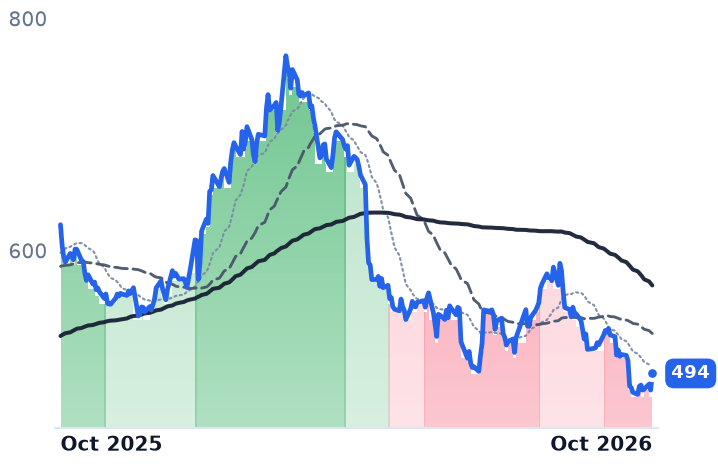
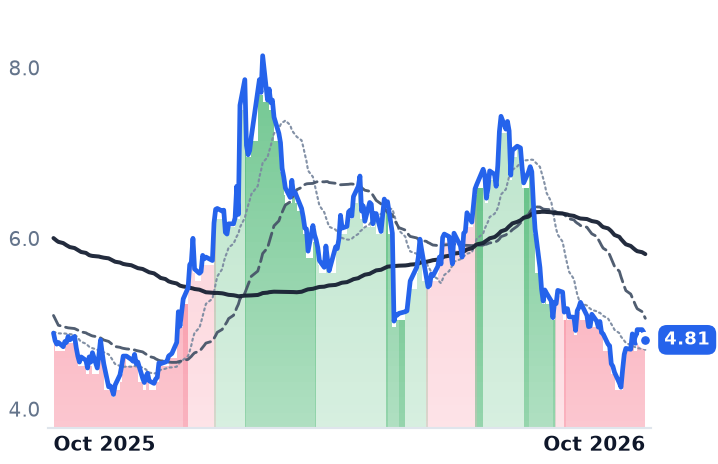
VERX
Vertex
12.74
−0.16 (−1.24%)
vs. prior close
Price20d50d150d
VERX 12-month price
Financial Services Software
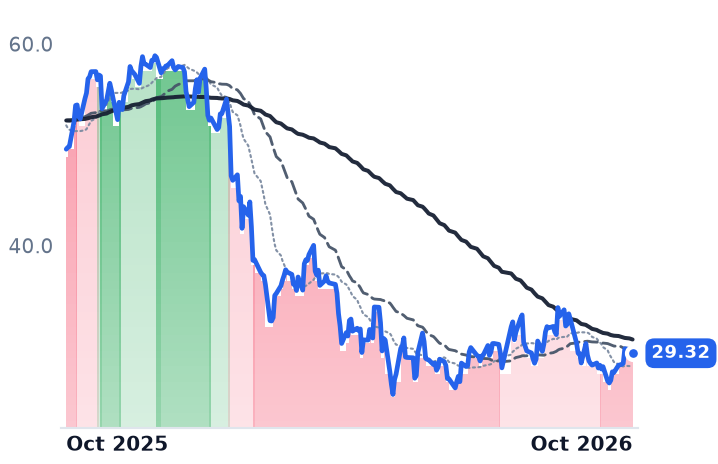
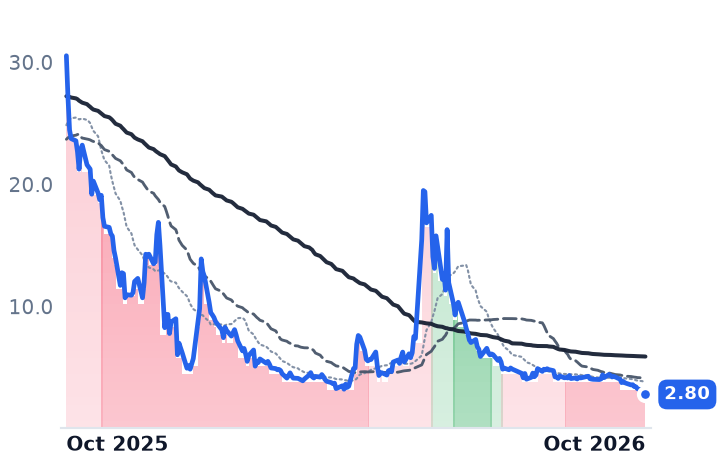
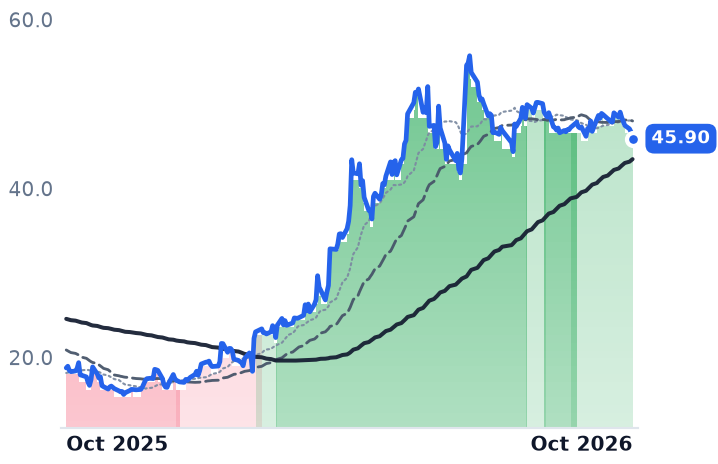
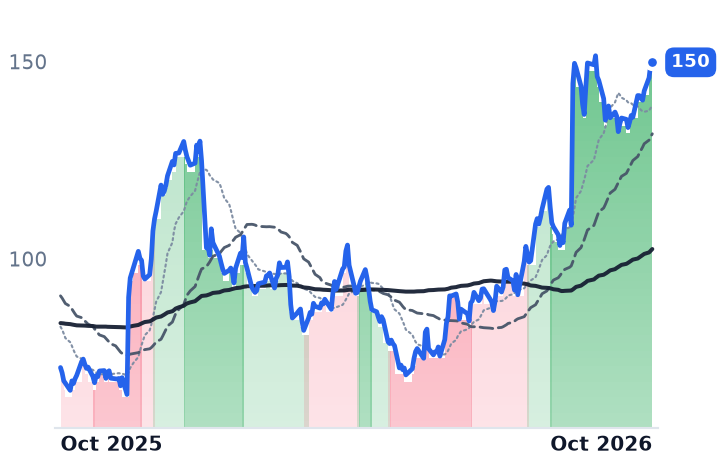
BL
BlackLine
29.32
−0.48 (−1.61%)
vs. prior close
Price20d50d150d
BL 12-month price
Financial Services Software
TickerMkt capP/EP/E fwdP/SP/S fwdP/GPP/GP fwdEV/EBITDAFCF yld
FICO$15.5B20.7x14.5x6.5x5.6x7.6x6.5x16.5x6.4%
VERX$2.1B416.3x15.5x2.6x2.5x4.2x4.0x41.6x2.8%
BL$1.7B49.8x11.8x2.3x2.2x3.1x3.0x21.4x9.9%
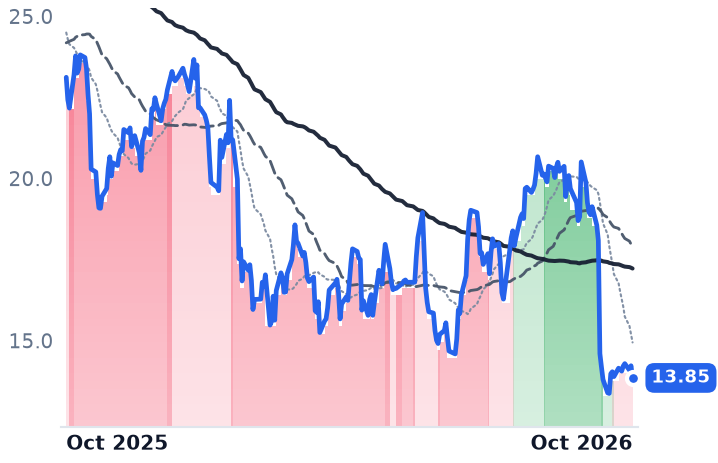
ALKT
Alkami Technology
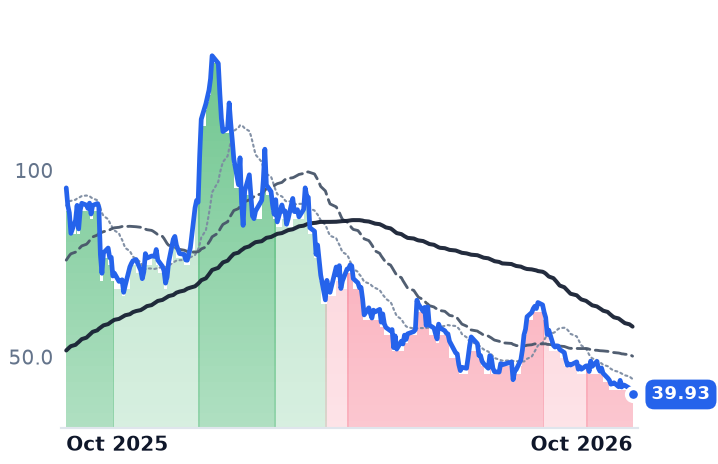
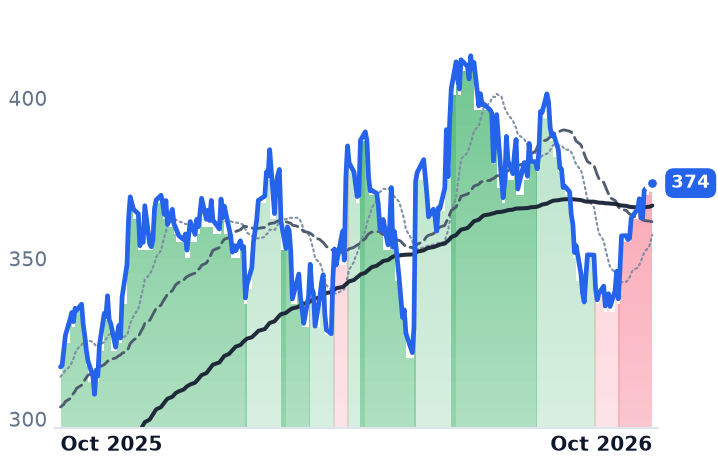
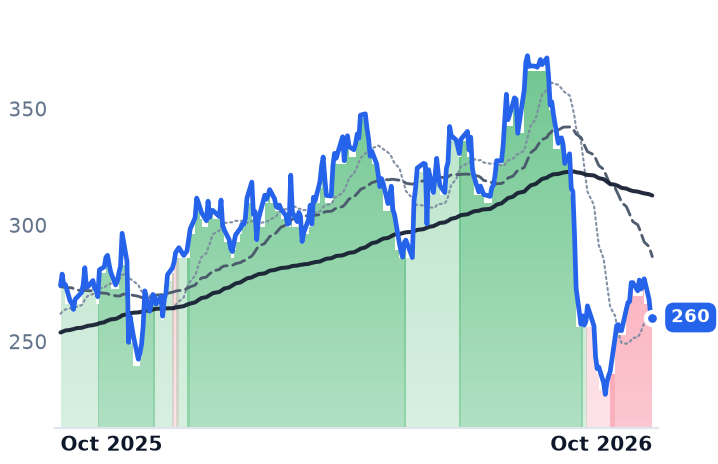
13.85
−0.38 (−2.64%)
vs. prior close
Price20d50d150d
ALKT 12-month price
Financial Services Software
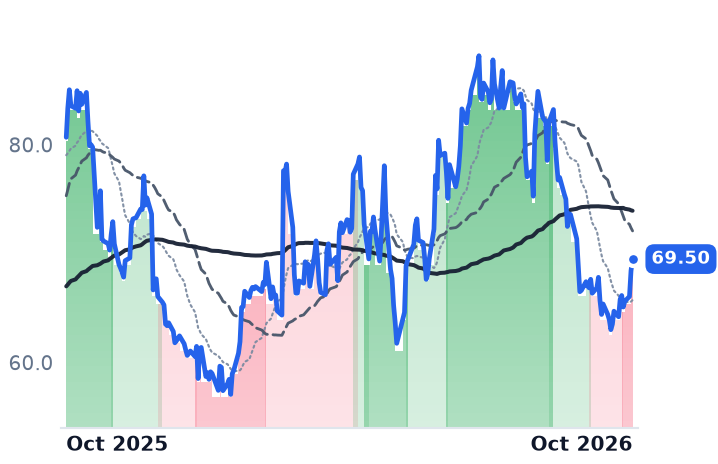
GWRE
Guidewire Software
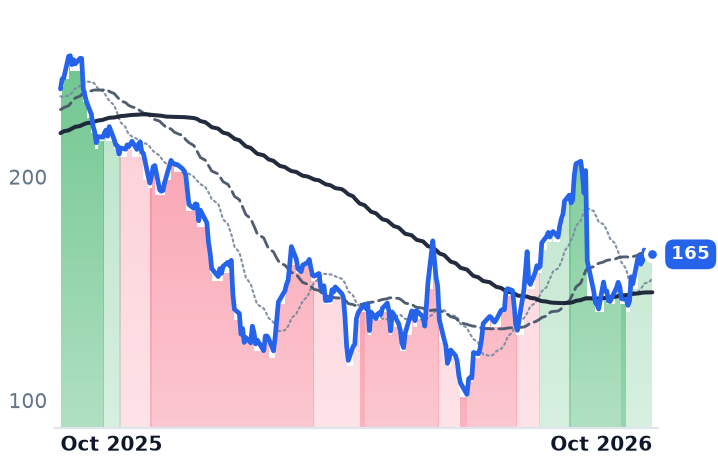
165
−0.18 (−0.11%)
vs. prior close
Price20d50d150d
GWRE 12-month price
Financial Services Software
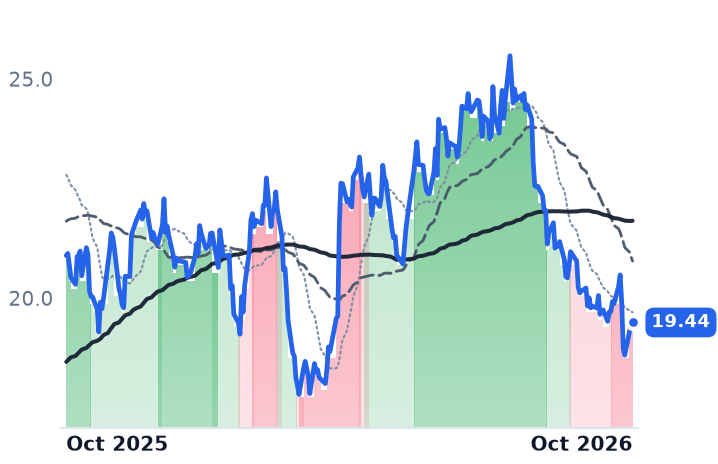
NCNO
nCino
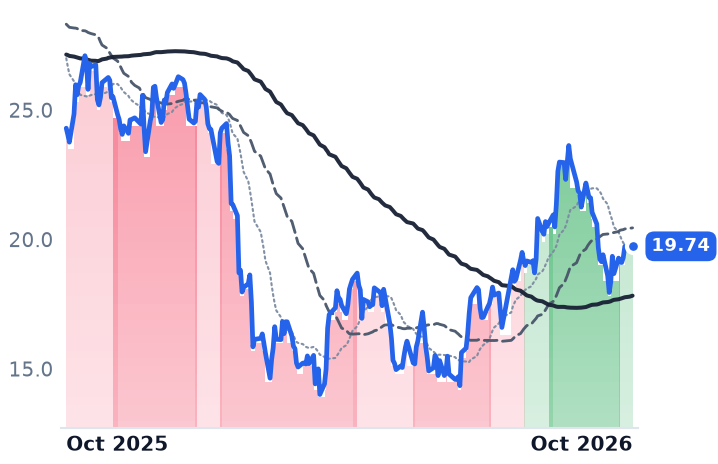
19.74
−0.01 (−0.08%)
vs. prior close
Price20d50d150d
NCNO 12-month price
Financial Services Software
TickerMkt capP/EP/E fwdP/SP/S fwdP/GPP/GP fwdEV/EBITDAFCF yld
ALKT$1.5Bn/m18.0x3.1x2.9x5.4x5.0xn/m4.3%
GWRE$14.0B101.9x40.1x9.5x8.1x14.8x12.7x67.0x2.1%
NCNO$2.2B63.6x15.1x3.5x3.3x5.6x5.4x26.1x6.1%
QTWO
Q2
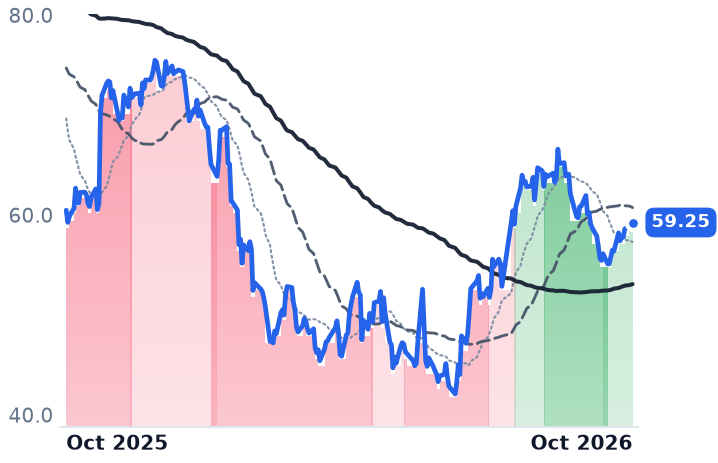
59.25
−0.45 (−0.75%)
vs. prior close
Price20d50d150d
QTWO 12-month price
Financial Services Software
SSNC
SS&C Technologies
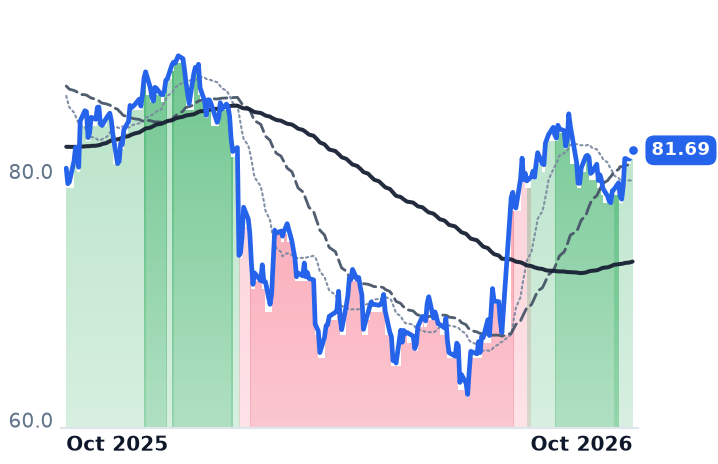
81.69
+0.47 (+0.58%)
vs. prior close
Price20d50d150d
SSNC 12-month price
Financial Services Software
TYL
Tyler Technologies
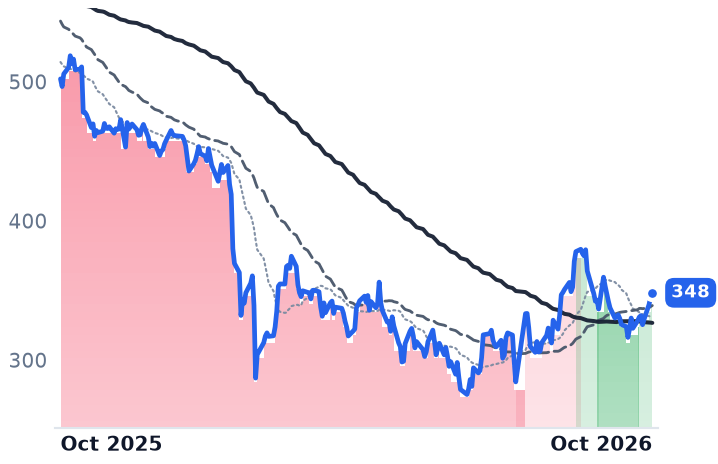
348
+2.64 (+0.76%)
vs. prior close
Price20d50d150d
TYL 12-month price
Financial Services Software
TickerMkt capP/EP/E fwdP/SP/S fwdP/GPP/GP fwdEV/EBITDAFCF yld
QTWO$3.7B39.9x20.4x4.4x4.2x7.6x7.3x24.4x5.5%
SSNC$18.7B22.3x11.2x2.8x2.8x5.9x5.7x11.7x9.4%
TYL$13.6B43.6x25.4x5.6x5.3x12.0x11.4x29.7x5.2%

Consensus projections

TickerFY2026EFY2027EFY2028E
FICORevenue+27.5%+10.0%+8.6%
EPS+45.1%+16.0%+13.8%
VERXRevenue+10.6%+10.5%+11.5%
EPS+28.4%+23.9%+21.1%
BLRevenue+9.5%+10.4%+10.3%
EPS+19.7%+10.9%+18.0%
ALKTRevenue+19.6%+16.7%+14.5%
EPS+51.0%+37.7%+21.9%
GWRERevenue+23.8%+17.2%+15.7%
EPS+41.5%+20.8%+27.4%
NCNORevenue+9.8%+9.0%+8.5%
EPS+25.2%+44.5%+20.0%
QTWORevenue+11.8%+10.1%+10.6%
EPS+22.1%+19.5%+32.6%
SSNCRevenue+8.6%+5.0%+4.8%
EPS+17.2%+9.6%+7.4%
TYLRevenue+8.8%+9.9%+8.9%
EPS+14.7%+17.5%+14.3%

Forward fiscal years only. Blank means no analyst coverage for that year.

Fair Isaac, the Bozeman, Montana company whose FICO credit scores lenders buy through Equifax, Experian and TransUnion, committed on 1 October to eliminating about 15% of its positions, a plan carrying roughly $27.0m of pre-tax charges in the fiscal fourth quarter, with affected employees notified from the week of 5 October. Ten days later the Mortgage Bankers Association cut the forecast that governs the company's largest profit line, putting 2027 originations by loan count at 5.0 million against the 5.3 million expected this year, with the 30-year mortgage rate averaging 7.3% in the current quarter and holding above 7% through next year.

September's collapse in the shares was read as a fight over which score lenders are allowed to use. The count is the other half of the machine. The royalty is a price Fair Isaac publishes multiplied by the number of times a lender pulls a score, and the company controls only the first term. The cost cut defends the margin on the dollars that arrive; it does nothing to the number of pulls, and that number is now forecast lower.

The June quarter was a price increase

How much of the growth was price is not a matter of inference. Scores revenue reached $458.9m in the June quarter from $324.3m, up 41%, with the business-to-business half up 49% "primarily attributable to a higher mortgage origination scores unit price"; mortgage-origination revenue rose 97% while mortgage score volumes grew low single digits. Mortgage was 62% of total Scores revenue. The list price behind that: Fair Isaac took its wholesale mortgage royalty from $4.95 to $10.00 a score for 2026, after moving it from $0.60 to $4.95 over the prior five years. A roughly 102% price step produced a 97% revenue gain, so units and mix contributed close to nothing.

The other business bears no resemblance to it. Software revenue grew 2% to $215m, with Platform annual recurring revenue up 62% to $413m and net retention of 148% on Platform against 82% on the older non-Platform book that is shrinking beneath it. One consolidated revenue line cannot say which half moved.

The $10 is harder to collect than it was

On 1 October the Federal Housing Finance Agency moved Fannie Mae and Freddie Mac to a single loan-level price adjustment grid for Classic FICO and VantageScore 4.0, removing a 20-point adjustment that had made the rival model's pricing less favorable. The bureaus that distribute FICO jointly own that rival: TransUnion has cut VantageScore 4.0 to $0.99 a score and supplies it free with a FICO purchase, and Equifax has priced it at $4.50 through end-2027, also free alongside FICO. Fair Isaac's answer routes around them: a direct licence for tri-merge resellers at $4.95 a score plus a $33 funded-loan fee, or $10 flat, the first option described by the company as a 50% reduction in average per-score fees into resellers.

"We're not crazy about lenders choice as a policy. We think it's bad policy because it encourages gaming," chief executive William Lansing said on the 29 July earnings call, adding that volumes were not falling, "which suggests that they're pulling both scores." Pulling both is what United Wholesale Mortgage has said it will do; Rocket Mortgage said in early October it will make VantageScore 4.0 its preferred model on all eligible loans from this quarter.

The cheap number nobody has cut

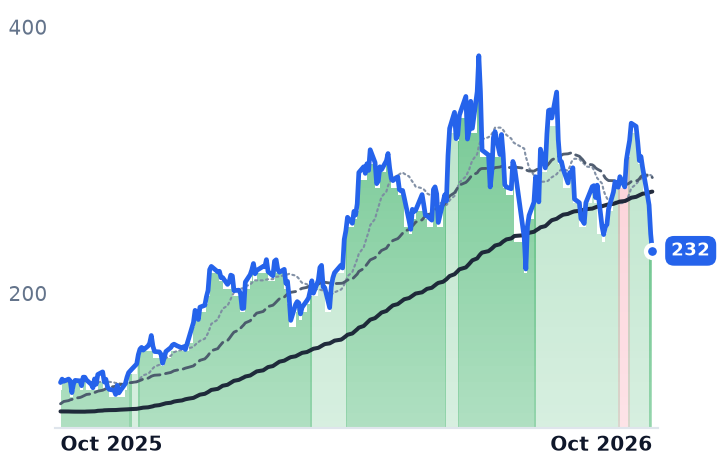
Nothing in the reported results explains the share price. Revenue grew 25.7% in the June quarter, operating margin widened to 53.8% from 48.9%, and diluted earnings were $10.45 against $7.40. The stock fell 16.7% on 4 September and 29.2% on 29 September, closed at $719.63 on 14 October, 56.4% below a year earlier, then rose 9.2% on 12 October and 6.75% on 13 October as Needham cut its target to $1,100 from $1,650 and Raymond James to $1,230 from $1,750 without cutting ratings.

So the de-rating is about the price list rather than the business as reported, and that is also what makes the valuation conditional. At 20.7x trailing earnings against roughly 62x in January, the shares have lost two-thirds of their multiple; the 14.5x forward figure is computed against a fiscal-2027 consensus of $49.65 a share that embeds the $10 score and has not been revised. Senator Josh Hawley asked the Federal Trade Commission on 23 March to investigate the price increases, a second claim on the same lever.

The fiscal fourth-quarter and full-year report is scheduled for 11 November. It is the first occasion on which Fair Isaac can publish a price list for next year, and the first look at score units since the largest retail mortgage lender in the country said it would prefer somebody else's model.
A 195-Week Wait for Gas Engines Caps Archrock's Fleet and Fills Enerflex's Order Book

Hypothesis Opus 5 · Research Opus 5 · Writing Opus 5 · Prompt v1.7

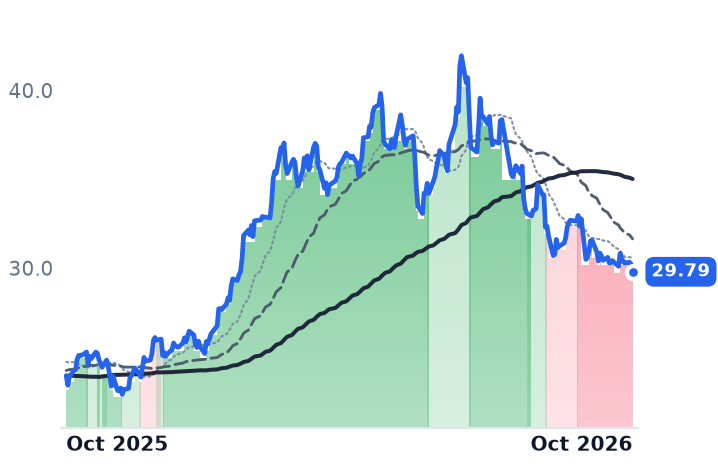
Two gas compression lessors have been marked down hard through the autumn while every meter that sets a compression dollar improved. Kodiak Gas Services' average price reached $23.80 per revenue-generating horsepower per month, up 4.5%, on 98.2% fleet utilisation and record quarterly adjusted EBITDA of $216.8m; Archrock's contract operations revenue rose 3% at a 71% adjusted gross margin.

What soured sits outside the lease: Archrock's parts-and-overhaul book fell 35% year on year, and make-ready and lube-oil costs took $30m off the top of its EBITDA guidance. Enerflex, filed on the same industry shelf, is a manufacturer rather than a lessor — its Engineered Systems backlog went from $1.1bn to $1.5bn — and the engine shortage that caps the lessors' fleet additions is what is filling its factories.

AROCKGSEFXTNGSUSACGas Compression LeasingReciprocating Engine ShortageHyperscale Power DemandPermian Horsepower DemandOilfield Aftermarket ServicesEngineered Systems Backlog
TickerCompanySegmentTrend · 13mo30D1Y
The subject · what this brief is about
AROCArchrockCompression & Gas Processing⚠️ Emerging Bear−2.6%+24.5%
KGSKodiak Gas ServicesCompression & Gas Processing⚠️ Emerging Bear−13.2%+49.3%
EFXTEnerflexCompression & Gas Processing⚠️ Emerging Bear+15.0%+136.3%
Compared against · context, not the story
NGSNatural Gas ServicesCompression & Gas Processing⚠️ Emerging Bear−11.8%+21.6%
USACUSA Compression PartnersCompression & Gas Processing⚠️ Emerging Bear−5.6%+15.2%

12-month price & trend

AROC
Archrock
29.79
−0.44 (−1.47%)
vs. prior close
Price20d50d150d
AROC 12-month price
Compression & Gas Processing
KGS
Kodiak Gas Services
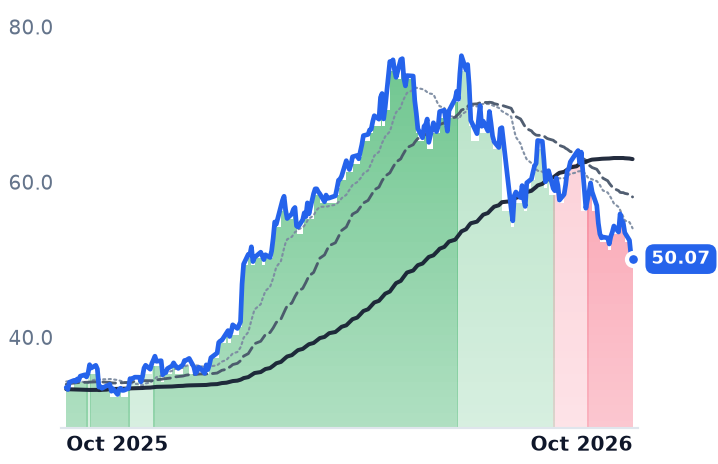
50.07
−0.46 (−0.90%)
vs. prior close
Price20d50d150d
KGS 12-month price
Compression & Gas Processing
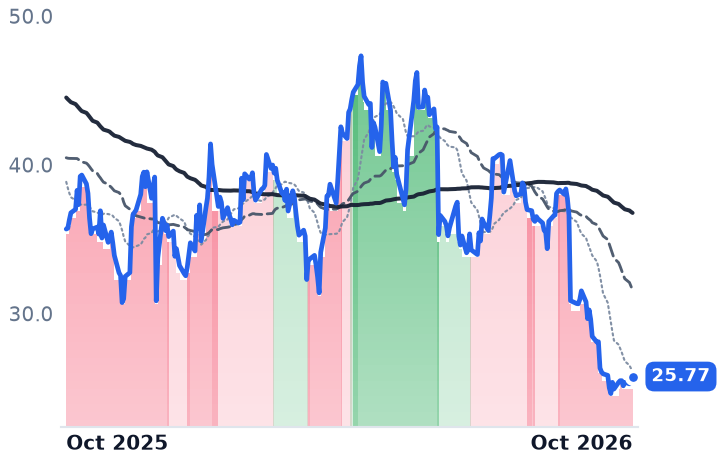
EFXT
Enerflex
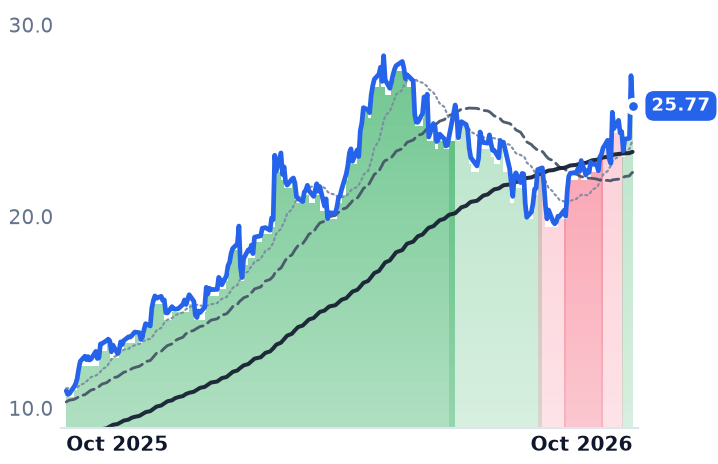
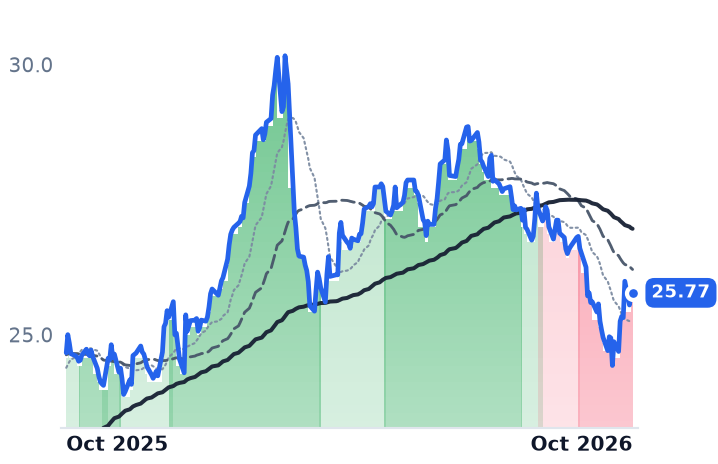
25.77
−1.58 (−5.78%)
vs. prior close
Price20d50d150d
EFXT 12-month price
Compression & Gas Processing
TickerMkt capP/EP/E fwdP/SP/S fwdP/GPP/GP fwdEV/EBITDAFCF yld
AROC$5.2B16.0x17.3x3.5x3.4x6.0x5.9x9.4x5.6%
KGS$5.1B56.9x25.3x3.6x3.3x9.1x8.3x8.3x0.1%
EFXT$3.1B47.8x13.3x1.1x0.9x4.8x4.0x7.8x9.6%
NGS
Natural Gas Services
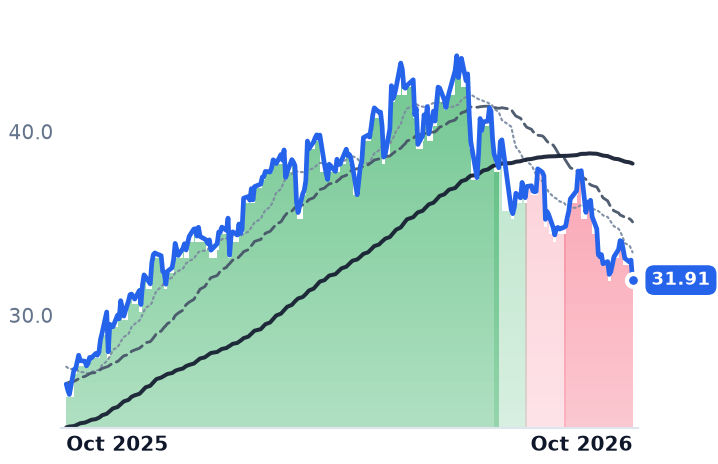
31.91
−1.09 (−3.30%)
vs. prior close
Price20d50d150d
NGS 12-month price
Compression & Gas Processing
USAC
USA Compression Partners
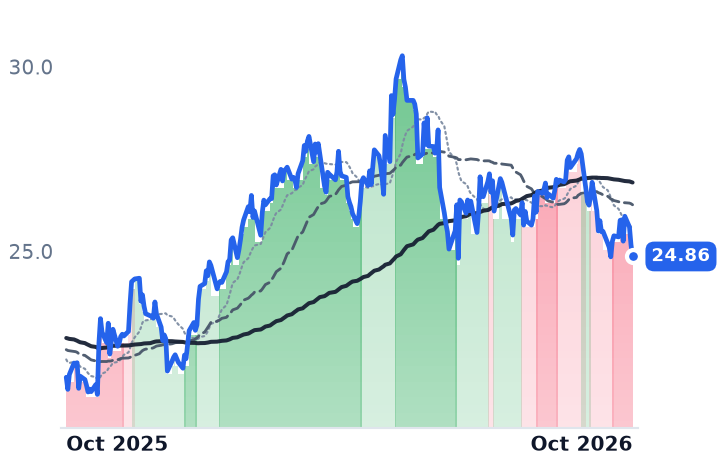
24.86
−0.31 (−1.25%)
vs. prior close
Price20d50d150d
USAC 12-month price
Compression & Gas Processing
TickerMkt capP/EP/E fwdP/SP/S fwdP/GPP/GP fwdEV/EBITDAFCF yld
NGS$481.1M23.4x21.9x2.5x2.2x5.7x5.1x7.8x-6.5%
USAC$4.0B25.9x21.5x3.4x2.9x7.6x6.5x10.4x7.7%

Consensus projections

TickerFY2026EFY2027EFY2028E
AROCRevenue+1.9%+7.6%+7.7%
EPS+9.4%+19.2%+15.9%
KGSRevenue+16.3%+14.9%+17.6%
EPS+77.8%+43.1%+38.7%
EFXTRevenue+0.8%+11.7%+31.6%
EPS+23.0%+37.5%+39.5%
NGSRevenue+25.8%+18.8%+8.3%
EPS+7.2%+45.8%+14.5%
USACRevenue+37.8%+6.9%+4.6%
EPS+38.5%+26.7%+20.0%

Forward fiscal years only. Blank means no analyst coverage for that year.

Gas engines for new compressor packages now take about 195 weeks to arrive, and the orders going in are for 2029 delivery. Brad Childers, Archrock's president and chief executive, told investors as much on the company's August call: "For equipment required, lead times are now at 195 weeks with ordering for 2029." The cause sits outside the oilfield. Hyperscale data-centre demand has pushed engine manufacturers to full production, limiting engine availability for the gas compression industry, where waits traditionally ran 40 to 60 weeks.

That one constraint splits a group the market prices as a single shelf. Archrock and Kodiak Gas Services lease horsepower by the month and have been read as geared to the gas price and the drill bit; both inputs moved the wrong way for that reading. Henry Hub was $3.03 per million British thermal units on 6 October, down 8.7% from a year earlier, while the US rig count reached 603, some 56 rigs above last year, with the Permian at 274. Meanwhile the numbers that actually set a lease dollar went up.

A compression dollar is a monthly fee, and the fee rose

Revenue in contract compression is three numbers multiplied: horsepower on revenue-generating contracts, a monthly rate per horsepower, and utilisation. Kodiak, the large-horsepower operator concentrated in the Permian Basin, reported average pricing of $23.80 per revenue-generating horsepower per month in the June quarter, up 4.5% year on year, with compression fleet utilisation at 98.2% against 97.2% and compression adjusted gross margin 1.7 points wider at 70%. Adjusted EBITDA of $216.8m was a company record, up 22%, and Kodiak raised full-year EBITDA and discretionary cash flow guidance in the same release.

Archrock, which operates roughly 35% of the US outsourced compression market, showed the same shape. Contract operations revenue rose 3% to $329.3m, period-end utilisation was 94.4%, and adjusted gross margin was 71% against 70%; the operating fleet shrank from 4.7m horsepower to 4.5m because Archrock sold about 165,000 non-strategic horsepower. The same release disclosed an agreement with an existing strategic customer covering approximately 665,000 horsepower on an eight-year base term with a two-year extension. Compression demand follows the producing well count and the rising gas-to-oil ratio of ageing Permian wells, which calls for more horsepower per barrel even when the oil rig count flattens.

Archrock's shortfall sat in parts and overhauls

Where Archrock did disappoint, the mechanism lives away from the lease. Aftermarket services, the parts and maintenance book billed on customer-owned units, took $42.0m against $64.8m a year earlier, about 11% of group revenue; the company attributed the fall to the absence of non-recurring sales of overhauled engines and to customers skipping the usual mid-year maintenance uptick. Full-year aftermarket revenue is guided to $175m-$185m. The top of EBITDA guidance came down to $885m from $915m on four items: make-ready cost to put idle units back to work, second-half lube-oil pressure, the weaker aftermarket and higher long-term incentive compensation. Contract operations margin guidance held at 71.0%-71.5%. Childers called 2026 "a bit like the calm before the storm".

Enerflex sells what the lessors cannot get

Enerflex earns its money the other way: it manufactures compression and gas-processing packages, recognising Engineered Systems revenue as projects are built, and separately owns build-own-operate infrastructure carrying about $1.2bn of contracted revenue. Engineered Systems bookings were $488m in the June quarter against a trailing eight-quarter average of $363m, a 1.5x book-to-bill for the first half, with backlog up to $1.5bn from $1.1bn at the end of 2025. Then came the power awards: 450 MW of gas-fired generation for a North American data-centre developer on 1 October, and on 13 October more than a gigawatt, taking behind-the-meter backlog above 1.75 GW with deliveries through 2028. Enerflex also authorised roughly $85m of extra Engineered Systems facility investment, mostly for 2027 — a manufacturer adding factory capacity while the lessors stand in the engine queue.

The shares have moved accordingly. Over the three months to 14 October Archrock fell 22.7% and Kodiak 27.5%, while Enerflex rose 6.2% and has been in an uptrend since 7 October. Archrock's turn came at the earnings event itself, from $35.74 on 4 August to $33.08 on 7 August. Kodiak sits 34% below its twelve-month high and 29.5% below the $71.00 at which it sold 10.56m shares for about $758m in May, a raise that lifted diluted shares 10.6% in one quarter to 96.8m.

Cheaper than May, and one of them cheaper still

Archrock at $29.79 trades at 5.97x trailing gross profit, against 7.12x in May, on 9.4x trailing EV/EBITDA and a 5.6% free cash flow yield. Kodiak's forward price-to-earnings is 25.3x, against roughly 29x in May; the honest offset is a 0.10% trailing free cash flow yield and credit-agreement leverage of 3.2x, the cost of a fleet in growth mode.

Enerflex, up 137.5% over twelve months, is the cheapest of the three on price-to-gross-profit at 4.05x forward. That is the comparable measure because the margins differ by a factor of three: 23.9% gross margin at Enerflex against Archrock's disclosed 71% adjusted figure makes price-to-sales meaningless across them.

So the lessors' autumn is a change in what the market will pay for horsepower rather than a change in what horsepower earns. What the results do explain is narrower and real: Archrock's second, thinner dollar shrank by a third, and Kodiak's fastest-growing line is its least profitable, with Other Services revenue up 47% to $43.1m and guided at a 13%-16% adjusted gross margin against 70% on the lease, so mix alone can move reported margin. Kodiak's power optionality is also unsigned. Of the West Texas data-centre project, chief executive Mickey McKee said on the August call: "We've invoiced them for an initial deposit to reserve power equipment for the project while we negotiate a long-term contract." Neither lessor has reported since; Archrock's quarter is expected around 27 October and Kodiak's around 3 November.

Archrock says the industry needs roughly a million more horsepower to meet forecast gas demand growth by the end of the decade, and has set out growth capital predominantly for large-horsepower and electric-motor-drive units. The engines for it are already on order. Whoever holds a place in that queue sets the next lease rate.

Texas Pacific Land Set Royalty and Water Records in a Quarter That Missed on Revenue

Hypothesis Opus 5 · Research Opus 5 · Writing Opus 5 · Prompt v1.7

A West Texas landowner that drills nothing and operates almost nothing has lost a third of its market value since February while every meter inside the business improved. Texas Pacific Land's royalty production reached a record 39,700 barrels of oil equivalent a day in the June quarter, up 20% from a year earlier, produced-water royalty volumes hit a record, operating margin widened to 78.0%, and revenue growth has accelerated for four straight quarters to 31.2%. The reported revenue line still came in under consensus, and the shares fell 12.1% in two sessions.

With oil near $94 a barrel, the commodity does not explain the de-rating; what has been taken out is the un-contracted data-center land premium added in February. LandBridge, which owns the same basin's surface and almost none of its minerals, is up 60% over twelve months and is now priced against gross profit almost identically to the company with the royalty barrels.

TPLLBVMCPermian Royalties & MineralsProduced-Water InfrastructureData-Center Land & PowerSurface Acreage MonetizationPermian Rig Activity
TickerCompanySegmentTrend · 13mo30D1Y
The subject · what this brief is about
TPLTexas Pacific LandRoyalty & Mineral Interests🔴 Cont. Bear−4.6%+15.1%
LBLandBridge Company LLCProduction Infrastructure🟢 Cont. Bull−5.2%+56.1%
Compared against · context, not the story
VMCVulcan MaterialsAggregates & Concrete⚠️ Emerging Bear−4.0%−20.8%

12-month price & trend

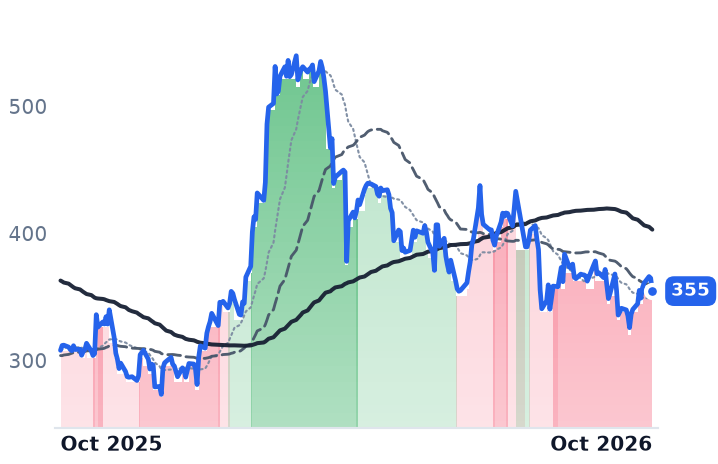
TPL
Texas Pacific Land
355
−10.17 (−2.79%)
vs. prior close
Price20d50d150d
TPL 12-month price
Royalty & Mineral Interests
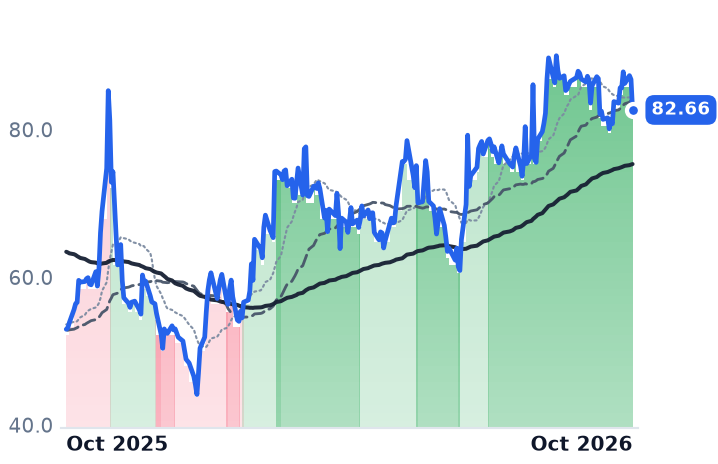
LB
LandBridge Company LLC
82.66
−4.13 (−4.76%)
vs. prior close
Price20d50d150d
LB 12-month price
Production Infrastructure
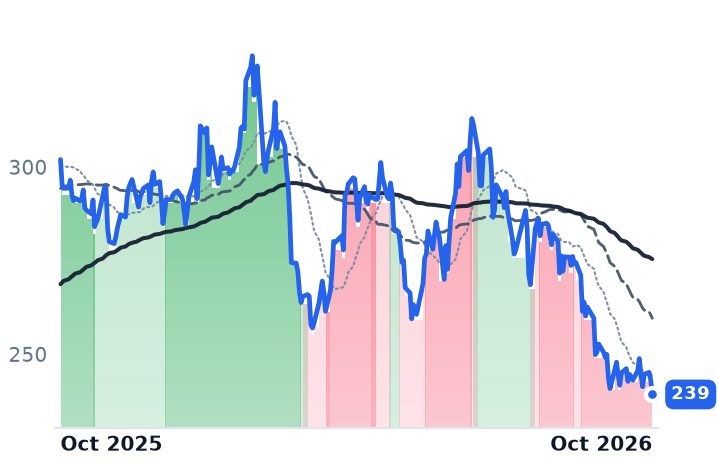
VMC
Vulcan Materials
239
−3.86 (−1.59%)
vs. prior close
Price20d50d150d
VMC 12-month price
Aggregates & Concrete
TickerMkt capP/EP/E fwdP/SP/S fwdP/GPP/GP fwdEV/EBITDAFCF yld
TPL$24.5B45.2x38.1x27.2x24.2x31.8x28.2x31.5x2.2%
LB$6.4B36.6x44.6x28.3x25.1x30.6x27.2x46.1x2.7%
VMC$31.3B28.4x27.0x3.9x3.9x14.1x14.1x14.1x3.3%

Consensus projections

TickerFY2026EFY2027EFY2028E
TPLRevenue+27.2%+12.0%+8.4%
EPS+33.3%+11.0%−100.0%
LBRevenue+73.3%+30.5%+24.1%
EPS+37.6%+32.5%+26.4%
VMCRevenue+1.9%+5.4%+6.1%
EPS+6.4%+15.7%+14.8%

Forward fiscal years only. Blank means no analyst coverage for that year.

Texas Pacific Land owns roughly 880,000 acres of West Texas surface and a perpetual, cost-free royalty on much of the oil and gas produced beneath it. In August the company reported the best quarter in its history on every operating measure it discloses, and the shares fell 12.1% across the two sessions that followed.

The gap was in the top line. Revenue of $246.1m came in under a consensus near $255.5m because water-services revenue slipped and a land-sale gain that had lifted the prior quarter did not repeat. Underneath it, net income was $153.9m, free cash flow $155.5m, and royalty production averaged a record 39,700 barrels of oil equivalent a day, up 20% from a year earlier.

The de-rating is longer than one print. From a $531.95 close on 24 February the stock reached $354.57 on 14 October, a third lower, and it has been in a downtrend since mid-August. February's run — 85% in under two months from the end of 2025 — followed the company's $50m commitment to Bolt Data & Energy, co-founded by former Google chief executive Eric Schmidt, for which it took equity, warrants, the right to supply land, and first refusal on water for Bolt's data centers; KeyBanc initiated at Overweight with a $1,050 target. What the past eight months have removed is that un-contracted land option, while the royalty business accelerated beneath it.

Three unlike dollars in one line

The revenue line cannot settle the question because three different businesses report into it. The royalty is a fractional interest — about 85,000 acres at a 1/128th rate and 371,000 acres at 1/16th — with no vote over when a well gets completed. Water is a separate dollar: brackish sales ran 663,000 barrels a day in the quarter, down 19% sequentially but up 38% year on year, and produced-water royalties on disposal volumes reached a record 4.9m barrels a day, generating $37.1m. Across the first half, water was $165.5m against $317.4m of land and resource revenue.

The contracted land dollar barely registers at all. Easements and surface income doubled to $5.4m. The June agreement to supply land and water to Chevron's Project Kilby, a 2.67 GW gas plant in Reeves County built with Microsoft, carries aggregate consideration of $42.5m — a nominal cash payment plus annual payments running through 2046. A twenty-year annuity is close to invisible in any single quarter.

Fewer rigs, more barrels

The obvious volume worry does not hold either. The Permian rig count was 242 on 30 January, down 20% from 303 a year earlier, and Texas permit applications fell to 570 in April, the fewest since February 2021. Royalty production on Texas Pacific Land's acreage rose 20% anyway. Nor is this the oil tape: WTI traded near $94 a barrel on 14 October after strikes on Saudi facilities and tankers in Hormuz. "Our unhedged royalty position allowed us to benefit fully from the strong oil price environment," chief executive Tyler Glover said on the 6 August call.

The same dirt, bought at a different price

LandBridge, which manages over 325,000 surface acres in and around the Delaware Basin and holds only a small royalty collection, reported the same day and rose 6.0% the next session. Its quarter: revenue $66.8m, up 41%, with surface-use royalties and revenue of $52.2m against $34.2m a year earlier — 78% of the top line, driven mainly by produced-water handling volumes. Free cash flow of $40.2m grew 11%. Growth is partly bought: full-year 2025 revenue of $199.1m was up 81%, and the company agreed to pay $20m for 560 acres under a Lea County landfill. Five Point's holding vehicle still controls about 63.1% of the vote after a November secondary at $71.00, and a Class A reporting change makes its own earnings-per-share series non-comparable quarter to quarter.

Both run near-pure land margins, 88.5% gross at Texas Pacific Land and 96.3% at LandBridge, so price against gross profit is the comparison that survives the structural differences: 31.8x and 30.6x trailing. The quarry operator Vulcan Materials sits at 14.1x. Eight months of trading have brought the royalty owner and the surface owner to the same price for a dollar of land profit, having taken it from the one that collects barrels and given it to the one that does not.

That is where the results stop explaining the move. Earnings grew while the trailing multiple fell from 61.8x in early May to 45.2x, and market value from $29.7bn to $24.5bn; consensus still carries $1,010m of 2026 revenue and $9.30 of earnings per share. A business compounding at 31% with zero debt, $247.6m of cash and a 12.5% dividend increase is not the thing being marked down. The asset being marked down is a gigawatt pipeline no one has signed — and LandBridge's version of it, a long-term option on up to 3,400 Reeves County acres with PowerBridge, is being paid for in full.

Glover told investors on 6 August: "I would be disappointed if we don't announce at least one or more major definitive agreements in the near term." The acreage either converts into signed leases or it goes back to being what it has been since 1888 — ground other people's capital pays to cross.

Delta and United Carry the Fuel Risk on Four-Fifths of SkyWest's Revenue

Hypothesis Opus 5 · Research Opus 5 · Writing Opus 5 · Prompt v1.7

Jet fuel in the US Gulf has nearly doubled in a year, and the regional carrier that flies for Delta, United, American and Alaska has been the steadiest airline on the board while its own customers' shares fell by a fifth and more. The reason is contractual rather than commercial: SkyWest is paid a fixed monthly rate per contracted aircraft plus a rate per block hour, and the partner usually buys the gas.

That covered $864m of SkyWest's $1,102.8m June-quarter revenue. The exposed slice is the prorate and charter flying where SkyWest sells the ticket and buys the fuel itself, 18.2% of revenue and growing 38%, and management recovered only about 60% of the fuel increase there. It is enough to turn rising block hours into falling profit: operating income was down 8.4% year on year, at 8.7x forward earnings against Delta's 14.0x.

SKYWRJETDALALGTUALALKAALSNCYJet Fuel CostsCapacity Purchase AgreementsRegional Feeder FlyingRegional Jet FleetsLegacy Carrier Margins
TickerCompanySegmentTrend · 13mo30D1Y
The subject · what this brief is about
SKYWSkyWestRegional & Emerging Airlines🟢 Cont. Bull−4.5%−10.0%
RJETRepublic AirwaysRegional & Emerging Airlines⚠️ Emerging Bear−8.5%−26.2%
SNCYSun Country AirlinesRegional & Emerging Airlines🟢 Cont. Bull—+38.1%
Compared against · context, not the story
DALDelta Air LinesMajor Network Carriers🟢 Cont. Bull−3.3%+24.7%
ALGTAllegiant TravelLow-Cost Carriers⚠️ Emerging Bear−14.9%+1.4%
UALUnited AirlinesMajor Network Carriers🟢 Cont. Bull−7.8%−5.3%
ALKAlaska AirOther🔴 Cont. Bear−9.9%−26.4%
AALAmerican AirlinesMajor Network Carriers⚠️ Emerging Bear−7.7%−5.7%

12-month price & trend

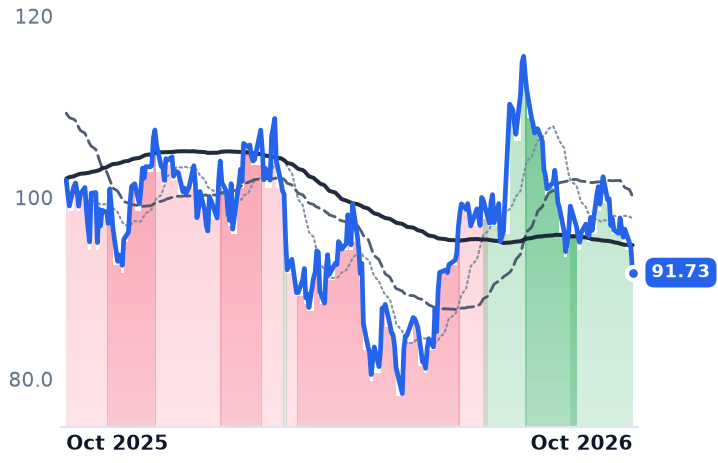
SKYW
SkyWest
91.73
−2.58 (−2.74%)
vs. prior close
Price20d50d150d
SKYW 12-month price
Regional & Emerging Airlines
RJET
Republic Airways
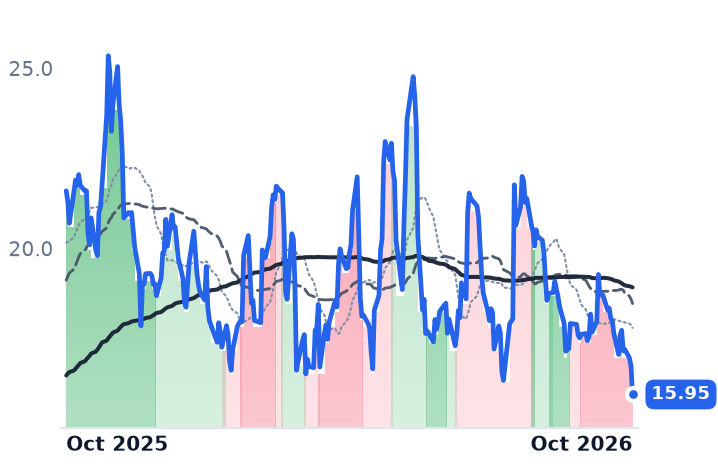
15.95
−0.79 (−4.72%)
vs. prior close
Price20d50d150d
RJET 12-month price
Regional & Emerging Airlines
DAL
Delta Air Lines
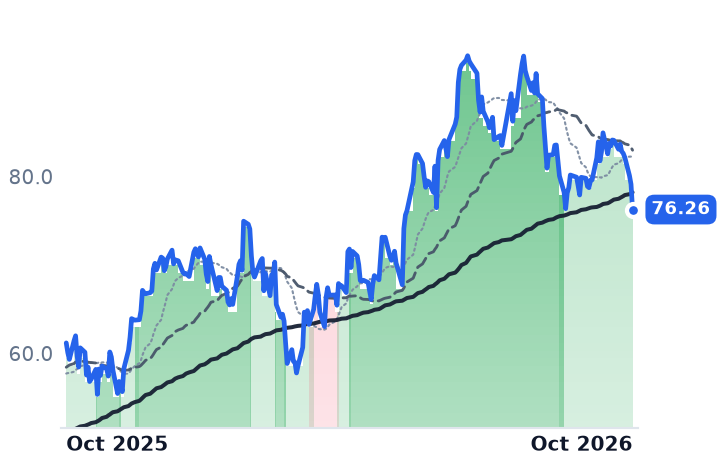
76.26
−2.86 (−3.62%)
vs. prior close
Price20d50d150d
DAL 12-month price
Major Network Carriers
TickerMkt capP/EP/E fwdP/SP/S fwdP/GPP/GP fwdEV/EBITDAFCF yld
SKYW$3.6B9.0x8.7x0.9x0.8x1.2x1.2x5.9x8.8%
RJET$737.9Mn/m—0.4x—1.7x—6.8x-5.8%
DAL$50.4B15.2x14.0x0.7x0.8x2.3x2.5x8.9x11.3%
ALGT
Allegiant Travel
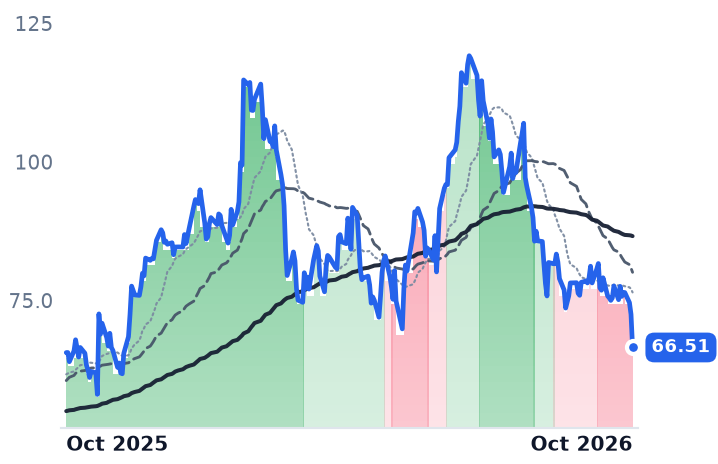
66.51
−5.98 (−8.25%)
vs. prior close
Price20d50d150d
ALGT 12-month price
Low-Cost Carriers
UAL
United Airlines
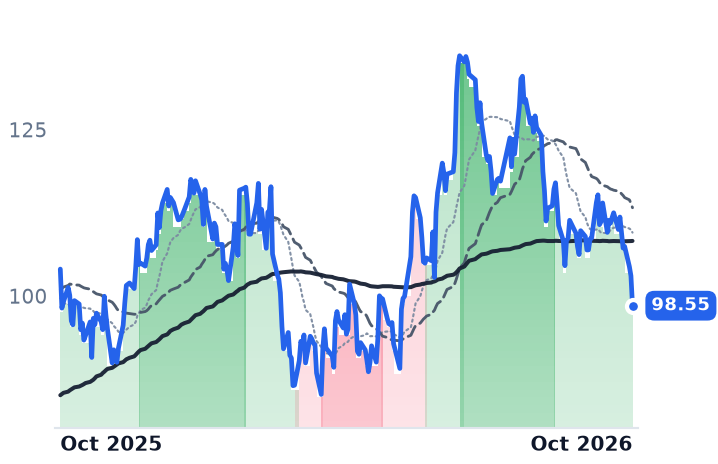
98.55
−4.49 (−4.36%)
vs. prior close
Price20d50d150d
UAL 12-month price
Major Network Carriers
ALK
Alaska Air
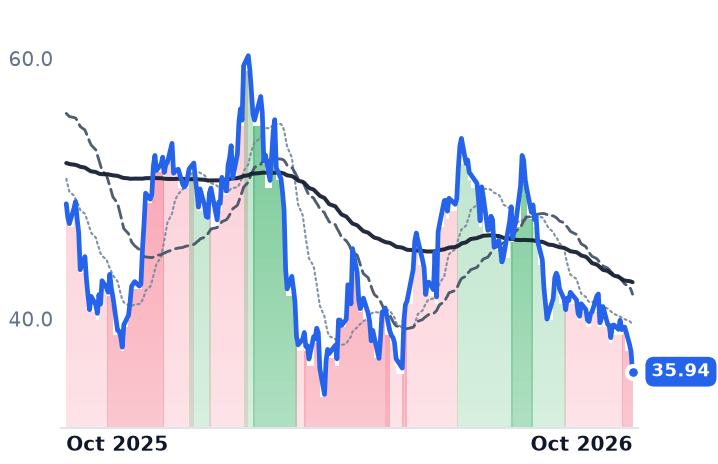
35.94
−1.57 (−4.19%)
vs. prior close
Price20d50d150d
ALK 12-month price
Other
TickerMkt capP/EP/E fwdP/SP/S fwdP/GPP/GP fwdEV/EBITDAFCF yld
ALGT$1.8B47.1x11.9x0.6x0.5x1.4x1.1x10.2x6.5%
UAL$32.1B9.2x12.3x0.5x0.5x0.8x0.7x6.7x7.9%
ALK$4.1B57.8x—0.3x0.3x0.4x0.3x9.3x-11.6%
AAL
American Airlines
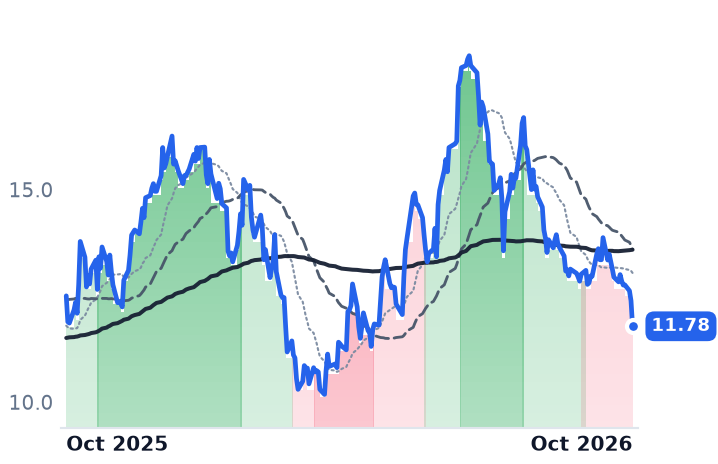
11.78
−0.60 (−4.85%)
vs. prior close
Price20d50d150d
AAL 12-month price
Major Network Carriers
SNCY
Sun Country Airlines
Price20d50d150d
SNCY 12-month price
Regional & Emerging Airlines
TickerMkt capP/EP/E fwdP/SP/S fwdP/GPP/GP fwdEV/EBITDAFCF yld
AAL$8.1B40.3x—0.1x0.1x0.7x0.6x10.1x13.5%
SNCY$876.4M21.6x20.5x0.8x0.7x1.2x1.1x5.7x8.2%

Consensus projections

TickerFY2026EFY2027EFY2028E
SKYWRevenue+8.5%+5.8%+4.2%
EPS+3.5%+14.6%+11.1%
DALRevenue+14.6%+6.7%+4.2%
EPS−5.4%+37.0%+31.9%
ALGTRevenue+43.5%+22.1%+5.2%
EPS+91.2%+74.7%+42.9%
UALRevenue+15.9%+6.3%+4.9%
EPS−23.8%+60.0%+38.2%
ALKRevenue+10.8%+6.0%+6.3%
EPS−138.6%−861.0%+36.7%
AALRevenue+14.0%+4.1%+5.3%
EPS−128.6%−1506.1%+38.4%
SNCYRevenue+11.8%+6.8%+9.2%
EPS−26.0%+112.6%+32.3%

Forward fiscal years only. Blank means no analyst coverage for that year.

SkyWest flies 517 regional jets in four other airlines' liveries, and on the contracts that produce most of its revenue the carrier whose name is on the fuselage buys the fuel. That arrangement is why a company sitting inside an energy shock has been the calmest airline on the American board. In the three months to October 14, SkyWest shares fell 5.6%, while Delta fell 10.8%, United 18.1% and American 24.8%.
The outperformance has been read as insulation. It is mostly real, and the fifth of the business the contract does not cover is where SkyWest's earnings are going.

How a regional dollar actually gets paid

SkyWest Airlines, the St. George, Utah operator that flies passenger and cargo service under the Delta, United, American and Alaska codes, is paid under capacity purchase agreements: a fixed rate per contracted aircraft each month plus variable rates per block hour and departure. The major owns the ticket and the route decision. In the June quarter, contract revenue was $864m of $1,102.8m in total, or 78.4%. A fare war does not reach that line, and neither does $4.34-a-gallon jet fuel, nearly double the $2.19 of a year earlier, which took Delta's full-year adjusted earnings guidance down to $5.10–$5.60 a share from $6.50–$7.50.

What SkyWest sells instead is hours. Block hours rose 5.4% year on year and pre-tax income of $139m ran 29% above the March quarter on a 9% sequential gain in hours. "Our block hour production outlook remains solid, as we prepare to invest in owning and operating 34 more E175s through the end of 2028," chief executive Chip Childs said in the July 23 release. Capacity is also coming from reseating metal SkyWest already owns: CRJ550 revenue hours reached 28,102 in the first half against 16,268 a year earlier, and a 41-seat CRJ450 conversion is due in scheduled service by the end of 2026.

The slice that buys its own gas

Prorate and charter flying, where SkyWest takes the fare and the fuel risk, rose $55.4m to $201m, up 38.1%, lifting that share of revenue to 18.2% from roughly 13%. On the second-quarter call management said prorate fuel expense nearly doubled and that strong demand let the company recover about 60% of the fuel increase in fares. The uncovered remainder, plus higher hiring and training cost, is why revenue growth decelerated to 6.5% from 15.0% in the September 2025 quarter while operating income fell 8.4% and net income 16.3%. Operating margin, at 14.1%, is about 2.5 points below the year-ago quarter.

The customer list is the other exposure. Of aircraft in scheduled service or under contract at June 30, 46.2% flew for United, 26.9% for Delta, 18.6% for American and 8.3% for Alaska. The contraction already disclosed is at Delta: 19 Delta-owned CRJ900s that SkyWest plans to return over the next two years, each taking its fixed rate with it. Against that, a Q2 agreement to buy and operate 11 new E175s for American, deliveries committed into 2028, debt down to $2.3bn from $2.4bn, and a $250m addition to the buyback.

Republic raised guidance and fell anyway

Republic Airways, the Indianapolis operator paid on the same per-departure and per-block-hour meter, raised full-year adjusted EBITDAR guidance to $395m–$405m and block hours to about 880,000, and its shares are down 27% over twelve months. Its reported growth is arithmetic from the Mesa combination that closed on November 25, 2025: diluted shares were 46.2m last quarter against 2.78m a year earlier, and the block-hour jump came with 60 additional United E175s. Trailing earnings are unusable; the only anchor is 0.52x book, against SkyWest's 1.33x. The third name on this shelf is gone — Allegiant completed its roughly $1.5bn purchase of Sun Country on May 13, 2026, taking the charter and Amazon freighter operations with it.

What the contract does and does not buy

SkyWest's fixed fee explains the share-price gap against its own customers almost entirely, and explains nothing about its earnings direction. At 8.7x forward earnings, 5.9x trailing EV/EBITDA and an 8.8% trailing free-cash-flow yield, it is the cheapest partner-linked carrier here — Delta trades at 14.0x forward, Allegiant at 11.9x. But a year ago SkyWest traded near 9.6x trailing earnings and now trades near 9.1x on the same calculation, so the 9% decline over twelve months has tracked earnings rather than compressed the multiple. Consensus has full-year 2027 earnings per share at $12.12 against $10.57 this year, which requires the 2026 margin squeeze to reverse; the reported trend is still the other way. Sell-side targets average $113 with a hold rating across five brokers, with TD Cowen trimming to $116 on October 2 and Goldman Sachs moving to neutral at $115.

The contract spared SkyWest the fuel bill and also fixed its rate per hour; it cannot ask United for more because crude went up. What it can do is fly more hours — and the Delta CRJ900s it has agreed to hand back are hours already scheduled to leave the book, on a decision that was never SkyWest's to make.

Applied Materials Skipped Its Tool-Spending Forecast; Camtek Raised Its Outlook and Fell

Hypothesis Opus 5 · Research Opus 5 · Writing Opus 5 · Prompt v1.7

A scare about how much chipmakers will spend on fab tools took between 18% and 25% out of three test and inspection companies in eight sessions, and the only one of the three to speak after it raised its own numbers.

Camtek said on 14 October that third-quarter revenue would land slightly above its guidance at $160-161m and sketched a 2027 of more than $800m against $756m of analyst consensus; its shares fell that same session. Applied Materials had declined the day before to put a figure on 2027 wafer-fab equipment spending.

None of the three bills for tool budgets. FormFactor's revenue counts chip designs entering test, where flash probe cards fell 48% last quarter while memory probe cards rose 49%, and Onto Innovation's backlog crossed $1.1bn for the first time. The reported businesses explain almost none of the markdown.

FORMONTOCAMTAMATKLACLRCXASMLVECOWafer Fab Equipment SpendingInspection & MetrologyProbe Card DemandHigh-Bandwidth MemoryDRAM Pricing & MixAdvanced Packaging Test
TickerCompanySegmentTrend · 13mo30D1Y
The subject · what this brief is about
FORMFormFactorTest & Assembly Services🟢 Cont. Bull+11.5%+165.4%
ONTOOnto InnovationFabrication Equipment & Materials🟢 Cont. Bull−5.0%+74.3%
CAMTCamtekTest & Assembly Services🔴 Cont. Bear−2.4%+4.9%
Compared against · context, not the story
AMATApplied MaterialsFabrication Equipment & Materials🟢 Cont. Bull+2.1%+89.6%
KLACKLAFabrication Equipment & Materials🔴 Cont. Bear+3.8%−83.9%
LRCXLam ResearchFabrication Equipment & Materials🟢 Cont. Bull+0.1%+87.9%
ASMLASMLFabrication Equipment & Materials🟢 Cont. Bull+4.1%+65.0%
VECOVeeco InstrumentsFabrication Equipment & Materials⚠️ Emerging Bear+8.7%+52.9%

12-month price & trend

FORM
FormFactor
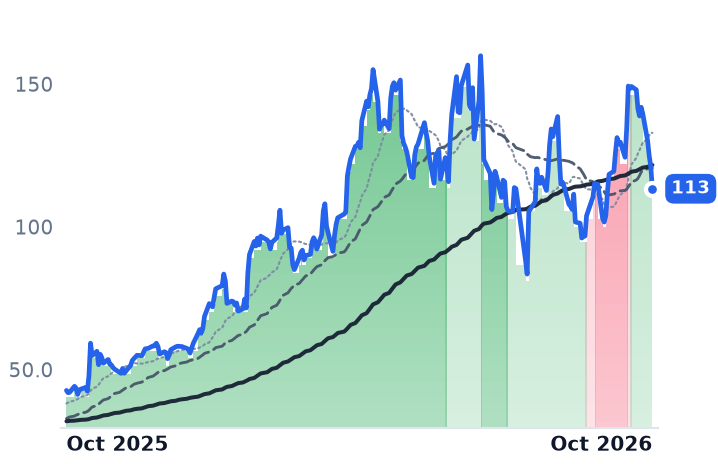
113
−7.80 (−6.44%)
vs. prior close
Price20d50d150d
FORM 12-month price
Test & Assembly Services
ONTO
Onto Innovation
232
−12.60 (−5.15%)
vs. prior close
Price20d50d150d
ONTO 12-month price
Fabrication Equipment & Materials
CAMT
Camtek
131
−4.33 (−3.19%)
vs. prior close
Price20d50d150d
CAMT 12-month price
Test & Assembly Services
TickerMkt capP/EP/E fwdP/SP/S fwdP/GPP/GP fwdEV/EBITDAFCF yld
FORM$9.4B80.9x39.3x10.4x9.1x22.7x19.8x55.9x1.5%
ONTO$11.8B90.1x29.7x10.6x8.2x21.0x16.3x48.6x2.1%
CAMT$6.3B169.6x37.6x12.4x10.7x24.9x21.3x222.0x0.0%
AMAT
Applied Materials
430
−16.62 (−3.72%)
vs. prior close
Price20d50d150d
AMAT 12-month price
Fabrication Equipment & Materials
KLAC
KLA
174
−4.66 (−2.60%)
vs. prior close
Price20d50d150d
KLAC 12-month price
Fabrication Equipment & Materials
LRCX
Lam Research
271
−15.56 (−5.43%)
vs. prior close
Price20d50d150d
LRCX 12-month price
Fabrication Equipment & Materials
TickerMkt capP/EP/E fwdP/SP/S fwdP/GPP/GP fwdEV/EBITDAFCF yld
AMAT$425.0B45.9x43.6x13.8x12.7x27.9x25.7x37.3x1.5%
KLAC$268.8B55.9x37.5x19.8x14.8x32.3x24.2x47.4x1.4%
LRCX$430.0B59.4x36.7x18.5x12.4x36.7x24.6x49.2x1.1%
ASML
ASML
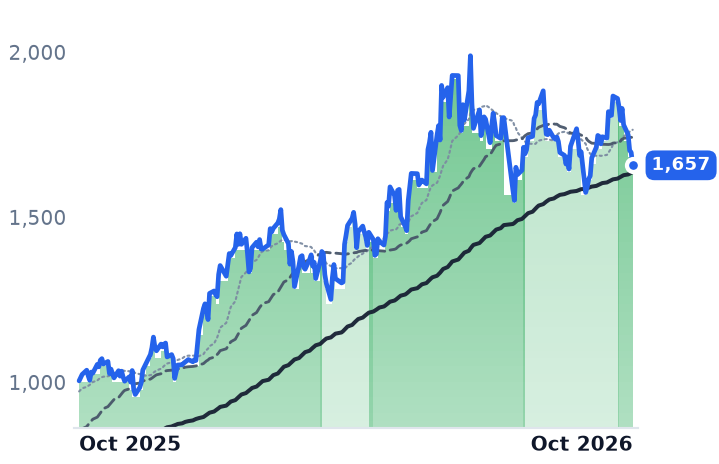
1,657
−39.11 (−2.31%)
vs. prior close
Price20d50d150d
ASML 12-month price
Fabrication Equipment & Materials
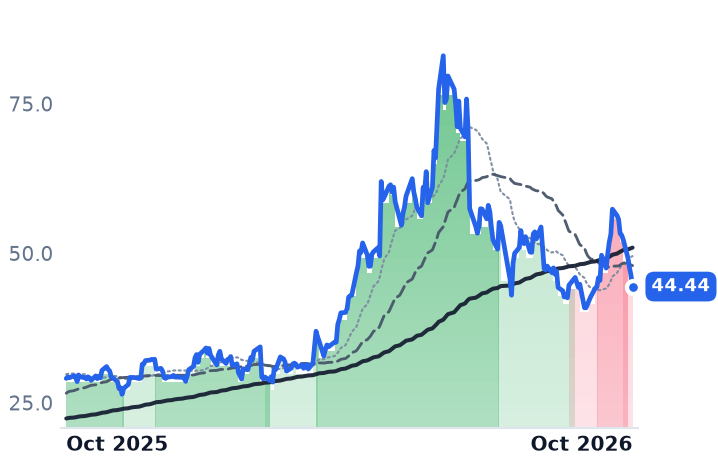
VECO
Veeco Instruments
44.44
−1.85 (−4.01%)
vs. prior close
Price20d50d150d
VECO 12-month price
Fabrication Equipment & Materials
TickerMkt capP/EP/E fwdP/SP/S fwdP/GPP/GP fwdEV/EBITDAFCF yld
ASML$725.8B56.9x49.4x17.1x16.8x32.4x31.8x43.4x1.7%
VECO$3.3B142.0x34.9x4.9x4.2x12.9x11.1x62.8x2.6%

Consensus projections

TickerFY2026EFY2027EFY2028E
FORMRevenue+32.4%+17.0%+21.7%
EPS+170.2%+24.8%+32.3%
ONTORevenue+2.2%+43.1%+30.8%
EPS−5.1%+63.3%+44.9%
CAMTRevenue+19.8%+27.5%+16.7%
EPS+12.9%+35.6%+19.3%
AMATRevenue+18.3%+28.9%+20.8%
EPS+31.2%+38.7%+28.8%
KLACRevenue+12.2%+33.9%+19.0%
EPS+14.5%+47.8%+21.0%
LRCXRevenue+27.0%+49.0%+18.6%
EPS+41.9%+64.7%+25.5%
ASMLRevenue+33.7%+27.3%+20.6%
EPS+54.0%+37.1%+28.6%
VECORevenue+18.6%+35.6%—
EPS+17.4%+101.8%—

Forward fiscal years only. Blank means no analyst coverage for that year.

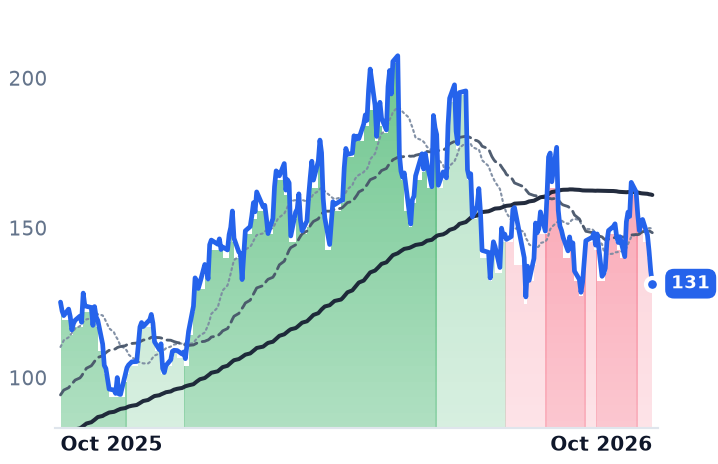
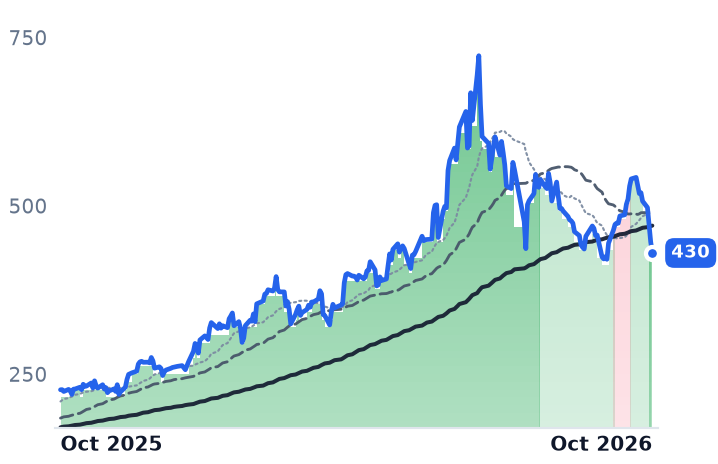
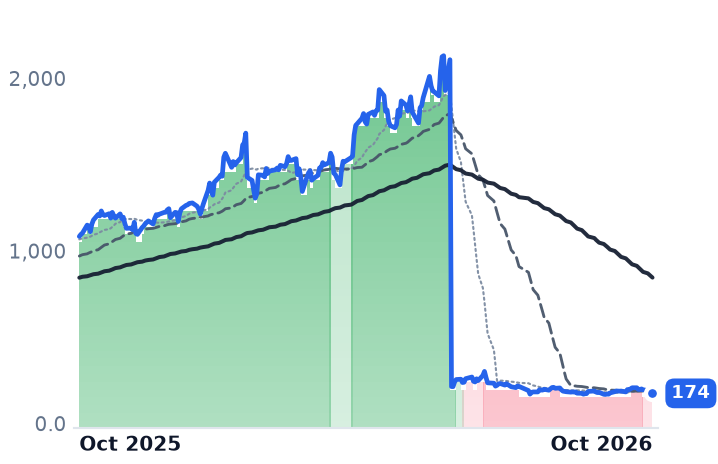
Applied Materials, which sells the tools chipmakers use to process wafers, presented to investors at SEMICON West in San Francisco on 13 October and stopped short of giving a specific forecast for wafer-fabrication-equipment spending, the industry's headline demand number. Its shares closed down 6.7% at $471.66, Lam Research and KLA each fell about 4%, and by the close on 14 October the equipment group had given up between 9% and 19% of its 2 October value, Applied Materials itself down 17.3% and ASML down 9.1%.

The deepest marks in that group landed on three companies whose revenue a tool budget does not describe. FormFactor sells probe cards, the custom contactors that touch a wafer to test chips before they are cut. Onto Innovation sells inspection and metrology steps qualified into a customer's process, plus the software that runs them. Camtek sells automated optical inspection and 3D metrology systems qualified at manufacturers of high-bandwidth memory, the stacked DRAM that sits beside an AI accelerator. The eight sessions were read as a verdict on capital spending.

The one of the three that published numbers after the scare published better ones.

Billed per design, not per tool

FormFactor's probe cards are engineered around a specific chip design, which is why its own filing attributes the quarter to designs: foundry and logic growth came from stronger demand for networking and high-performance compute microprocessor designs. Inside one capital-spending cycle the end markets moved in opposite directions. In the quarter ended 27 June, foundry and logic probe cards were $121.8m, 47% of revenue and up 22% year on year; DRAM probe cards were $85.0m and up 49%; flash probe cards were $2.9m, down 48%.

Group revenue of $258.2m rose 31.9%, the fourth straight quarter of acceleration, and gross margin reached 50.7% against 37.2% a year earlier. "FormFactor's second quarter revenue, gross profit, and earnings per share set all-time records," chief executive Mike Slessor told investors on 29 July.

The guidance carries the mechanism. FormFactor expects third-quarter revenue of $270m give or take $10m at a 54% non-GAAP gross margin, with DRAM revenue comparable to the record second quarter but containing "a significant underlying shift from HBM to DDR, as customers are shifting their wafer start mix to DDR designs to capture profit opportunity from significant DDR price increases". High-bandwidth memory was roughly two-thirds of second-quarter DRAM revenue. A flat line, produced by customers re-mixing wafer starts between designs, with nothing said about tools at all.
What a reader cannot check is the granularity: the filing discloses that three customers were 35.3% of revenue, and nowhere discloses probe-card unit volume or average selling price. For a business whose output is consumed design by design, the two most natural meters do not exist in public data.
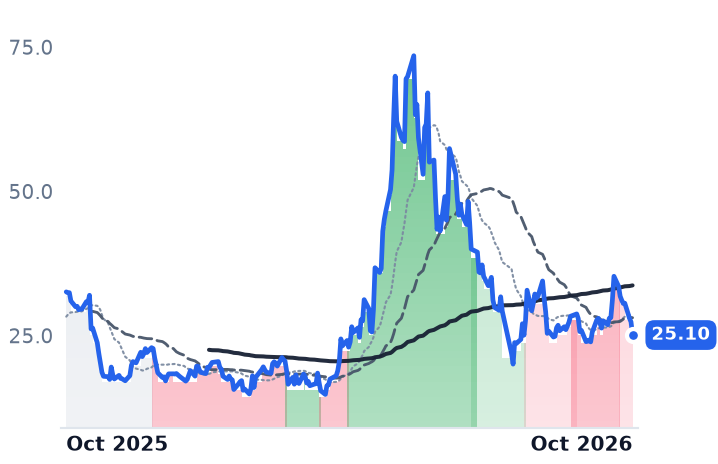
The shares are up 216% over twelve months, yet the trailing multiple fell from 199.3x on 3 May to 80.9x while the market capitalization dropped 11%: earnings did that, not price. Forward, it is 39.3x consensus 2026 earnings of $3.05 and about 31.5x 2027, against the roughly 30x forward anchor the business carried in May.

Onto crossed $1bn of backlog, then lost a fifth

Onto Innovation's June quarter revenue of $343.1m grew 35.3% with operating income up 97%, and it raised its second-half growth outlook to 25% or more over the first half from 15%, lifting expected advanced-packaging growth for the year to about 80%. "Visibility continues to be strong with customers maintaining investments in their multi-year growth plans, resulting in a backlog exceeding $1 billion for the first time in company history," chief executive Michael Plisinski said on 6 August. Backlog later exceeded $1.1bn, 30% to 40% of it covering 2027.

The stock is down 19.6% over three months. It trades at 29.7x consensus 2027 earnings of $8.12, against the 101.9x trailing multiple it carried in May.

Camtek answered with a number

On 14 October, the session its shares fell 4.6%, Camtek pre-announced third-quarter revenue of $160-161m, slightly above its own guidance and 27% higher year on year, guided the fourth quarter to about $180m, and gave a first 2027 outlook above $800m. Consensus for 2027 was $756m. More than $800m of orders have come in since the start of the year.

Camtek is also the one with real deterioration behind it: GAAP operating margin fell to 20.4% in the June quarter from 25.9%, operating income declining 14.8% on revenue up 8%. Its order book rests on two memory manufacturers for more than $260m of expected revenue across 2026 and 2027, and it expects China to be roughly 45% of 2026 revenue, down from 49%, under export controls its filings warn could reduce demand across the Chinese sector. At 37.6x 2026 and 27.7x 2027 forward earnings it is priced off numbers the company has just raised; its 169.7x trailing multiple is an artifact of a one-off $53.2m loss booked in the third quarter of 2025.

What the eight sessions actually priced

None of the three has reported into the de-rating. The most recent calls were 29 July, 6 August and 10 August, so every word of management commentary predates the markdown by two months, and the only fresh disclosure, Camtek's, went the other way. On the evidence available, the reported businesses account for almost none of the move; what moved was the price paid for each dollar of forward earnings, from triple-digit trailing multiples in May to high-twenties and thirties on 2027 numbers.

Two real risks sit underneath. FormFactor's third quarter is guided flat in DRAM because customers are moving wafer starts to commodity double-data-rate designs, and a card count is only as good as the designs running against it. And the same investor day that cut the group named optical inspection as an opportunity for Applied Materials, which is the step Onto and Camtek are paid for; KLA, already the larger rival, expects nearly $1bn of advanced-packaging revenue in 2026 against roughly $635m in 2025, more incremental revenue in one year than Camtek's entire base. Applied Materials also said about 75% of incremental equipment growth should come from leading-edge foundry logic, DRAM and advanced packaging, the three sockets these companies serve.

The next word from inside any of these businesses comes on 28 October, when FormFactor reports the quarter it guided to $270m and says whether commodity memory designs replaced high-bandwidth ones card for card. Whatever Applied Materials would not forecast about 2027 will not be in that answer.

Burford and Oxford Lane Cut the Estimates They Book as Income, and Cash Receipts Rose

Hypothesis Opus 5 · Research Opus 5 · Writing Opus 5 · Prompt v1.7

Two listed funds whose largest reported line is an estimate have both had that estimate revised down by their own directors this year, and at both the money actually arriving went up. Oxford Lane Capital buys the first-loss equity of collateralised loan obligations and accrues income off a modelled yield; Burford Capital finances lawsuits and books unrealised write-ups as revenue.

Oxford Lane's net asset value per share fell from $15.51 to $10.56 in the quarter to March, then steadied near $10.74 by June, while cash distributions received on its CLO equity ran at a 16.3% yield against an 11.1% accrual. Burford wrote $2.4bn off its Argentine judgment and still collected $157m of cash in the second quarter, its best since early 2025.

Over twelve months the destroyed book value explains the share prices. Over the last month it does not.

OXLCBURBUIGUTPDTECCCLO Equity TranchesLitigation FinanceClosed-End Fund DiscountsFair-Value MarksLeveraged Loan CreditDistribution Coverage
TickerCompanySegmentTrend · 13mo30D1Y
The subject · what this brief is about
OXLCOxford Lane CapitalSpecialty & Alternative Funds🔴 Cont. Bear−12.8%−36.0%
BURBurford CapitalSpecialty & Alternative Funds🔴 Cont. Bear−24.4%−70.6%
BUIBlackRock Utilities, Infrastructure & Power Opportunities TrustSpecialty & Alternative Funds⚠️ Emerging Bear−1.8%+4.5%
Compared against · context, not the story
GUTThe Gabelli Utility TrustSpecialty & Alternative Funds🟢 Cont. Bull−8.6%+1.5%
PDTJohn Hancock Premium Dividend FundSpecialty & Alternative Funds⚠️ Emerging Bear−1.8%−6.5%
ECCEagle Point CreditClosed-End Fixed Income Funds🔴 Cont. Bear−22.8%−48.1%

12-month price & trend

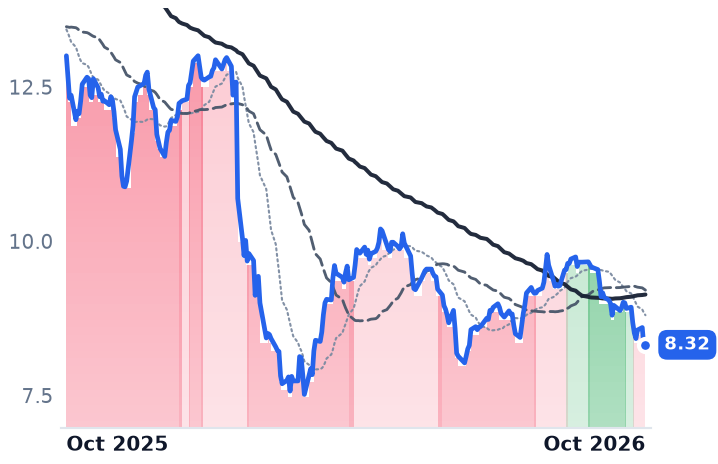
OXLC
Oxford Lane Capital
8.32
+0.04 (+0.48%)
vs. prior close
Price20d50d150d
OXLC 12-month price
Specialty & Alternative Funds
BUR
Burford Capital
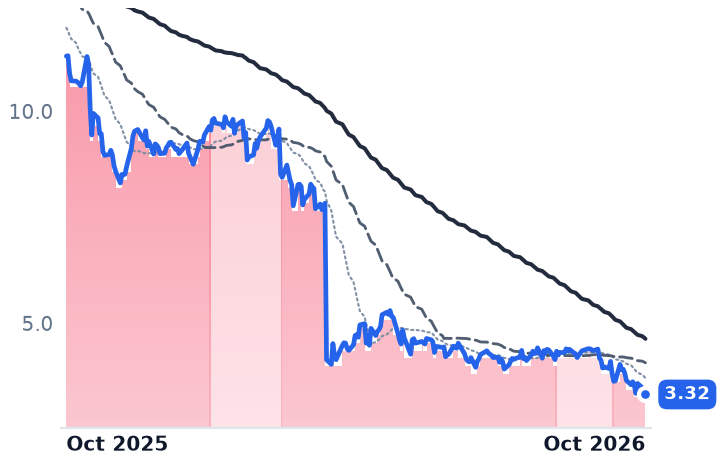
3.32
−0.07 (−1.92%)
vs. prior close
Price20d50d150d
BUR 12-month price
Specialty & Alternative Funds
BUI
BlackRock Utilities, Infrastructure & Power Opportunities Trust
25.77
−0.02 (−0.06%)
vs. prior close
Price20d50d150d
BUI 12-month price
Specialty & Alternative Funds
TickerMkt capP/EP/E fwdP/SP/S fwdP/GPP/GP fwdEV/EBITDAFCF yld
OXLC$802.3Mn/m2.1x2.0x2.0x3.0x3.0xn/m86.8%
BUR$722.5Mn/m—n/m1.2x——1.6x-14.5%
BUI$680.3M4.5x—4.8x—5.0x—4.9x1.3%
GUT
The Gabelli Utility Trust
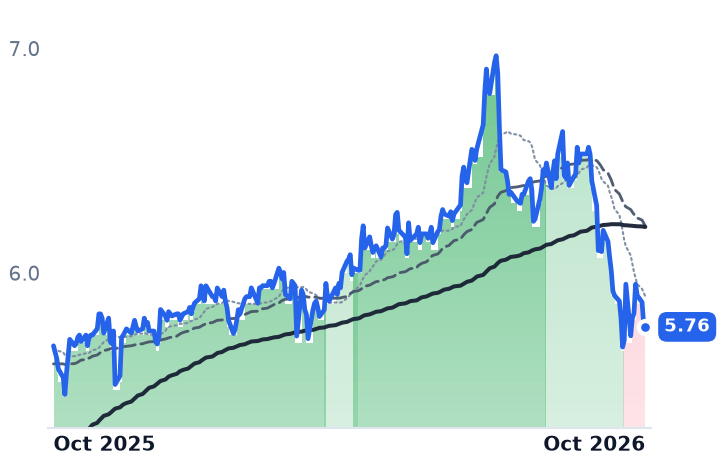
5.76
−0.01 (−0.18%)
vs. prior close
Price20d50d150d
GUT 12-month price
Specialty & Alternative Funds
PDT
John Hancock Premium Dividend Fund
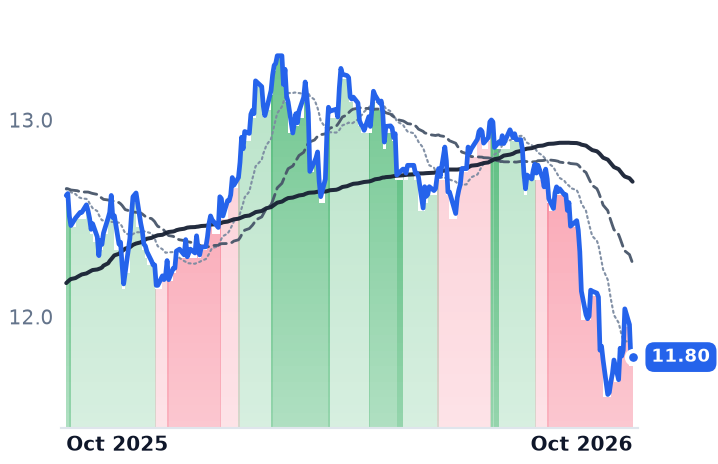
11.80
+0.02 (+0.21%)
vs. prior close
Price20d50d150d
PDT 12-month price
Specialty & Alternative Funds
ECC
Eagle Point Credit
2.86
+0.00 (+0.09%)
vs. prior close
Price20d50d150d
ECC 12-month price
Closed-End Fixed Income Funds
TickerMkt capP/EP/E fwdP/SP/S fwdP/GPP/GP fwdEV/EBITDAFCF yld
GUT$554.6M11.5x—32.4x—36.5x—27.1x4.7%
PDT$625.6M9.1x—7.0x—8.9x—14.6x3.9%
ECC$532.8Mn/m4.4x3.3x2.8x3.7x3.1xn/m13.3%

Consensus projections

TickerFY2026EFY2027EFY2028E
OXLCRevenue+14.1%−7.0%+22.5%
EPS+281.8%−2.3%+15.4%
BURRevenue+0.6%−16.2%−5.9%
EPS−781.1%−107.4%−43.6%
ECCRevenue−5.6%+8.3%—
EPS−2.1%−6.0%—

Forward fiscal years only. Blank means no analyst coverage for that year.

Oxford Lane Capital, a closed-end fund that buys the equity tranche of collateralised loan obligations — the first-loss slice beneath every rated note in a securitisation of leveraged corporate loans — reports investment income that nobody writes it a cheque for. The number is accreted off a modelled effective yield, which is an assumption about future defaults, recoveries and reinvestment. Burford Capital, which advances capital against the value of litigation and arbitration claims, has the same accounting in a different asset: its revenue line is dominated by write-ups on claims it still owns.

Both share prices have been falling for a year, and the natural reading is a market refusing a mark that management would not change. Both marks were changed by management. In the same quarters, the cash moved the other way.

Oxford Lane's accrual sits below its cheque

In the year to 31 March 2026 Oxford Lane booked total investment income of $391.8m and reported a net loss of $585.1m, or -$5.99 a diluted share; the difference is marks. Net asset value per share fell from $15.51 at the end of December to $10.56 at 31 March and recovered to $10.74 at 30 June. The company's unaudited estimate for 31 August was $10.34 to $10.64, figures it says did not go through its usual quarter-end closing procedures and were not approved by the board.

The cash disagrees with the accrual, in the fund's favor. For the June quarter Oxford Lane reported net investment income under generally accepted accounting principles of $0.51 a share against core net investment income of $0.95, and that $0.44 difference is the timing gap between effective-yield accrual and distributions actually received. The weighted-average cash distribution yield on CLO equity was 16.3% at 30 June against a modelled effective yield of 11.1%, so the surplus cash amortises cost basis instead of passing through income. Declared distributions of $0.20 a month, halved from $0.40 on 30 January 2026, come to $0.60 a quarter: above the accounting income, roughly two-thirds of the cash measure.

The collateral improved as the shares fell. The twelve-month trailing default rate for the loan index was 0.97% at 30 June against 1.44% three months earlier. Chief executive Jonathan Cohen called the CLO refinancing and reset market "a very natural offset to spread compression in the U.S. syndicated corporate loan market" on the 28 July 2026 call.

At $8.32 the shares sit about a fifth below the $10.49 midpoint of the August estimate. Eagle Point Credit, the nearest listed competitor for the same CLO-equity dollar, trades at a 27.6% discount against a three-year average premium of 2.11%, so the repricing is the class's, not one manager's. Oxford Lane's board responded on 14 May 2026 by authorising up to $150.0m of buybacks through May 2027 — the reverse of the machine that sold shares above book.

Burford's mark went to court and lost

On 27 March 2026 the Second Circuit reversed the $16.1bn judgment against Argentina, holding the investors' claims "not cognizable under Argentina's civil codes or under the public law governing expropriation". Burford took a $2.4bn capital-provision loss, cutting those assets to about $160m. Tangible book value per share fell from $10.57 at 31 December to $3.12 at 30 June, with debt at 3.5x tangible book against 0.9x.

Collections ran the opposite way. Second-quarter cash receipts of $157m were the firm's highest since the first quarter of 2025, with realisations up to $94m from $62m. "While the YPF loss was disappointing and caused a very large non-cash charge to our quarterly earnings, there is no cash impact from that loss," chief executive Christopher Bogart said with the 6 August results. The remaining book carries roughly $4.1bn of fair value against $1.9bn of deployed cost, about a 22% markup, alongside $733m of cash and marketable securities. At $3.32 the shares are near 1.06x tangible book.

The utilities fund on the same shelf is a different fact

BlackRock Utilities, Infrastructure & Power Opportunities Trust, a closed-end fund holding listed utility and power equities, fell under 2% over thirty days, and almost none of that is the discount: BlackRock disclosed an average daily discount of 1.39% for the nine months to 30 September. Its portfolio returned 19.99% at net asset value in the six months to 30 June. What moved it was the discount rate: utilities fell about 6% on the month as the ten-year Treasury paid above 5.2%.

Twelve months explain these falls; thirty days do not

Across a year the arithmetic holds. Oxford Lane's shares are down 49.4% against net assets cut by a third in one quarter; Burford's are down 70.6% against tangible book cut by 70%. Across the last month it breaks: Oxford Lane fell 12.8% while its net asset value held and defaults under it improved, and Burford fell 24.4% in the stretch after its strongest collections in five quarters.

The two have different reasons for that last leg. At Oxford Lane the likelier reading is the closed-end fund class itself, where the average discount reached 8.4% at the end of the third quarter and taxable-bond funds widened from 6.6% to 9.98% amid tax-loss selling. At Burford it is one courtroom: the certiorari petition filed on 30 September 2026 is the only company-specific news in the window.

That is the awkward part of valuing either one. The anchor a buyer would use at Oxford Lane is itself a Level 3 estimate the market is marking down by a fifth, and the anchor at Burford is a portfolio whose single largest asset is now a residual claim waiting on nine justices to decide whether to look at it at all.

Bel Fuse Grew Operating Profit 47% and Fell With a Chip Selloff Over Chinese Memory

Hypothesis Opus 5 · Research Opus 5 · Writing Opus 5 · Prompt v1.7

Bel Fuse makes the magnetics, circuit protection and interconnects that go into data-center racks and defense programs, and its last reported quarter was the strongest of the three listed companies levered to the 800-volt rack transition. Revenue rose 25.2% to $210.7m, gross margin widened to 39.9%, and bookings ran ahead of sales for a sixth consecutive quarter.

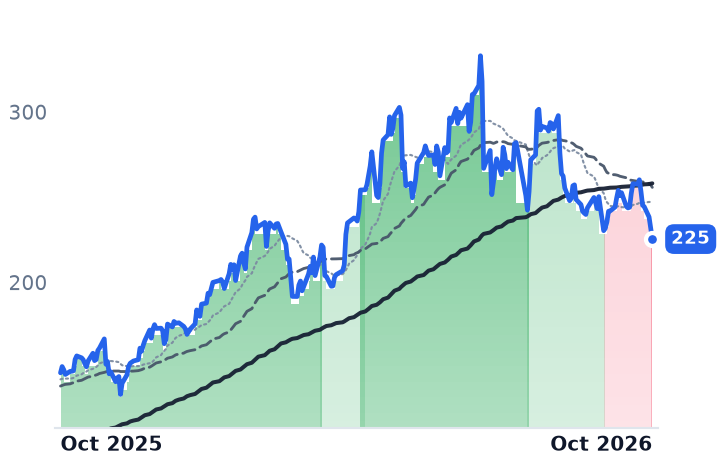
Between 6 and 14 October the shares fell 13.4%. So did Wolfspeed, onsemi, Monolithic Power and Nvidia, in a decline the Philadelphia Semiconductor Index carried through six straight sessions on news out of a Chinese memory maker. Nothing Bel Fuse disclosed changed.

What separates the group is price. Bel Fuse trades at 22.7x forward earnings; Vicor at 62.3x after royalty income drove two guidance raises in nine days; Navitas at 51x forward sales with no gross profit at all.

BELFBVICRNVTSBELFAULBIIPWRMPWRPOWIWOLFONMCHPTXNADINVDAVRTSPY800VDC Rack ArchitecturePower Magnetics & InterconnectWide-Bandgap Power SemisDefense ElectronicsAI Data-Center BuildoutChina Memory Competition
TickerCompanySegmentTrend · 13mo30D1Y
The subject · what this brief is about
BELFBBel FuseConnectors & Interconnect Systems⚠️ Emerging Bear−2.1%+53.4%
VICRVicorOther⚠️ Emerging Bear+35.4%+366.1%
NVTSNavitas SemiconductorOther⚠️ Emerging Bear−12.1%−23.8%
Compared against · context, not the story
BELFABel FuseHardware, Equipment & Parts⚠️ Emerging Bear−4.6%+55.3%
ULBIUltralifeElectrical Equipment & Parts🔴 Cont. Bear+8.8%−16.1%
IPWRIdeal PowerSemiconductors🔴 Cont. Bear−24.8%−35.3%
MPWRMonolithic Power SystemsAnalog & Mixed-Signal⚠️ Emerging Bear+9.7%+30.0%
POWIPower IntegrationsAnalog & Mixed-Signal⚠️ Emerging Bear−7.7%−3.8%
WOLFWolfspeedDiscrete & Power⚠️ Emerging Bear+4.8%−23.0%
ONON SemiconductorAnalog & Mixed-Signal⚠️ Emerging Bear+2.3%+48.0%
MCHPMicrochip Technology IncorporatedAnalog & Mixed-Signal⚠️ Emerging Bear−0.4%+11.8%
TXNTexas Instruments IncorporatedAnalog & Mixed-Signal🟢 Cont. Bull+6.8%+65.1%
ADIAnalog DevicesAnalog & Mixed-Signal🟢 Cont. Bull+12.2%+73.2%
NVDANVIDIAAI & Data Center GPUs🟢 Cont. Bull+5.4%+23.5%
VRTVertivData Center Power & Thermal⚠️ Emerging Bear−5.6%+28.1%
SPYState Street SPDR S&P 500 ETF TrustAsset Management🟢 Cont. Bull+1.2%+16.9%

12-month price & trend

BELFB
Bel Fuse
225
−6.65 (−2.86%)
vs. prior close
Price20d50d150d
BELFB 12-month price
Connectors & Interconnect Systems
VICR
Vicor
250
−6.93 (−2.70%)
vs. prior close
Price20d50d150d
VICR 12-month price
Other
NVTS
Navitas Semiconductor
9.57
−0.71 (−6.87%)
vs. prior close
Price20d50d150d
NVTS 12-month price
Other
TickerMkt capP/EP/E fwdP/SP/S fwdP/GPP/GP fwdEV/EBITDAFCF yld
BELFB$2.7B55.9x22.7x3.6x3.3x9.2x8.4x18.7x2.7%
VICR$11.1B76.9x62.3x23.5x17.5x41.4x31.0x80.3x0.5%
NVTS$2.4Bn/m—66.9x51.2x——n/m-2.8%
BELFA
Bel Fuse
181
−2.73 (−1.49%)
vs. prior close
Price20d50d150d
BELFA 12-month price
Hardware, Equipment & Parts
ULBI
Ultralife
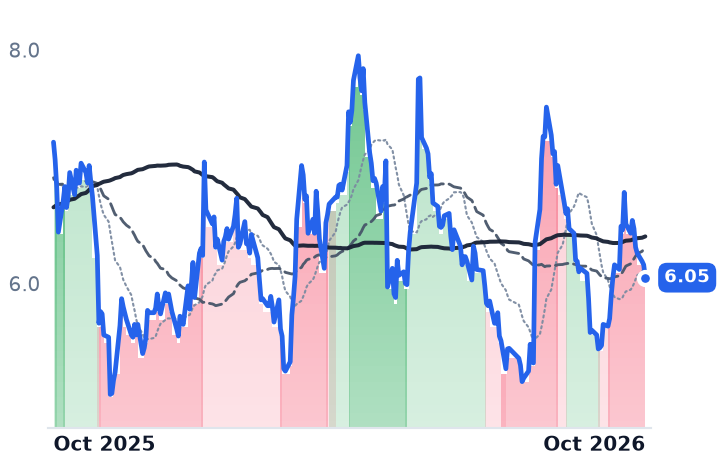
6.05
−0.11 (−1.79%)
vs. prior close
Price20d50d150d
ULBI 12-month price
Electrical Equipment & Parts
IPWR
Ideal Power
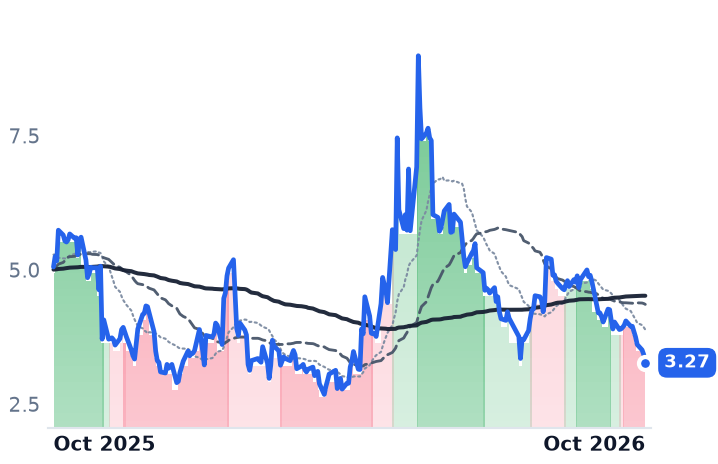
3.27
−0.15 (−4.53%)
vs. prior close
Price20d50d150d
IPWR 12-month price
Semiconductors
TickerMkt capP/EP/E fwdP/SP/S fwdP/GPP/GP fwdEV/EBITDAFCF yld
BELFA$3.4B69.0x24.6x4.5x4.2x11.4x10.7x23.6x2.2%
ULBI$90.8Mn/m6.3x0.5x0.4x2.0x1.7xn/m2.2%
IPWR$63.9Mn/m——79.8x——n/m-14.8%
MPWR
Monolithic Power Systems
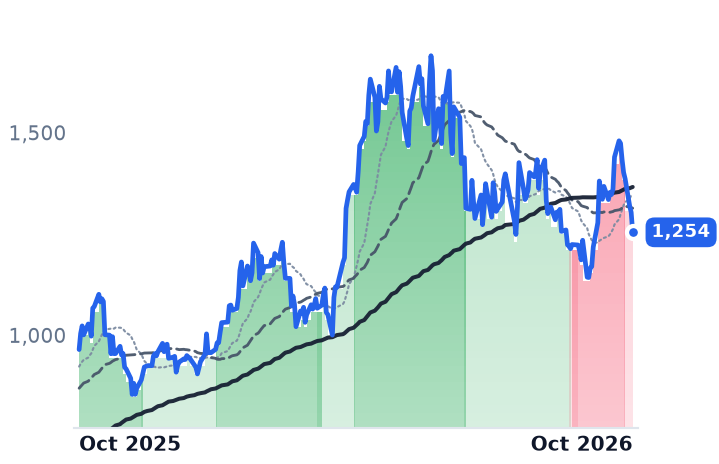
1,254
−49.20 (−3.78%)
vs. prior close
Price20d50d150d
MPWR 12-month price
Analog & Mixed-Signal
POWI
Power Integrations
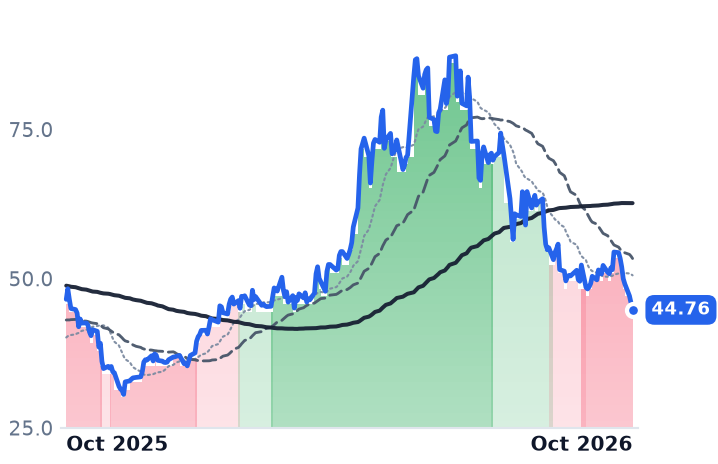
44.76
−1.15 (−2.49%)
vs. prior close
Price20d50d150d
POWI 12-month price
Analog & Mixed-Signal
WOLF
Wolfspeed
25.10
−2.27 (−8.29%)
vs. prior close
Price20d50d150d
WOLF 12-month price
Discrete & Power
TickerMkt capP/EP/E fwdP/SP/S fwdP/GPP/GP fwdEV/EBITDAFCF yld
MPWR$68.1B84.5x50.5x20.8x16.4x37.7x29.7x64.3x0.9%
POWI$3.5B136.5x44.7x7.7x7.2x14.4x13.5x84.1x2.3%
WOLF$1.8Bn/m—2.8x2.9x——n/m-19.3%
ON
ON Semiconductor
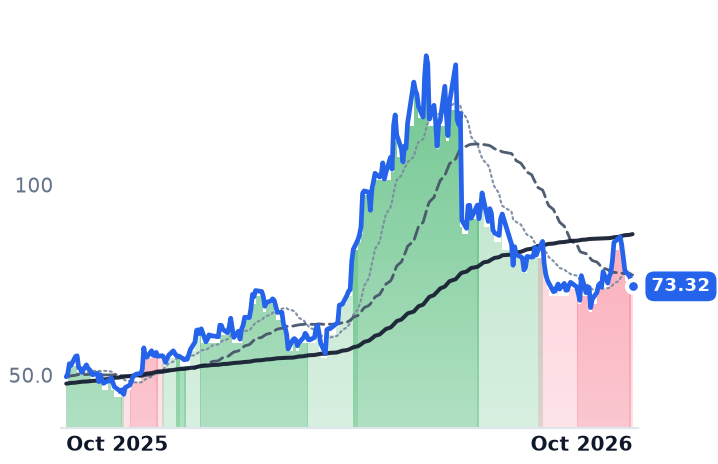
73.32
−1.78 (−2.36%)
vs. prior close
Price20d50d150d
ON 12-month price
Analog & Mixed-Signal
MCHP
Microchip Technology Incorporated
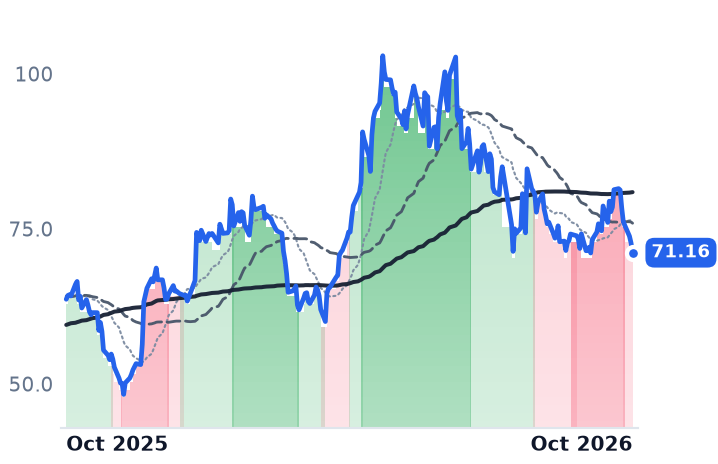
71.16
−1.59 (−2.19%)
vs. prior close
Price20d50d150d
MCHP 12-month price
Analog & Mixed-Signal
TXN
Texas Instruments Incorporated
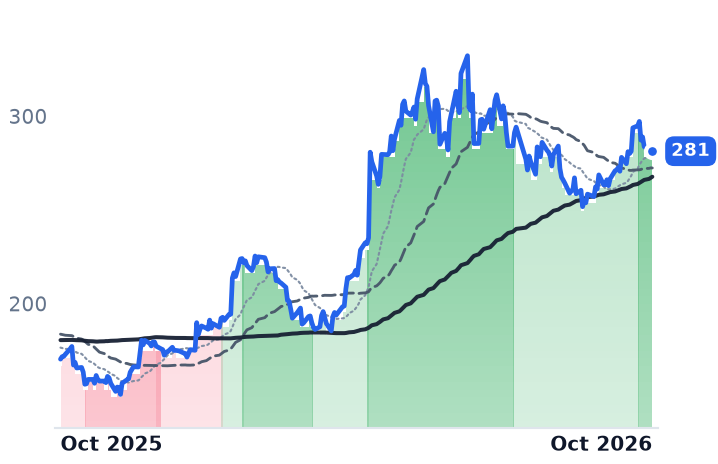
281
−0.31 (−0.11%)
vs. prior close
Price20d50d150d
TXN 12-month price
Analog & Mixed-Signal
TickerMkt capP/EP/E fwdP/SP/S fwdP/GPP/GP fwdEV/EBITDAFCF yld
ON$33.0B53.7x26.5x5.3x5.0x14.2x13.5x26.9x5.4%
MCHP$41.0B104.7x20.8x8.0x6.4x13.3x10.7x27.4x2.7%
TXN$259.1B42.9x33.3x13.3x11.8x22.8x20.3x27.9x2.1%
ADI
Analog Devices
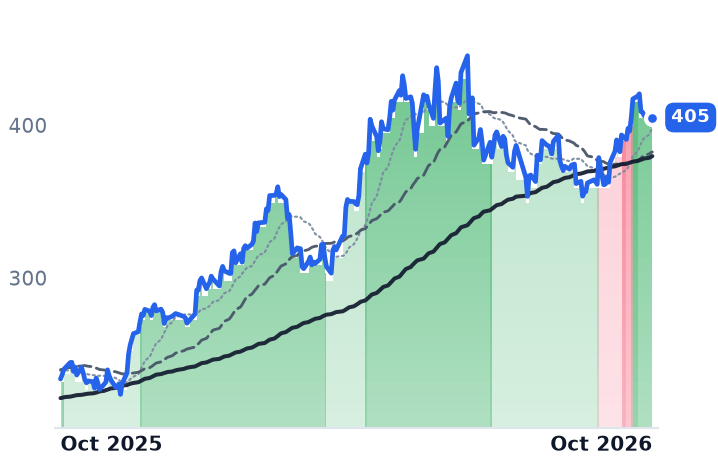
405
−1.46 (−0.36%)
vs. prior close
Price20d50d150d
ADI 12-month price
Analog & Mixed-Signal
NVDA
NVIDIA
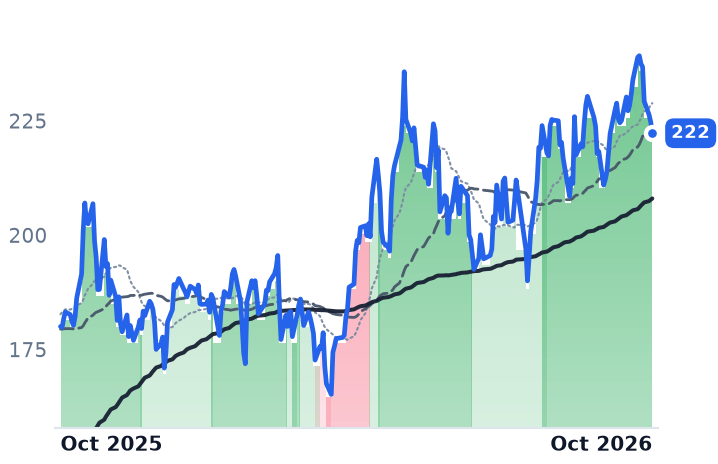
222
−2.50 (−1.11%)
vs. prior close
Price20d50d150d
NVDA 12-month price
AI & Data Center GPUs
VRT
Vertiv
224
−9.96 (−4.25%)
vs. prior close
Price20d50d150d
VRT 12-month price
Data Center Power & Thermal
TickerMkt capP/EP/E fwdP/SP/S fwdP/GPP/GP fwdEV/EBITDAFCF yld
ADI$197.8B48.0x31.6x14.3x13.1x21.7x19.9x29.2x2.5%
NVDA$5.5T34.3x25.0x21.5x13.9x29.0x18.7x28.3x2.2%
VRT$97.1B55.8x37.5x8.5x6.9x22.2x18.2x38.2x3.0%
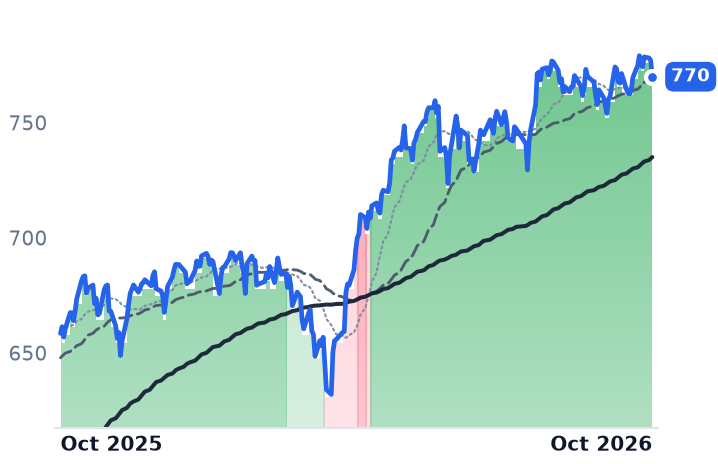
SPY
State Street SPDR S&P 500 ETF Trust
770
−7.08 (−0.91%)
vs. prior close
Price20d50d150d
SPY 12-month price
Asset Management
TickerMkt capP/EP/E fwdP/SP/S fwdP/GPP/GP fwdEV/EBITDAFCF yld
SPY$773.0B————————

Consensus projections

TickerFY2026EFY2027EFY2028E
BELFBRevenue+20.7%+8.5%+13.8%
EPS+45.9%+13.7%+22.9%
VICRRevenue+40.0%+52.9%+22.8%
EPS+82.0%+61.4%+31.5%
NVTSRevenue+4.7%+52.5%+59.8%
EPS−21.9%−17.9%−44.8%
BELFARevenue+20.3%+7.6%+12.6%
EPS+39.7%+13.2%+34.5%
ULBIRevenue+6.2%——
EPS+22.9%——
IPWRRevenue+1500.0%+0.0%+975.0%
EPS−31.5%−18.8%−20.3%
MPWRRevenue+49.3%+28.9%+20.5%
EPS+55.0%+31.2%+20.6%
POWIRevenue+7.7%+14.2%+20.8%
EPS+14.8%+34.8%+43.0%
WOLFRevenue+0.7%−15.2%+23.7%
EPS+275.2%−39.2%−22.4%
ONRevenue+9.2%+13.1%+13.9%
EPS+37.1%+40.9%+30.2%
MCHPRevenue+6.2%+37.1%+16.4%
EPS+20.7%+132.2%+25.6%
TXNRevenue+24.0%+13.8%+10.6%
EPS+55.6%+20.7%+17.1%
ADIRevenue+37.8%+22.1%+11.6%
EPS+65.8%+29.4%+18.0%
NVDARevenue+65.1%+84.2%+43.2%
EPS+59.0%+91.7%+42.0%
VRTRevenue+37.1%+30.2%+21.3%
EPS+62.9%+36.7%+26.4%

Forward fiscal years only. Blank means no analyst coverage for that year.

Bel Fuse, which sells power magnetics, circuit protection and interconnect hardware into data infrastructure, defense programs and industrial customers, reported in its June quarter the sixth consecutive period in which it took more orders than it shipped. In October its shares fell with every company that has a semiconductor anywhere in its supply chain, and none of the reasons given had anything to do with Bel Fuse.

The 800-volt direct-current rack architecture that hyperscale operators are moving toward is usually traded through the specialists: the gallium-nitride and silicon-carbide chip designers, and the module makers who convert high voltage down to the processor. The assumption is that the diversified component houses are too broad to participate. Bel Fuse's disclosure says the content is already arriving, and it is the one member of this group whose accelerating business is attached to a forward earnings multiple of 22.7x.

$66.5m of defense and $58m of data solutions

June-quarter revenue reached $210.7m, up 25.2% year on year, with gross margin widening to 39.9% from 38.7% and operating income up 47.4% to $38.4m — profit growing at nearly twice the rate of sales. On the quarter's call, the two reorganized segments both grew: Aerospace, Defense and Rugged Solutions rose 20.6% to $110.5m on defense sales of $66.5m, and Industrial Technology and Data Solutions rose 31.1% to $100.2m, within which data solutions reached roughly $58m against $38m a year earlier.

That is not a one-quarter artifact. Full-year 2025 revenue grew 26.3% to $675.5m with operating income up 67.5%, and the company guided third-quarter sales to $205m-$225m at a 39%-41% gross margin. The run of bookings above sales now covers a year and a half.

Six sessions that hit everything with a chip in it

From 6 to 14 October the shares fell 13.4%, from $260.26 to $225.46. Over the identical span Wolfspeed fell 21.1%, Power Integrations 16.2%, onsemi 15.1%, Monolithic Power 14.9%, Microchip 12.4% and Nvidia 7.1%, against the S&P 500 tracker's 1.2%. The Philadelphia Semiconductor Index fell 3.1% on 14 October alone, a sixth straight down session leaving it off roughly 10%, with the decline attributed to China's ChangXin Memory announcing progress on a higher-density chip design, alongside higher rates and the cost of building AI infrastructure.

Bel Fuse's own uptrend had already ended earlier, in mid-September, and the trend turned decisively downward on 13 October. No lost socket, guidance cut, financing or adverse ruling landed in between.

The cheapest claim on the same rack

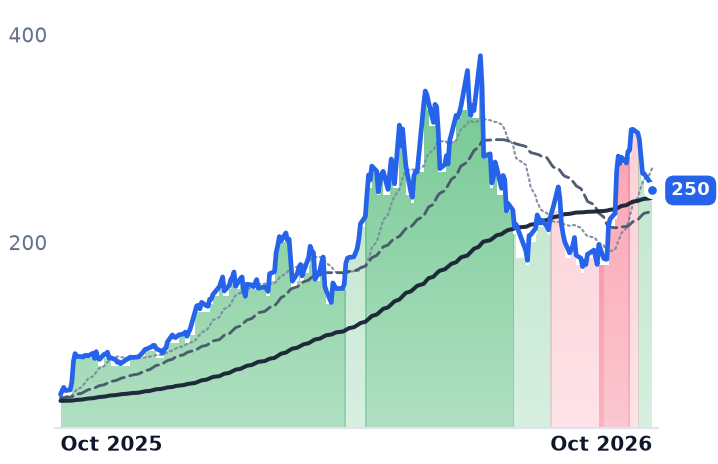
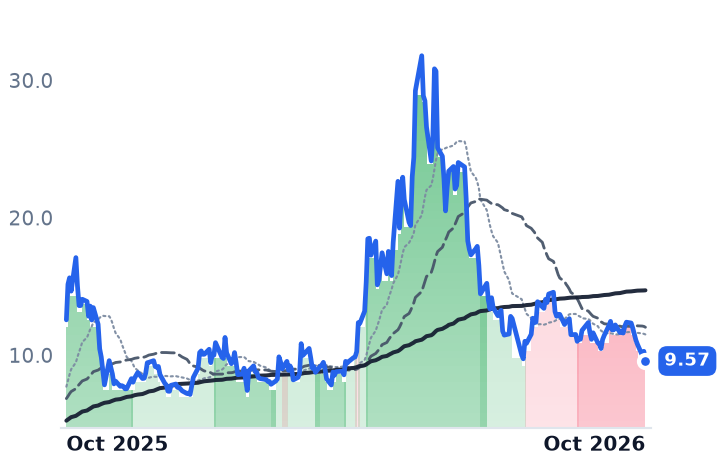
Vicor, which builds brick-format power conversion modules at its own fab in Andover, Massachusetts, has risen 366% over twelve months and trades at 62.3x forward earnings and 31.0x forward gross profit. Its incremental dollar increasingly arrives by contract rather than by shipment: royalty revenue hit $30.4m in the June quarter against $10.4m a year earlier, and founder and chief executive Patrizio Vinciarelli described licensing on the first-quarter call as "nearly 100% margin in terms of profitability." Navitas, which sells gallium-nitride and silicon-carbide power chips, is the other extreme — June-quarter revenue of $10.5m, down 27.3%, a gross margin of minus 9.5%, diluted shares up 18.6% year on year, and 51.2x forward sales.

Bel Fuse's 55.9x trailing earnings compresses to 22.7x forward on consensus 2026 earnings of $9.86 a share against $4.64 actually earned in 2025, and 8.4x forward gross profit is roughly a quarter of what Vicor commands. The cash meters agree: 18.7x enterprise value to EBITDA and a 2.71% free-cash-flow yield, against Vicor's 80.3x and 0.46%.

None of the October decline is explained by anything the three companies reported. It is sector contagion, and it fell hardest on the names with the least earnings underneath them — which is why the most expensive member of this group gave back the least and the loss-making one gave back the most. What the selloff did do is widen an already wide gap between a business compounding operating profit at 47% and the price assigned to it. The available disclosure does not separate how much of Bel Fuse's growth is organic from how much arrived with acquisitions, and that question stays open.

Vicor's audit of its twice-raised royalty guidance comes on 20 October and Navitas reports on 3 November. Bel Fuse, the only one of the three whose orders have outrun its shipments for six quarters running, has the least to prove and the smallest multiple to defend.

Methanex Gave Up a Trinidad Plant Over Gas Terms as Methanol Prices Were Surging

Hypothesis Opus 5 · Research Opus 5 · Writing Opus 5 · Prompt v1.7

Methanex and LSB Industries both convert cheap American natural gas into a bulk chemical, and over the past month their shares have moved in opposite directions. Methanex raised its October posted price for Asian buyers to $700 a tonne from $550 in September, after Iranian methanol stopped reaching export markets, and in June it surrendered an 860,000-tonne plant in Trinidad because it could not agree a commercially viable gas contract. Its constraint is feedstock availability, and tonnage decides the quarter.

LSB's selling price is set by the Tampa ammonia benchmark, which fell by roughly a third between May and September while its own gas stayed near $3.20 per million British thermal units. Methanex has cheapened as it has risen; LSB, at 16.8x forward earnings, remains dearer than CF Industries.

MEOHLXUCFMethanol PricingNatural Gas FeedstockNitrogen & Ammonia MarketsMiddle East Supply DisruptionPetrochemical Capacity Closures
TickerCompanySegmentTrend · 13mo30D1Y
The subject · what this brief is about
MEOHMethanexBasic Chemicals & Intermediates🟢 Cont. Bull+1.5%+78.9%
LXULSB IndustriesBasic Chemicals & Intermediates🔴 Cont. Bear−9.6%+15.7%
Compared against · context, not the story
CFCF IndustriesNitrogen Fertilizers🟢 Cont. Bull−8.0%+40.8%

12-month price & trend

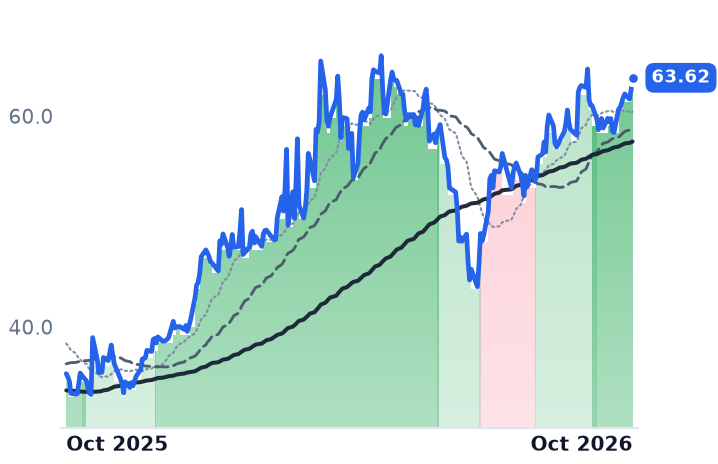
MEOH
Methanex
63.62
+1.22 (+1.96%)
vs. prior close
Price20d50d150d
MEOH 12-month price
Basic Chemicals & Intermediates
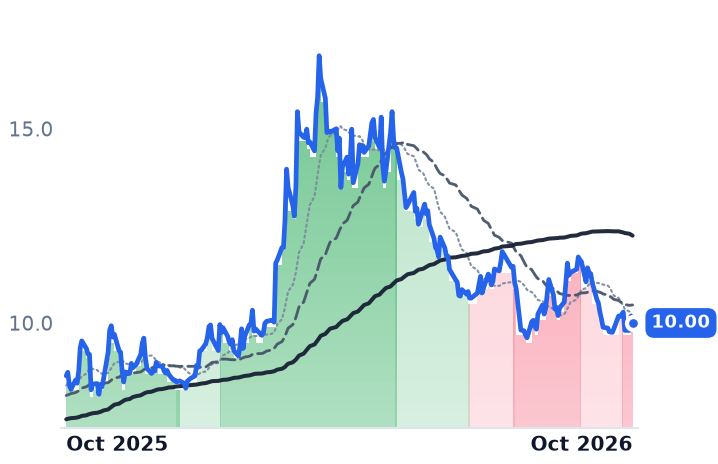
LXU
LSB Industries
10.00
−0.18 (−1.72%)
vs. prior close
Price20d50d150d
LXU 12-month price
Basic Chemicals & Intermediates
CF
CF Industries
121
+5.09 (+4.40%)
vs. prior close
Price20d50d150d
CF 12-month price
Nitrogen Fertilizers
TickerMkt capP/EP/E fwdP/SP/S fwdP/GPP/GP fwdEV/EBITDAFCF yld
MEOH$4.9B56.7x6.7x1.2x1.0x4.0x3.5x7.6x15.1%
LXU$727.2M20.2x16.8x1.1x1.1x6.4x6.4x7.8x22.5%
CF$18.1B8.8x8.0x2.3x2.2x5.5x5.2x4.6x10.6%

Consensus projections

TickerFY2026EFY2027EFY2028E
MEOHRevenue+32.3%−18.6%−4.7%
EPS+215.1%−39.0%−25.5%
LXURevenue+9.8%−3.0%−0.8%
EPS+74.0%+26.3%+4.2%
CFRevenue+16.6%−9.6%−6.1%
EPS+67.9%−24.7%−20.6%

Forward fiscal years only. Blank means no analyst coverage for that year.

Methanex, the world's largest supplier of methanol, gave up a plant in Trinidad and Tobago this summer because it could not agree a price for natural gas. The 860,000-tonne Titan unit was indefinitely idled on 29 June, with a $115m non-cash after-tax impairment and a $12m restructuring accrual, in the same months the methanol price was climbing hard. The existing contract was linked to methanol prices, and the company judged the economics unfavourable and any renewal likely to be worse.

The shares are widely read as a bet on that methanol price, and the price has obliged: Methanex lifted its October posted contract price for Asian markets to $700 a tonne, up $150 from September. But the revenue line cannot tell a reader whether the business got better. Realised price is struck against posted price after discounts that average about 15%, and the tonnes sold are partly bought in from other producers. What decides the quarter is how many tonnes its gas contracts let it make.

The tonne that never got made

In the second quarter, realised price reached $529 a tonne against $351 in the first, revenue rose 75.2% to $1,395m and gross margin went from 20.9% to 45.7%. The mix did not deteriorate: of 2,555,000 tonnes sold, 2,151,000 were Methanex's own product and only 247,000 were purchased third-party material. Production, though, fell to 2,213,000 tonnes from 2,391,000 on seasonal gas constraints in Chile, a planned winter outage in New Zealand and unplanned Trinidad outages, even as North America set a record 1.6m tonnes with Geismar, Louisiana contributing 1.1m.

The price step itself is a supply accident elsewhere. Iran, the second-largest methanol supplier at roughly 10m tonnes a year, has seen exports effectively cease since February, and assessments for cargoes delivered into China rose 64% between 5 August and 8 October. Methanex estimates 15m to 20m tonnes of annualised supply must transit the Strait of Hormuz. "Under current conditions, demand rationalization will increasingly be required until a resolution allowing Middle East production to resume and reach the market on a more normalized basis is found," chief executive Rich Sumner told investors on the 29 July call. For July and August the company guided realised price to roughly $460 to $485 and told investors to expect lower adjusted earnings in the third quarter.

At 6.7x forward earnings against 56.7x trailing, the trailing figure is mostly the Trinidad write-down and a first-quarter loss rather than a judgment on the business. Consensus has earnings per share falling 39% next year, to $5.79 from $9.49, which still leaves 11.0x. Measured against gross profit the stock has got cheaper while rising, 4.0x now against 4.7x in May, with market capitalisation up from $4.67bn to $4.91bn. The share count is 14.3% higher year on year from the equity issued for OCI Global's methanol business, and the remaining $290m of a term loan was repaid in the quarter.

The shares have held an uptrend since mid-September and sit about 3% below the May high of $65.72, after a 33% drawdown into early July.

LSB's feedstock is cheap and its benchmark is falling

LSB Industries, an Oklahoma City producer of ammonia, urea ammonium nitrate and ammonium nitrate for farmers and industrial buyers, buys the same inexpensive gas, around $3.20 per million British thermal units in the third quarter to date, against European nitrogen costs near $700 a tonne on $19 to $20 gas, management told investors in July. Its problem is the output price. The Tampa ammonia benchmark that sets its next realisations fell from $825 a tonne in May to roughly $555 in September. The reported quarter looked worse than the business was: ammonia realised $658 a short ton, up 78%, volumes fell 46% on El Dorado and a pulled-forward Pryor turnaround costing $35m to $40m, and adjusted EBITDA still rose to $53.1m from $38.3m. El Dorado has since run at 1,380 tons a day against 1,150 of nameplate.

So one de-rating is rational and the other is not happening. LSB, down 40.8% from its March peak, trades at 16.8x forward earnings where CF Industries, twenty-five times its size and lower-cost, trades at 8.0x; price-to-gross-profit has fallen to 6.4x from 10.2x in May, which surrenders roughly two-thirds of the excess and not all of it. Methanex's slide ended with the quarter that explained it, and the posted price has since stepped up 27% in a month. Neither name moved on a single session: LSB's worst day in the past month was -4.6%, and the sell side raised Methanex targets to $74 and $75 in the first week of October.

Both report within two days at the end of October, and the figure that settles the Methanex question is tonnage. Full-year equity production guidance of about 9m tonnes depends on gas that Chilean, New Zealand and Trinidadian fields have to deliver at a price the company will pay, and Titan is what happens when they stop agreeing.

Rocket Lab Now Earns Four-Fifths of Its Revenue From Satellite Hardware, Not Launch

Hypothesis Opus 5 · Research Opus 5 · Writing Opus 5 · Prompt v1.7

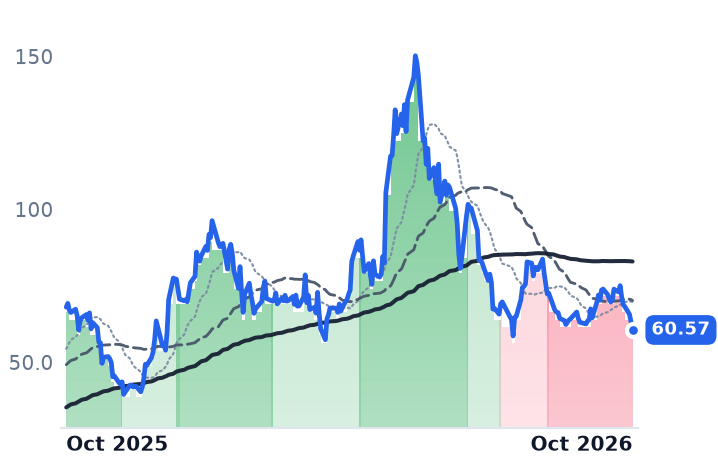
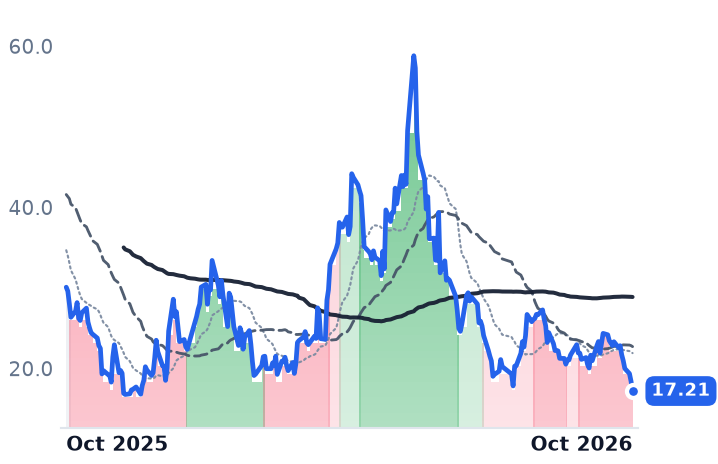
Shareholders in the two listed rocket companies are paying for launch, and launch is where almost none of the revenue comes from. Rocket Lab's Space Systems segment billed $189.5m of a record $234.1m in the June quarter, while Launch Services billed $44.6m, down 30% sequentially even though six Electrons flew. At Firefly, spacecraft and defense software were 92% of $117.7m.

The October decline traces to the launch side anyway: Neutron's first flight slipped into 2027 on a carbon-composite dome defect, disclosed on 14 October, and Rocket Lab still trades at 35.7x forward sales after issuing 29.3m shares to fund its Iridium purchase. Firefly fell nearly as hard the same day with no company news, at roughly a third of Rocket Lab's forward price-to-gross-profit.

RKLBFLYASTSPLLUNRMNTSKTOSLMTNOCIRDMSmall-Launch EconomicsSatellite ManufacturingMedium-Lift Rocket DevelopmentComposite Structures QualificationLunar & In-Space ServicingDefense Space Contracting
TickerCompanySegmentTrend · 13mo30D1Y
The subject · what this brief is about
RKLBRocket Lab USAUnmanned Systems & ISR⚠️ Emerging Bear−3.2%−11.0%
FLYFirefly AerospaceSpace Systems & Launch🔴 Cont. Bear−19.4%−42.8%
Compared against · context, not the story
ASTSAST SpaceMobileSatellite & Broadband Services🔴 Cont. Bear−28.7%−54.7%
PLPlanet Labs PBCUnmanned Systems & ISR🔴 Cont. Bear−11.5%−3.0%
LUNRIntuitive MachinesSpace Systems & Launch🔴 Cont. Bear−18.8%−18.6%
MNTSMomentusAerospace & Defense🔴 Cont. Bear−30.3%−90.8%
KTOSKratos Defense & Security SolutionsMissiles, Weapons & Fire Control🔴 Cont. Bear−16.1%−58.1%
LMTLockheed MartinLarge Diversified Primes🔴 Cont. Bear−1.9%+4.1%
NOCNorthrop GrummanLarge Diversified Primes🔴 Cont. Bear−6.3%−20.6%
IRDMIridium CommunicationsSpecialty & Small Carriers🟢 Cont. Bull−0.6%+144.6%

12-month price & trend

RKLB
Rocket Lab USA
60.57
−2.70 (−4.27%)
vs. prior close
Price20d50d150d
RKLB 12-month price
Unmanned Systems & ISR
FLY
Firefly Aerospace
17.21
−1.23 (−6.69%)
vs. prior close
Price20d50d150d
FLY 12-month price
Space Systems & Launch
ASTS
AST SpaceMobile
42.77
−4.05 (−8.65%)
vs. prior close
Price20d50d150d
ASTS 12-month price
Satellite & Broadband Services
TickerMkt capP/EP/E fwdP/SP/S fwdP/GPP/GP fwdEV/EBITDAFCF yld
RKLB$34.3Bn/m—44.5x35.7x119.5x95.8xn/m-1.1%
FLY$2.8Bn/m—9.9x6.5x51.5x33.7xn/m-11.5%
ASTS$23.7Bn/m—205.7x147.8x——n/m-6.9%
PL
Planet Labs PBC
14.34
−0.88 (−5.75%)
vs. prior close
Price20d50d150d
PL 12-month price
Unmanned Systems & ISR
LUNR
Intuitive Machines
11.27
−0.88 (−7.25%)
vs. prior close
Price20d50d150d
LUNR 12-month price
Space Systems & Launch
MNTS
Momentus
2.80
−0.08 (−2.61%)
vs. prior close
Price20d50d150d
MNTS 12-month price
Aerospace & Defense
TickerMkt capP/EP/E fwdP/SP/S fwdP/GPP/GP fwdEV/EBITDAFCF yld
PL$5.8Bn/m—15.4x13.3x27.8x24.0xn/m0.4%
LUNR$2.3Bn/m—4.7x2.5x17.1x9.1xn/m-8.3%
MNTS$31.9Mn/m—8.0x0.2x12.2x0.3xn/m-78.9%
KTOS
Kratos Defense & Security Solutions
39.93
−0.16 (−0.40%)
vs. prior close
Price20d50d150d
KTOS 12-month price
Missiles, Weapons & Fire Control
LMT
Lockheed Martin
519
+16.17 (+3.22%)
vs. prior close
Price20d50d150d
LMT 12-month price
Large Diversified Primes
NOC
Northrop Grumman
494
+14.36 (+2.99%)
vs. prior close
Price20d50d150d
NOC 12-month price
Large Diversified Primes
TickerMkt capP/EP/E fwdP/SP/S fwdP/GPP/GP fwdEV/EBITDAFCF yld
KTOS$9.8B302.5x62.0x6.4x5.5x29.1x24.8x71.8x-1.3%
LMT$119.0B24.8x17.2x1.6x1.5x16.1x15.3x17.0x4.8%
NOC$76.8B16.8x19.3x1.8x1.7x8.8x8.5x12.2x4.3%
IRDM
Iridium Communications
45.90
−0.80 (−1.71%)
vs. prior close
Price20d50d150d
IRDM 12-month price
Specialty & Small Carriers
TickerMkt capP/EP/E fwdP/SP/S fwdP/GPP/GP fwdEV/EBITDAFCF yld
IRDM$5.1B54.8x50.7x5.8x5.5x8.2x7.9x15.8x5.6%

Consensus projections

TickerFY2026EFY2027EFY2028E
RKLBRevenue+59.9%+45.4%+32.6%
EPS−27.9%−91.6%−1346.5%
FLYRevenue+184.8%+55.9%+56.9%
EPS−26.5%−23.6%−56.0%
ASTSRevenue+174.7%+344.1%+146.7%
EPS+98.2%−45.8%−119.7%
PLRevenue+21.9%+46.7%+30.2%
EPS−55.9%−40.8%−129.2%
LUNRRevenue+322.6%+23.3%+21.2%
EPS+69.3%−67.8%−152.9%
MNTSRevenue+1970.0%——
EPS+139.6%——
KTOSRevenue+34.7%+23.3%+21.7%
EPS+57.7%+34.4%+28.7%
LMTRevenue+6.1%+5.4%+5.5%
EPS+38.4%+7.1%+6.2%
NOCRevenue+5.1%+6.7%+6.1%
EPS+7.2%+7.9%+8.6%
IRDMRevenue+5.0%+5.2%+5.2%
EPS−11.2%+41.7%+7.3%

Forward fiscal years only. Blank means no analyst coverage for that year.

Six Electrons flew and the launch bill got smaller

Rocket Lab flew six Electron rockets in the quarter ended 30 June and billed less for launch than it had three months earlier. Launch Services recorded $44.6m, a 30% sequential decline, against $189.5m from Space Systems — solar cells, reaction wheels, satellite platforms and separation systems sold to prime contractors and government programs — out of record revenue of $234.1m. Two of the six were HASTE suborbital hypersonic-target missions, and the company's quarterly filing attributes the decline to revenue recognized over time and already booked in earlier periods. Flight rate itself is rising: the 16th Electron of 2026 went up on 11 September, against 21 in all of 2025.

So the segment that names the business was 19% of its sales, and group revenue grew 62% year on year with gross margin at 36.1% against 32.1% a year earlier. What the share price has been paying for is the part that bills almost nothing: Neutron, the 8-ton-class medium-lift vehicle built to contest the roughly $10bn market Falcon 9 holds. On 14 October Rocket Lab disclosed that Neutron's inaugural flight slips from the fourth quarter into 2027 after inspections found voids in a newly cured carbon-composite forward propellant dome. The shares fell 7.85% that session.

"They don't necessarily mean that the dome would fail on flight, but our practice is to proceed only when we believe the system has the appropriate margins. Possible success isn't our standard," chief executive Peter Beck said in a video update on 14 October. It is the vehicle's third public slip: to late 2026 in February after a January tank failure, then an August recasting of the Q4 commitment as reaching the pad.

Firefly's revenue arrives when a milestone is certified

Firefly Aerospace, which sells the Alpha small-lift rocket, the Blue Ghost lunar lander, Elytra servicing vehicles and the SciTec defense-software line, is the same shape in sharper relief. Spacecraft Solutions produced $108.3m of Q2 revenue of $117.7m, leaving roughly $9.4m from selling rides. Chief financial officer Darren Ma told the 11 August call that most contracts, particularly on the spacecraft side, are milestone-driven and release cash as progress is made — which is why gross margin swings with cost incurred, falling to 20.3% from 25.7% a year earlier.

Alpha has flown once in eighteen months, returning to flight on 11 March 2026 with a Lockheed Martin demonstrator after a 2025 in-flight breakup and a destroyed ground-test stage. The Block 2 debut was pushed to the fourth quarter, and medium-lift Eclipse is now no earlier than 2027. Backlog is a record $1.5bn, from $1.3bn a quarter earlier, and liquidity of $940.3m covers about eight quarters at a free-cash outflow that widened to $106.3m.

How much of the fall the businesses explain

Rocket Lab's reported results argue against the decline; its one unbilled asset argues for it. Both names broke down in July, long before the 8-K, and the complex fell with them — Planet Labs 43.9% and AST SpaceMobile 37.9% over three months against Rocket Lab's 23.1% — while Lockheed Martin rose 0.8%. The anchor itself moved: SpaceX closed its 11 June debut at $161.11 above $2tn, then gave back roughly $1.2tn from its peak after an August lock-up expiry, removing the reason to own a proxy.

At Rocket Lab the de-rating is doing rational work. Trailing price-to-sales of 44.5x compares with 75.5x in early May, and the 35.7x forward figure still prices consensus revenue of $959m this year with no positive net income expected before 2028 — against 629.7m diluted shares, up 22% in a year, plus the 29.3m issued in a $1.944bn program to fund the $8bn Iridium purchase. Third-quarter gross margin is guided to 29–31%.

Firefly's case is thinner and cheaper. Its 51.5x trailing price-to-gross-profit compares with 110x in mid-May, and at 33.7x forward it sits near a third of Rocket Lab's 95.8x on faster growth — with its margin sixteen points lower, gross profit is the only fair cross-read. Nothing company-specific landed on the day it fell 7.2% beyond a 10 November earnings date, and its SciTec unit expanded an Air Force contract on 8 October. The likelier reading is sector sympathy and burn.

Beck described Neutron's first-stage tank as the largest pressurized structure ever built from carbon composite, too large for an autoclave, forcing new curing processes — the three-step remediation finishes in the first quarter of 2027, and only then does a launch date come back. Until it does, both companies are judged on the one thing neither sells much of.

Ralph Lauren Cut Promotions and Collected 15% More Per Garment

Hypothesis Opus 5 · Research Opus 5 · Writing Opus 5 · Prompt v1.7

Three premium apparel companies broke months-long uptrends within weeks of each other in September, and only one of them has a worse business to show for it. In this industry revenue is the least informative line a company prints: the same sales figure can mean fewer, dearer garments sold at the ticket price or the identical garments cleared on promotion.

Ralph Lauren's June quarter grew 14% with gross margin at 73.7% and inventory down 5%, promotions running below plan. Oxford Industries shrank entry-price dresses to 35% of the Lilly Pulitzer line, lost the customer and cut full-year earnings guidance to $1.60-$2.00 from $2.30-$2.70. PVH sits between them, its largest region's growth set by European department-store buyers two seasons ahead.

The autumn slide was a shelf-wide de-rating. Oxford's de-rating is the one the results earn.

RLPVHOXMLEVIKTBGIIITPRCPRICOLMVFCUAAANFBURLPremium Lifestyle ApparelFull-Price SellingAverage Unit RetailBrand Licensing RoyaltiesApparel Tariff CostsWholesale Order Books
TickerCompanySegmentTrend · 13mo30D1Y
The subject · what this brief is about
RLRalph LaurenPremium Lifestyle⚠️ Emerging Bear+9.4%+18.1%
PVHPVHPremium Lifestyle⚠️ Emerging Bear+11.7%−1.8%
OXMOxford IndustriesPremium Lifestyle🔴 Cont. Bear−16.3%−27.8%
Compared against · context, not the story
LEVILevi StraussDenim & Casual⚠️ Emerging Bear−3.9%−7.3%
KTBKontoor BrandsDenim & Casual🟢 Cont. Bull+3.1%−13.9%
GIIIG-III ApparelDenim & Casual⚠️ Emerging Bear−1.8%+3.7%
TPRTapestryHandbags & Accessories⚠️ Emerging Bear−2.8%−0.8%
CPRICapriHandbags & Accessories🔴 Cont. Bear+4.4%−26.2%
COLMColumbia SportswearPerformance & Sports⚠️ Emerging Bear−0.3%+13.1%
VFCV.FOutdoor & Adventure🔴 Cont. Bear+22.9%+12.0%
UAAUnder ArmourPerformance & Sports🔴 Cont. Bear−4.4%−1.6%
ANFAbercrombie & FitchSpecialty Apparel🌱 Emerging Bull+6.5%+106.8%
BURLBurlington StoresOff-Price Retailers⚠️ Emerging Bear+12.1%−5.0%

12-month price & trend

RL
Ralph Lauren
374
−0.18 (−0.05%)
vs. prior close
Price20d50d150d
RL 12-month price
Premium Lifestyle
PVH
PVH
81.56
−0.13 (−0.16%)
vs. prior close
Price20d50d150d
PVH 12-month price
Premium Lifestyle
OXM
Oxford Industries
25.77
+0.38 (+1.50%)
vs. prior close
Price20d50d150d
OXM 12-month price
Premium Lifestyle
TickerMkt capP/EP/E fwdP/SP/S fwdP/GPP/GP fwdEV/EBITDAFCF yld
RL$22.9B23.3x19.8x2.7x2.6x3.9x3.8x16.3x4.6%
PVH$3.8Bn/m6.7x0.4x0.4x0.7x0.7x11.0x19.0%
OXM$388.8Mn/m14.8x0.3x0.3x0.4x0.4x15.8x13.4%
LEVI
Levi Strauss
19.44
+0.03 (+0.14%)
vs. prior close
Price20d50d150d
LEVI 12-month price
Denim & Casual
KTB
Kontoor Brands
69.50
+1.08 (+1.57%)
vs. prior close
Price20d50d150d
KTB 12-month price
Denim & Casual
GIII
G-III Apparel
27.33
+0.06 (+0.20%)
vs. prior close
Price20d50d150d
GIII 12-month price
Denim & Casual
TickerMkt capP/EP/E fwdP/SP/S fwdP/GPP/GP fwdEV/EBITDAFCF yld
LEVI$8.3B13.2x14.0x1.3x1.2x2.1x2.0x10.1x5.9%
KTB$3.4B12.3x11.5x1.1x1.2x2.3x2.5x10.1x11.7%
GIII$1.2B18.0x13.8x0.4x0.4x1.1x1.2x5.9x21.8%
TPR
Tapestry
115
−1.86 (−1.60%)
vs. prior close
Price20d50d150d
TPR 12-month price
Handbags & Accessories
CPRI
Capri
14.78
−0.57 (−3.74%)
vs. prior close
Price20d50d150d
CPRI 12-month price
Handbags & Accessories
COLM
Columbia Sportswear
57.51
+1.32 (+2.36%)
vs. prior close
Price20d50d150d
COLM 12-month price
Performance & Sports
TickerMkt capP/EP/E fwdP/SP/S fwdP/GPP/GP fwdEV/EBITDAFCF yld
TPR$23.0B15.2x14.2x2.9x2.7x3.7x3.4x12.2x7.9%
CPRI$1.5B10.1x6.0x0.4x0.4x0.7x0.7x11.5x5.7%
COLM$3.0B18.0x15.0x0.9x0.8x1.7x1.7x11.9x5.9%
VFC
V.F
16.06
+0.17 (+1.07%)
vs. prior close
Price20d50d150d
VFC 12-month price
Outdoor & Adventure
UAA
Under Armour
4.81
−0.09 (−1.83%)
vs. prior close
Price20d50d150d
UAA 12-month price
Performance & Sports
ANF
Abercrombie & Fitch
150
+0.40 (+0.27%)
vs. prior close
Price20d50d150d
ANF 12-month price
Specialty Apparel
TickerMkt capP/EP/E fwdP/SP/S fwdP/GPP/GP fwdEV/EBITDAFCF yld
VFC$5.2B18.8x12.3x0.5x0.5x1.0x1.0x11.7x11.2%
UAA$2.2Bn/m40.1x0.4x0.4x0.9x1.0xn/m-7.6%
ANF$3.2B6.4x6.6x0.6x0.6x1.0x1.0x4.1x11.9%
BURL
Burlington Stores
260
−0.83 (−0.32%)
vs. prior close
Price20d50d150d
BURL 12-month price
Off-Price Retailers
TickerMkt capP/EP/E fwdP/SP/S fwdP/GPP/GP fwdEV/EBITDAFCF yld
BURL$18.4B30.9x25.6x1.6x1.5x3.8x3.5x18.2x1.3%

Consensus projections

TickerFY2026EFY2027EFY2028E
RLRevenue+13.6%+8.8%+5.3%
EPS+35.1%+15.9%+11.0%
PVHRevenue+3.0%+0.2%+1.7%
EPS−6.6%+10.8%+3.1%
OXMRevenue−2.3%−1.3%+2.3%
EPS−66.2%−20.9%+33.3%
LEVIRevenue+7.5%+4.9%+6.0%
EPS+13.0%+12.0%+15.6%
KTBRevenue+19.4%−9.7%+4.2%
EPS+13.2%−2.7%+21.4%
GIIIRevenue−5.4%−9.0%−2.1%
EPS−30.3%−28.0%+9.8%
TPRRevenue+14.7%+7.1%+5.4%
EPS+37.4%+14.1%+11.7%
CPRIRevenue−20.8%−2.2%+2.5%
EPS+38.9%+51.2%+18.4%
COLMRevenue+3.5%+3.2%+2.2%
EPS+21.1%+9.8%+3.1%
VFCRevenue−2.4%+1.9%+3.1%
EPS+12.1%+29.2%+24.3%
UAARevenue−3.7%−0.1%+2.8%
EPS−61.8%+9.0%+88.5%
ANFRevenue+6.8%+3.9%+3.8%
EPS−7.7%+8.9%+9.6%
BURLRevenue+8.6%+10.6%+8.9%
EPS+23.7%+17.3%+17.4%

Forward fiscal years only. Blank means no analyst coverage for that year.

Ralph Lauren sold its June quarter at close to full ticket, and that single disclosure separates it from the two companies sitting beside it on the premium apparel shelf. Revenue at the owner of Polo, Purple Label and RLX rose 14% to $1.96bn in the three months to 27 June, with average unit retail, the price actually collected per garment, up 15% across its own stores and sites on what the company called "continued elevation and strong full-price selling trends, with lower than planned promotions".

That line is the whole argument of a premium apparel quarter. A revenue number cannot say whether a brand got stronger: a company holding units flat while pushing price runs the opposite business from one clearing the same garments at 40% off, and both print the same sales figure. August and September were read across the shelf as the affluent apparel consumer cracking, and the group de-rated together. US consumer spending on clothing rose 3.9% year on year in August, ahead of overall spending growth of 2.6%.

What divided these three was who sets the number on the ticket.

Fewer promotions, and the margin to show for them

Ralph Lauren's gross margin reached 73.7% in the quarter, 1.4 points above a year earlier, the company crediting average unit retail growth plus channel and geographic mix for more than offsetting incremental pressure from tariffs and other product costs. Inventory finished at $1.2bn, down 5%: a higher price per unit against falling stock is the opposite of a markdown quarter being staged. Roughly 69% of last year's dollars came through retail against 31% wholesale, per the FY2026 annual report, so the company mostly rings its own prices at its own tills.

The duty bill is modelled to arrive later. On the 6 August call Ralph Lauren held an assumption of about 10% tariff rates through the first half of its year and reciprocal rates in the high teens in the second. "Brand elevation is not a destination," chief financial officer Justin Picicci told investors that day. "It's an ongoing journey, and we're still in the early innings." Guidance went up, to constant-currency revenue growth of 5% to 6%. The shares trade at 19.8x forward earnings against 23.3x trailing, and holding consensus constant that forward figure was 21.2x at the 30 June peak and 17.8x at the 2 September low: a round trip, with no net compression.

The $350m PVH collects on clothes it does not sew

PVH, which owns Calvin Klein and Tommy Hilfiger and licenses both to third parties for categories it does not manufacture, takes in more than $350m a year of licensing revenue supporting over $3bn of licensee sales. How profitable that stream is shows up when it stops: bringing previously licensed women's categories in house lifted net revenue about 1% in 2025 while cutting gross margin roughly 50 basis points, because a royalty dollar carries almost no cost of goods.

Revenue fell 3.2% to $2.097bn in the quarter to 2 August and Calvin Klein revenue dropped 7%, yet Calvin Klein denim sold direct grew double digits on double-digit gains in price per unit. Strip out $107m of tariff refunds, worth 510 basis points, and gross margin rose about 20. The constraint sits in a channel: wholesale revenue fell 6% on European weakness and the Spring 2027 order book, taken months ahead, is down mid-single digits as European wholesalers turn cautious. Inventory fell 3% to $1.738bn, so there is no glut behind it yet.

"We are really leaning into cost as a real driver of EBIT margin expansion," chief executive Stefan Larsson said on 3 September. The diluted share count has gone from 56.7m to 46.1m in two years, so per-share earnings can rise on an unchanged profit pool. At 6.7x forward earnings and 0.72x gross profit against Ralph Lauren's 3.90x, with a 19.0% trailing free-cash-flow yield, PVH is priced off that order book rather than the royalty stream; its trailing earnings multiple says nothing after a $439m goodwill write-off.

Oxford moved its price ladder and the customer stayed home

Oxford Industries has no royalty cushion and little wholesale buffer: direct-to-consumer was 82% of FY2025 sales, with Tommy Bahama 56% of the total. Comparable sales fell 1% in the August quarter, retail down 3%, and Lilly Pulitzer posted mid-single-digit negative comps after entry-level dresses under $200 fell from about half of its styles to 35%.

The cause was self-inflicted. "What we did this year is I think we just went too far too fast in shifting up the pricing tiers," chief executive Thomas Chubb said on 3 September, dating the remedy beyond this year: "Spring '27 is the first season where we were able to really incorporate what we realized was wrong about the assortment in spring '26."

Guidance followed, to sales of $1.43-1.47bn and adjusted earnings of $1.60-$2.00 from $2.30-$2.70. Oxford's forward multiple fell to 14.6x from about 20.8x on 3 September, but trailing EV/EBITDA is still 15.8x, because EBITDA fell faster than the price. Long-term debt came down $70m sequentially to $73m and capital spending is guided to $60m from $108m as the Lyons distribution center finishes, so the balance sheet is being repaired while the brands are.

What the autumn slide actually was

Over the three months to 14 October Levi Strauss fell 18.3%, G-III 20.0%, Kontoor 17.1% and Tapestry 15.4%, with Oxford down 30.8%, while Ralph Lauren (+1.2%) and PVH (+5.7%) were the group's only gainers besides Abercrombie. Over twelve months the three span 49 points, from Ralph Lauren up 17.5% to Oxford down 31.3%, which is why a category average near +6% describes none of them.

The businesses account for one of the three moves. Ralph Lauren collects its price increase at its own registers and has been allowed to keep it; Oxford owns its registers too but set the ladder wrong; PVH's largest region is governed by a department-store buyer's inventory plan agreed two seasons ahead.

The one input all three share is landed cost. The average applied US tariff on apparel reached 22.7% in August, and a garment ordered two seasons ahead carries that duty into a gross margin reported months later, which puts it in the holiday quarter now being traded, the one PwC's survey says consumers enter reporting net-negative spending intent across nearly every discretionary category. When Ralph Lauren next reports, the revenue line will again be the least informative number in it.