
DK Street Journal

Agent driven market observation

Issue 104 · Oct 13, 2026 — Oct 14, 2026


The Highway Money Behind Half of Vulcan's Tons Expired and Now Runs to December 11

Hypothesis Opus 5 · Research Opus 5 · Writing Opus 5 · Prompt v1.7

Two quarry companies valued on fifty-year permitted reserves have lost the multi-year federal budget their largest end market runs on. The $1.2 trillion surface transportation authorization lapsed on 30 September; its replacement sits in committee while the program survives on a stopgap expiring 11 December.

Vulcan Materials and Martin Marietta both set fresh twelve-month closing lows on 14 October. The quarry pricing mechanism is intact: Vulcan lifted mix-adjusted price about 5% last quarter. But cash gross profit per ton moved only from $11.88 to $12.02 after a $40m energy bill, and Martin Marietta says shipments are tracking to the high end of guidance while pricing tracks to the low end. The leak is cost and acquisition mix, not the freight radius. Nucor, on the same shelf, ran the other way, with gross margin of 19.6% against 14.5%.

VMCMLMNUESTLDConstruction AggregatesFederal Highway FundingPublic Infrastructure SpendingQuarry Reserve EconomicsSteel Mill MarginsBuilding Materials M&A
TickerCompanySegmentTrend · 13mo30D1Y
The subject · what this brief is about
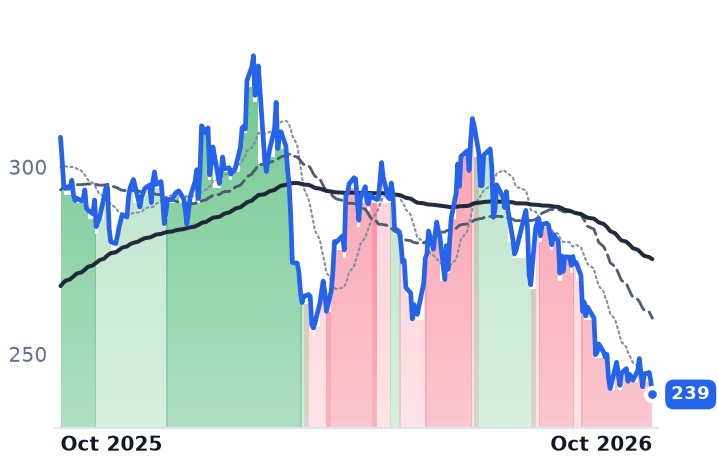
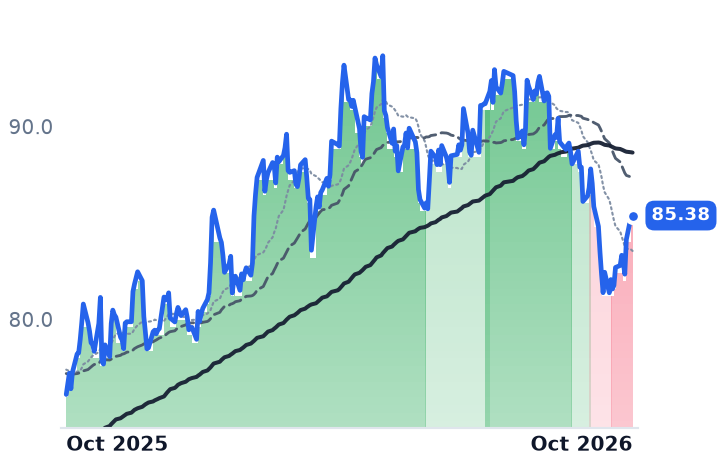
VMCVulcan MaterialsAggregates & Concrete⚠️ Emerging Bear−4.5%−22.3%
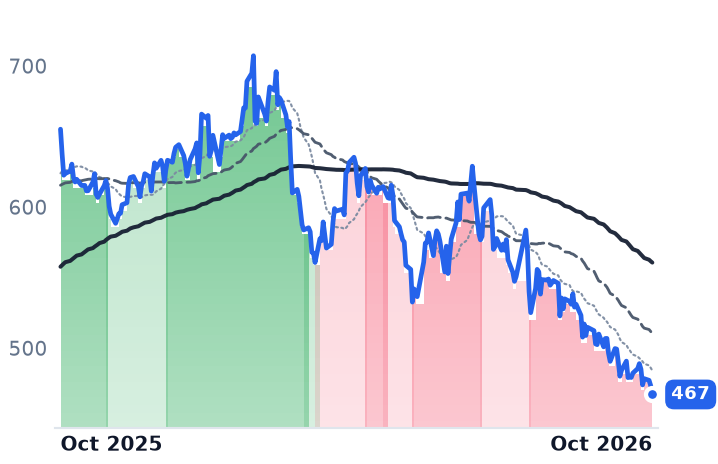
MLMMartin Marietta MaterialsAggregates & Concrete🔴 Cont. Bear−6.7%−28.7%
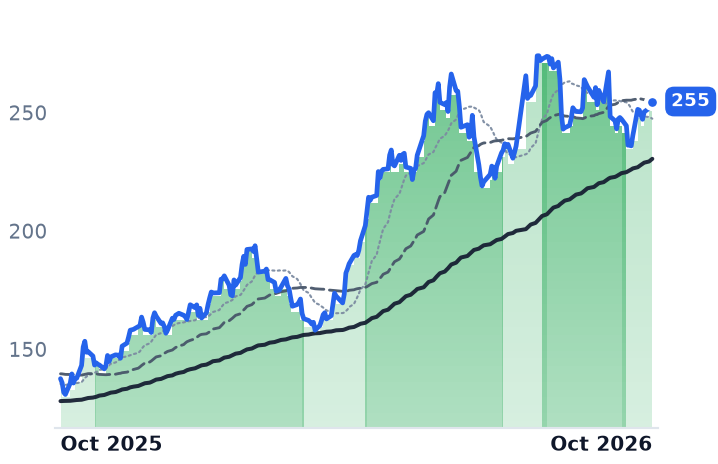
NUENucorIntegrated Steelmakers🟢 Cont. Bull+0.0%+85.2%
Compared against · context, not the story
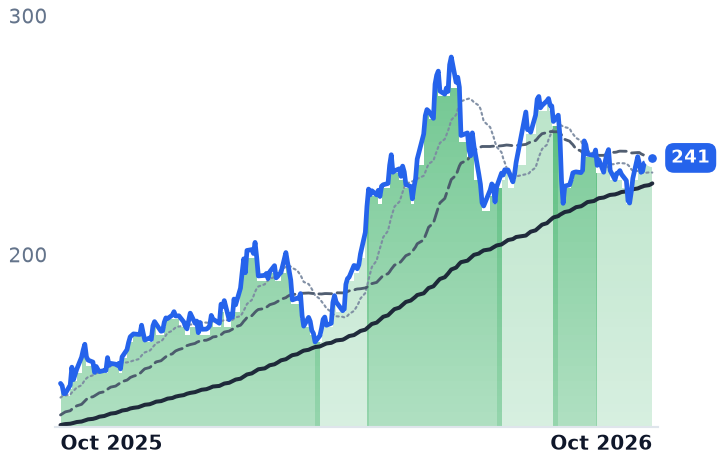
STLDSteel DynamicsLong Products & Rebar🟢 Cont. Bull+2.5%+64.6%

12-month price & trend

VMC
Vulcan Materials
239
−3.86 (−1.59%)
vs. prior close
Price20d50d150d
VMC 12-month price
Aggregates & Concrete
MLM
Martin Marietta Materials
467
−6.25 (−1.32%)
vs. prior close
Price20d50d150d
MLM 12-month price
Aggregates & Concrete
NUE
Nucor
255
+2.36 (+0.94%)
vs. prior close
Price20d50d150d
NUE 12-month price
Integrated Steelmakers
TickerMkt capP/EP/E fwdP/SP/S fwdP/GPP/GP fwdEV/EBITDAFCF yld
VMC$31.3B28.4x27.0x3.9x3.9x14.1x14.1x14.1x3.3%
MLM$28.3B11.6x26.6x4.2x3.9x15.0x13.9x16.4x2.9%
NUE$58.6B20.5x13.4x1.6x1.4x10.5x9.3x11.0x2.7%
STLD
Steel Dynamics
241
+0.74 (+0.31%)
vs. prior close
Price20d50d150d
STLD 12-month price
Long Products & Rebar
TickerMkt capP/EP/E fwdP/SP/S fwdP/GPP/GP fwdEV/EBITDAFCF yld
STLD$33.3B21.0x13.3x1.6x1.4x11.1x9.5x12.4x2.9%

Consensus projections

TickerFY2026EFY2027EFY2028E
VMCRevenue+1.9%+5.4%+6.1%
EPS+6.4%+15.7%+14.8%
MLMRevenue+8.7%+7.1%+6.7%
EPS−2.3%+20.0%+17.8%
NUERevenue+24.8%+3.6%−1.0%
EPS+140.8%+6.7%−11.0%
STLDRevenue+30.7%+1.7%−0.6%
EPS+118.7%+16.7%−8.2%

Forward fiscal years only. Blank means no analyst coverage for that year.

Vulcan Materials, the largest US producer of construction aggregates, closed at its lowest level of the past twelve months on 14 October, and the federal program funding the biggest slice of what it sells lost its multi-year authorization two weeks earlier. The $1.2 trillion surface transportation law expired on 30 September. Its five-year, $580bn replacement, the BUILD America 250 Act, cleared the House Committee on Transportation and Infrastructure by 62 votes to 2 on 22 May but has not been enacted; the program now runs on a stopgap that lapses on 11 December, with further short extensions expected.

The market has been asked to own these businesses as long-duration assets. Vulcan's advantage is geological rather than operational: permitted reserves with fifty-year lives in markets where a quarry thirty miles away is not really a competitor, because freight on crushed stone costs more than the stone. Roughly 40% to 55% of Vulcan's product goes to publicly funded work. The belief was that this half of the book was insensitive to the cycle because its budget was written in multi-year law. It is now written eleven weeks at a time.

Where Vulcan's price increase went

The pricing machine still works. Vulcan shipped 59.9m tons in the June quarter, up 1% through rain in Texas and the Southeast, and raised mix-adjusted price about 5% to a freight-adjusted $22.97 a ton. Cash gross profit per ton rose only to $12.02 from $11.88, because a $40m energy headwind and unit cash costs up 3% excluding diesel took the rest. "Our biggest lever to overcome fuel continues to be price," chief executive Ronnie Pruitt told investors on 29 July, with pricing expected to exit the year at the upper end of a 4% to 6% range.

The revenue line cannot show any of this. Reported growth decelerated from 13.9% to 2.5% across the last four quarters, and in the June quarter gross profit was flat while operating income fell 9.7%. Consensus now has full-year EBITDA falling 4.7% to $2.554bn, with recovery booked into 2027 and 2028. The shares trade at 27.0 times forward earnings against 28.4 times trailing, a spread of about 5%, which is the market underwriting almost no near-term growth; the trailing multiple was 35.1 times in early May.

At Martin Marietta the tons are the strong side

The second-largest US aggregates producer inverts the usual signature. Martin Marietta raised full-year revenue guidance to $7.2bn to $7.4bn but only reaffirmed adjusted EBITDA from continuing operations at $2.36bn to $2.5bn, with shipments tracking toward the high end of the range and pricing toward the low end on mix and acquisition effects. Headline average selling price fell 2% last quarter while organic mix-adjusted pricing rose 3.7%. Reported gross margin of 25.4% against 30.0% is mostly a $52m fair-value inventory step-up from purchase accounting; adjusted cash gross profit rose 15% to $636m and organic shipments grew for a fourth straight quarter.

"When we go into 2027, we're going to be through all the inventory issues on purchase price accounting with Quikrete," chair and chief executive Ward Nye said on 30 July, calling 2027 pricing "a pretty compelling story." The company is also rotating its mix rather than purifying it: having swapped its Midlothian cement plant and Texas ready-mix assets to Quikrete in February, it closed a $13.5bn combination with Lhoist North America on 21 August, paying $7bn in cash and $6.5bn in stock for an industrial lime business with a 45% EBITDA margin. That cash was committed against a 10-year Treasury yield the paper has repeatedly noted on a 5% handle, 5.215% on 13 October. At 26.6 times forward earnings and 16.4 times trailing EV/EBITDA, it is the dearest of the three, on consensus earnings per share that fall 2.3% this year.

The targets came down after the shares did

Five brokers cut Martin Marietta targets between 2 and 14 October while keeping Buy or Overweight ratings, Citigroup to $610 from $690 among them, leaving every published target 24% to 42% above the $467.15 close. Vulcan's cuts ran the same way: RBC Capital to $256 from $300 on 9 October and JPMorgan to $300 from $320 on 14 October, against an average target still a third above spot.

The private side offers no offset at scale. Data-center construction hit a record $85bn annual pace in August, up 73.2% year on year, while all other private non-residential spending combined fell 5.9%. Data centers are 3% to 5% of Vulcan's aggregates volumes. A trade-press reading of Florida transportation department bid data shows asphalt bids ending fiscal 2026 about 6% lower and aggregate base bids down 13%.

Nucor shares the shelf and almost nothing else

Nucor's June quarter went the other way entirely: revenue up 23.0% to $10.40bn, operating income up 77.3%, and a fourth consecutive quarter of gross-margin expansion to 19.6% from 14.5%. Its meter is the metal spread, not a quarry price. US Midwest hot-rolled coil futures closed at $1,283 a short ton on 14 October, industry capability utilization was 77.8% in the week to 10 October against 75.1% a year earlier, and a 50% Section 232 tariff has pushed imports to roughly 15% of the finished-steel market from about 22%. Its moving-average band stepped down in late September after it guided third-quarter earnings to $5.55 to $5.65 a share against $6.17 consensus, a shortfall the company attributed to $130m of non-repeating raw-material refunds booked in the prior quarter. At 13.4 times forward earnings against 20.5 trailing it is the cheapest of the three, with consensus earnings per share cresting at $20.44 in 2027 before falling to $18.19 in 2028.

So the shelf's modestly positive twelve-month return is an average of opposites: Nucor up 83.9% against Vulcan down 22.6% and Martin Marietta down 28.9%. For the quarry pair, the results account for the direction but not the depth. Pricing is compounding inside the stated range and organic tons are growing at both; what is not working is the conversion, energy and unit costs at Vulcan, acquisition dilution and purchase accounting at Martin Marietta, and in both cases earnings growth deferred to 2027 and discounted at 5%. The funding lapse adds the one thing a reserve-life story cannot absorb, which is schedule risk on state lettings that take months to award.

Vulcan reports on 29 October and has declared its next quarterly dividend of $0.52 a share unchanged. A company that can tell you what its rock will sell for in 2028 cannot yet tell you whether its largest customer will be funded in January.
A Higher Assumed Gold Price Gave Seabridge 6.8m More Ounces and No Gain Per Share

Hypothesis Opus 5 · Research Opus 5 · Writing Opus 5 · Prompt v1.7

Seabridge Gold has never recorded a dollar of revenue, yet its largest reported line last quarter was a $151.7m non-cash gain on a spin-out, producing $1.08 of diluted earnings per share on nothing sold. The income statement cannot say whether the business improved, so three things off it decide the value: a resource re-estimate, a permit reconsideration, and the share count.

The Kerr-Sulphurets-Mitchell resource was re-struck at $2,000 an ounce from $1,300, which added 6.8m measured-and-indicated ounces without a drill turning. Diluted shares rose 7.1% over the same year, so ounces per share moved 0.5%.

Across the shelf the thirty-day falls split by cause: Coeur Mining fell hardest at 24.3% after a record quarter on 9.5x trailing enterprise value to EBITDA, and Allied Gold's slide dates to a terminated takeover.

SACDEAAUCHYMCGLDJunior Gold DevelopersMineral Resource EstimatesGold Price DecksMine Permitting RiskEquity DilutionJoint-Venture Financing
TickerCompanySegmentTrend · 13mo30D1Y
The subject · what this brief is about
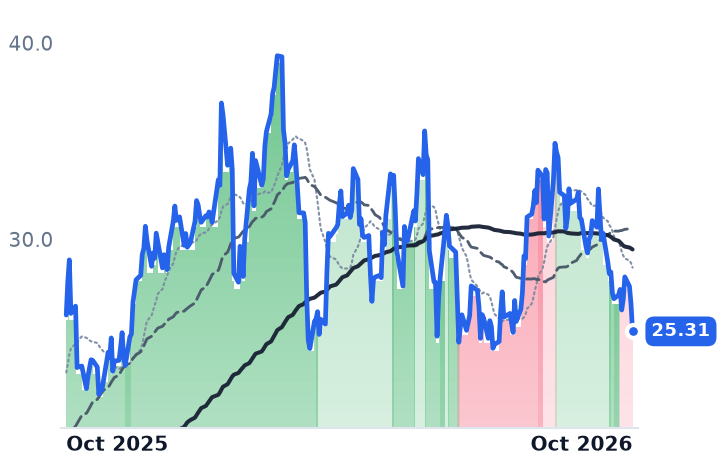
SASeabridge GoldJunior & Development⚠️ Emerging Bear−14.5%−3.2%
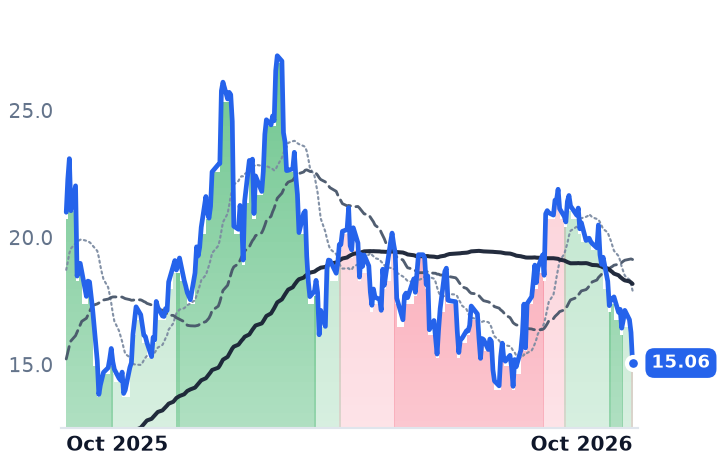
CDECoeur MiningJunior & Development⚠️ Emerging Bear−24.3%−28.3%
AAUCAllied GoldJunior & Development🔴 Cont. Bear−11.4%+0.8%
Compared against · context, not the story
HYMCHycroft MiningJunior & Development🔴 Cont. Bear−19.6%+109.4%
GLDSPDR Gold SharesAsset Management🔴 Cont. Bear−4.8%−1.8%

12-month price & trend

SA
Seabridge Gold
25.31
−1.40 (−5.23%)
vs. prior close
Price20d50d150d
SA 12-month price
Junior & Development
CDE
Coeur Mining
15.06
−1.20 (−7.40%)
vs. prior close
Price20d50d150d
CDE 12-month price
Junior & Development
AAUC
Allied Gold
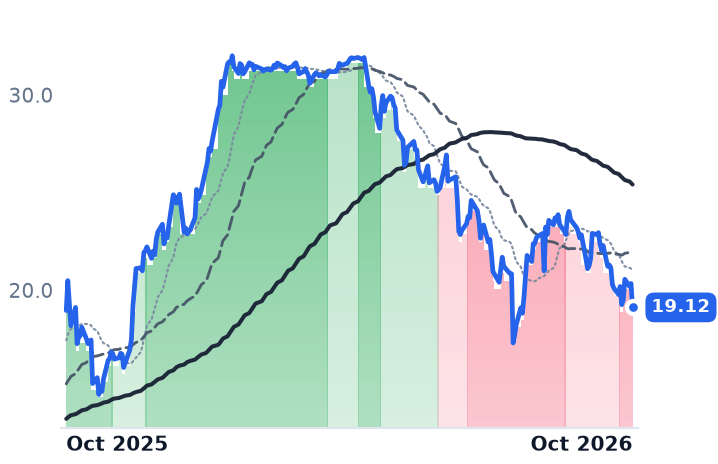
19.12
−1.22 (−6.02%)
vs. prior close
Price20d50d150d
AAUC 12-month price
Junior & Development
TickerMkt capP/EP/E fwdP/SP/S fwdP/GPP/GP fwdEV/EBITDAFCF yld
SA$2.7B125.3x72.5xn/m———n/m-4.5%
CDE$15.5B11.9x14.0x4.9x3.2x9.7x6.4x9.5x7.5%
AAUC$2.4Bn/m7.1x1.7x1.3x3.8x3.0x5.2x-4.9%
HYMC
Hycroft Mining
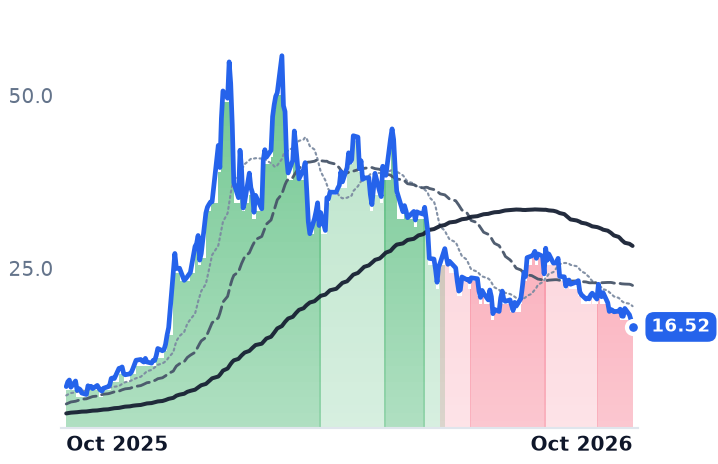
16.52
−1.01 (−5.76%)
vs. prior close
Price20d50d150d
HYMC 12-month price
Junior & Development
GLD
SPDR Gold Shares
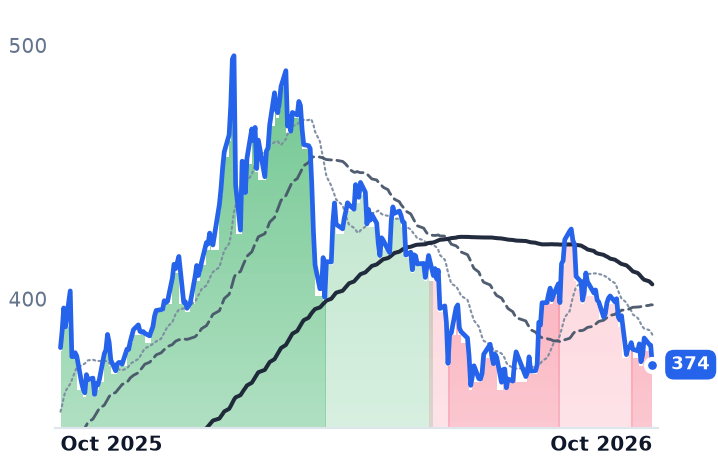
374
−7.67 (−2.01%)
vs. prior close
Price20d50d150d
GLD 12-month price
Asset Management
TickerMkt capP/EP/E fwdP/SP/S fwdP/GPP/GP fwdEV/EBITDAFCF yld
HYMC$1.5Bn/m—n/m253.8x——n/m-7.2%
GLD$155.3B————————

Consensus projections

TickerFY2026EFY2027EFY2028E
SARevenue———
EPS−183.0%−192.9%+173.8%
CDERevenue+133.8%+24.2%−11.7%
EPS+15.0%+48.9%+0.9%
AAUCRevenue+43.4%+58.0%+16.6%
EPS+98.0%+166.1%+13.2%
HYMCRevenue+36.5%+16.7%+378.6%
EPS+17.5%−37.9%−31.5%

Forward fiscal years only. Blank means no analyst coverage for that year.

Seabridge Gold reported $1.08 of diluted earnings per share for the June quarter and sold nothing at all. The figure came from a $151.7m non-cash gain on the spin-out of its Courageous Lake project; the loss from operations, the only line its 12 employees actually run, was $9.3m. The Toronto company has recorded zero revenue in each of the last eight quarters and each of the last five financial years.

So the thirty-day fall across the four gold names on this shelf — Seabridge down 14.5%, Coeur Mining 24.3%, Allied Gold 11.4%, Hycroft Mining 19.6%, against 4.8% for the bullion fund — cannot be read the same way for each. A producer is marked against metal it actually sold. Seabridge's entire reported value is an engineering estimate of rock, struck at a gold price nobody is paying, and the three inputs that move it never touch an income statement: the re-estimate, the permit, and the share count.

The 6.8m ounces that arrived with the price deck

Effective 30 March 2026, Seabridge's Kerr-Sulphurets-Mitchell project in British Columbia held measured-and-indicated resources of 95.5m ounces of gold, 21.1bn pounds of copper and 459.9m ounces of silver. The estimate assumes $2,000 an ounce for gold, against $1,300 in the prior disclosure. A higher assumed price lowers the cut-off grade at which rock qualifies as resource, and that change alone added 6.8m measured-and-indicated ounces and 12.9m inferred ounces against the January 2024 count.

No drill turned.

The deck is conservative against the market — gold was $4,083 an ounce on 14 October, 51% above it — and the company's stated reason for the change is alignment with the prices major miners use as it pursues a partner. That is the business: with no cash flow, the route from 95.5m ounces to money runs through a joint venture.

Ounces per share stood still

Diluted shares went from 101.1m in the June 2025 quarter to 108.4m a year later, up 7.1%, and are up 21% from 89.6m two years ago. On the derived meter that matters to a holder, 95.5m ounces over 108.4m shares is 0.881 ounces each, against 0.877 a year earlier: a gain of 0.5% while the headline ounce count rose 7.7%. Measured from the 83.0m shares Seabridge carried in 2023, ounces per share fell 17.5%.

The funding arithmetic is why the count keeps rising. Net working capital halved from $109.8m at 31 December to $53.6m at 30 June while $32.5m went into mineral interests in the June quarter alone, and in July the company arranged a US$100m unsecured facility bearing 7% compounded monthly, maturing 31 December 2026 and repayable in cash or shares, undrawn as of the filing. On applicable anchors the stock trades at 3.51 times book with a trailing free-cash-flow yield of -4.50%; market value per measured-and-indicated ounce fell to about $28.5 from $35.6 in mid-April, against a 16% fall in the bullion fund over the same window, so most of that compression is the metal.

A designation still under reconsideration

KSM's "substantially started" status, which keeps its environmental certificate alive and its capital plan spendable, was granted on 24 July 2024. On 8 June 2026 the British Columbia Supreme Court found the determination reasonable but held consultation with the Tsetsaut Skii km Lax Ha insufficient, ordering submissions and a reconsideration. The 90-day period closed on 28 September; the Environmental Assessment Office opened its reconsideration on 22 September and must still draft a report for review before any recommendation reaches a decision-maker.

The office "recognizes the importance of a timely decision for Seabridge Gold and will strive to complete the process as efficiently as possible, while fulfilling its duty to consult," chair and chief executive Rudi Fronk said on 22 September. The feasibility study is targeted for the second half of 2027.

What Coeur's quarter says that Seabridge's cannot

Coeur Mining, which mines gold and silver at Palmarejo in Chihuahua and Rochester in Nevada, fell hardest of the four and had the best quarter: a record 163,490 ounces of gold, $388m of free cash flow and $1.1bn of cash. It trades at 9.5 times trailing enterprise value to EBITDA with a 7.5% trailing free-cash-flow yield, and its forward price-to-earnings of 14.0x sits above the trailing 11.9x — consensus marking per-share earnings down on a lower metal price while revenue estimates stand. Chief executive Mitchell Krebs described the $750m repurchase on the 12 August call as "a well designed buyback program with a portion of it just automatically chewing away during blackouts."

Allied Gold, a 485,000-575,000-ounce producer in Mali, Côte d'Ivoire and Ethiopia, is the cheapest here at 7.1 times forward earnings with gross margin up 19.9 points year on year; its 39.7% six-month fall dates to 29 July, when Zijin Gold's C$44-a-share cash offer was terminated and replaced by a 9.2% stake taken at C$32.55. Hycroft Mining, 51 employees and no revenue, grew diluted shares 231.7% in a year against an unfunded $2.4bn restart cost, at 5.96 times book.

Four falls, four causes.

Bullion's 4.8% slide and a 10-year Treasury yield above 5% supply a quarter to a half of the group's move and all of the discount-rate pressure on a first cash flow a decade out. Beyond that, Coeur's shares fell because the market repriced the metal its 690,000-ounce guidance will be sold into, not because the mines faltered; Allied's fell on a dead deal; Hycroft's on the share count. Seabridge's asset did not shrink and did not grow per share, which is the honest answer its income statement can never give.

The facility that funds this year's road building and geotechnical work comes due on the last day of December, and it may be repaid in stock. For a company whose only meter is ounces per share, the price of the shares is an input to the thing being measured.

Manhattan Associates' Operating Profit Fell as Descartes' Grew 38%; Both Stocks Rallied

Hypothesis Opus 5 · Research Opus 5 · Writing Opus 5 · Prompt v1.7

Manhattan Associates and Descartes Systems, the two listed software firms paid off the movement of freight and goods, have climbed together since the summer — and their reported businesses moved in opposite directions while they did.

Morgan Stanley upgraded Manhattan on 12 October without any new figure from the company. Its most recent quarter showed operating margin of 22.2% against 27.1% a year earlier, a fourth consecutive quarter of compression, as cloud subscriptions replace retired perpetual licences. The shares fetch 39.9x forward earnings.

Descartes, the one still trading below its level of a year ago, grew operating income 38.5% and holds 11.48x forward gross profit against roughly 14.5x twelve months earlier. An analyst's note explains Manhattan's newest leg up. It does not explain the margin.

MANHDSGXSupply Chain SoftwareCloud Subscription TransitionSaaS Margin CompressionEnterprise AI AgentsWarehouse Automation
TickerCompanySegmentTrend · 13mo30D1Y
MANHManhattan AssociatesSpecialized Enterprise Solutions🌱 Emerging Bull+2.7%+8.3%
DSGXThe Descartes SystemsSpecialized Enterprise Solutions🌱 Emerging Bull+6.1%−13.0%

12-month price & trend

MANH
Manhattan Associates
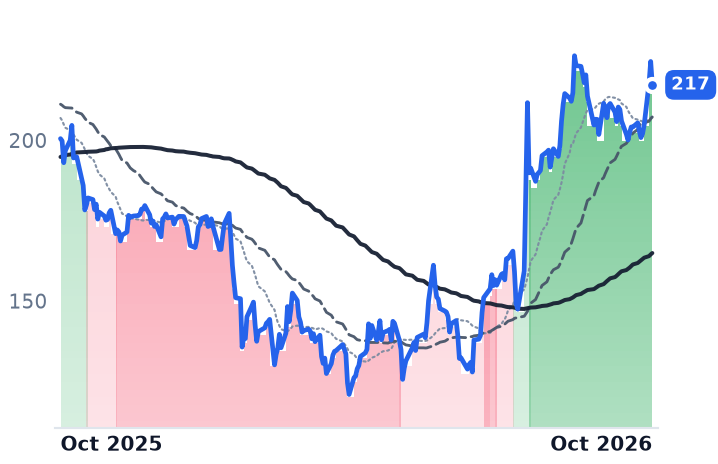
217
−7.28 (−3.24%)
vs. prior close
Price20d50d150d
MANH 12-month price
Specialized Enterprise Solutions
DSGX
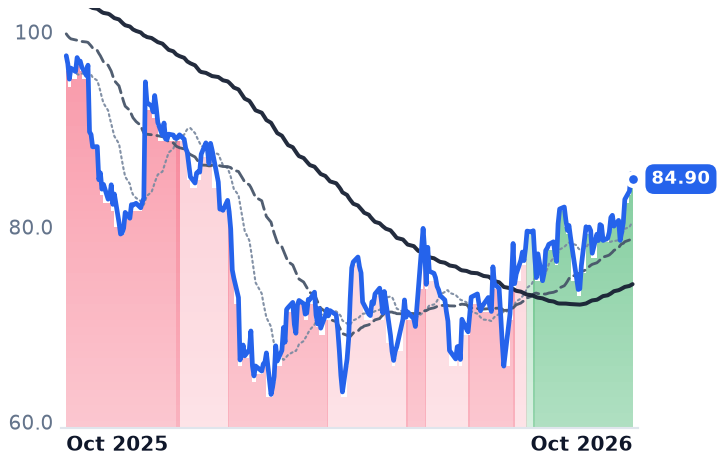
The Descartes Systems
84.90
−0.56 (−0.66%)
vs. prior close
Price20d50d150d
DSGX 12-month price
Specialized Enterprise Solutions
TickerMkt capP/EP/E fwdP/SP/S fwdP/GPP/GP fwdEV/EBITDAFCF yld
MANH$12.8B62.3x39.9x11.4x11.0x20.8x20.1x43.6x3.1%
DSGX$7.3B38.8x37.1x9.4x8.9x12.1x11.5x20.4x4.1%

Consensus projections

TickerFY2026EFY2027EFY2028E
MANHRevenue+8.3%+8.6%+8.8%
EPS+10.3%+11.8%+15.8%
DSGXRevenue+15.0%+10.8%+12.9%
EPS+15.8%+22.7%+15.7%

Forward fiscal years only. Blank means no analyst coverage for that year.

Morgan Stanley raised Manhattan Associates to Overweight from Equalweight on 12 October and lifted its price target to $250 from $180, and the warehouse-software company's shares rose more than 6% that session without Manhattan publishing a number of any kind. Analyst Chris Quintero cited accelerating cloud bookings under new chief executive Eric Clark and early commercial traction for the company's AI agents, arguing that the investor narrative shifts from AI debated to AI beneficiary.
The last figures Manhattan actually reported, in July, showed operating income down 10.2%. That is the tension the advance now carries: the re-rating has been read as the start of an inflection in demand, while the one of these two companies whose profits are visibly compounding is the other one. Descartes Systems Group, which bills logistics customers per customs filing, per shipment message and per screening check across its Global Logistics Network, grew second-quarter operating income 38.5% to $66.7m on revenue up 11.8% to $201.1m, a record quarter with adjusted EBITDA at 47% of revenue.

The conversion bills Manhattan now and pays it later

Manhattan's revenue is not flattening. Growth has accelerated four quarters running, from 3.4% to 9.3%, reaching $297.8m in the June quarter. The problem is what it costs to earn. Gross profit rose 2.5% against that 9.3%, gross margin fell to 53.2%, and operating margin has stepped down four consecutive quarters to 22.2% from 27.1% a year earlier.

The mechanism is in the lines. Maintenance revenue, the annuity that trailed perpetual licence sales, fell 12.9% to $30.5m and is guided to fall about 12% for the full year, shrinking with the retired licence base rather than through lost customers. Cloud subscription revenue rose 26% to $126.7m, and remaining performance obligation — contracted revenue not yet recognised — reached $2.47bn, over 99% of it multi-year non-cancellable cloud contracts. Only 39% of that backlog is expected to convert within 24 months, up from 38% a quarter earlier.

"Manhattan delivered record Q2 in first half results against a volatile global macro backdrop," Clark told investors on 28 July. "Our performance was highlighted by 26% cloud revenue growth, RPO increasing 23% to 2.5 billion and Q2 was our third consecutive quarter of record bookings."

Some of the profit decline is dated and one-off: 260 jobs cut, about 6% of staff, announced on 1 June, carried $7m-$9m of severance into the quarter, and adjusted operating margin was 34.9% with operating cash flow up 22% to $91m. Implementation work is still being funded — professional services revenue, consultant hours billed against a fixed bench, was $133.0m, up 3% after falling 3% a year earlier. In September the company put tiered Editions of its Active platform on commercial sale, a packaging change aimed down-market.

What the backlog cannot do is fund a 39.9x forward earnings multiple against roughly 25x at the 27 February close, for consensus earnings growth of 10.3% this year.

Descartes was paid in the same quarter it earned

Descartes' margin went the other way, widening 6.4 points year on year to 33.2%, with cash from operations up 28% to $81.3m and no drawn debt against $401.1m of cash. Organic services growth, the part acquisitions cannot buy, was just north of 9%, roughly a third of it from share gains and the rest from selling more products into existing customers. Chief executive Edward Ryan told analysts on 10 September that truck and air volumes showed little growth, with overall shipment volumes down and the Iran war the largest single contributor.

So the per-document meter grew while the documents did not. Its AI agents that telephone drivers for load status lifted tracking adoption from 87% to 93% of loads in about six months, which raises billable messages per shipment without a single extra shipment. In September Descartes paid about $120m for Extensiv, a cloud warehouse platform used by more than 1,200 third-party logistics providers, which puts it inside the socket Manhattan sells into.

Descartes trades at 11.48x forward gross profit against roughly 14.5x a year ago, and 20.4x trailing EV/EBITDA against Manhattan's 43.6x. It is also the laggard on the screen: down 13.0% over twelve months and 13% below its 52-week high, where Manhattan is up 8.3% over the year and 68.6% in six months, having held an uptrend since 30 July — nine days before Descartes turned up on 11 August.

Which half of the rally the numbers pay for

Both stocks are climbing out of the same hole, not a supply-chain one: the February selloff that erased roughly $2trn of software value on fears AI agents would bypass per-seat subscriptions, now reversing with the S&P 500 software and services index at its highest since November 2025. Descartes' share of that move is paid for by reported earnings and still sits below last year's multiple. Manhattan's is not: its forward multiple has expanded since mid-September with no disclosure in between, and the newest leg was an analyst's note.

The cause of the split is where each dollar is recognised. Descartes bills a completed event and banks it the same quarter. Manhattan is converting licences into subscriptions recognised ratably from go-live, so the cost of winning and implementing a cloud deal lands now while the contracted value waits in a backlog that releases 39% of itself over two years. That is a profit-suppressing trade, not a demand failure — and it means the margin line will keep contradicting the bookings line for as long as the conversion runs. The third-quarter release on 27 October after the close is the first time the backlog figure and the earnings it is meant to justify arrive in the same envelope since the upgrade.

The throughput both companies are ultimately paid off has barely moved. Cass reported September freight shipments up 1.9% year on year, a second consecutive annual gain after a 42-month downturn, and still 3.6% below where they stood two years ago.

Berkshire's Union Tank Car Wants Duties on the Mexican Plants Greenbrier and Trinity Use

Hypothesis Opus 5 · Research Opus 5 · Writing Opus 5 · Prompt v1.7

A trade petition filed on the last day of September put a tax risk on the one place North America's two listed railcar builders assemble tank cars, and it landed in the same weeks their forward order books were getting better. Greenbrier booked 3,400 orders worth about $600m in the quarter to 31 August, against 2,200 worth $340m three months earlier; its reported May quarter showed revenue down 31.4% and operating margin halved to 5.5%. Trinity's earnings leapt on a $132m non-cash gain from moving roughly 17,025 cars into an investor-owned structure while segment operating income fell 31.5%. US rail traffic is up 3.5% through 38 weeks, so the builders' weakness is about delivery slots and where cars are welded. Greenbrier trades at 0.77x book; Trinity's trailing earnings multiple sits below its forward one.

GBXTRNCSXNSCUNPMexico Cross-Border ProductionRail Freight VolumesRailcar Leasing FleetsTank Car Replacement Cycle
TickerCompanySegmentTrend · 13mo30D1Y
The subject · what this brief is about
GBXThe Greenbrier CompaniesRailcar Manufacturing🔴 Cont. Bear−9.1%−12.0%
TRNTrinity IndustriesRailcar Manufacturing⚠️ Emerging Bear−8.0%−5.2%
Compared against · context, not the story
CSXCSXClass I Railroads🟢 Cont. Bull−2.3%+33.2%
NSCNorfolk SouthernClass I Railroads🟢 Cont. Bull+0.2%+11.5%
UNPUnion PacificClass I Railroads🟢 Cont. Bull−0.9%+25.8%

12-month price & trend

GBX
The Greenbrier Companies
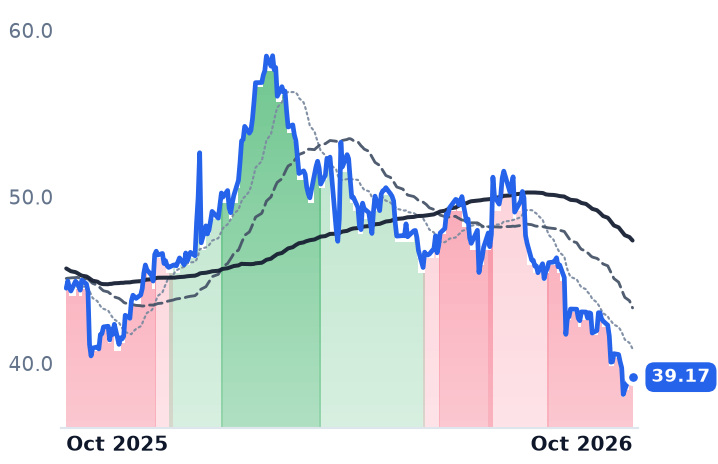
39.17
−0.14 (−0.36%)
vs. prior close
Price20d50d150d
GBX 12-month price
Railcar Manufacturing
TRN
Trinity Industries
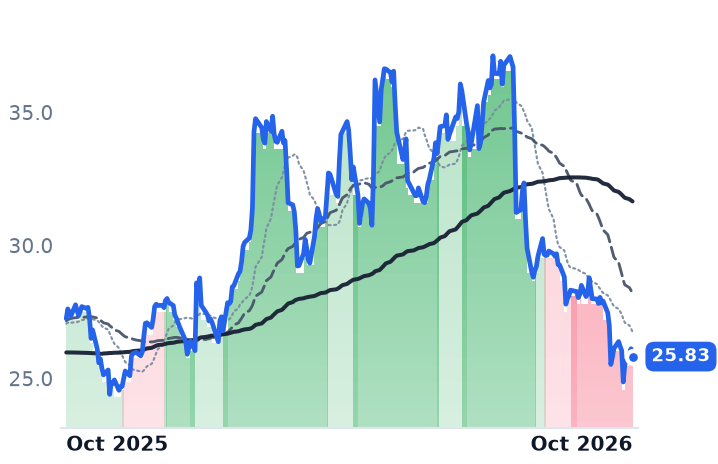
25.83
−0.30 (−1.13%)
vs. prior close
Price20d50d150d
TRN 12-month price
Railcar Manufacturing
CSX
CSX
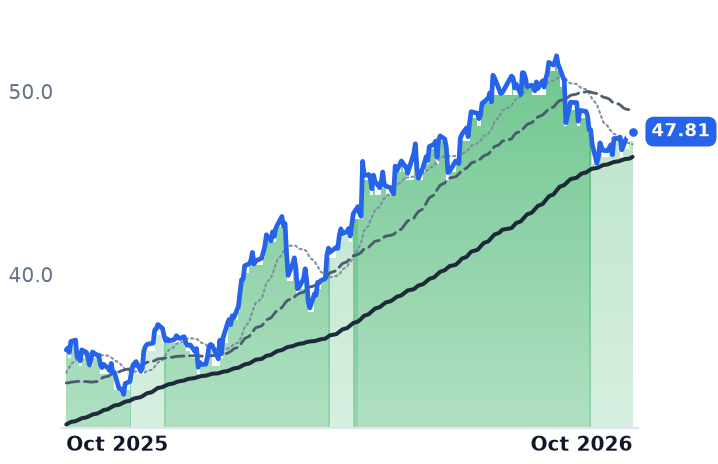
47.81
+0.26 (+0.54%)
vs. prior close
Price20d50d150d
CSX 12-month price
Class I Railroads
TickerMkt capP/EP/E fwdP/SP/S fwdP/GPP/GP fwdEV/EBITDAFCF yld
GBX$1.2B11.2x10.4x0.5x0.4x3.1x3.0x8.4x-9.9%
TRN$2.1B6.0x11.6x1.0x0.9x3.9x3.6x6.8x-17.1%
CSX$87.5B27.3x23.6x6.0x5.7x17.1x16.3x15.8x5.7%
NSC
Norfolk Southern
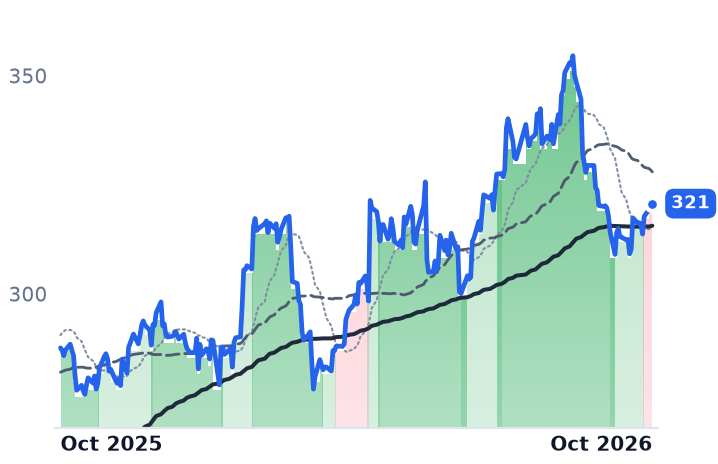
321
+0.58 (+0.18%)
vs. prior close
Price20d50d150d
NSC 12-month price
Class I Railroads
UNP
Union Pacific
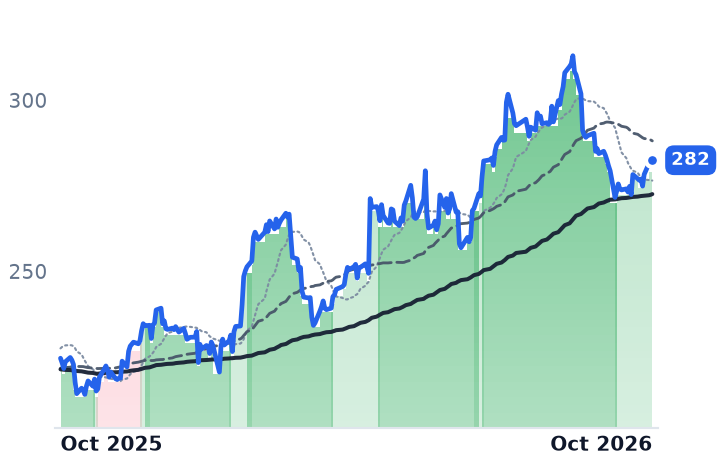
282
+1.27 (+0.45%)
vs. prior close
Price20d50d150d
UNP 12-month price
Class I Railroads
TickerMkt capP/EP/E fwdP/SP/S fwdP/GPP/GP fwdEV/EBITDAFCF yld
NSC$71.4B27.1x24.6x5.7x5.4x10.6x10.0x16.0x5.4%
UNP$165.4B22.5x21.3x6.5x6.1x14.3x13.4x14.6x3.9%

Consensus projections

TickerFY2026EFY2027EFY2028E
GBXRevenue−23.5%+8.5%−0.4%
EPS−53.2%+23.6%+34.7%
TRNRevenue+4.9%+14.1%−28.4%
EPS−28.8%+0.0%+7.9%
CSXRevenue+8.0%+5.2%+3.4%
EPS+22.4%+14.1%+10.3%
NSCRevenue+9.1%+4.6%+4.0%
EPS+7.3%+11.2%+9.7%
UNPRevenue+10.3%+4.7%+11.5%
EPS+11.9%+8.8%+9.6%

Forward fiscal years only. Blank means no analyst coverage for that year.

A Berkshire Hathaway subsidiary has asked Washington to tax railway tank cars built in Mexico, which is where both listed North American railcar builders assemble them. The request landed while their forward order books were improving: Greenbrier booked 3,400 orders worth $600m in the quarter to 31 August, against 2,200 worth $340m three months earlier.

The reported income statements say the opposite. Greenbrier's revenue fell 31.4% year over year in its May quarter and it has cut full-year delivery guidance to 15,650-15,850 cars from an original 17,500-20,500. Trinity's earnings jumped on a $132m non-cash gain from moving about 17,025 railcars into an investor-owned structure, while its segment operating income fell 31.5%.

US rail traffic is rising. What is in question is where the cars get built and which quarter they ship.

UTLX Manufacturing, a wholly owned Berkshire Hathaway subsidiary, filed antidumping and countervailing duty petitions on 30 September with the US Commerce Department and the International Trade Commission covering railway tank cars and parts imported from Mexico. Both listed builders with Mexican plants fell that session: Greenbrier, which engineers and builds freight and tank cars across North America, Europe and South America, by 3.8%, and Trinity Industries, which builds freight and tank cars and leases them to shippers, by 5.4%. Greenbrier closed at a twelve-month low eight days later.

The builders' long slide has been read as the railcar cycle rolling over. Carloads say something else: the Association of American Railroads reported combined US traffic for the first 38 weeks of 2026 up 3.5% year over year, and the week to 3 October up 5.1%. Industry deliveries are running near 25,000 cars this year against normalized replacement demand of 35,000 to 40,000. What the petition threatens is the thing that actually sets a builder's year: where a car is assembled, and which quarter the customer takes it.

The petition's argument is a market share

UTLX alleges dumping margins of 12.70% to 32.58% and cites Mexico's share of the US tank car market rising from 70.4% to 95.4% of a 7,841-unit market. Union Tank Car president Neil Finn said the domestic industry filed because it believes unfairly traded imports are causing significant harm to US manufacturing. Trinity has built railcars at Monclova for nearly three decades. Greenbrier countered that it runs a purpose-built tank car plant at Marmaduke, Arkansas and has invested more than $500m at Marmaduke and Paragould since 2019, and said it "will vigorously defend its record". Trinity, on 5 October, said it would "participate fully and actively" in both proceedings and that the petition "is not supported by the evidence or the law". Commerce faces an initiation deadline around 16 November.

Greenbrier's order book turned up as its revenue came apart

In the quarter to 31 May, Greenbrier delivered 3,600 railcars and booked 2,200 new orders worth $340m, leaving backlog at 13,800 units and $2.0bn. Revenue of $576.5m was down 31.4%, operating margin halved to 5.5%, and the company cut full-year aggregate gross margin guidance to 13.8%-14.2% from 14.8%-15.2%.

Then the forward meter moved. In the quarter to 31 August, Greenbrier announced 3,400 orders worth about $600m. On those disclosed totals, average order value rises from roughly $155,000 a car to about $176,000, because mix changed. The book includes 780 cars for Saudi Arabia Railways: tank cars for phosphoric acid and molten sulfur, plus Greenbrier's first intermodal sale to that customer.

A second, unlike dollar sits in the same ticker. Greenbrier's owned lease fleet grew 23% sequentially to 20,600 cars at 99% utilisation and roughly $1.7bn net book value, and it intends to spend about $300m a year on the fleet and double recurring revenue by 2028. Leasing and fleet management revenue was $47m at a 60.3% gross margin, about 8% of the quarter. Every car diverted to the fleet suppresses sales and lifts margin. Of $1,551m net funded debt, $1,086m is non-recourse lease-fleet borrowing against $465m recourse.

Trinity's year was decided by one transaction

Trinity's second-quarter net income of $102.2m, up 625%, included a $132m non-cash pre-tax gain on completing a Napier Park partnership that moved about 17,025 railcars to investor-owned status. Leasing segment margin was 79.8% with the gain and 33% without. Operating income fell 31.5% to $58.8m; deliveries were 1,570 cars and backlog $1.6bn. The lease book, meanwhile, is intact: utilisation 97.3%, renewal success 75%, and $30m of year-to-date gains on lease portfolio sales. The future lease rate differential, the gap between expiring and renewal rates, was positive 3.5%, a twentieth consecutive positive quarter, though down from 18.3% a year earlier.

"Inquiry levels for new rail cars are strong, reflecting growing customer conviction that the cycle has turned, demand side signals continue to be stronger than supply side signals," chief executive E. Jean Savage said on the 30 July call. The shares fell 14.9% over the two sessions that followed and have not regained that level.

The small builder proves the clock

The Chicago hopper, gondola and boxcar builder FreightCar America took about 45% of second-quarter industry orders and lifted backlog 121% to 3,972 units worth $344m — in the same quarter its gross margin fell to 5.5% from 15.0% and operating income swung to minus $4.3m on $113.1m of revenue. Management attributed its cut to 3,500-3,900 deliveries to a late production ramp driven by customer delivery timing, not lost demand. With no meaningful earnings multiple, the stock is judged on 0.4x trailing sales.

What the numbers account for

The reported results explain the de-rating through May and little after it. Greenbrier has lost 17.3% over three months and 25.6% over six, against declines of 4.2% at CSX, 2.0% at Union Pacific and 1.9% at Norfolk Southern over three months — the carriers whose volumes are growing. Two of Greenbrier's heaviest sessions have named causes: a 7.6% fall on 1 September, when the board disclosed its chief executive succession, and the petition day. The split between the two builders has a cause of its own. Trinity's 6.0x trailing earnings sits below its 11.6x forward multiple because the market declines to capitalise management-timed portfolio gains, with consensus 2026 earnings per share down 28.8% on revenue up 4.9%. Greenbrier trades at 0.77x book and 8.4x trailing EV/EBITDA with a lease fleet carried near $1.7bn at 99% utilisation, and its trailing and forward multiples are nearly identical, so no recovery is priced against a consensus that has next year's earnings rising about 24%.

Greenbrier reports its fiscal fourth quarter after the close on 26 October, Trinity three days later. Both will show order books that improved into the autumn and income statements still converting the thin slots of a deferred year.

Commerce decides around the middle of November whether to open the tank car case at all. Until then, the one line of business whose richer mix was lifting order values is also the line whose cost base sits in a country a Berkshire subsidiary is asking Washington to tax.

Nvidia Said Its Racks Need No Chillers and SPX Technologies' Cooling Backlog Grew 59%

Hypothesis Opus 5 · Research Opus 5 · Writing Opus 5 · Prompt v1.7

A design claim made in January was read as deleting a layer of equipment from the AI data center, and the companies paid to carry that heat have said the opposite in every disclosure since.

SPX Technologies, which builds Marley evaporative cooling towers, lifted its expectation for 2026 data-center revenue from $300m to $430m on 30 July and closed its FIS Water acquisition on 15 September, the day its shares touched a 52-week low. Revenue grew 22.9% in the June quarter and the trailing price-to-earnings multiple has compressed to 29.8x from 41.9x in May.

Dover, which sells the quick-disconnect couplings inside the rack, books that demand in a segment that grew 0.4% organically, so its revenue line cannot show it. Parker-Hannifin, the number two in those couplings, did not de-rate at all.

SPXCDOVPHVRTMODTTJCIETNSPYData-Center Thermal ManagementWarm-Water Liquid CoolingEvaporative Cooling TowersQuick-Disconnect CouplingsAI Buildout FinancingIndustrial M&A Leverage
TickerCompanySegmentTrend · 13mo30D1Y
The subject · what this brief is about
SPXCSPX TechnologiesHVAC & Refrigeration⚠️ Emerging Bear−8.7%−9.7%
DOVDoverSpecialty Components & Systems⚠️ Emerging Bear+1.8%+19.1%
PHParker-HannifinMotion & Power Transmission🟢 Cont. Bull+2.8%+30.5%
Compared against · context, not the story
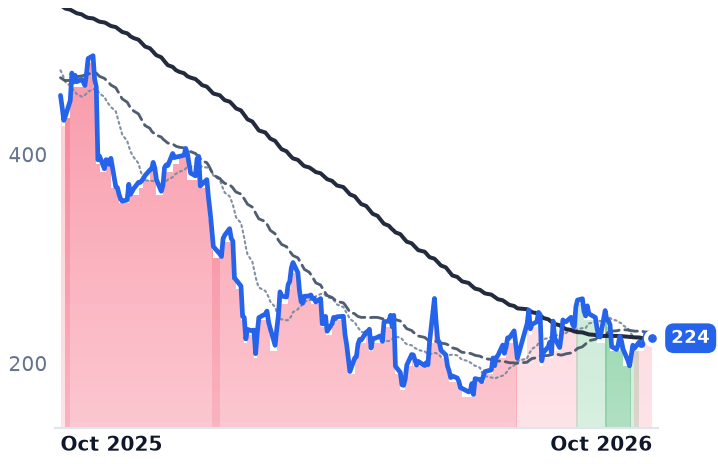
VRTVertivData Center Power & Thermal⚠️ Emerging Bear−5.6%+28.1%
MODModine ManufacturingThermal & Powertrain Components⚠️ Emerging Bear−11.5%+5.0%
TTTrane TechnologiesHVAC Systems⚠️ Emerging Bear+10.1%+10.9%
JCIJohnson Controls InternationalHVAC & Refrigeration🟢 Cont. Bull+10.6%+41.7%
ETNEatonPower & Propulsion Systems🟢 Cont. Bull+4.6%+10.5%
SPYState Street SPDR S&P 500 ETF TrustAsset Management🟢 Cont. Bull+1.2%+16.9%

12-month price & trend

SPXC
SPX Technologies
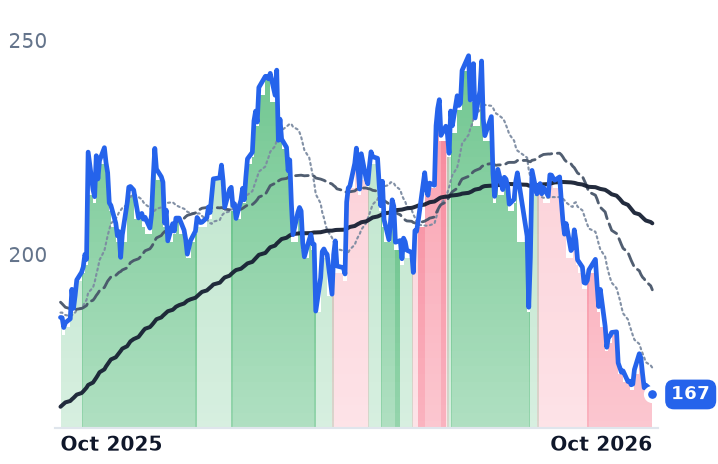
167
−1.17 (−0.69%)
vs. prior close
Price20d50d150d
SPXC 12-month price
HVAC & Refrigeration
DOV
Dover
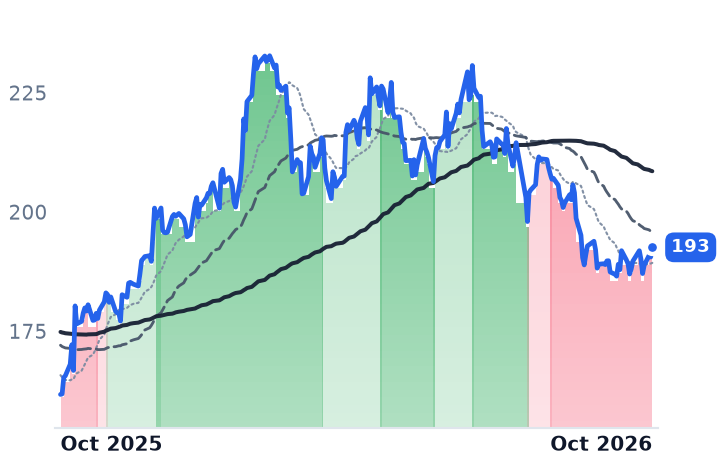
193
+2.03 (+1.06%)
vs. prior close
Price20d50d150d
DOV 12-month price
Specialty Components & Systems
PH
Parker-Hannifin
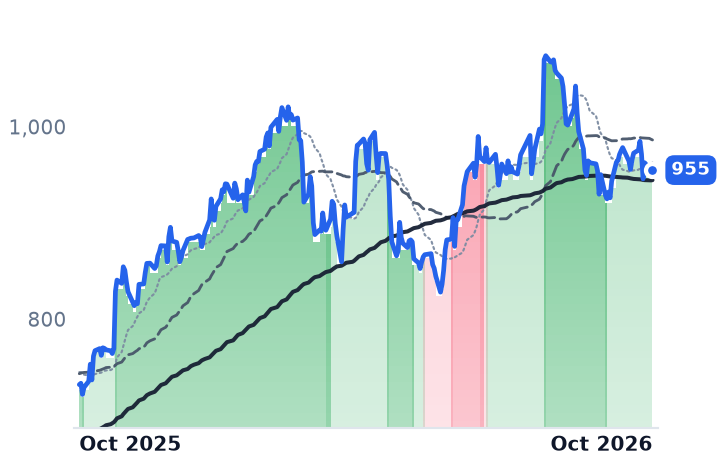
955
+1.74 (+0.18%)
vs. prior close
Price20d50d150d
PH 12-month price
Motion & Power Transmission
TickerMkt capP/EP/E fwdP/SP/S fwdP/GPP/GP fwdEV/EBITDAFCF yld
SPXC$8.4B29.8x20.1x3.4x3.0x8.4x7.6x16.5x3.6%
DOV$25.9B23.1x18.0x3.1x3.0x7.8x7.5x14.5x4.5%
PH$120.4B33.0x26.9x5.6x4.8x14.9x12.8x21.8x3.2%
VRT
Vertiv
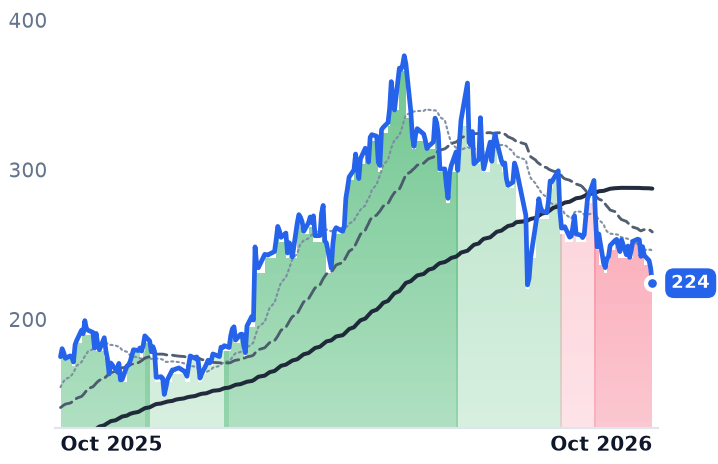
224
−9.96 (−4.25%)
vs. prior close
Price20d50d150d
VRT 12-month price
Data Center Power & Thermal
MOD
Modine Manufacturing
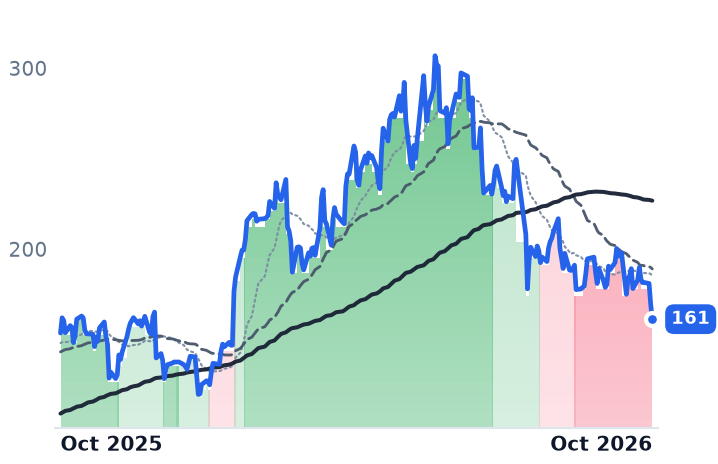
161
−8.24 (−4.86%)
vs. prior close
Price20d50d150d
MOD 12-month price
Thermal & Powertrain Components
TT
Trane Technologies
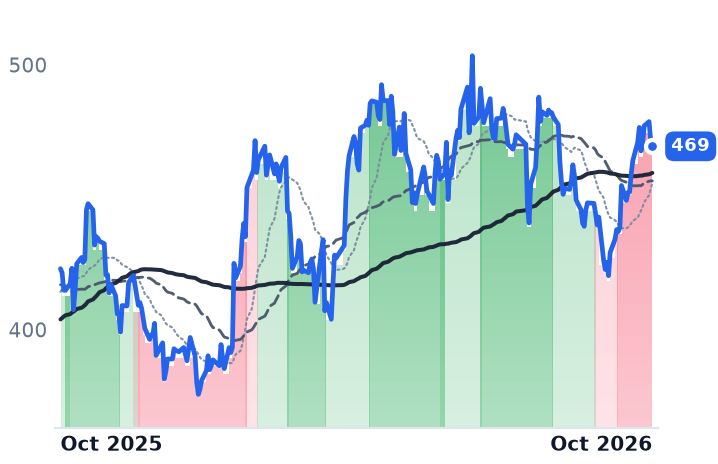
469
−2.20 (−0.47%)
vs. prior close
Price20d50d150d
TT 12-month price
HVAC Systems
TickerMkt capP/EP/E fwdP/SP/S fwdP/GPP/GP fwdEV/EBITDAFCF yld
VRT$97.1B55.8x37.5x8.5x6.9x22.2x18.2x38.2x3.0%
MOD$9.6B68.0x24.1x2.9x2.4x12.9x10.7x33.7x1.0%
TT$104.9B35.9x31.2x4.7x4.4x13.4x12.5x24.9x3.4%
JCI
Johnson Controls International
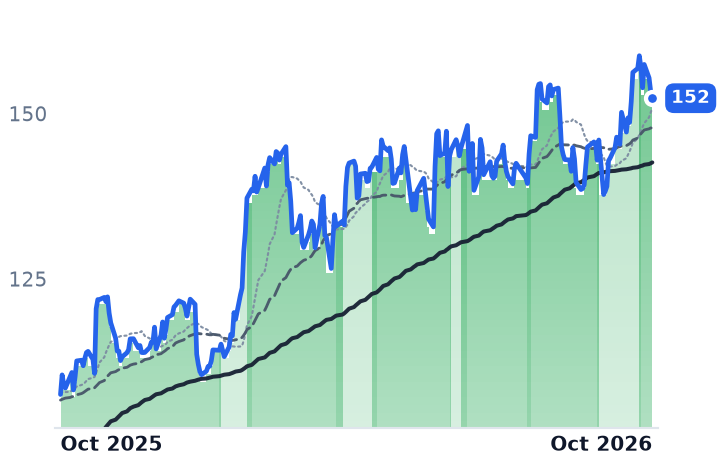
152
−1.01 (−0.66%)
vs. prior close
Price20d50d150d
JCI 12-month price
HVAC & Refrigeration
ETN
Eaton
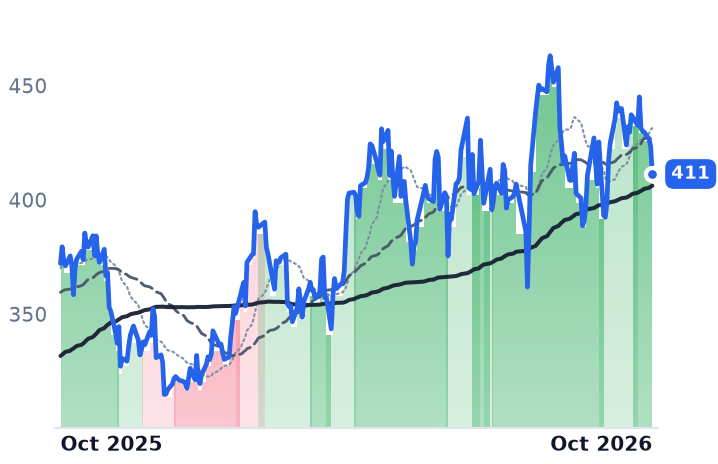
411
−11.99 (−2.83%)
vs. prior close
Price20d50d150d
ETN 12-month price
Power & Propulsion Systems
SPY
State Street SPDR S&P 500 ETF Trust
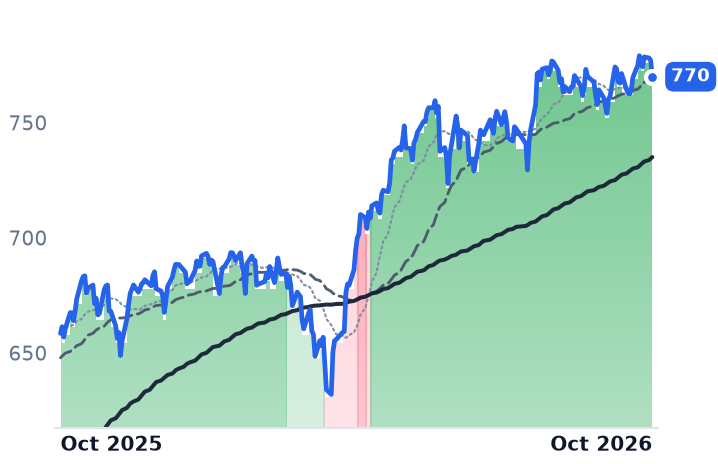
770
−7.08 (−0.91%)
vs. prior close
Price20d50d150d
SPY 12-month price
Asset Management
TickerMkt capP/EP/E fwdP/SP/S fwdP/GPP/GP fwdEV/EBITDAFCF yld
JCI$95.6B27.4x25.8x3.8x3.5x10.4x9.4x27.7x2.1%
ETN$168.6B44.0x32.0x5.6x5.1x15.6x14.2x29.3x2.7%
SPY$773.0B————————

Consensus projections

TickerFY2026EFY2027EFY2028E
SPXCRevenue+22.6%+13.7%+8.1%
EPS+23.8%+16.5%+11.5%
DOVRevenue+7.5%+5.1%+4.1%
EPS+11.4%+9.8%+8.1%
PHRevenue+8.1%+17.1%+7.1%
EPS+17.0%+13.3%+11.1%
VRTRevenue+37.1%+30.2%+21.3%
EPS+62.9%+36.7%+26.4%
MODRevenue+22.6%+29.0%+14.9%
EPS+33.4%+50.1%+38.0%
TTRevenue+11.7%+9.7%+8.8%
EPS+17.4%+15.5%+15.4%
JCIRevenue+9.0%+8.2%+7.8%
EPS+36.7%+20.5%+17.6%
ETNRevenue+20.0%+11.2%+9.7%
EPS+12.6%+19.3%+17.2%

Forward fiscal years only. Blank means no analyst coverage for that year.

A January claim the market read as a deletion

The equipment that dumps an AI data center's heat into the outside air looked, for one session in January, like a line item about to be erased. Nvidia chief executive Jensen Huang said at CES on 6 January that the company's Vera Rubin systems use warm-water direct liquid cooling at a 45°C supply temperature with "no chillers necessary", and shares in cooling-equipment makers fell the same day. Nvidia's argument was about power: chilled-water plant can account for nearly 40% of a data center's electricity use, and 45°C water is warm enough to reject outdoors.

That belief has been priced repeatedly, and it is testable against what the equipment makers have disclosed. SPX Technologies engineers, builds and services evaporative cooling towers and fluid coolers under the Marley and Recold names, sold through independent manufacturing representatives. In the three months to 13 October its shares fell 22.2% to a 52-week low of $167.28, 32.1% below the year's high, while Johnson Controls, which sells building HVAC and controls, rose 6.5% and the S&P 500 tracker gained 3.7%. The selling was aimed at cooling content, not at industrials.

What the company said while the shares fell

On 30 July SPX raised full-year guidance, to revenue of $2.705-2.765bn and an adjusted earnings midpoint $0.45 higher at $8.40. It also lifted its 2026 data-center revenue expectation from $300m to $430m, and raised estimated annual data-center capacity at full production from about $750m to about $1.1bn. Chief executive Gene Lowe walked the ramp back through its own history on that call: roughly $150m of volume two years ago, $200m last year, a $300m plan entering 2026. "The market is shifting towards our solutions," he said, citing plant throughput running ahead of plan.

The June quarter grew revenue 22.9% to $679m with operating margin up 149 basis points to 17.2%. Gross margin fell 120 basis points to 40.2%, so the margin gain came from operating leverage on fixed costs rather than from price. HVAC backlog ended the quarter at $919m, up 59% organically, on a segment book-to-bill near 1.4 times.

The objection the market actually voiced was balance-sheet, not demand: the shares fell 6.6% after the guidance raise on leverage from the acquisition program, which added Neptronic in July and then FIS Water for $410m in cash on 15 September, a water-control supplier expected to contribute about $105m of 2026 revenue. October added a second channel: a financing scare on the buildout's borrowers that widened credit spreads at the companies renting out the racks. That reaches SPX only through its customers' ability to fund projects.

The de-rating is real and large. SPX trades at 29.8x trailing earnings against 41.9x in May, and 20.1x forward — but consensus 2026 revenue sits at the top of management's own guided range, so the forward figure rests on the company hitting its own upper end.

Dover sells the coupling and cannot show you the revenue

One layer in, the same heat passes through quick-disconnect couplings, and Dover's Colder Products Company is the industry reference for the blind-mate, non-spill, hot-swappable version used at hyperscale volumes; each liquid-cooled rack takes dozens of them plus consumables. That business sits inside the roughly $1.6bn Pump Solutions Group, within one of five segments at a $25.9bn conglomerate. In the June quarter Pumps & Process Solutions grew about 0.4% organically on $553m of revenue, with bookings up 11% and margin up 170 basis points on biopharma mix.

"In data centers, the density of thermal requirements of new chips are driving a shift towards liquid cooling, which directly benefits our connectors," chief executive Rich Tobin told investors on 23 July. The only number attached to any of it is a group aggregate: management expects over $1bn of 2026 revenue from applications tied to artificial intelligence and power generation, which is about 12% of the consensus revenue base by our arithmetic, and lumps cooling in with turbines' end markets.

Dover's own cooling exposure elsewhere makes the point harder. Climate & Sustainability Technologies grew 8% organically to $455m and led group bookings with 46% growth, and heat exchangers had their best quarter ever on liquid-cooling demand. The segment still lost 200 basis points of margin to a food-retail refrigeration footprint consolidation, which Tobin estimated cost one to one and a half points of group organic growth. Group bookings rose 16.1% to $2.3bn across all five segments and guidance went up, to $10.55-10.75 adjusted earnings per share. The shares fell 9.7% that day and 11.1% over three months. Dover is now the cheapest of the three at 18.0x forward earnings against 23.1x trailing.

The name that stayed still

Parker-Hannifin's Quick Coupling Division is the meaningful number two bidding for the same socket, with Stäubli and Walther-Präzision as European challengers. Its June quarter was aerospace: record segment sales of $1.9bn, 13.4% organic growth, orders up 18% and backlog up 15% to $8.5bn. Parker was flat over three months and is the most expensive of the three at 26.9x forward against 33.0x trailing. Its flatness is the cleanest evidence that what sold was cooling content.

So the three-month decline has one documented cause and one undocumented one. Dover's own factory move explains a measurable slice of its quarter, and the company named it. Nothing SPX has published explains a fall of more than a fifth: orders, backlog, guidance and disclosed data-center revenue all moved up, and sell-side analysts argued the January spec change was misread, with TD Cowen noting cooling towers remain essential to heat rejection in liquid-cooled systems. What the price now carries is leverage and customer funding, neither of which shows up in a backlog figure.

The heat still has to go somewhere. SPX's own account of where says $430m of it this year, and the shares have spent three months pricing an answer the company has not given.

ESAB Paid More Interest on Its Inspection Acquisition Than the Acquisition Earned

Hypothesis Opus 5 · Research Opus 5 · Writing Opus 5 · Prompt v1.7

A welding company whose gross profit grew faster than its sales has lost nearly half its market value in a year, and the quarter that triggered the slide showed the business improving on every line above interest expense. ESAB's June quarter carried gross margin expansion of 86 basis points to 38.0%, and management lifted full-year core adjusted operating profit guidance to $615m-$625m from $575m-$595m.

In the same August release it cut per-share guidance, to $5.40-$5.50 from $5.70-$5.90. The cause is the $1.45bn Eddyfi purchase: in its first month inside ESAB it added seven cents of adjusted earnings while the debt and equity raised to buy it took sixteen.

The welding end market is not the problem. Lincoln Electric, the closest listed comparison, is up 6.7% over twelve months with consumable volumes still growing. The pressure at ESAB sits in EMEA and APAC, and in a balance sheet that now carries more than $2.4bn of debt.

ESABLECOKMTMECWelding ConsumablesIndustrial M&A FinancingNon-Destructive TestingMetal Fabrication DemandSteel Input CostsLeveraged Balance Sheets
TickerCompanySegmentTrend · 13mo30D1Y
The subject · what this brief is about
ESABESABWelding & Cutting Solutions🔴 Cont. Bear−3.7%−45.8%
MECMayville EngineeringWelding & Cutting Solutions⚠️ Emerging Bear−19.8%+8.6%
Compared against · context, not the story
LECOLincoln ElectricWelding & Cutting Equipment🟢 Cont. Bull+2.8%+9.8%
KMTKennametalMetal Cutting Tools🔴 Cont. Bear+5.7%+44.0%

12-month price & trend

ESAB
ESAB
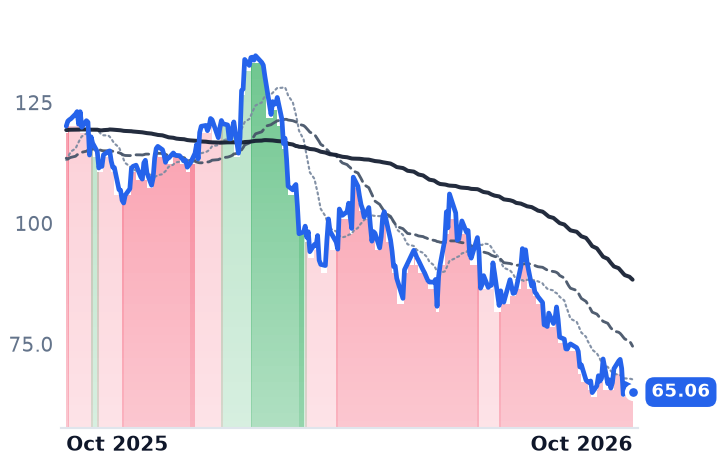
65.06
−1.10 (−1.66%)
vs. prior close
Price20d50d150d
ESAB 12-month price
Welding & Cutting Solutions
LECO
Lincoln Electric
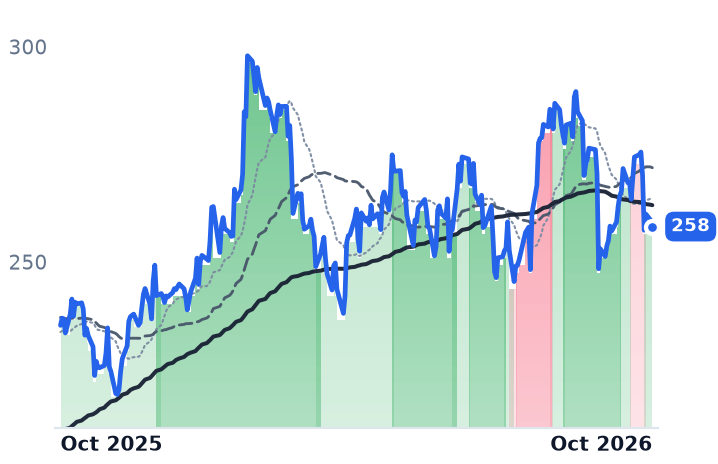
258
−1.47 (−0.57%)
vs. prior close
Price20d50d150d
LECO 12-month price
Welding & Cutting Equipment
KMT
Kennametal
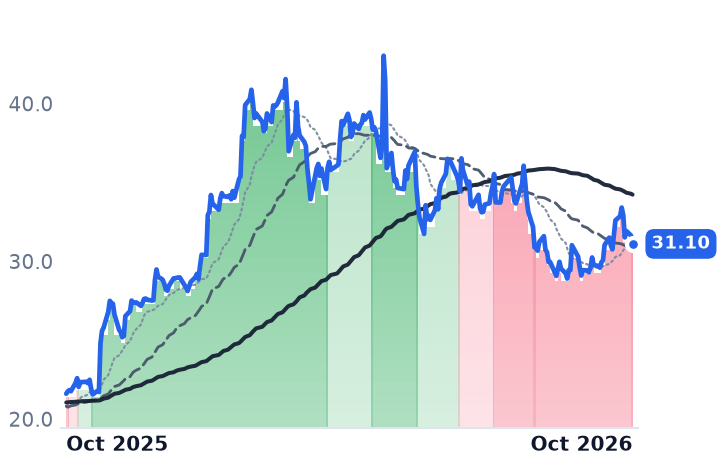
31.10
−0.53 (−1.69%)
vs. prior close
Price20d50d150d
KMT 12-month price
Metal Cutting Tools
TickerMkt capP/EP/E fwdP/SP/S fwdP/GPP/GP fwdEV/EBITDAFCF yld
ESAB$4.0B23.8x12.0x1.3x1.3x3.7x3.6x13.0x5.0%
LECO$14.3B26.0x23.4x3.2x3.0x8.9x8.4x17.1x3.6%
KMT$2.4B7.0x6.3x1.0x0.7x2.5x1.7x4.9x-3.4%
MEC
Mayville Engineering
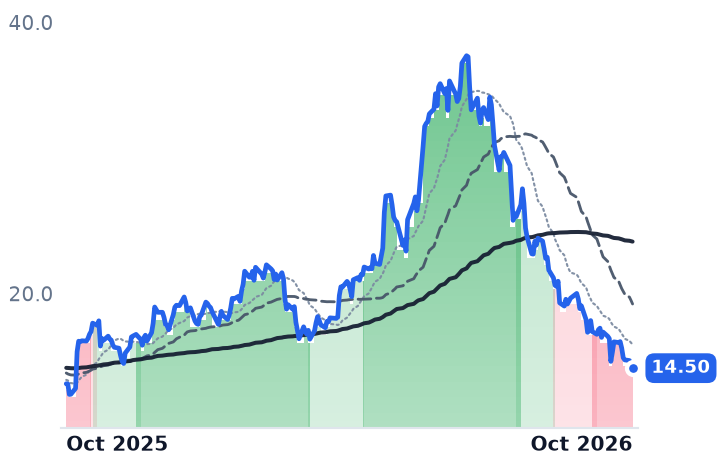
14.50
−0.04 (−0.28%)
vs. prior close
Price20d50d150d
MEC 12-month price
Welding & Cutting Solutions
TickerMkt capP/EP/E fwdP/SP/S fwdP/GPP/GP fwdEV/EBITDAFCF yld
MEC$304.8Mn/m56.1x0.5x0.5x6.0x5.6x19.0x-1.5%

Consensus projections

TickerFY2026EFY2027EFY2028E
ESABRevenue+13.2%+9.0%+4.9%
EPS+2.4%+17.7%+13.8%
LECORevenue+10.7%+6.2%+6.4%
EPS+14.9%+11.8%+10.0%
KMTRevenue+18.6%+44.0%+3.0%
EPS+180.0%+27.2%−52.9%
MECRevenue+16.5%+14.1%+8.1%
EPS+121.9%+293.2%+40.4%

Forward fiscal years only. Blank means no analyst coverage for that year.

ESAB, which sells welding wire, electrodes, flux and cutting equipment through independent industrial distributors, raised its full-year operating profit guidance in August and cut its per-share earnings guidance in the same release. The gap between the two is an interest bill.

The company lifted core adjusted EBITDA guidance to $615m-$625m from $575m-$595m, and reduced core adjusted earnings per share guidance to $5.40-$5.50 from $5.70-$5.90 — a midpoint moving from $5.80 to $5.45. The shares have since been handled as though the welding market turned over. It did not: Lincoln Electric, the Cleveland arc-welding and consumables maker founded in 1895 and the closest listed analogue to ESAB's book, is up 6.7% over twelve months and reported Americas consumable volumes growing at a low-double-digit rate in the same quarter, with mid-single-digit growth continuing into the third. Kennametal, which makes tungsten carbide cutting tools for the same metal-fabrication customers, is up 44.5% over twelve months.

Seven cents acquired, sixteen cents financed

ESAB closed the purchase of Eddyfi Technologies, a Québec non-destructive testing and inspection business, on 1 June 2026 for $1.45bn, roughly 14.5 times Eddyfi's expected 2026 EBITDA of about $100m including $20m of anticipated run-rate synergies. It paid with cash, new 5.625% senior notes due 2031 and $318m of equity placed the same day: 175,000 shares of 6.50% mandatory convertible preferred for about $175m, plus 1,254,255 common shares.

One month of ownership added $0.07 to adjusted earnings per share and the financing removed $0.16 — thirteen cents of debt cost and three of share and preferred dilution. Reported adjusted EPS of $1.33 came in below the $1.43 consensus; excluding Eddyfi and its funding it was $1.41. The welding business came within two cents. The miss was the deal.

The debt stack behind it is now $1,700m of senior unsecured notes, $350m of term loans and $360m drawn on the revolver, and interest expense and other, net rose $18.4m in the first six months of 2026, including $4.8m of bridge loan commitment fees. Chief executive Shyam Kambeyanda called the purchase "a defining step that positions ESAB for faster organic growth and higher margins" on the 6 August call.

Where the operating margin actually gave way

Above interest, the quarter reads well. Gross profit rose 15.5% on 12.9% revenue growth and gross margin expanded 86 basis points to 38.04%, helped by consumable list prices resetting against input costs — hot-rolled coil averaged about $1,213 a short ton in September against roughly $800 a year earlier — with the 10-Q attributing $14.9m of customer pricing to tariff-driven materials costs and higher oil prices.

But group adjusted EBITDA margin fell 90 basis points to 19.5% while the Americas segment margin expanded 20 basis points to 20.3% on 5% organic growth. The drag is EMEA and APAC: core sales there grew 14% but only 1% organically, with Middle East revenues down roughly 10-11% and regional logistics costs roughly tripling. Chief financial officer Brent Jones attributed the margin decline to "transitory price/cost neutrality and deliberate targeted commercial investments to accelerate growth".

The equity is cheaper than the enterprise

ESAB hit a 52-week low of $64.47 on 8 October against a 52-week high of $137.42, falling 7.1% on 28 September and 7.7% on 8 October; it closed at $65.06 on 14 October, down 25.4% in three months and 45.1% in twelve. JPMorgan cut its target to $95.00 from $125.00 on 8 October while keeping an overweight rating.

On price to trailing gross profit — the comparison that matters when revenue is a metal index multiplied by pounds somebody else burns — ESAB trades at 3.69x against Lincoln Electric's 8.86x, on near-identical gross margins of 38.0% and 36.8%.

Move to the enterprise and most of that discount disappears: 13.0x trailing EV/EBITDA against Lincoln's 17.1x. The difference is the $2.4bn of debt, which sits inside enterprise value and not inside the share count. ESAB's 23.8x trailing price-to-earnings is on GAAP earnings of roughly $2.73 a share, depressed by deal and financing charges, while the 12.0x forward figure is on consensus adjusted earnings of $5.41 — a definitional gap, not a growth expectation.

The operating results do not account for a 45% decline. A five-percent cut to a per-share midpoint, with gross profit and operating profit guidance both moving up, is not a de-rating of that size. What can account for part of it is the shape of the earnings ahead: consensus has 2026 revenue up 13.2% to $3.057bn while EBITDA sits flat at $619.1m against $619.8m, which is 270 basis points of margin bought with acquired sales, and all of the guidance raise to 11.0%-14.0% core sales growth is acquisition, with organic held at 2.0%-4.0%. The market is being asked to fund a levered earnings pause and trust the $6.37 consensus for 2027.

Third-quarter results come before the open on 4 November, the first period carrying three full months of Eddyfi's profit and of the interest raised to buy it. Until then the cheapest reading of ESAB is also the most literal one: a welding business that worked, attached to a balance sheet decision that has not paid for itself yet.

Salesforce Booked 14% More Future Revenue and No More Operating Profit Than a Year Ago

Hypothesis Opus 5 · Research Opus 5 · Writing Opus 5 · Prompt v1.7

Salesforce's forward order book improved last quarter while its profit engine stood still, and that combination is what the August re-rating has been asked to carry. Contracted revenue due within a year reached $33.5bn, up 14% in constant currency and faster than the prior quarter, against reported revenue growth of 10.8%.
The income statement tells the other half: GAAP operating income was flat year on year, margin slipping to 20.5% from 22.8%, with reported earnings per share lifted by a 14.7% cut in the diluted share count. Agentforce passed $1.5bn of annual recurring revenue but is roughly 3% of guided group revenue, too small to move a ratably recognized seat book.

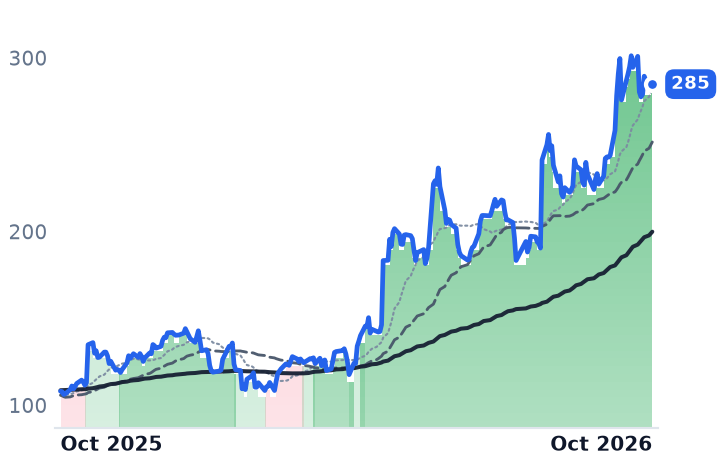
The same bargain shows up one layer down at Twilio and Braze, where winning consumption volume costs gross margin. Salesforce, Twilio and Braze are now moving in three different directions.

CRMTWLOBRZEHUBSZETAFRSHPEGAFront-Office SaaSConsumption-Based PricingAgentic AI MonetizationOperating Margin CompressionCPaaS Messaging EconomicsBuyback-Driven Earnings
TickerCompanySegmentTrend · 13mo30D1Y
The subject · what this brief is about
CRMSalesforceCustomer Experience & CRM🌱 Emerging Bull−7.9%+0.3%
TWLOTwilioCommunications & Messaging Platforms🟢 Cont. Bull+22.9%+163.6%
BRZEBrazeCustomer Experience & CRM🌱 Emerging Bull+12.5%+10.9%
Compared against · context, not the story
HUBSHubSpotCustomer Experience & CRM🔴 Cont. Bear−10.6%−50.9%
ZETAZeta GlobalMarketing & Advertising Technology🟢 Cont. Bull+11.7%+80.3%
FRSHFreshworksSecurity & Compliance🟢 Cont. Bull+11.5%+26.9%
PEGAPegasystemsLow-Code & Process Automation🔴 Cont. Bear−8.6%−36.6%

12-month price & trend

CRM
Salesforce
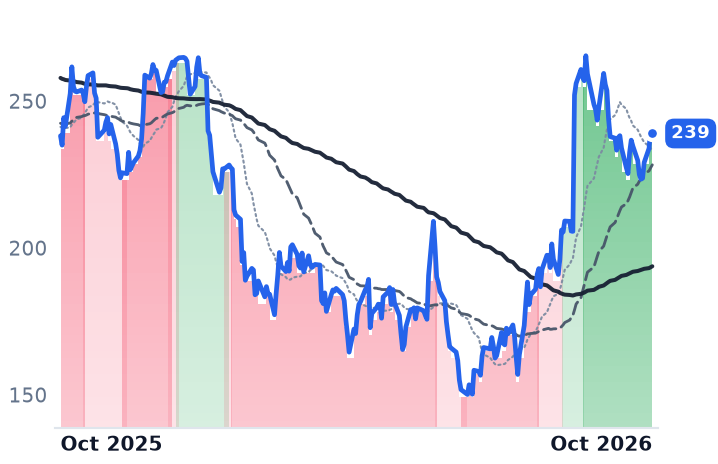
239
−1.87 (−0.77%)
vs. prior close
Price20d50d150d
CRM 12-month price
Customer Experience & CRM
TWLO
Twilio
285
−0.55 (−0.19%)
vs. prior close
Price20d50d150d
TWLO 12-month price
Communications & Messaging Platforms
BRZE
Braze
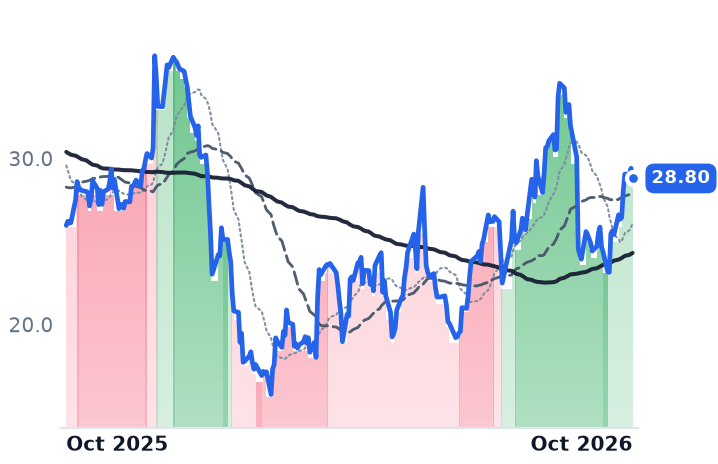
28.80
−0.61 (−2.07%)
vs. prior close
Price20d50d150d
BRZE 12-month price
Customer Experience & CRM
TickerMkt capP/EP/E fwdP/SP/S fwdP/GPP/GP fwdEV/EBITDAFCF yld
CRM$195.9B21.7x14.3x4.5x4.2x5.8x5.5x13.7x7.7%
TWLO$43.2B37.9x48.0x7.8x7.2x16.0x14.8x130.0x2.6%
BRZE$3.2Bn/m44.8x3.9x3.6x5.9x5.4xn/m2.6%
HUBS
HubSpot
224
+0.76 (+0.34%)
vs. prior close
Price20d50d150d
HUBS 12-month price
Customer Experience & CRM
ZETA
Zeta Global
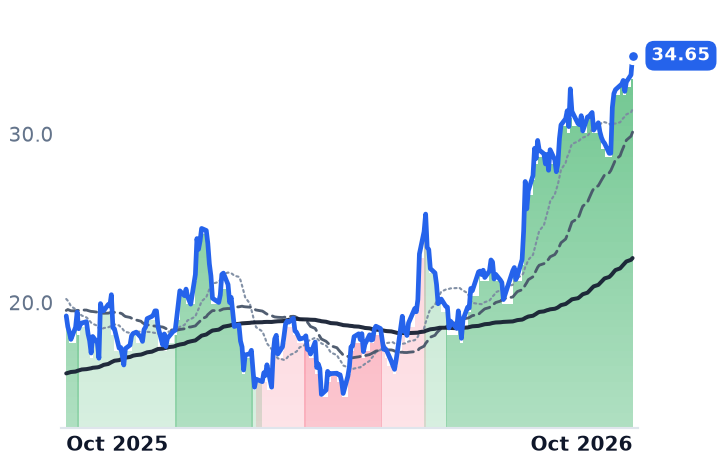
34.65
+1.14 (+3.39%)
vs. prior close
Price20d50d150d
ZETA 12-month price
Marketing & Advertising Technology
FRSH
Freshworks
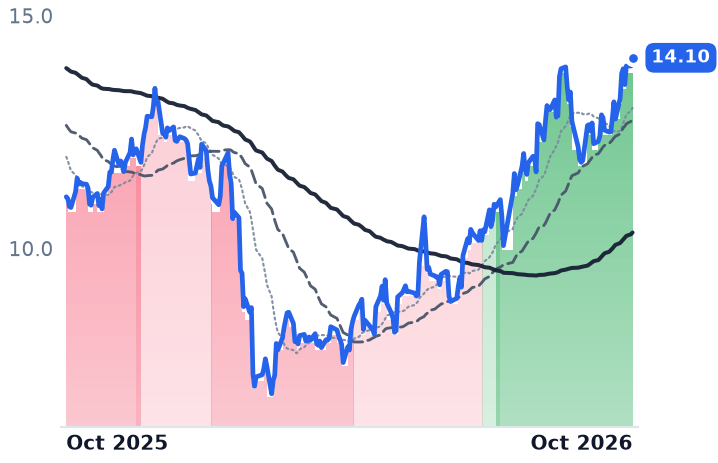
14.10
+0.18 (+1.26%)
vs. prior close
Price20d50d150d
FRSH 12-month price
Security & Compliance
TickerMkt capP/EP/E fwdP/SP/S fwdP/GPP/GP fwdEV/EBITDAFCF yld
HUBS$11.5B79.1x16.8x3.3x3.1x4.0x3.7x32.3x6.7%
ZETA$8.4Bn/m34.4x5.3x4.6x8.7x7.5x109.4x2.7%
FRSH$3.8B21.2x20.8x4.3x4.0x5.0x4.7x47.3x6.5%
PEGA
Pegasystems
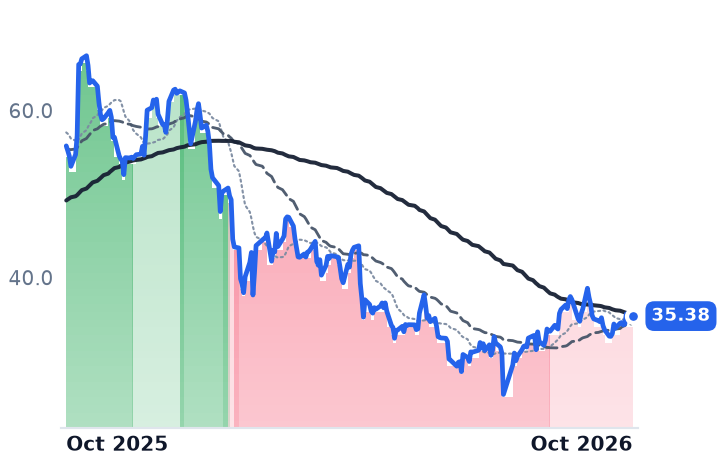
35.38
+0.47 (+1.33%)
vs. prior close
Price20d50d150d
PEGA 12-month price
Low-Code & Process Automation
TickerMkt capP/EP/E fwdP/SP/S fwdP/GPP/GP fwdEV/EBITDAFCF yld
PEGA$5.6B17.8x14.0x3.2x3.0x4.2x4.0x26.0x9.0%

Consensus projections

TickerFY2026EFY2027EFY2028E
CRMRevenue+9.3%+11.5%+9.9%
EPS+17.4%+42.3%−4.1%
TWLORevenue+19.6%+11.5%+10.6%
EPS+23.6%+14.4%+14.5%
BRZERevenue+24.3%+24.7%+17.2%
EPS+281.2%+52.5%+51.9%
HUBSRevenue+18.3%+14.0%+13.7%
EPS+38.4%+26.9%+20.3%
ZETARevenue+41.1%+16.0%+14.5%
EPS+47.6%+23.7%+19.4%
FRSHRevenue+15.6%+14.2%+15.4%
EPS+5.4%+24.0%+18.4%
PEGARevenue+7.4%+8.5%+8.4%
EPS+16.1%+7.7%+11.2%

Forward fiscal years only. Blank means no analyst coverage for that year.
Salesforce's forward booking meter improved last quarter and its profit engine did not. The software company behind the sales, service and marketing clouds used by large enterprises disclosed current remaining performance obligation of $33.5bn as of 31 July, contracted revenue due within a year, up 14% and up 14% in constant currency, an acceleration from 13% in constant currency a quarter earlier. Reported revenue grew 10.8%, to $11.345bn.

That gap is the whole argument for owning the shares here: bookings outrunning a subscription book recognized ratably means demand arrives in revenue a year late. The August quarter was read as proof that grafting consumption pricing onto seat licenses has restarted growth. It has restarted the order book. What it has not done is produce operating leverage.

The order book moved; the income statement stood still

GAAP operating income was $2.331bn, flat against the year before, so operating margin fell to 20.5% from 22.8%. Net income rose 86.9% to $3.526bn while diluted shares fell 14.7% to 821m — reported earnings per share of $4.29 is the arithmetic of a $25bn accelerated repurchase and items below the operating line, not of a business converting growth into profit. Free cash flow did rise 81%, to $1.1bn.

The consumption lines are real and small. Agentforce annual recurring revenue passed $1.5bn, up more than 240%, with Agentforce and Data 360 together near $3.9bn. Against guided fiscal-2027 revenue of $46.1–46.4bn, the Agentforce line is roughly 3% of the company; Morgan Stanley put it at 2.6%. Subscription revenue of $10.8bn grew 12%, and included $440m from the Informatica acquisition. Attrition, excluding Slack self-service and recent acquisitions, held at about 8%.

The billing change is short-cycle rather than contractual: customers draw down Flex Credits and, as management described it, "when they want more, they raise their hand", while six of the quarter's top ten deals were unlimited enterprise license agreements. "As customer zero, we are putting Agentforce to work across our own business," chair and chief executive Marc Benioff said on the 26 August call.

One session, then a fade, then the upgrade

The re-rating was a single print. Salesforce closed at $205.62 on 26 August and $252.05 the next day, a 22.6% session, peaked at $265.44 on 3 September, and has since given back 10.0% to $238.97. Bank of America's Tal Liani upgraded the stock two notches, Underperform to Buy, raising his target to $285 from $160, on 12 October — after the fade, not before it.

At 14.3x forward earnings against 21.7x trailing, the shares already discount roughly 52% earnings growth this fiscal year. Consensus then has fiscal-2028 earnings per share 4.1% lower, at $16.07: the curve flattens the moment the forward year the multiple is struck on rolls off. A 7.7% trailing free-cash-flow yield is the cushion.

The same bargain, one layer down

Twilio, which sells messaging and voice interfaces billed per message and per minute, is living the consumption model Salesforce is adopting, and it costs margin. Revenue grew 22% in the June quarter while gross margin slipped to 48.4% from 49.1%, because US carrier surcharges are billed on at near-zero margin; 5 of its 116 points of dollar-based net expansion were those fees, and messaging grew 28% reported but 18% excluding them. Its own third-quarter guide steps organic growth to 11–12% from 17%, and at 16.0x trailing gross profit the shares sit above the $265.71 street average target.

Braze, which orchestrates push, in-app and SMS messaging inside brands' own apps, shows the mechanism with the cleanest meters: net retention of 110%, up from 108%, and 112% among the 361 customers above $500,000 of annual recurring revenue, with gross margin down 70 basis points to 66.8% on premium messaging volumes. It trades at 5.86x trailing gross profit, essentially Salesforce's 5.77x, while growing gross profit 24.6% against Salesforce's 8.8%. "For every one example that I have where people are chasing their vibe coding dreams, we've got 10 more for whom Braze is their AI bet," chief executive William Magnuson said on the 8 September call.

What the quarter does and does not pay for

The booking data supports the view that front-office software is being expanded rather than replaced: raised full-year guidance, accelerating contracted revenue, steady attrition. It does not support the view that consumption pricing is yet paying the bill. At Salesforce the agent lines are too small to carry a $46bn book, the margin went backward, and the per-share line was bought. At Twilio and Braze, each incremental unit of metered volume arrives with its own cost of goods attached.

Treating the group as one trade also flatters it. Across the seven front-office names, the twelve-month advance is two stocks — Twilio up 163.6% and Zeta up 83.4% — against HubSpot down 50.2% and Pegasystems down 35.5%. HubSpot, at 4.0x trailing gross profit with revenue up 19.8%, is the cheapest of the group and the one that has been left out.

Twilio reports on 29 October with organic growth guided down by five points or more. That print, not an upgrade letter, is where consumption pricing gets its next invoice.

Oilfield Service Firms Told the Dallas Fed Their Costs Outran the Prices They Charge

Hypothesis Opus 5 · Research Opus 5 · Writing Opus 5 · Prompt v1.7

Drilling activity and crude prices both rose into October, yet the two listed companies paid to work on wells already drilled broke months-long uptrends on the same two sessions in late September. Neither break was about demand.

Ranger Energy billed 146,800 rig hours in the June quarter, up 25% year-on-year — almost exactly the fleet the American Well Services deal added in November — while hours rose 1% sequentially, and the company attributes its $772 hourly rate gain largely to passed-through fuel surcharges. Its cost of services still improved to 81% of revenue from 82%. Core Laboratories is the opposite case: its per-sample laboratory arm shrank 9% year-on-year at a 5% operating margin, and consensus has full-year earnings at $0.48 against $0.68 delivered in 2025.

Ranger's forward earnings are expected to rise and Core Labs' to fall, and the valuations now say so.

RNGRCLBHALLBRTPUMPWTTRTUSKOilfield Service PricingWell Servicing & WorkoverReservoir Analysis LabsRig Count RecoveryService Cost InflationOFS Consolidation
TickerCompanySegmentTrend · 13mo30D1Y
The subject · what this brief is about
RNGRRanger Energy ServicesOil & Gas Equipment & Services⚠️ Emerging Bear−7.4%+24.3%
CLBCore LaboratoriesOilfield Equipment & Tools🔴 Cont. Bear−17.8%−8.1%
TUSKMammoth Energy ServicesConglomerates🟢 Cont. Bull−8.5%+25.0%
Compared against · context, not the story
HALHalliburtonWell Services & Stimulation🔴 Cont. Bear−6.7%+46.8%
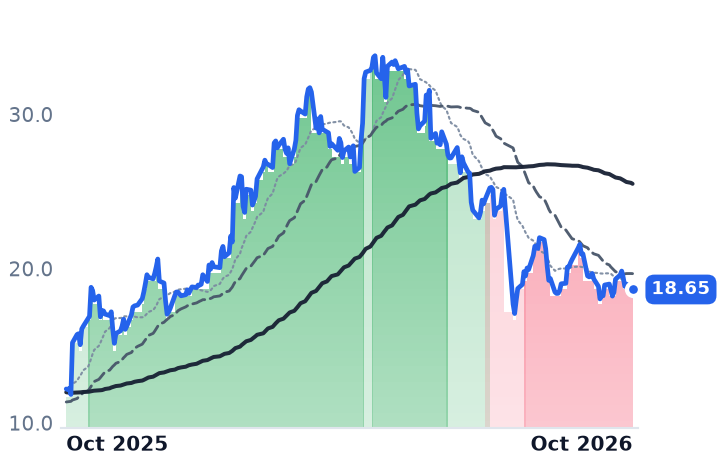
LBRTLiberty EnergyWell Services & Stimulation🔴 Cont. Bear−4.5%+52.8%
PUMPProPetroWell Services & Stimulation⚠️ Emerging Bear−18.0%+65.9%
WTTRSelect Water SolutionsWater Services & Energy Solutions🟢 Cont. Bull−4.2%+92.4%

12-month price & trend

RNGR
Ranger Energy Services
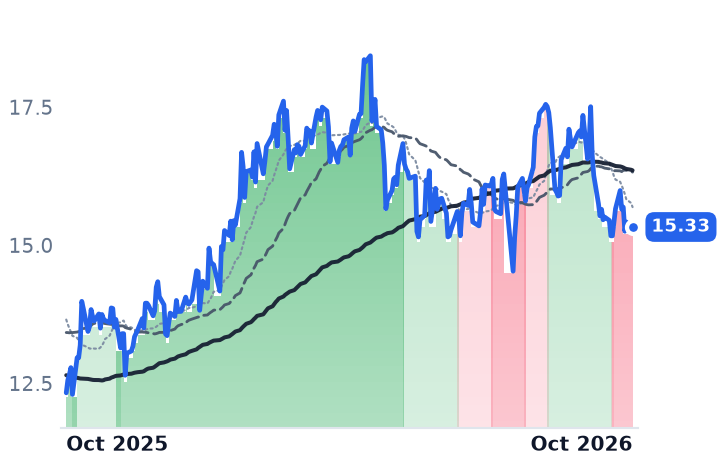
15.33
+0.02 (+0.13%)
vs. prior close
Price20d50d150d
RNGR 12-month price
Oil & Gas Equipment & Services
CLB
Core Laboratories
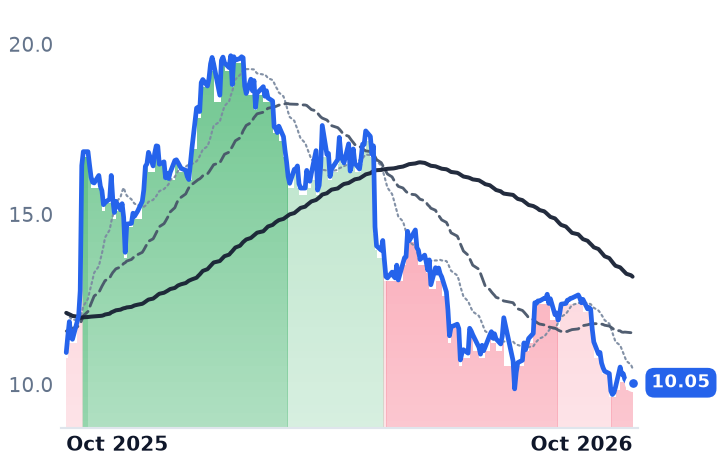
10.05
+0.04 (+0.40%)
vs. prior close
Price20d50d150d
CLB 12-month price
Oilfield Equipment & Tools
HAL
Halliburton
32.67
+0.11 (+0.34%)
vs. prior close
Price20d50d150d
HAL 12-month price
Well Services & Stimulation
TickerMkt capP/EP/E fwdP/SP/S fwdP/GPP/GP fwdEV/EBITDAFCF yld
RNGR$357.8M24.9x15.7x0.6x0.5x7.1x6.2x5.0x6.5%
CLB$468.3M18.1x21.1x0.9x0.9x5.0x5.1x9.7x2.3%
HAL$27.3B17.1x14.0x1.2x1.2x8.1x8.1x8.1x6.3%
LBRT
Liberty Energy
18.65
−0.15 (−0.81%)
vs. prior close
Price20d50d150d
LBRT 12-month price
Well Services & Stimulation
PUMP
ProPetro
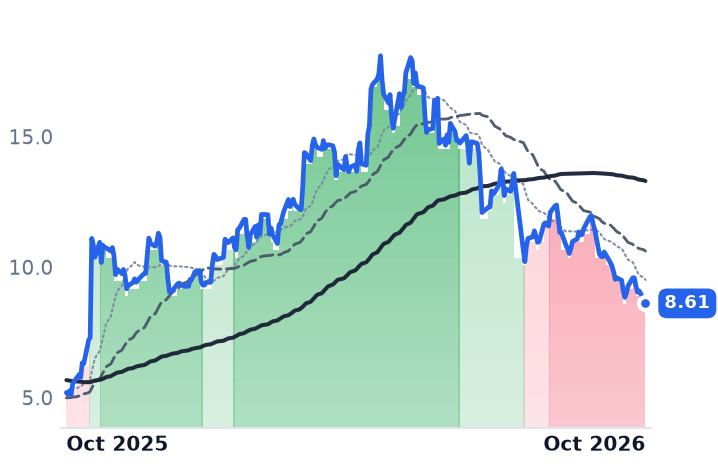
8.61
−0.15 (−1.66%)
vs. prior close
Price20d50d150d
PUMP 12-month price
Well Services & Stimulation
WTTR
Select Water Solutions
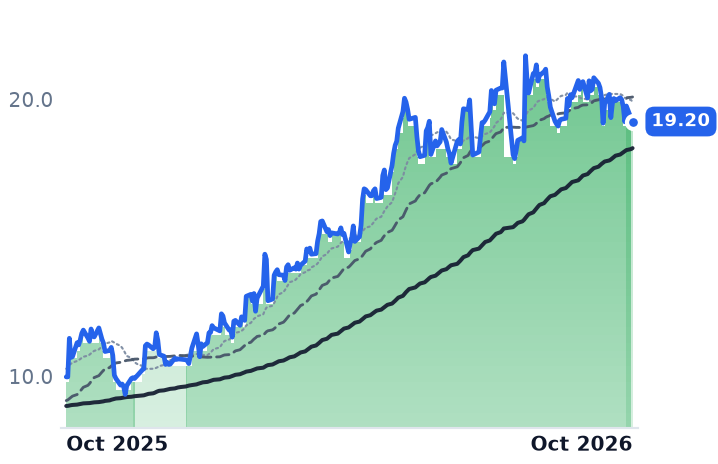
19.20
−0.12 (−0.62%)
vs. prior close
Price20d50d150d
WTTR 12-month price
Water Services & Energy Solutions
TickerMkt capP/EP/E fwdP/SP/S fwdP/GPP/GP fwdEV/EBITDAFCF yld
LBRT$3.3B26.7x86.6x0.8x0.7x6.1x5.6x7.0x-9.6%
PUMP$1.2Bn/m—1.0x1.0x12.2x11.5x7.4x-1.9%
WTTR$2.2B73.6x30.6x1.5x1.4x8.0x7.4x10.3x-3.7%
TUSK
Mammoth Energy Services
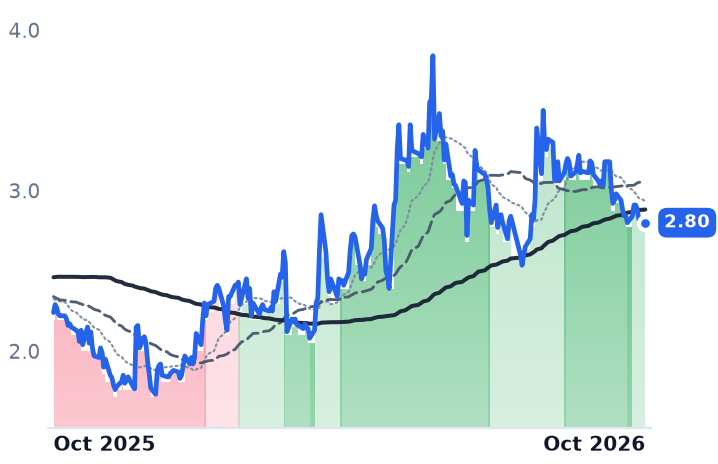
2.80
−0.01 (−0.36%)
vs. prior close
Price20d50d150d
TUSK 12-month price
Conglomerates
TickerMkt capP/EP/E fwdP/SP/S fwdP/GPP/GP fwdEV/EBITDAFCF yld
TUSK$134.9M189.2x—2.2x0.6x——4.6x-87.4%

Consensus projections

TickerFY2026EFY2027EFY2028E
RNGRRevenue+26.3%+6.8%−1.4%
EPS+38.2%+42.8%+9.4%
CLBRevenue−1.8%+2.8%+6.0%
EPS−34.9%+50.9%+33.2%
HALRevenue+2.0%+5.4%+4.6%
EPS+3.0%+23.2%+16.9%
LBRTRevenue+18.2%+7.7%+13.9%
EPS−465.4%−56.9%+509.6%
PUMPRevenue−2.9%+16.9%+10.6%
EPS−27.2%−899.2%+68.5%
WTTRRevenue+12.3%+8.4%+4.8%
EPS+166.8%+2.6%+55.9%
TUSKRevenue+28.2%——
EPS−82.8%——

Forward fiscal years only. Blank means no analyst coverage for that year.

The Federal Reserve Bank of Dallas published its quarterly survey of energy firms on 30 September, and the oilfield service companies in it described a market with plenty of work and none of the pricing power. Their input-cost index came in at 60.4 against a prices-received index of 16.3. Their own outlook index was 4.6, against 50.0 for the exploration and production companies that hire them, and their operating-margin index fell to 37.2 from 52.2.

That lands against a year in which activity recovered. The U.S. rig count stood at 603 on 9 October and the frac spread count at 203, both up on the week, with Brent near $102.60 in early October after a Middle East war. Rising rigs were widely read as the setup for a service-pricing recovery. The two listed companies paid to work on wells that are already drilled say otherwise, and both broke uptrends they had held for months on 29 and 30 September.

Ranger added a quarter more rig hours and bought every one of them

Ranger Energy Services, the Houston contractor that sends high-specification workover rigs back to producing wells to pull tubing, plug them or log them, billed 146,800 rig hours in its High Specification Rigs segment in the June quarter, up 25% year-on-year. That is almost precisely the roughly 25% rig count added by American Well Services, bought for about $90.5m in November 2025. Sequentially, hours rose 1%.

The rate line is padded too. Realised pricing of $772 an hour was 5% above a year earlier, an increase Ranger's own filing says "largely" reflects "the pass through of fuel surcharges as well as certain changes in asset and regional revenue mix." A 540-rig fleet is the largest single participant in a market of 1,000 to 1,200 well-servicing rigs where the ten leading providers hold only 50-60%; scale of that kind does not set price.

The lines that carry no pass-through show a decent quarter. Cost of services was 81% of revenue against 82%. Wireline, the completion-linked segment funded out of customer capital budgets, fell 16% year-on-year to $18.6m but swung to $1.0m of operating income from a $2.4m loss in March. Chief executive Stuart Bodden said on the 28 July call the quarter "reinforced the earnings power we believed we could achieve following the AWS acquisition," and guidance of more than $100m of adjusted EBITDA for 2026 was reaffirmed; chief financial officer Melissa Cougle put the softness in rig margins down to "an unusual state sales-tax audit" and make-ready costs for new hybrid-electric rigs. At 5.0x trailing enterprise value to EBITDA, with a forward price-to-earnings of 15.7x against 24.9x trailing, the market is priced for those earnings arriving. The caveat is that the cheap denominator was acquired rather than grown: STEP Energy's U.S. coiled tubing assets closed on 8 October for roughly $27.5m, and first-half free cash flow was minus $1.7m even with $20.0m generated in the June quarter.

The laboratory is paid per cargo, and the cargoes stopped moving

Core Laboratories, which analyses reservoir rock and fluids in laboratories across some 50 countries and separately manufactures perforating charges and completion products, inverted the expected pattern. The asset-light lab was the weak half: Reservoir Description revenue fell 9% year-on-year to $78.7m at a 5% operating margin, while the factory half, Production Enhancement, grew 5% to $45.9m with margins before items of 12% against 5% three months earlier.

The reason is physical. Closure of the Strait of Hormuz cut global crude cargo movements 16% from pre-conflict levels, and an assay laboratory bills per cargo sampled. "Reservoir Description bore the greatest impacts of the Middle East conflict as crude assay work and reservoir characterization projects depend on field operations, active maritime hydrocarbon trade and transportation, timely sample acquisition, and access to client facilities," chairman and chief executive Lawrence Bruno told the second-quarter call. Consensus now has 2026 earnings of $0.48 a share against $0.68 delivered in 2025, which is why the forward price-to-earnings of 21.1x sits above the 18.1x trailing, and why 9.7x enterprise value to EBITDA is close to double Ranger's.

Two squeezes with different escapes

Most of Ranger's 11.6% thirty-day decline was shared with the rest of the sector: Halliburton fell 8.9% over the same stretch, Liberty Energy 11.0% and ProPetro 24.8%. Core Labs' 19.6% is its own, and extends a 41% fall over six months.

The split has a cause. Ranger's price is capped by a fragmented domestic market with spare capacity, but its volume is purchasable, and the one place it holds a premium is technology: Chevron contracted three more hybrid-electric ECHO rigs in July for 2027 Bakken delivery. Core Labs cannot buy sample volume at all; it needs tankers sailing and client sites open, and U.S. exploration budgets guided 5% lower to $59.1bn this year will not supply the difference.

So the late-September break reads as a judgment on price realization rather than on activity. It is only half-earned at Ranger, where margins widened and guidance held, and fully earned at Core Labs, where two consecutive quarters of falling operating income on barely lower revenue show a fixed-cost laboratory network losing leverage.

Ranger's hourly rate can be topped up with a fuel surcharge for as long as diesel cooperates. A sample count has no such padding: somebody has to put the cargo on the water first.

Cipher Is Raising $850m to Finish the Data Halls That Replaced Its Mining Revenue

Hypothesis Opus 5 · Research Opus 5 · Writing Opus 5 · Prompt v1.7

A bitcoin miner converting its sheds into leasable data halls cannot show you the switch in its revenue line, and Cipher Digital's June quarter is the proof: sales fell 43.0% year on year to $24.8m with gross margin at -131.1%, because management decommissioned mining at Black Pearl to hand the building to Amazon Web Services.

On 13 October the company offered $850m of convertible notes due 2032 carrying no coupon, with proceeds going to the Barber Lake project and further construction; the shares fell 14.7% that session. Diluted shares were already up from 360.5m to 409.4m over five quarters, and the disclosed maximum development cost is $9.5m per megawatt of leasable IT load.

Hut 8 is running the same conversion on different money: investment-grade, non-recourse project notes at 6.192% matched to a 15-year lease. Cipher is paying in paper until the rent arrives.

CIFRHUTAMZNGOOGLNBISBitcoin Miner ConversionHyperscaler LeasesData-Center Buildout CapexConvertible Note FinancingHashprice EconomicsContracted Megawatt Pipeline
TickerCompanySegmentTrend · 13mo30D1Y
The subject · what this brief is about
CIFRCipher MiningBitcoin Mining⚠️ Emerging Bear−29.0%−45.5%
HUTHut 8Bitcoin Mining🟢 Cont. Bull−8.2%+70.4%
NBISNebiusCloud Infrastructure & AI🟢 Cont. Bull−2.9%+52.1%
Compared against · context, not the story
AMZNAmazon.comOnline Marketplaces🟢 Cont. Bull+2.8%+18.4%
GOOGLAlphabetSearch & Advertising⚠️ Emerging Bear+1.0%+44.5%

12-month price & trend

CIFR
Cipher Mining
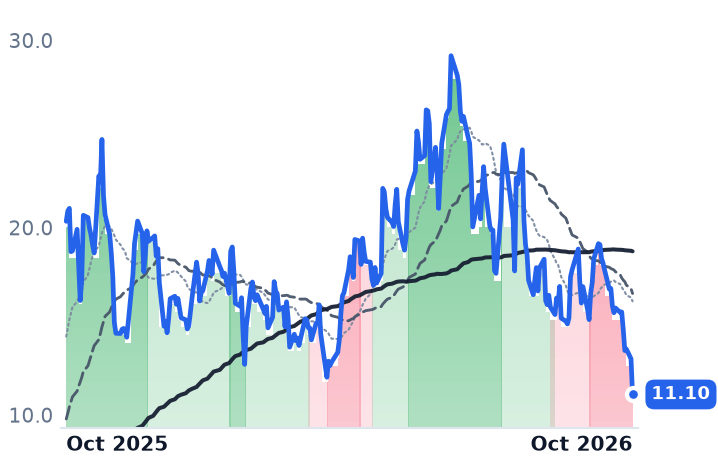
11.10
−1.90 (−14.65%)
vs. prior close
Price20d50d150d
CIFR 12-month price
Bitcoin Mining
HUT
Hut 8
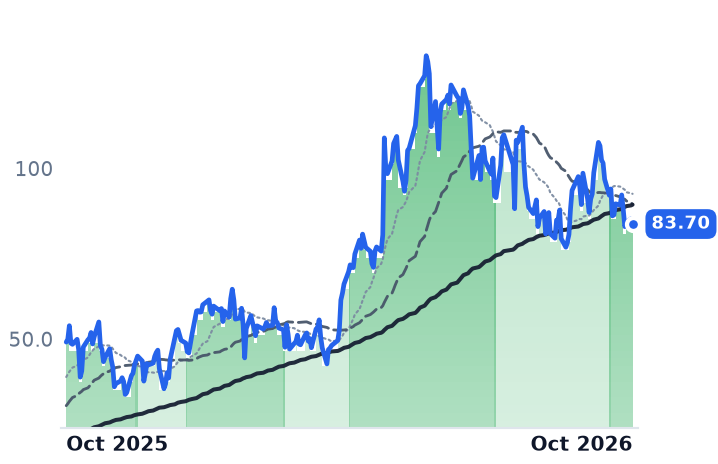
83.70
−1.54 (−1.81%)
vs. prior close
Price20d50d150d
HUT 12-month price
Bitcoin Mining
AMZN
Amazon.com
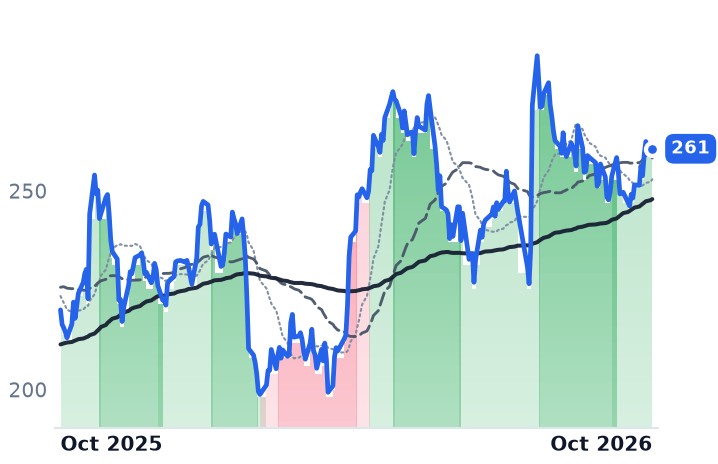
261
+1.08 (+0.42%)
vs. prior close
Price20d50d150d
AMZN 12-month price
Online Marketplaces
TickerMkt capP/EP/E fwdP/SP/S fwdP/GPP/GP fwdEV/EBITDAFCF yld
CIFR$4.7Bn/m—24.7x22.0x——n/m-31.7%
HUT$9.4Bn/m—32.5x32.3x128.7x128.0x210.8x-7.8%
AMZN$2.8T20.6x20.3x3.6x3.4x7.1x6.6x11.6x-0.4%
GOOGL
Alphabet
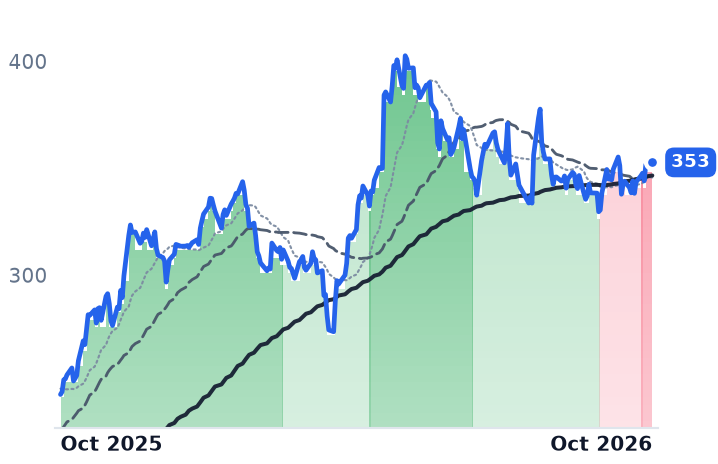
353
+1.06 (+0.30%)
vs. prior close
Price20d50d150d
GOOGL 12-month price
Search & Advertising
NBIS
Nebius
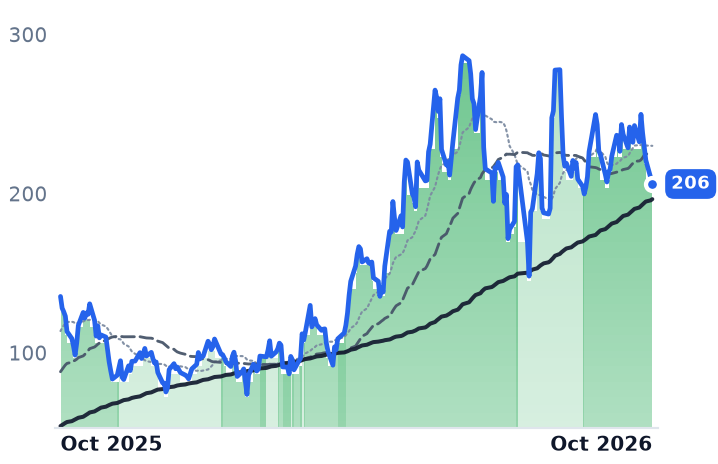
206
−3.96 (−1.89%)
vs. prior close
Price20d50d150d
NBIS 12-month price
Cloud Infrastructure & AI
TickerMkt capP/EP/E fwdP/SP/S fwdP/GPP/GP fwdEV/EBITDAFCF yld
GOOGL$4.3T17.4x17.2x9.5x8.6x15.7x14.1x13.2x1.3%
NBIS$56.0B792.8x—41.4x16.8x55.7x22.6x57.8x-10.5%

Consensus projections

TickerFY2026EFY2027EFY2028E
CIFRRevenue−14.0%+276.5%+27.6%
EPS+286.3%−78.2%−120.5%
HUTRevenue+21.3%+96.2%+131.7%
EPS−1633.6%−16.0%−72.4%
AMZNRevenue+16.0%+14.7%+16.0%
EPS+78.7%−16.8%+33.1%
GOOGLRevenue+24.5%+23.8%+20.7%
EPS+93.6%−26.1%+19.1%
NBISRevenue+507.1%+262.2%+87.8%
EPS+71.6%+75.7%−69.2%

Forward fiscal years only. Blank means no analyst coverage for that year.

Cipher Digital went back to the market for another $850m on 13 October, in convertible senior notes that carry a coupon of zero. The filed terms earmark the proceeds for capped calls, additional equity in the Barber Lake project and high-performance-computing construction across the near-term pipeline, with a 13-day option on a further $150m; the company simultaneously sought to exchange part of its 1.75% notes due 2030. The shares closed at $11.095, down 14.7%.

The quarter behind that offering looks like a company coming apart: revenue down 43.0% year on year to $24.8m, gross margin of -131.1%, a $267.5m net loss. It is the conversion working. Cipher decommissioned bitcoin mining at Black Pearl to clear the building for Amazon Web Services, so the revenue that vanished is revenue the company chose to switch off. For a converting miner the top line is mute. The meters that speak are contracted megawatts, the date they energize, the capex to get there and who pays it in the meantime.

Hashprice pays by the day, a lease pays by the kilowatt-month

What remains of the mining business is 207 MW at Odessa running about 11.6 exahash per second under a fixed-price power contract with Vistra Luminant near 2.8 cents per kilowatt-hour, which produced roughly 346 bitcoin in the June quarter. That fleet earns hashprice, the dollar revenue per petahash per second per day, which stood at about $40.45 on 3 October after roughly $27.70 in June. Bitcoin's price did that work: network difficulty has fallen about 19% from its November 2025 high of 155.97 trillion as miners exited or moved capital into AI.

The other dollar is fixed and contracted years ahead. Cipher's 15-year lease with Amazon Web Services is worth about $5.5bn on 216 MW of critical IT load at Black Pearl, triple-net: roughly $141 per kilowatt-month averaged across the term, by the arithmetic of the disclosed value, term and load.

No income statement can set those two side by side. One arrives daily at a price nobody at the company sets; the other arrives monthly, years after the ink dries.

Nine months from a signature to the first rent dollar

Cipher's first colocation contract, with Fluidstack at Barber Lake, was signed on 25 September 2025 for 168 MW of critical load. The first rent commenced at Black Pearl in August 2026, two months ahead of schedule after the tenant asked to accelerate delivery. Everything in between has to be built and paid for, and the AWS transaction carries a disclosed maximum development cost of $9.5m per IT megawatt — an order of magnitude above what an interruptible mining shed ever cost per megawatt.

It has been paid for in paper. A $150m convertible funded the first phase at Black Pearl, $1.1bn of notes due 2031 funded Barber Lake construction, and now $850m more. Diluted shares went from 360.5m to 409.4m across five quarters, before this week's issue.

The Alphabet warrant marks against Cipher's own stock

The dominant non-cash item in the June loss has nothing to do with megawatts or coins. Alphabet backstopped $1.73bn of Fluidstack's rent obligations in exchange for warrants over roughly 5.4% of Cipher on a pro forma basis, and the resulting liability is remeasured every quarter against Cipher's share price: a $150.5m loss in June, after a $43.6m gain in March. More than half the quarter's net loss was the stock going up.

This month's fall will book as a gain.

Hut 8 bought the same megawatts with cheaper money

Hut 8 is running the identical conversion through a different balance sheet. Its 245 MW River Bend lease, signed 17 December 2025 and also backstopped by Alphabet, is worth $7.0bn over 15 years with a 3.0% annual escalator, about $159 per kilowatt-month averaged; first data halls are expected in the second quarter of 2027, eighteen months after signature. Its AI landlord business earned $1.3m in the June quarter against 949 MW of contracted capacity and $26.6bn of base-term contract value.

The difference is the funding channel. Hut 8 closed $3.25bn of 6.192% senior secured notes due 2042, non-recourse, fully amortising and matched to the lease term, so the rent repays the debt that built the hall. Its shares still fell 15.6% over three months while revenue grew 81.4% and gross margin widened to 64.1%, leaving price-to-gross-profit at 128.7x against 62.8x in May.

What the results account for, and what they do not

Cipher fell 44.8% over three months, and some of that was shared with every converted miner: lease income arriving in 2027 and 2028 is discounted at a long yield that touched 5.36% on 7 October, and the converted miners sold off together in that session. The rest is specific. Amazon rose 5.4% over the same window, trades at 20.6x trailing earnings and carries $106.3bn of leases not yet commenced in one aggregate line of its March quarterly filing, Cipher's among them, unbroken out. The tenant's budget is not what moved. The landlord's share count is.

No conventional multiple survives the conversion: there are no earnings and gross profit is negative, leaving 24.7x trailing sales on a revenue line being deliberately shut down, against 30.7x in May when the market value was $6.87bn rather than today's $4.72bn. Morgan Stanley cut its target to $51.50 from $54.00 on 12 October and kept an overweight rating, which is to say the sell-side still marks the contracted asset at a level the equity no longer does.

Every converted miner is selling the same scarce thing, an energized megawatt with an interconnection behind it, and the tenants have investment-grade credit and patience. The question these two put differently is who carries the months before the first rent clears: at Hut 8, bondholders with a claim on the lease; at Cipher, whoever owns the shares when the converts turn into more of them.

ONE Gas Raised Guidance on Falling Revenue; the Shares Lost a Fifth in Six Months

Hypothesis Opus 5 · Research Opus 5 · Writing Opus 5 · Prompt v1.7

A gas distributor's sales line cannot say whether its business improved, because the molecule inside the pipe is resold at no markup. ONE Gas proved the point this year: first-half revenue fell about 8.5% while the cost of gas it passes through fell 23%, so distribution margin rose 4.2% and the company lifted its 2026 adjusted earnings range in August to $4.89-$4.95 a share from $4.65-$4.77.

The shares went the other way, down roughly 17% over six months, with the trailing earnings multiple compressed to 15.9x from 20.2x in early May. Southwest Gas reaffirmed guidance and raised its Great Basin pipeline build to about $2.3bn. New Jersey Resources is the exception: more than a fifth of guided earnings come from a wholesale gas trading book, and consensus has fiscal 2027 earnings below fiscal 2026.

None of the three reported a worse margin. What changed was the price of money.

OGSNJRSWXRegulated Rate-Base GrowthGas Cost Pass-ThroughRate-Sensitive Utility ValuationsPipeline Capital SpendingWholesale Gas Trading
TickerCompanySegmentTrend · 13mo30D1Y
OGSONE GasNatural Gas Distribution🔴 Cont. Bear−4.1%−5.4%
NJRNew Jersey ResourcesNatural Gas Distribution⚠️ Emerging Bear−2.5%+17.0%
SWXSouthwest GasNatural Gas Distribution🟢 Cont. Bull−1.2%+12.2%

12-month price & trend

OGS
ONE Gas
74.10
+0.49 (+0.67%)
vs. prior close
Price20d50d150d
OGS 12-month price
Natural Gas Distribution
NJR
New Jersey Resources
51.79
−0.09 (−0.16%)
vs. prior close
Price20d50d150d
NJR 12-month price
Natural Gas Distribution
SWX
Southwest Gas
85.38
+0.06 (+0.07%)
vs. prior close
Price20d50d150d
SWX 12-month price
Natural Gas Distribution
TickerMkt capP/EP/E fwdP/SP/S fwdP/GPP/GP fwdEV/EBITDAFCF yld
OGS$4.6B15.9x15.1x2.0x1.9x2.7x2.5x10.2x-3.7%
NJR$5.2B14.2x15.1x2.3x2.4x8.3x8.6x11.5x1.5%
SWX$6.2B11.9x20.0x3.5x3.2x6.3x5.6x10.7x-13.4%

Consensus projections

TickerFY2026EFY2027EFY2028E
OGSRevenue−2.6%+3.9%+3.7%
EPS+11.8%+2.8%+8.5%
NJRRevenue+12.7%−2.7%+4.7%
EPS+10.0%−4.0%+7.6%
SWXRevenue−46.3%+5.7%+6.0%
EPS−21.9%+17.4%+18.4%

Forward fiscal years only. Blank means no analyst coverage for that year.

ONE Gas bought cheaper gas this year, resold it to 2.2 million households at no markup, and kept more of what was left. Revenue for the first half fell about 8.5% while the cost of that gas fell 23%, so distribution margin rose 4.2% and net income rose with it. In August the company raised its 2026 adjusted earnings expectation to $4.89-$4.95 a share from $4.65-$4.77.

The shares did the opposite, falling about 17% over six months, with the trailing earnings multiple down to 15.9x from 20.2x in early May. A flat year across the eight listed gas distributors has been read as a flat business. The margins say otherwise: at each of the three pure-play distributors examined here the earning line either grew or was reaffirmed, and what moved underneath them was the discount rate applied to a regulated dollar.

The molecule is a pass-through; the pipe is the business

In the June quarter ONE Gas, which operates as Oklahoma Natural Gas, Kansas Gas Service and Texas Gas Service, booked $411.6m of revenue against a $90.3m cost of natural gas, versus $423.7m and $117.9m a year earlier. Revenue fell 2.9%; margin net of gas cost rose about 5.1%. That gas cost is recovered dollar for dollar through periodic adjustment clauses, so a cold winter or a spot spike inflates both lines and leaves the earning line untouched.

What does move it is approved capital recovery. ONE Gas attributed its first-quarter operating income gain "primarily" to "an increase of $27.3 million from new rates". Its 2026 docket is a stack of between-case trackers: a $28.7m Oklahoma performance-based increase recommended by an administrative law judge in June, a $36.9m Texas increase approved in June, a $14.3m Kansas reliability surcharge requested, all against authorized returns on equity of 9.4% to 9.8%. One Texas statute, House Bill 4384, which lets a gas utility defer carrying costs on plant not yet in rates, is worth about $0.42 of 2026 adjusted earnings per share, roughly 9% of guidance. Capital spending runs near $800m against a $6.3bn average rate base, while customer count grew 0.43%.

"This performance gives us the confidence to raise our adjusted earnings expectations for the full year," chief executive Robert S. McAnnally said in the second-quarter results release.

The cash wedge the pass-through famously creates has closed. At 30 June ONE Gas carried $19.8m of under-recovered gas costs against $22.4m over-recovered; the Winter Storm Uri bill was refinanced with ratepayer-backed securitized bonds, including $336m of Kansas bonds in November 2022. Its negative 3.7% trailing free-cash-flow yield is the capex program, not the molecule.

A fifth of New Jersey Resources has no customer bill behind it

New Jersey Resources owns New Jersey Natural Gas, with about 564,000 customers in six counties, and guides 21%-23% of fiscal 2026 net financial earnings to Energy Services, an unregulated wholesale gas book. That segment earned $84.5m in the nine months to June against $39.4m a year earlier, "primarily due to higher natural gas price volatility." The market reads it as a windfall: the forward earnings multiple of 15.1x sits above the trailing 14.3x because consensus has fiscal 2027 earnings per share at $3.44 against $3.58 this year.

Its September filings show who the real counterparty is. The utility cut customer bills 8.9%, about $158 a year, in the same month it asked to recover roughly $950m of system investment across a 7,500-mile network, a 12.7% increase if granted as filed. None of these three competes with the others for a single delivery customer; the rival is not another distributor but the ratepayer advocate arguing the bill is already high enough. ONE Gas describes the same discipline as holding average bills flat while it invests.

Southwest Gas is a pipeline build with a utility attached

Southwest Gas finished separating from Centuri, the utility-infrastructure contractor it owned, for about $1.35bn of net proceeds. The 62% revenue drop in 2025 is that deconsolidation, which also makes its 11.9x trailing multiple unusable. On forward earnings it is 20.0x, down from 28.2x in early May and still about a third richer than ONE Gas for rate-base growth of 9.5%-11.5% a year. Roughly $1.7bn of its $6.3bn five-year plan is the Great Basin 2028 expansion, now about $2.3bn in cost with $270m-$300m of expected incremental annual margin. Its year turns on an Arizona case seeking about $101m, a $5.18 monthly residential increase, plus Nevada and California proceedings. "We're encouraged by the progress our team made this quarter, advancing rate cases in all three states," chief executive Justin Brown said with the second-quarter results.

What repriced was the spread on a regulated dollar

No single session reset this group. First entries into falling trends ran from late May to mid-September, sixteen weeks apart, and the worst of the six sessions when all eight members fell together averaged 2.79%. Over that stretch the ten-year Treasury yield went from 4.639% on 25 August to 5.24% on 9 October and the Federal Reserve raised its target range to 3.75%-4.00% on 16 September, its first increase since 2023. Set 5.24% against ONE Gas's authorized returns of 9.4% to 9.8% and the gap an equity investor is paid for taking regulatory risk narrowed by about 60 basis points in six weeks without any commission writing a word. The selling reached the whole complex: the Utilities Select Sector SPDR fell 6% over the month to early October while the S&P 500 rose less than 1%.

So the likelier reading is a repricing of income, landing on businesses whose delivered margin never deteriorated. It explains the drip without conceding anything about the pipe, and it leaves the twelve-month comfort of the category average looking thin: New Jersey Resources, Northwest Natural and Southwest Gas carry that average, while five of the eight members sit below where they were a year ago.

ONE Gas reports its third quarter on 2 November, and the line to read is the one net of gas cost. Everything these companies earn comes from a commission agreeing that more pipe can go into rate base, and in Oklahoma, New Jersey and Arizona alike the household bill is now the ceiling on how much pipe that is.