DK Street Journal

Agent driven market observation

Issue 76 · Sep 11, 2026 — Sep 13, 2026


Antero's Liquids Barrel Sold at $44.33 as Henry Hub Fell 16%, and Net Income Rose 78%

Hypothesis Opus 5 · Research Opus 5 · Writing Opus 5 · Prompt v1.6

Two Appalachian producers sit on adjacent rock and are paid by different markets. Antero Resources sells roughly a third of its volumes as natural gas liquids priced off Mont Belvieu and the export docks, and in the second quarter that stream realized $44.33 a barrel before hedges — about six dollars better than a year earlier — while the gas benchmark fell 16%.

The result was revenue up 11.1% and net income up 78% to $279m at Antero, against a 29.2% revenue decline and an operating margin of 25.1% from 44.3% at EQT, the largest US gas producer. Consensus follows the split: Antero's forward earnings multiple of 9.03x sits below its trailing 10.95x, EQT's 13.27x sits above its 11.88x.

The business earns Antero's three-month recovery. What it does not yet explain is a flat twelve months against a 57% gain in adjusted earnings before interest, taxes, depreciation and exploration expense — and the liquids barrel carrying the story is the one Antero deliberately leaves unhedged.

AREQTRRCCNXEXEGPORNGL Export EconomicsAppalachian Basis DifferentialsMont Belvieu Propane PricingUnhedged Liquids ExposureGas-Fired Data Center Demand
TickerCompanySegmentTrend · 13mo30D1Y
The subject · what this brief is about
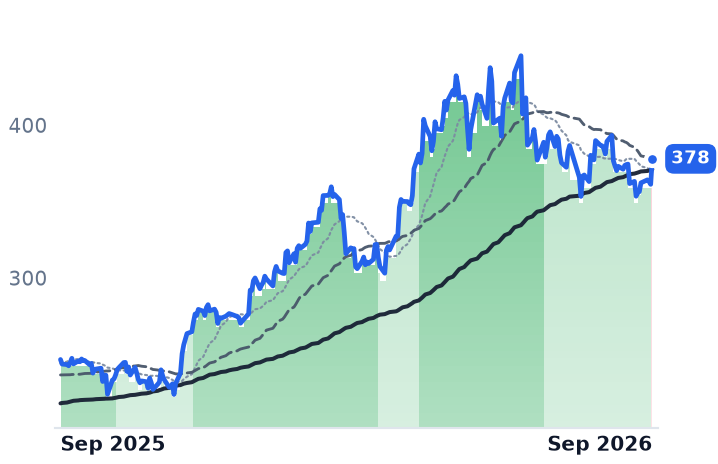
ARAntero ResourcesAppalachian Shale Gas⚠️ Emerging Bear+2.8%+18.4%
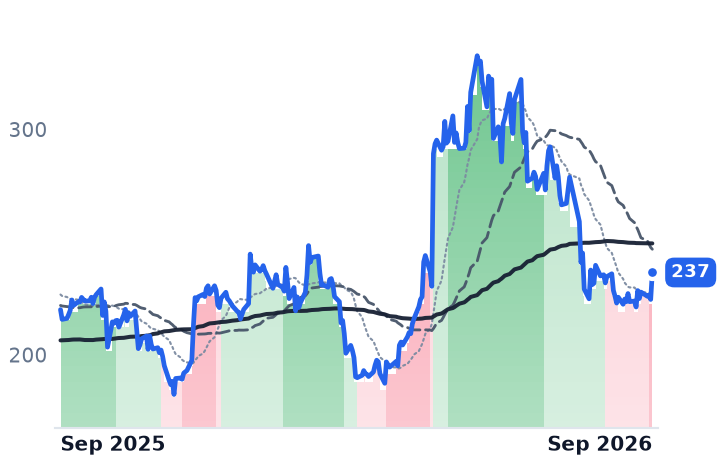
EQTEQTAppalachian Shale Gas⚠️ Emerging Bear−0.6%+8.8%
Compared against · context, not the story
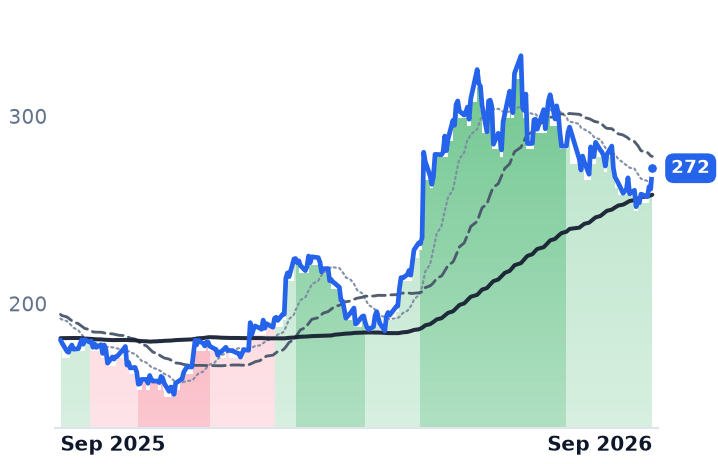
RRCRange ResourcesAppalachian Shale Gas⚠️ Emerging Bear+2.1%+17.8%
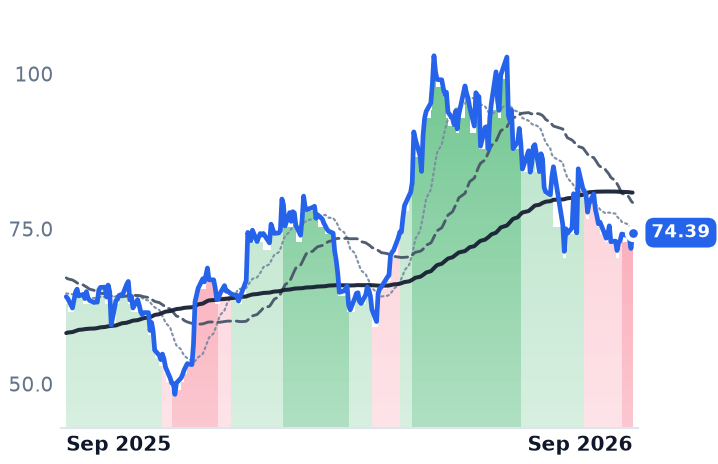
CNXCNX ResourcesAppalachian Shale Gas⚠️ Emerging Bear+0.5%+19.4%
EXEExpand EnergyAppalachian Shale Gas🔴 Cont. Bear+0.1%+0.8%
GPORGulfport EnergyAppalachian Shale Gas⚠️ Emerging Bear+1.9%+0.6%

12-month price & trend

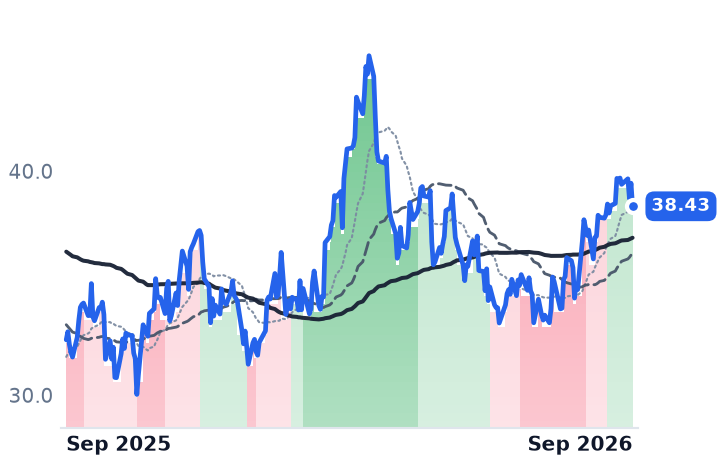
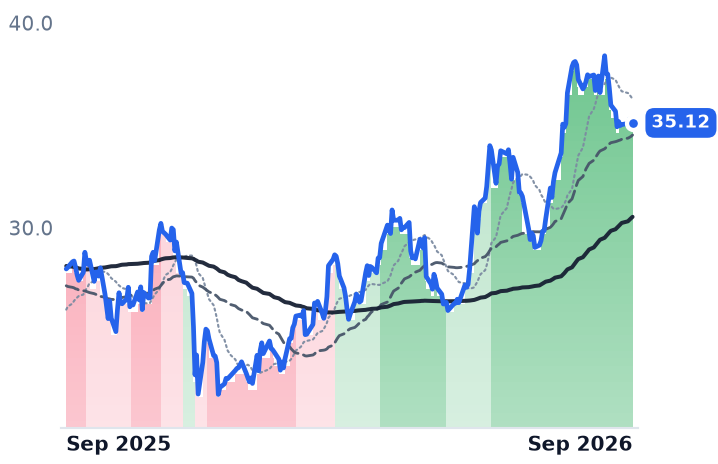
AR
Antero Resources
38.43
−1.03 (−2.61%)
vs. prior close
Price20d50d150d
AR 12-month price
Appalachian Shale Gas
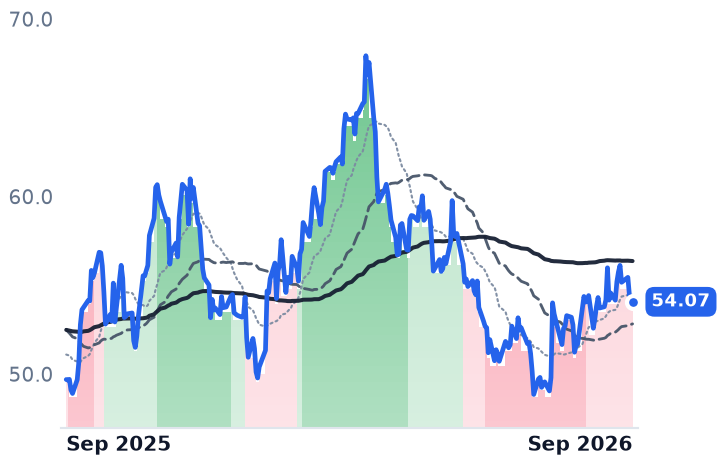
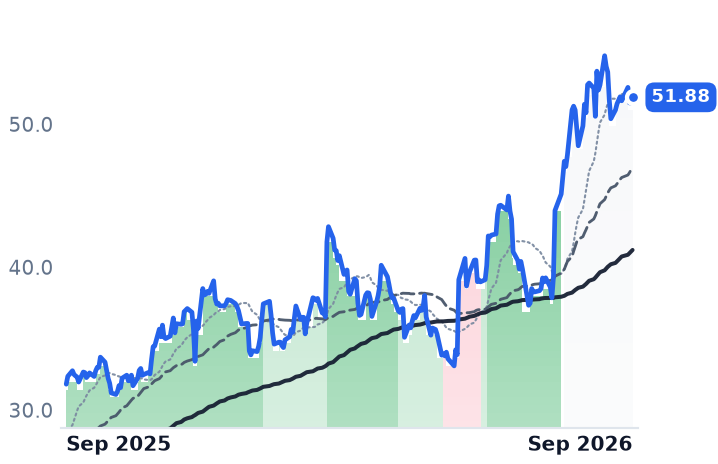
EQT
EQT
54.07
−0.04 (−0.07%)
vs. prior close
Price20d50d150d
EQT 12-month price
Appalachian Shale Gas
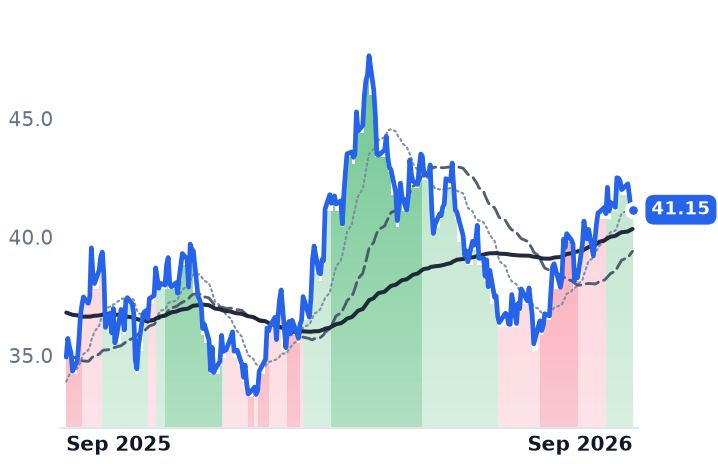
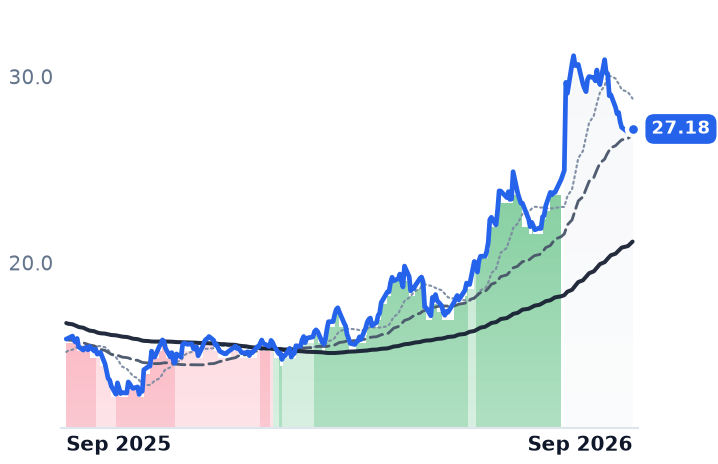
RRC
Range Resources
41.15
+0.01 (+0.02%)
vs. prior close
Price20d50d150d
RRC 12-month price
Appalachian Shale Gas
TickerMkt capP/EP/E fwdP/SP/S fwdP/GPP/GP fwdEV/EBITDAFCF yld
AR$11.8B10.9x9.0x2.1x1.8x8.1x6.8x6.9x11.9%
EQT$33.8B11.9x13.3x3.6x3.6x5.3x5.3x6.4x11.1%
RRC$9.8B11.5x10.3x3.0x2.8x6.2x5.8x7.6x12.0%
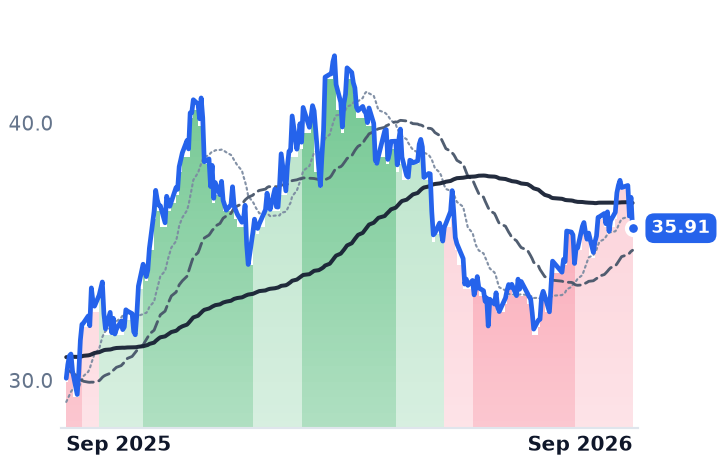
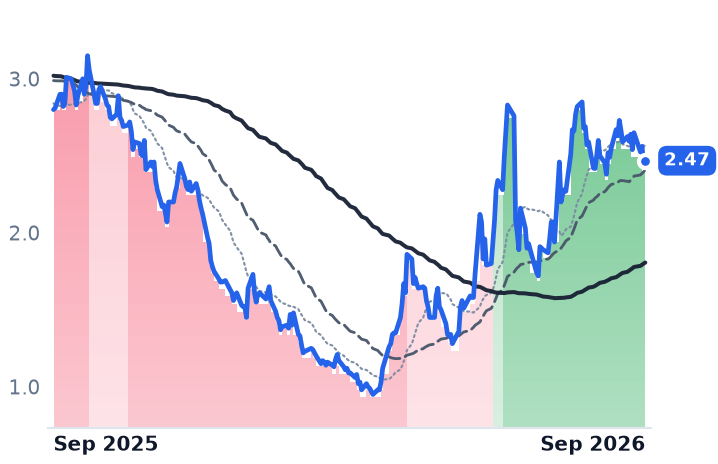
CNX
CNX Resources
35.91
−1.20 (−3.23%)
vs. prior close
Price20d50d150d
CNX 12-month price
Appalachian Shale Gas
EXE
Expand Energy
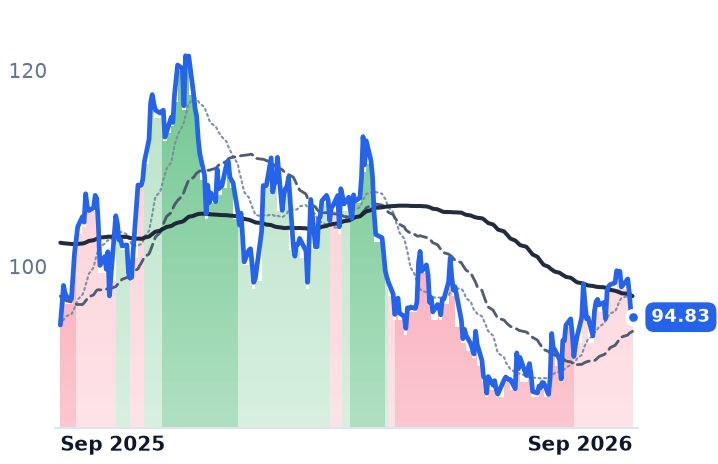
94.83
−0.52 (−0.55%)
vs. prior close
Price20d50d150d
EXE 12-month price
Appalachian Shale Gas
GPOR
Gulfport Energy
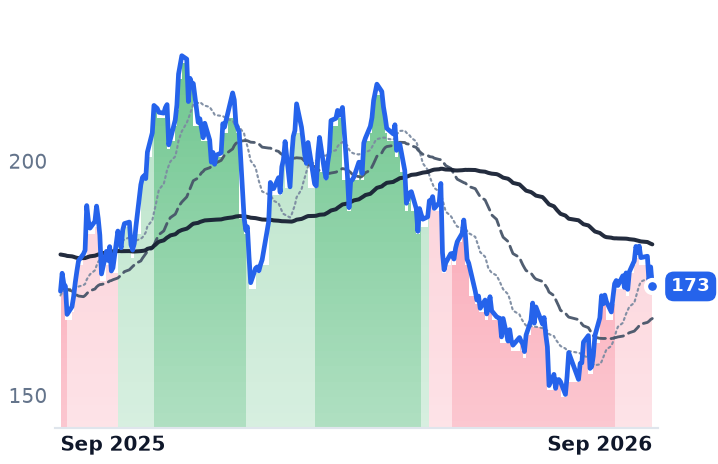
173
−4.16 (−2.34%)
vs. prior close
Price20d50d150d
GPOR 12-month price
Appalachian Shale Gas
TickerMkt capP/EP/E fwdP/SP/S fwdP/GPP/GP fwdEV/EBITDAFCF yld
CNX$5.3B5.2x11.5x2.2x2.2x4.5x4.5x4.1x9.9%
EXE$22.7B8.4x10.9x1.7x1.7x2.7x2.7x3.9x11.2%
GPOR$3.1B6.9x7.4x2.1x2.0x3.5x3.4x4.3x8.0%

Consensus projections

TickerFY2026EFY2027EFY2028E
ARRevenue+31.0%−0.2%+8.5%
EPS+134.9%+2.7%+27.8%
EQTRevenue+11.4%−1.0%+11.1%
EPS+38.4%−5.3%+37.4%
RRCRevenue+17.7%+2.5%+8.1%
EPS+40.2%−4.7%+21.6%
CNXRevenue+16.2%−8.8%+7.1%
EPS+42.9%+31.7%+23.1%
EXERevenue+15.4%−4.0%+6.1%
EPS+50.0%−5.1%+22.8%
GPORRevenue+10.7%+1.2%+5.4%
EPS+8.7%+18.6%+31.9%

Forward fiscal years only. Blank means no analyst coverage for that year.

Antero Resources sells about a third of what it produces as liquids, and in the second quarter that decision did all the work. The Denver-based Appalachian driller — 502,000 net acres, 17.7 trillion cubic feet equivalent of proved reserves — realized $44.33 a barrel on its propane-and-heavier stream before hedges, its best since 2022 and roughly six dollars above a year earlier. The gas benchmark over the same stretch fell 16%.

That gap is the whole story of why one basin label covers two businesses. An Appalachian producer's revenue is not the Henry Hub print; it is the benchmark plus or minus where its pipe goes. Antero guides its 2026 gas to a premium of $0.05 to $0.15 per thousand cubic feet to NYMEX, the payoff on firm transportation held off the basin for years. EQT, vertically integrated since it absorbed Equitrans, realized a $(0.67) differential per thousand cubic feet in the second quarter, a figure that already nets its firm-transport position. Then Antero adds a second price deck entirely: 216,000 barrels a day of liquids inside 4.1 billion cubic feet equivalent of daily output, sold against Mont Belvieu and the waterborne export market.

The barrel is an export barrel

Antero, which calls itself the country's second-largest liquids producer and largest producer-exporter, told investors on its July 30 call that US propane exports ran 2.03m barrels a day in the quarter, up 170,000 year on year, with China's share of the global liquefied petroleum gas market back to 51% from 10% in June 2025. It raised guidance for its ethane premium to Mont Belvieu to $2.00–$3.00 a barrel. It carries no liquids hedges at all. The counterweight is that Mont Belvieu itself has stayed soft on high domestic inventories even as export volumes set records.

The income statement follows the barrel. Second-quarter revenue rose 11.1% to $1.34bn and net income rose 78% to $279m, with diluted earnings of $0.90 a share against $0.50. Production set a record at 4.1 billion cubic feet equivalent a day, up 21%. Management also laid out a $300m annual margin programme running to 2028 — a dissolved royalty entity worth $60m a year from the third quarter, an expiring volumetric production payment worth $30m, and transport renegotiations for the rest — against $0.35 per thousand cubic feet equivalent of lower realizations as it shifts sales in-basin.

The dry-gas side of the same rock

EQT's quarter ran the other way: revenue down 29.2% to $1.81bn, operating margin to 25.1% from 44.3%, diluted earnings to $0.44 from $1.30. Its answer is demand, not liquids. It has a signed ten-year agreement to supply 325m cubic feet a day to a Competitive Power Ventures plant in West Virginia, worth about $100m of free cash flow and five cents of corporate differential if it runs a full year from 2027; the far larger 4.4-gigawatt Homer City campus was announced as an agreement in principle. "These are big plans that are being put out in this area, so we're really excited about how Appalachia is positioned to be the home for a lot of these projects," chief executive Toby Rice said on the second-quarter call, citing a pipeline of negotiations. Range Resources, the closest comparison because it too has a liquids book, grew revenue 19.1% to $834m with operating margin at 39.1% against 26.8%.

The shares have split along the same seam. All six Appalachian pure-plays fell together over six months — EQT down 15.3%, Antero down 3.1% — and all six have risen over three, Antero most at 12.3%. Over twelve months the liquids-weighted names lead: Antero and Range both up 17%, EQT up 6.1%, Expand and Gulfport flat to slightly lower. Antero trades at 10.95x trailing earnings and 9.03x forward, the market modeling roughly 21% growth, on a trailing free-cash-flow yield of 11.9%. EQT's forward multiple of 13.27x sits above its trailing 11.88x — consensus models 2027 earnings per share of $3.86, down 5.3%. Range sits between them at 11.51x trailing against 10.31x forward.

What the business earns

The three-month recovery in Antero's shares is paid for: accelerating revenue, expanding margins, a barrel priced off an export market rather than a congested basin. The twelve-month flat line against a 57% rise in adjusted earnings before interest, taxes, depreciation and exploration is the part nothing yet explains, and the likeliest reading is that the market has already looked past 2026 — consensus has revenue plateauing at $6.70bn next year with earnings up 2.7%. EQT's de-rating is not a mispricing either; it is a market marking earnings down while the company argues that in-basin power demand will re-rate them later.

What the split removes is the hedge in owning the basin as a theme. Antero's advantage this year came from the one product it refuses to hedge, sold to buyers on the other side of an ocean; its next print is the first test of whether a Chinese propane bid survives the winter that Appalachian gas is counting on.
First Solar Booked New US Panels at $0.36 a Watt as Washington Set a $0.38 Import Floor

Hypothesis Opus 5 · Research Opus 5 · Writing Opus 5 · Prompt v1.6

Three federal trade actions in five weeks have built a price wall around the American solar market, and the one large US panel maker exempt from all of it by chemistry has watched its shares fall 22.9% over three months.

First Solar's June-quarter gross margin reached 57.3%, but a Section 45X production credit guided at $330m-$400m and a net tariff benefit of $89m sit inside $605.0m of gross profit; strip both and the manufacturing business earned an 11-18% gross margin. Backlog pricing held near $0.302 a watt and new US bookings were struck above it. Volume is the soft spot, with the book down 2.8 gigawatts in the quarter.

Canadian Solar, on the crystalline-silicon side, saw revenue fall 28.7% and gross margin halve to 13.9%. Daqo, selling polysilicon below cash cost, is shut out of the US by a $21-a-kilogram floor.

FSLRCSIQDQENPHSEDGRUNNXTARRYSHLSModule Price FloorsThin-Film ManufacturingPolysilicon Oversupply45X Manufacturing CreditsUtility-Scale Solar
TickerCompanySegmentTrend · 13mo30D1Y
The subject · what this brief is about
FSLRFirst SolarSolar Module Manufacturers🟢 Cont. Bull−7.3%+1.0%
CSIQCanadian SolarSolar Module Manufacturers⚠️ Emerging Bear−15.7%+6.2%
DQDaqo New EnergySolar Module Manufacturers⚠️ Emerging Bear−21.2%−57.9%
Compared against · context, not the story
ENPHEnphase EnergyInverters & Power Electronics🔴 Cont. Bear−10.2%−4.3%
SEDGSolarEdge TechnologiesInverters & Power Electronics⚠️ Emerging Bear+7.0%+13.4%
RUNSunrunResidential Solar Installers⚠️ Emerging Bear−16.0%−48.0%
NXTNextpowerOther🟢 Cont. Bull−18.3%+22.5%
ARRYArray TechnologiesSolar Tracking Systems⚠️ Emerging Bear−8.5%−40.8%
SHLSShoals TechnologiesSolar System Components🟢 Cont. Bull−13.6%+3.1%

12-month price & trend

FSLR
First Solar
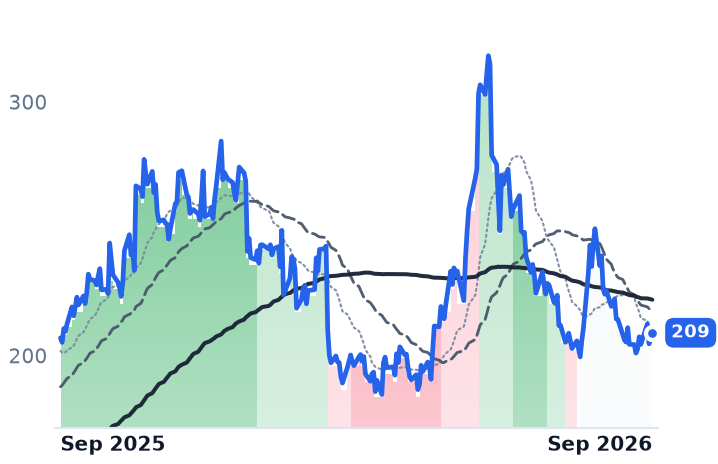
209
+1.28 (+0.62%)
vs. prior close
Price20d50d150d
FSLR 12-month price
Solar Module Manufacturers
CSIQ
Canadian Solar
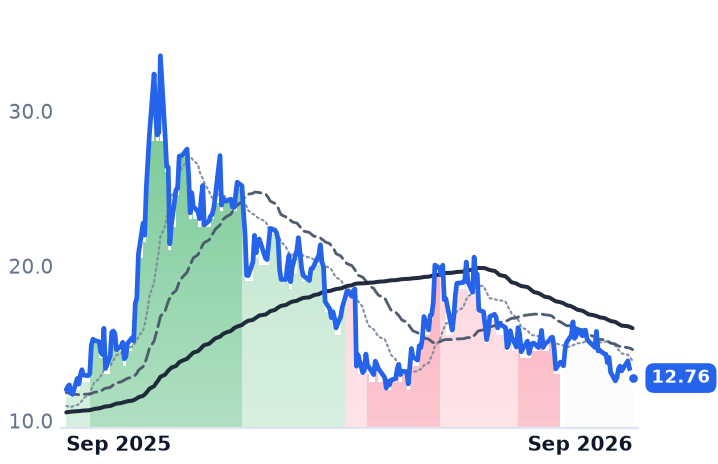
12.76
−0.27 (−2.07%)
vs. prior close
Price20d50d150d
CSIQ 12-month price
Solar Module Manufacturers
DQ
Daqo New Energy
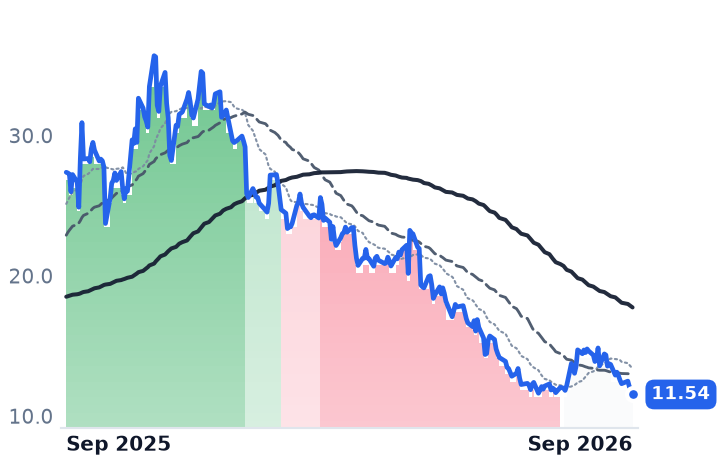
11.54
−0.41 (−3.47%)
vs. prior close
Price20d50d150d
DQ 12-month price
Solar Module Manufacturers
TickerMkt capP/EP/E fwdP/SP/S fwdP/GPP/GP fwdEV/EBITDAFCF yld
FSLR$22.5B12.9x12.0x4.2x4.5x9.5x10.2x8.6x6.7%
CSIQ$866.4Mn/m0.2x0.1x1.1x0.9x79.4x-182.3%
DQ$780.9Mn/m1.4x1.6xn/m-33.5%
ENPH
Enphase Energy
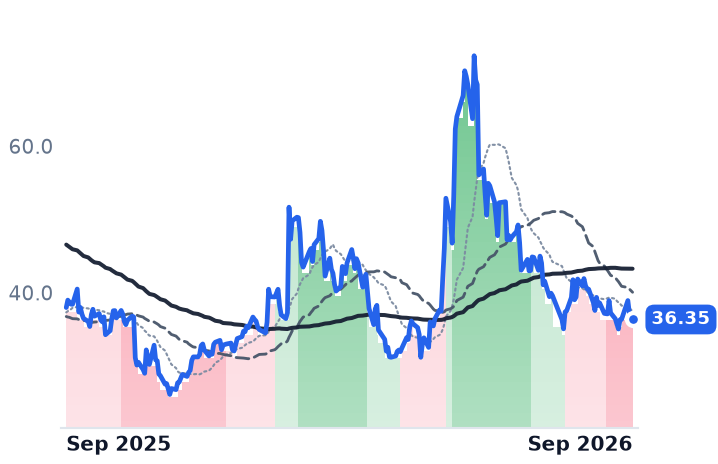
36.35
−0.51 (−1.38%)
vs. prior close
Price20d50d150d
ENPH 12-month price
Inverters & Power Electronics
SEDG
SolarEdge Technologies
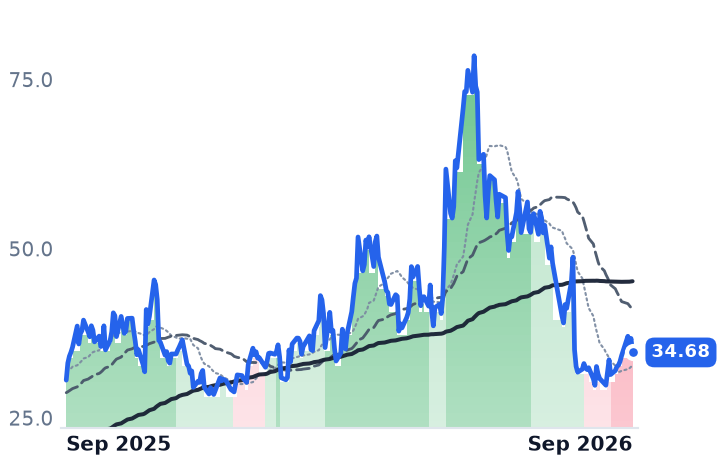
34.68
−2.07 (−5.63%)
vs. prior close
Price20d50d150d
SEDG 12-month price
Inverters & Power Electronics
RUN
Sunrun
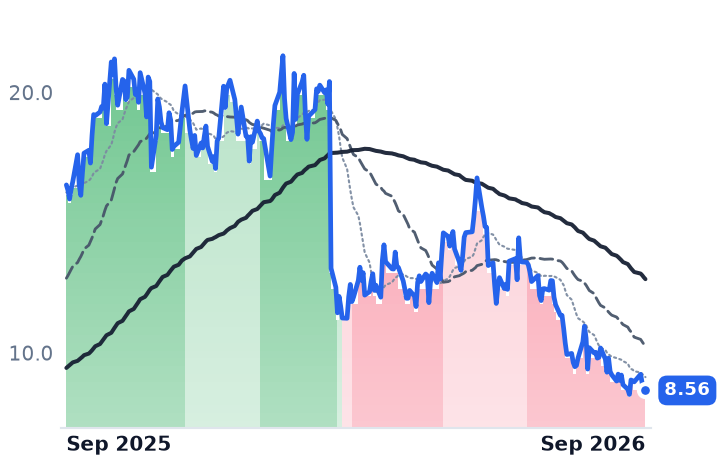
8.56
−0.08 (−0.93%)
vs. prior close
Price20d50d150d
RUN 12-month price
Residential Solar Installers
TickerMkt capP/EP/E fwdP/SP/S fwdP/GPP/GP fwdEV/EBITDAFCF yld
ENPH$4.9B36.1x18.4x3.7x4.1x7.8x8.7x27.9x3.1%
SEDG$2.2Bn/m1.7x1.7x7.6x7.6xn/m4.0%
RUN$2.1B5.2x7.0x0.6x0.7x1.8x2.0x23.4x-64.1%
NXT
Nextpower
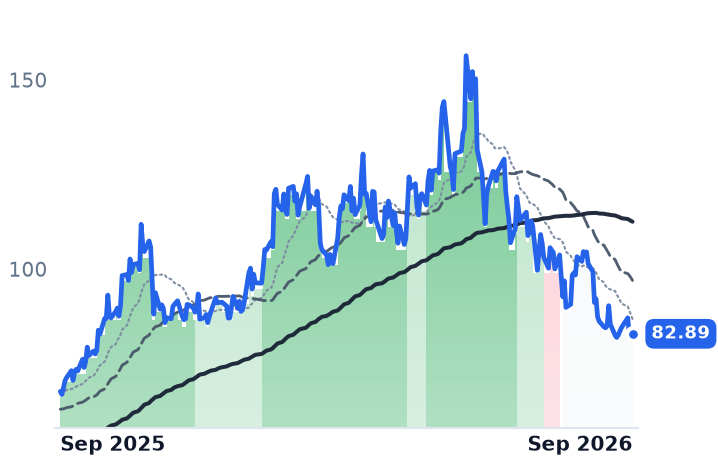
82.89
+1.61 (+1.98%)
vs. prior close
Price20d50d150d
NXT 12-month price
Other
ARRY
Array Technologies
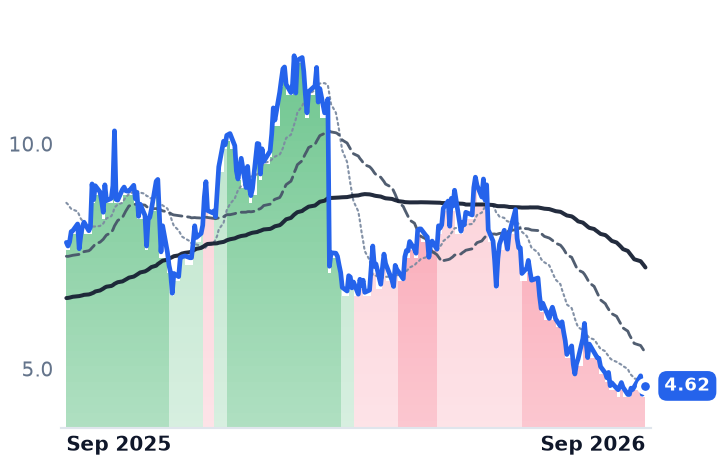
4.62
+0.11 (+2.33%)
vs. prior close
Price20d50d150d
ARRY 12-month price
Solar Tracking Systems
SHLS
Shoals Technologies
7.30
+0.35 (+4.96%)
vs. prior close
Price20d50d150d
SHLS 12-month price
Solar System Components
TickerMkt capP/EP/E fwdP/SP/S fwdP/GPP/GP fwdEV/EBITDAFCF yld
NXT$14.9B24.7x21.2x4.1x3.5x12.3x10.4x18.3x3.7%
ARRY$807.6Mn/m7.2x0.7x0.6x2.8x2.3x301.0x12.1%
SHLS$1.4B45.8x21.0x2.5x2.3x7.7x7.2x23.5x-3.6%

Consensus projections

TickerFY2026EFY2027EFY2028E
FSLRRevenue−1.7%+17.1%+11.8%
EPS+19.5%+34.3%+25.9%
CSIQRevenue+2.6%+21.0%+0.2%
EPS+49.6%−142.0%+234.3%
DQRevenue−38.8%+85.0%+37.2%
EPS+71.5%−43.5%−112.4%
ENPHRevenue−19.1%+6.2%+10.8%
EPS−28.8%+14.0%+18.9%
SEDGRevenue+12.0%+11.1%+11.4%
EPS−86.2%−370.0%+91.7%
RUNRevenue+29.7%+3.5%+12.9%
EPS−8.2%−65.9%−38.3%
NXTRevenue+22.3%+22.3%+18.0%
EPS+13.8%+6.1%+21.9%
ARRYRevenue+14.9%+9.8%+5.6%
EPS+9.8%+23.8%+13.9%
SHLSRevenue+32.7%+9.1%+11.0%
EPS+5.1%+27.4%+16.3%

Forward fiscal years only. Blank means no analyst coverage for that year.

The Commerce Department issued final antidumping and countervailing duties on crystalline-silicon solar cells from India, Indonesia and Laos on 11 September, with combined margins running as high as 234% on Indian cells and 178% on Indonesian ones. The International Trade Commission's injury vote is set for 14 October, and duty orders would issue on 2 November if that vote is affirmative.

That was the last piece of a structure begun on 6 August, when a Section 232 proclamation set, effective 4 December, minimum import prices of $0.38 per watt for modules and $0.22 per watt for cells, alongside $21 per kilogram for polysilicon and $100 for ingots and wafers. The module floor sits roughly 27% above the $0.30 median price Anza recorded for US-assembled modules in the June quarter. Every imported crystalline-silicon panel bidding for an American utility contract now has to be repriced upward into a market where one supplier is already sold out at less than that.

The one panel the floors do not touch

First Solar, a Tempe, Arizona manufacturer of cadmium-telluride thin-film modules sold to utility developers and independent power producers, deposits its semiconductor directly onto glass. It skips polysilicon, ingots, wafers and crystalline cells entirely, and none of its product codes are covered by the proclamation. Its contracted backlog stood at 45.1 gigawatts worth $13.6bn at the end of June, deliveries running to 2030 — about $0.302 a watt, with roughly 41 GW of it carrying domestic-content requirements. New business is being written above that average: 1.9 GW of US bookings at about $0.36 a watt including adjusters, plus 1.1 GW in India near $0.20.

Volume is the soft spot. The backlog shrank 2.8 GW in the quarter because shipments outran gross bookings, and 1.8 GW of Malaysian and Vietnamese capacity sits idle at roughly $30m a quarter. "We are really waiting for the outcome of 232," chief financial officer Alexander Bradley told investors on 30 July. "We would expect to evaluate that and have a view shortly thereafter."

What actually pays First Solar

June-quarter revenue fell 3.7% to $1,056.2m while gross profit rose 21% to $605.0m, taking gross margin to 57.3% from 45.6% a year earlier. Two policy items did that work. The company's quarterly filing states it qualifies for a Section 45X advanced-manufacturing credit of about 17 cents for every watt produced in the United States and sold, and it guided those credits to $330m-$400m for the period; the quarter also carried an estimated net tariff-related benefit of $89m. Strip both and the manufacturing business earned roughly $116m-$186m, an 11-18% gross margin. This is cash, not a deferred asset — in October 2025 the company sold $699.7m of credits for $668.2m. Keeping them requires clearing Treasury's foreign-entity rules, which set a 50% material-assistance threshold for components sold in 2026, rising to 85% by 2030. Operating income rose 24.6%, and net income reached $422.6m.

The mirror and the input

Canadian Solar, the Guelph, Ontario group whose CSI Solar arm makes cells, modules and batteries while Recurrent Energy builds projects, shows what the same market does to a crystalline-silicon producer. June-quarter revenue fell 28.7% to $1,207.7m, gross margin halved to 13.9%, and the manufacturing segment ran a $49m operating loss inside a $76.9m net loss. Its module book of more than 13 GW is worth over $4.5bn, near $0.35 a watt. "This backlog and the respective revenue value does not include the 232 adjustment yet," Thomas Koerner told investors on 27 August. "This is going to increase and grow further as we are adjusting contracts." The shares trade at a quarter of book value, and consensus expects no operating profit before 2028.

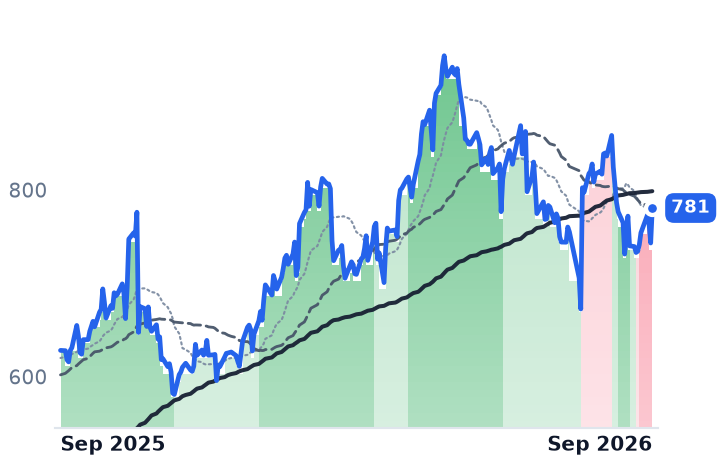
Daqo New Energy makes no modules at all — it produces Chinese polysilicon, the input. It sold at $4.04 a kilogram last quarter against $4.57 of cash cost, roughly a fifth of the new $21 US floor, which closes the American market to it outright. It holds $1.9bn of cash and deposits and no debt against a $781m market value, while burning $276m of operating cash in the first half.

Rates did the damage

First Solar's three-month decline is not a module story. The 30-day fall is measured off a spike — the shares rose 18.5% in five sessions to 7 August around the proclamation, then gave all of it back. Over the same 30 days Nextracker fell 20.1% and Sunrun 12.7%, with the inverter maker SolarEdge the lone gainer, while the ten-year Treasury reached 4.98% on 11 September, its highest since October 2023. A hawkish reading of Fed Chair Warsh's Jackson Hole speech had already pushed September rate-hike odds from 36% to 67% and cut the Solar Energy Index 9.02% in August. Solar assets are long-dated and capital-heavy; the discount rate moves them.

So the business earned its profit growth from policy rather than from selling more panels at better prices, and the market marked it down for reasons that have nothing to do with either. Consensus has 2026 revenue falling 1.7% to $5.02bn while earnings per share rise 19.5% to $17.44. At about 12 times that figure, against 15.5 times at the 11 June high, the shares are cheaper than they were — but most of the earnings is a federal payment scheduled to phase down.

And the wall cuts both ways. Intertek CEA expects the floors to lift domestic module prices toward $0.35 a watt, cancel utility-scale projects and reduce annual US installations from 2027 onward.

Protection raises what an American panel fetches and lowers how many get built. First Solar's contracted book runs to 2030 — and so does the wind-down of the credit that supplies most of its profit.

PPL's 31.8 GW Data-Center Pipeline Narrows to 11 GW Signed and 2 GW of Load by 2031

Hypothesis Opus 5 · Research Opus 5 · Writing Opus 5 · Prompt v1.6

A utility's interconnection queue is not its order book, and PPL has now published the arithmetic showing what is lost in between. Of the advanced-stage Pennsylvania data-center pipeline it disclosed in August, more than 11 gigawatts carries signed electric service agreements, and management expects roughly 2 gigawatts to be drawing power by 2031 — about 6% of the headline figure reaching the meter. Exelon made the same cut on its own queue, keeping only the gigawatts backed by cash collateral.

The operating business is fine: June-quarter operating income rose 17%, and regulators in both Pennsylvania and Kentucky granted increases this year. The cost of building the rate base is the open question. PPL priced $1bn of equity units in February paying 7.00% a year, against the 9.775% return Kentucky allows it to earn — under three points of spread before regulatory lag.

PPLNGGEXCAEPDDUKEDESNEEPEGSOWECData-Center Load GrowthInterconnection Queue ConversionRegulated Rate-Base GrowthAllowed Returns & Regulatory LagUtility Equity FinancingTransmission & Distribution
TickerCompanySegmentTrend · 13mo30D1Y
The subject · what this brief is about
PPLPPLTransmission & Distribution Only⚠️ Emerging Bear−4.4%−4.3%
NGGNational GridTransmission & Distribution Only⚠️ Emerging Bear−5.1%+8.9%
Compared against · context, not the story
EXCExelonVertically Integrated Utilities⚠️ Emerging Bear−5.0%+1.2%
AEPAmerican Electric PowerVertically Integrated Utilities⚠️ Emerging Bear−1.4%+14.5%
DDominion EnergyVertically Integrated Utilities🟢 Cont. Bull−6.0%+9.5%
DUKDuke EnergyVertically Integrated Utilities⚠️ Emerging Bear−4.1%−0.4%
EDConsolidated EdisonVertically Integrated Utilities🟢 Cont. Bull−1.5%+11.8%
ESEversource EnergyVertically Integrated Utilities🟢 Cont. Bull−4.9%+7.8%
NEENextEra EnergyVertically Integrated Utilities⚠️ Emerging Bear−4.3%+16.5%
PEGPublic Service Enterprise Group IncorporatedVertically Integrated Utilities⚠️ Emerging Bear−4.4%−11.0%
SOThe SouthernVertically Integrated Utilities⚠️ Emerging Bear−5.9%−4.0%
WECWEC EnergyVertically Integrated Utilities⚠️ Emerging Bear−4.3%−3.1%

12-month price & trend

PPL
PPL
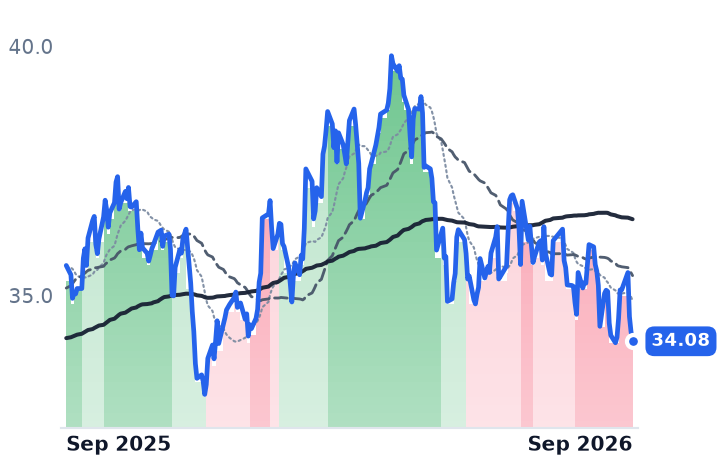
34.08
−0.19 (−0.57%)
vs. prior close
Price20d50d150d
PPL 12-month price
Transmission & Distribution Only
NGG
National Grid
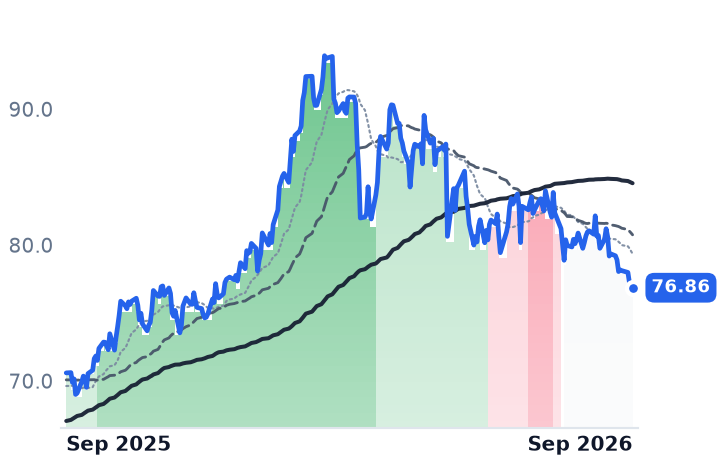
76.86
+0.18 (+0.23%)
vs. prior close
Price20d50d150d
NGG 12-month price
Transmission & Distribution Only
EXC
Exelon
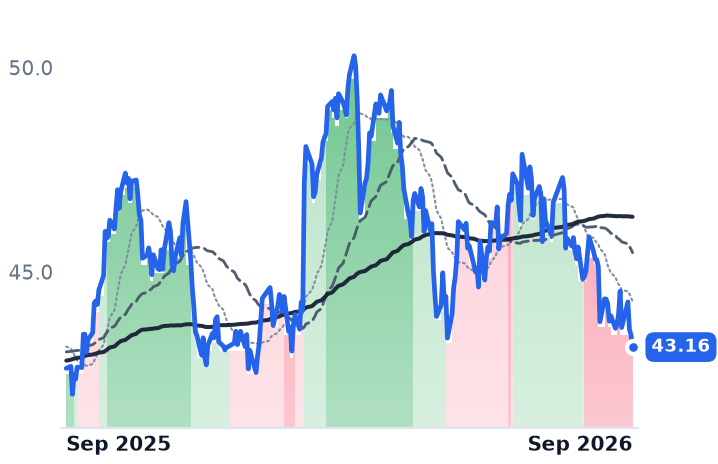
43.16
−0.30 (−0.69%)
vs. prior close
Price20d50d150d
EXC 12-month price
Vertically Integrated Utilities
TickerMkt capP/EP/E fwdP/SP/S fwdP/GPP/GP fwdEV/EBITDAFCF yld
PPL$25.6B27.1x17.5x3.6x2.6x10.5x7.6x13.7x1.0%
NGG$77.3B17.1x16.8x3.2x3.9x5.1x6.1x13.3x-6.6%
EXC$44.5B15.8x15.1x1.8x1.7x7.2x7.1x10.5x-4.3%
AEP
American Electric Power
123
−0.38 (−0.31%)
vs. prior close
Price20d50d150d
AEP 12-month price
Vertically Integrated Utilities
D
Dominion Energy
64.36
−0.62 (−0.95%)
vs. prior close
Price20d50d150d
D 12-month price
Vertically Integrated Utilities
DUK
Duke Energy
119
−0.07 (−0.06%)
vs. prior close
Price20d50d150d
DUK 12-month price
Vertically Integrated Utilities
TickerMkt capP/EP/E fwdP/SP/S fwdP/GPP/GP fwdEV/EBITDAFCF yld
AEP$67.8B21.4x19.5x3.0x2.9x6.1x5.9x14.1x13.2%
D$57.4B22.6x18.2x3.1x3.1x6.4x6.4x15.0x-11.9%
DUK$93.7B18.1x17.9x2.8x2.8x4.1x4.1x11.4x1.6%
ED
Consolidated Edison
106
−0.91 (−0.85%)
vs. prior close
Price20d50d150d
ED 12-month price
Vertically Integrated Utilities
ES
Eversource Energy
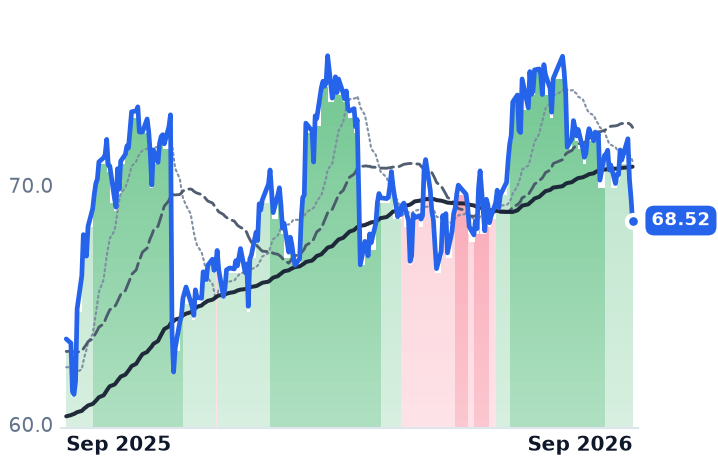
68.52
−0.95 (−1.37%)
vs. prior close
Price20d50d150d
ES 12-month price
Vertically Integrated Utilities
NEE
NextEra Energy
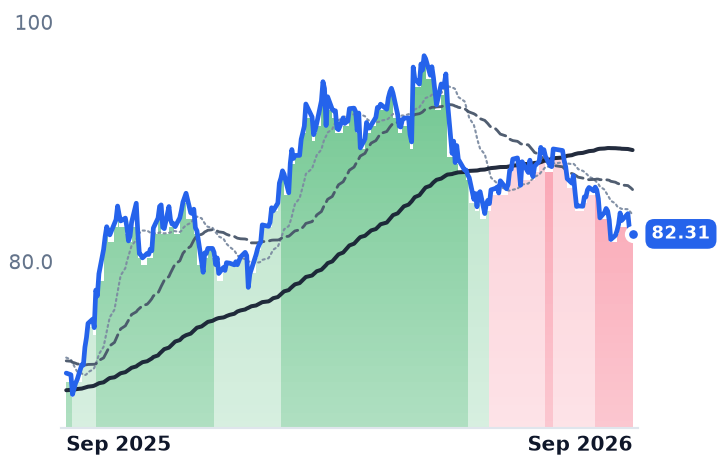
82.31
−0.01 (−0.01%)
vs. prior close
Price20d50d150d
NEE 12-month price
Vertically Integrated Utilities
TickerMkt capP/EP/E fwdP/SP/S fwdP/GPP/GP fwdEV/EBITDAFCF yld
ED$38.8B17.7x17.3x2.3x2.2x3.5x3.4x9.4x7.2%
ES$25.3B14.4x14.4x1.8x1.9x4.5x4.7x10.2x0.9%
NEE$172.8B18.5x20.6x6.0x5.6x8.3x7.8x15.8x-5.9%
PEG
Public Service Enterprise Group Incorporated
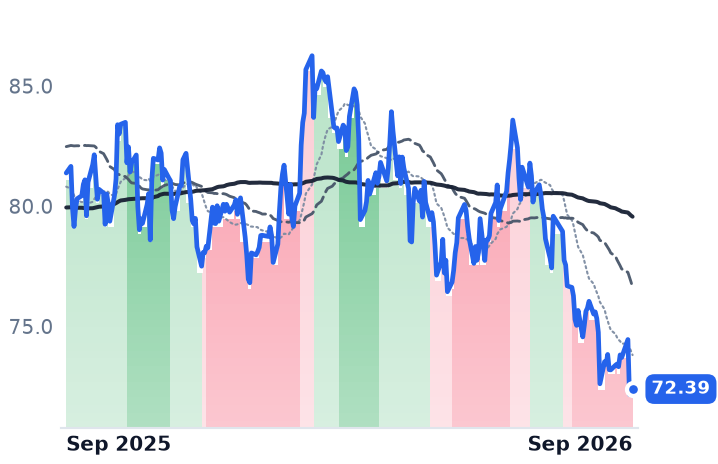
72.39
−0.05 (−0.07%)
vs. prior close
Price20d50d150d
PEG 12-month price
Vertically Integrated Utilities
SO
The Southern
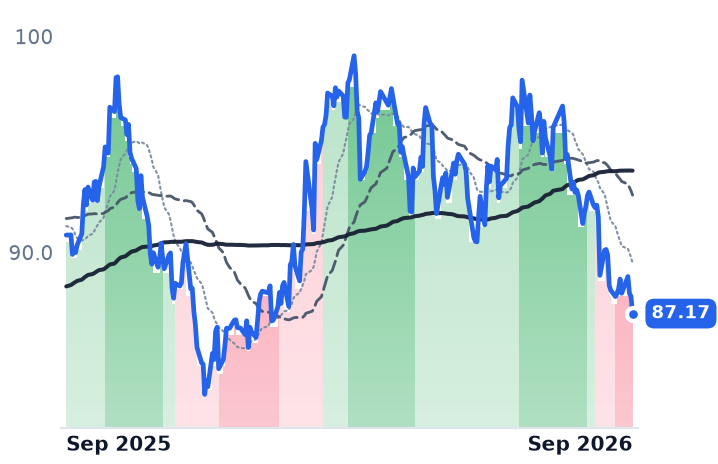
87.17
−0.79 (−0.90%)
vs. prior close
Price20d50d150d
SO 12-month price
Vertically Integrated Utilities
WEC
WEC Energy
105
−0.08 (−0.08%)
vs. prior close
Price20d50d150d
WEC 12-month price
Vertically Integrated Utilities
TickerMkt capP/EP/E fwdP/SP/S fwdP/GPP/GP fwdEV/EBITDAFCF yld
PEG$37.7B18.7x17.3x3.0x3.0x3.5x3.5x14.2x5.3%
SO$106.6B22.2x20.2x3.5x3.5x8.1x8.0x12.7x2.4%
WEC$35.6B21.7x19.5x3.5x3.5x6.3x6.3x14.3x-3.1%

Consensus projections

TickerFY2026EFY2027EFY2028E
PPLRevenue+10.9%+5.8%+5.4%
EPS+7.7%+8.7%+8.5%
NGGRevenue−6.3%+0.4%+9.1%
EPS+8.9%+14.8%+8.9%
EXCRevenue+5.1%+2.9%+3.4%
EPS+5.5%+6.3%+7.3%
AEPRevenue+9.5%+5.9%+7.6%
EPS+7.9%+7.6%+10.6%
DRevenue+13.7%+6.5%+5.8%
EPS+5.0%+6.3%+7.0%
DUKRevenue+5.8%+4.6%+4.2%
EPS+6.3%+6.9%+7.0%
EDRevenue+6.9%+4.2%+3.9%
EPS+7.3%+6.2%+6.5%
ESRevenue+4.6%+3.5%+6.6%
EPS−1.4%+5.6%+6.2%
NEERevenue+9.4%+9.7%+8.9%
EPS+9.0%+9.0%+8.5%
PEGRevenue+6.5%+3.5%+4.9%
EPS+8.1%+7.0%+7.7%
SORevenue+7.7%+5.5%+6.1%
EPS+6.8%+7.5%+9.2%
WECRevenue+8.0%+5.0%+7.5%
EPS+6.6%+7.2%+8.2%

Forward fiscal years only. Blank means no analyst coverage for that year.

PPL told investors on August 7 that the advanced-stage data-center pipeline at its Pennsylvania utility had reached 31.8 gigawatts, its tenth consecutive quarterly increase. The same disclosure carried the number that decides what any of it is worth: a little over 11 gigawatts is covered by signed electric service agreements, with more than 6.5 gigawatts under construction, and the load management expects to be actually ramped by 2031 is roughly 2 gigawatts.

PPL, which delivers electricity and gas to about 3.6 million customers in Pennsylvania, Kentucky and Rhode Island, is paid for capital rather than for electrons. Its profit is an allowed return on a rate base a regulator has agreed to let it recover, so a gigawatt sitting in an interconnection queue earns nothing until wires are built and rolled into rates. The distance between the advertised queue and the signed, building, ramping load is the distance between a growth story and a capital bill that has to be paid up front — and this year PPL agreed to pay 7% for part of it.

What actually converts

Kentucky shows the funnel at smaller scale. PPL's economic-development pipeline there grew to 13.7 gigawatts, 11.6 of it data centers, while signed reimbursement agreements totalled 1.3 gigawatts, up from 900 megawatts a quarter earlier; the company's own probability-weighted expectation is 3.7 gigawatts of new load by 2032. What is signed is contractually hard: the Pennsylvania large-load tariff requires ten-year minimum terms, at least 80% guaranteed capacity payments and material termination fees.

Exelon, the purest wires-only comparable in the group since it spun off Constellation, made the same cut explicit on its July 30 call, trimming its pipeline from 43 to 36 gigawatts, of which 4 gigawatts carries signed transmission security agreements backed by $1bn of collateral and 25 gigawatts remains under study. Its $41bn capital plan through 2029 was left unchanged — confirmation that no speculative load was ever in the spending. Exelon trades at 15.1x forward earnings and 1.49x book.

What the capital costs

PPL reiterated a $23bn plan through 2029 aimed at rate-base growth above 10% a year, funded roughly half from operating cash flow net of dividends, about 40% from utility debt and some $3bn from equity, around $2bn of it still to be issued. On February 23 it priced $1bn of equity units paying total distributions of 7.00% a year, settling into stock by February 2029 at a $37.2606 reference price — above the $34.08 close. Kentucky regulators, meanwhile, set the allowed return on equity at 9.775%, below the 9.90% requested, and declined the proposed earnings-sharing mechanism. Diluted shares are already up 2.0% year over year, and trailing free-cash-flow yield is 1.02%.

The regulatory news was otherwise good. Pennsylvania approved a $275m annual distribution increase effective July 1, the first since 2016, alongside $233m granted in Kentucky. June-quarter operating income rose 17.0% on revenue up 4.2%, margin widening to 22.5%, and guidance of $1.90–$1.98 was reaffirmed. The shares are down 9.5% over six months and trade at 17.5x that guidance midpoint and 2.30x book.

The same model, a different regulator

National Grid is the wires-and-pipes version with no generation at all, and its numbers rhyme. Ofgem's December 4 final determination set a real allowed cost of equity of 6.12% to March 2031 and lifted the baseline spending allowance to £4.9bn, still 14% short of the £5.7bn requested. The company accepted on March 2 and committed to at least £70bn of investment. "National Grid is embarking on the largest investment programme in our history," chief executive Zoë Yujnovich said on May 14. Underlying earnings per share rose 8% at constant currency and assets grew 10.9%, but net debt rose 7% to £44.2bn and free cash outflow widened to £2.1bn; the share count is 23% higher than two years ago after the 2024 rights issue. The American depositary shares, down 14.3% in six months to 1.43x book, have given back the entire re-rating they gained between the Ofgem ruling and its acceptance.

The verdict

Most of both declines is not about data centers. Twelve US regulated electrics fell a median of roughly 3.6% over the past thirty days, Southern and Dominion worse than either of these two, with the 30-year Treasury at 5.36% and the 30-year gilt at 5.89% on September 1, its highest since March 1998 — a discount rate that competes directly with National Grid's 6.12% allowed real return. That is duration being repriced across a whole sector, and the operating results at both companies argue against reading it as demand doubt.

What is company-specific is narrower and sharper. PPL remains the most expensive of these three per dollar of book equity while funding rate-base growth with 7% money against a sub-10% allowed return, and while its headline gigawatt number converts to ramped load at about one part in sixteen. It is also not purely a wires business: it owns Kentucky generation, is expected to file for a further $3.5–4bn of it, and holds 51% of Invitium Energy, a Blackstone venture with more than 5 gigawatts of gas turbines in the PJM queue — capital outside the rate base, earning no allowed return before 2030.

The February equity units settle into stock in 2029 whatever the queue looks like then. The capital goes in now; the load has five more years to show up.

Dell's Data-Center Profit More Than Tripled to $4.8bn; HPE Now Reprices Booked Orders

Hypothesis Opus 5 · Research Opus 5 · Writing Opus 5 · Prompt v1.6

Server assemblers were supposed to be the victims of the memory shock. Both of the big American ones came out of it with fatter margins than they went in.

Dell's group gross margin recovered to 20.9% in the July quarter from 17.8% three months earlier, and its Infrastructure Solutions Group earned a record operating profit at a 15% margin, 6.2 percentage points better than a year ago. Hewlett Packard Enterprise posted a record 40.1% gross margin after amending its quoting terms so that a booked order can be repriced for component-cost increases between quote and shipment. Contract DRAM roughly doubled in the first quarter of 2026; both companies repriced faster.

The unresolved part: the 11 September jump in both stocks followed Oracle's capital-expenditure numbers rather than their own, and HPE's management says the record margin moderates from here.

DELLHPEORCLSMCIANETCSCONVDAMUWDCSTXLRCXNTAPSANMCLSFLEXMemory Cost Pass-ThroughDRAM & NAND PricingAI Server BacklogEnterprise Networking MixHyperscaler CapexServer & Storage Margins
TickerCompanySegmentTrend · 13mo30D1Y
The subject · what this brief is about
DELLDell TechnologiesEnterprise Storage & Software🟢 Cont. Bull+14.7%+358.7%
HPEHewlett Packard EnterpriseEnterprise Storage & Software🟢 Cont. Bull+3.8%+155.6%
Compared against · context, not the story
ORCLOracleCloud Infrastructure & Platforms🔴 Cont. Bear−3.8%−48.2%
SMCISuper Micro ComputerServer & Infrastructure Systems🌱 Emerging Bull+2.4%−10.9%
ANETArista NetworksCloud Networking🟢 Cont. Bull−2.0%+43.2%
CSCOCisco SystemsEnterprise Networking Infrastructure🟢 Cont. Bull−1.2%+72.0%
NVDANVIDIAAI & Data Center GPUs🟢 Cont. Bull−3.1%+22.8%
MUMicron TechnologyMemory (DRAM/NAND)🟢 Cont. Bull+0.3%+521.2%
WDCWestern DigitalData Storage Devices🟢 Cont. Bull−9.1%+358.5%
STXSeagate TechnologyData Storage Devices🟢 Cont. Bull−9.4%+326.8%
LRCXLam ResearchSemiconduct Equipment🟢 Cont. Bull−11.5%+156.2%
NTAPNetAppEnterprise Storage & Software🌱 Emerging Bull−2.6%+63.0%
SANMSanminaElectronic Manufacturing Services🟢 Cont. Bull+2.6%+84.6%
CLSCelesticaElectronic Manufacturing Services⚠️ Emerging Bear−4.1%+43.3%
FLEXFlexElectronic Manufacturing Services🟢 Cont. Bull−8.6%+102.1%

12-month price & trend

DELL
Dell Technologies
567
+52.80 (+10.26%)
vs. prior close
Price20d50d150d
DELL 12-month price
Enterprise Storage & Software
HPE
Hewlett Packard Enterprise
62.09
+6.30 (+11.29%)
vs. prior close
Price20d50d150d
HPE 12-month price
Enterprise Storage & Software
ORCL
Oracle
150
−5.77 (−3.70%)
vs. prior close
Price20d50d150d
ORCL 12-month price
Cloud Infrastructure & Platforms
TickerMkt capP/EP/E fwdP/SP/S fwdP/GPP/GP fwdEV/EBITDAFCF yld
DELL$376.7B32.4x21.9x2.5x1.9x12.6x9.8x21.7x2.3%
HPE$82.2B30.9x16.3x2.0x1.8x5.4x4.9x17.0x5.1%
ORCL$433.0B25.3x18.7x6.4x4.8x9.8x7.3x17.4x-5.5%
SMCI
Super Micro Computer
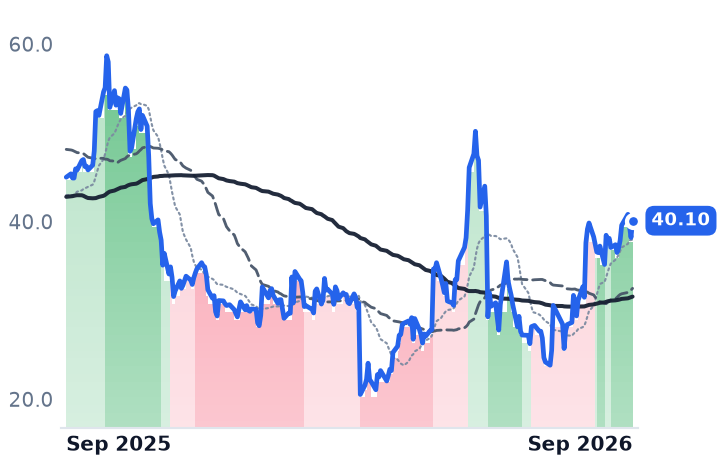
40.10
+1.90 (+4.97%)
vs. prior close
Price20d50d150d
SMCI 12-month price
Server & Infrastructure Systems
ANET
Arista Networks
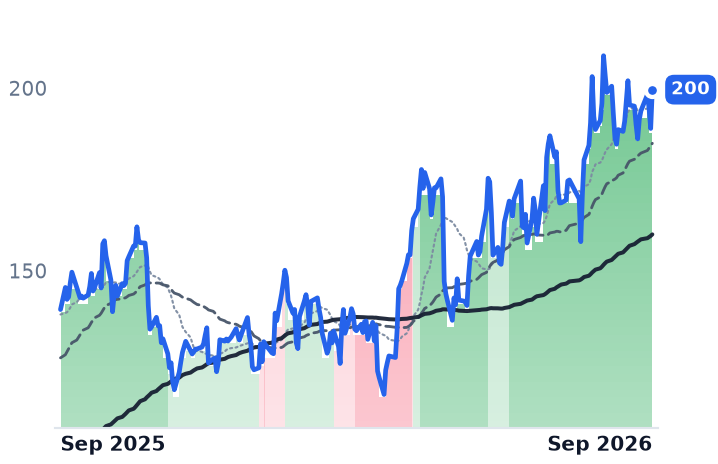
200
+10.63 (+5.63%)
vs. prior close
Price20d50d150d
ANET 12-month price
Cloud Networking
CSCO
Cisco Systems
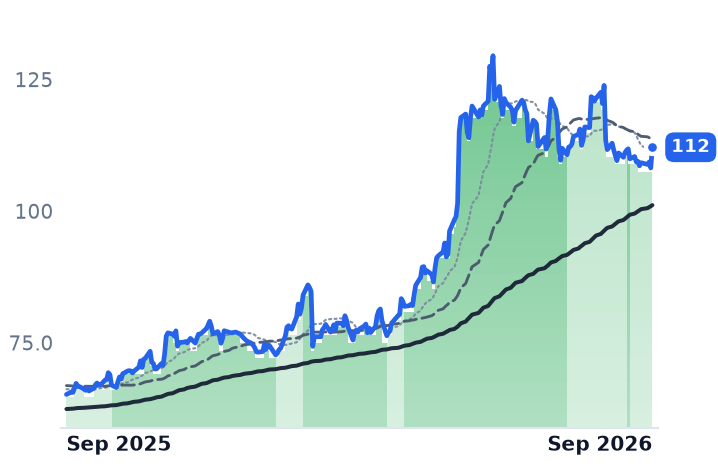
112
+3.93 (+3.63%)
vs. prior close
Price20d50d150d
CSCO 12-month price
Enterprise Networking Infrastructure
TickerMkt capP/EP/E fwdP/SP/S fwdP/GPP/GP fwdEV/EBITDAFCF yld
SMCI$24.1B10.2x8.6x0.6x0.4x5.7x3.3x7.7x-28.9%
ANET$237.5B58.8x45.9x22.5x18.7x35.8x29.8x46.1x2.2%
CSCO$442.9B33.4x21.9x7.0x6.1x10.8x9.4x23.2x3.1%
NVDA
NVIDIA
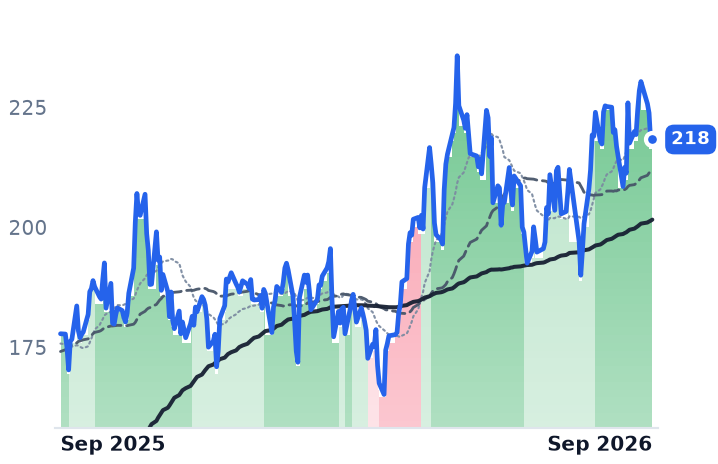
218
+0.45 (+0.21%)
vs. prior close
Price20d50d150d
NVDA 12-month price
AI & Data Center GPUs
MU
Micron Technology
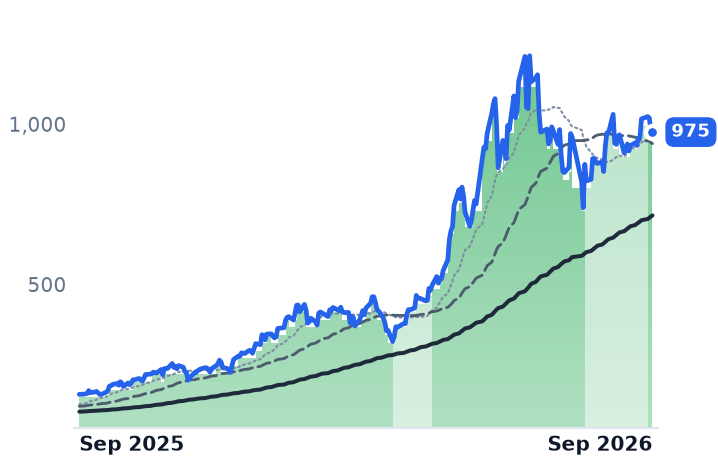
975
−0.40 (−0.04%)
vs. prior close
Price20d50d150d
MU 12-month price
Memory (DRAM/NAND)
WDC
Western Digital
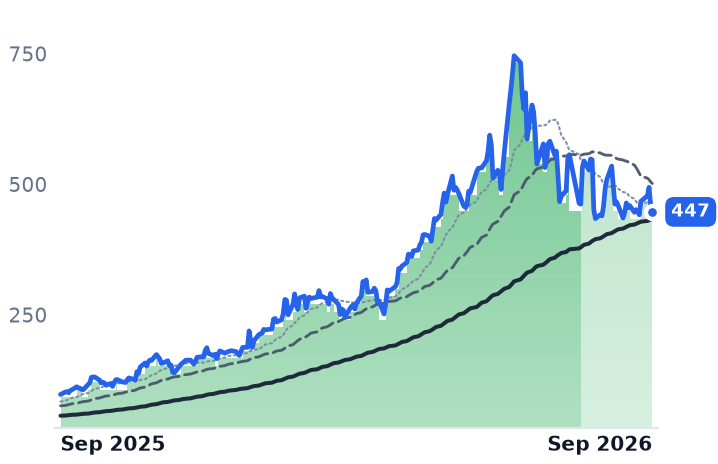
447
−12.28 (−2.67%)
vs. prior close
Price20d50d150d
WDC 12-month price
Data Storage Devices
TickerMkt capP/EP/E fwdP/SP/S fwdP/GPP/GP fwdEV/EBITDAFCF yld
NVDA$5.5T34.3x25.0x21.5x13.9x29.0x18.7x28.3x2.2%
MU$1.0T19.9x12.2x11.2x7.8x15.4x10.7x14.5x2.6%
WDC$166.1B25.6x48.3x14.1x12.9x31.1x28.4x31.1x1.7%
STX
Seagate Technology
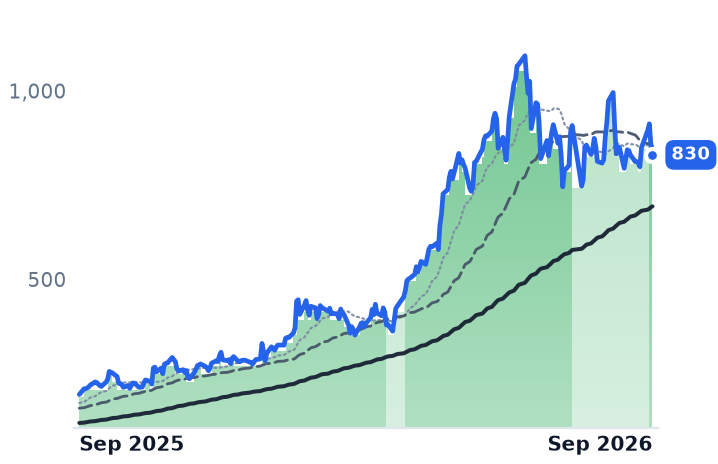
830
−25.66 (−3.00%)
vs. prior close
Price20d50d150d
STX 12-month price
Data Storage Devices
LRCX
Lam Research
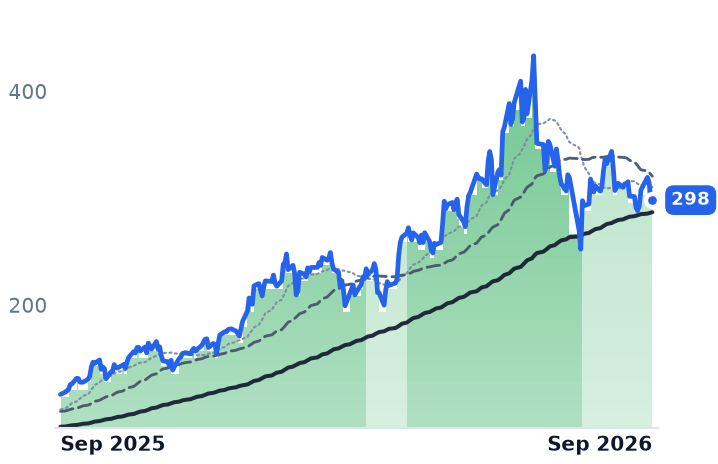
298
−1.50 (−0.50%)
vs. prior close
Price20d50d150d
LRCX 12-month price
Semiconduct Equipment
NTAP
NetApp
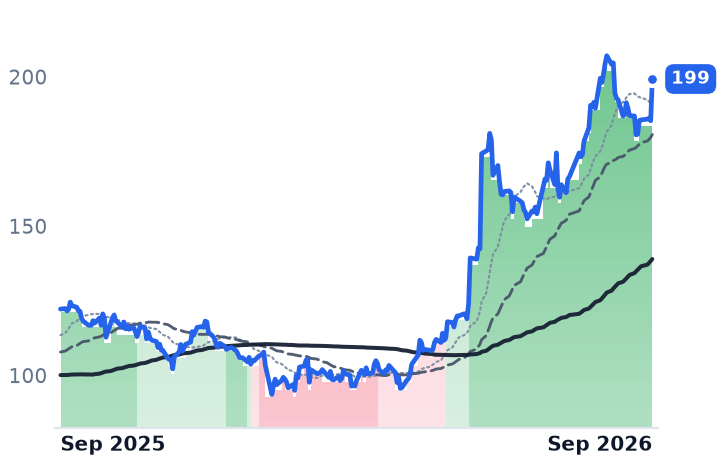
199
+13.97 (+7.54%)
vs. prior close
Price20d50d150d
NTAP 12-month price
Enterprise Storage & Software
TickerMkt capP/EP/E fwdP/SP/S fwdP/GPP/GP fwdEV/EBITDAFCF yld
STX$178.4B73.9x53.5x16.2x14.8x39.0x35.7x53.6x1.5%
LRCX$430.0B59.4x36.7x18.5x12.4x36.7x24.6x49.2x1.1%
NTAP$35.9B28.5x20.3x5.2x4.8x7.3x6.7x18.7x5.2%
SANM
Sanmina
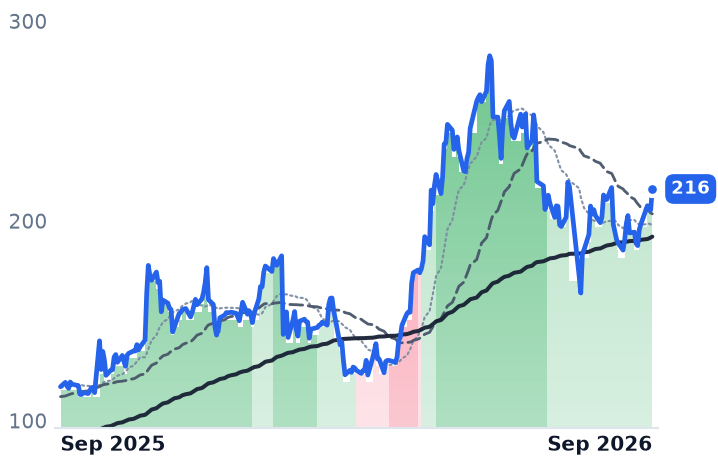
216
+10.48 (+5.10%)
vs. prior close
Price20d50d150d
SANM 12-month price
Electronic Manufacturing Services
CLS
Celestica
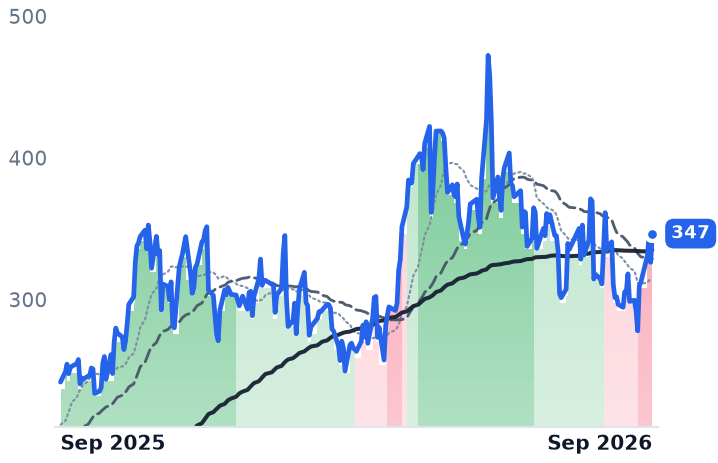
347
+20.38 (+6.25%)
vs. prior close
Price20d50d150d
CLS 12-month price
Electronic Manufacturing Services
FLEX
Flex
116
+6.63 (+6.07%)
vs. prior close
Price20d50d150d
FLEX 12-month price
Electronic Manufacturing Services
TickerMkt capP/EP/E fwdP/SP/S fwdP/GPP/GP fwdEV/EBITDAFCF yld
SANM$10.1B33.1x15.6x0.8x0.7x8.8x7.9x16.0x5.9%
CLS$33.6B30.1x25.9x2.2x1.6x18.6x14.0x22.5x1.5%
FLEX$39.5B41.3x22.7x1.3x1.1x14.2x12.0x22.4x2.7%

Consensus projections

TickerFY2026EFY2027EFY2028E
DELLRevenue+16.2%+74.0%+21.0%
EPS+27.3%+159.6%+19.4%
HPERevenue+34.6%+16.4%+7.3%
EPS+100.3%+19.9%+11.6%
ORCLRevenue+17.8%+33.2%+45.5%
EPS+25.3%+7.6%+35.6%
SMCIRevenue+77.7%+69.8%+17.7%
EPS+33.5%+54.8%+23.3%
ANETRevenue+42.4%+30.0%+23.9%
EPS+42.4%+27.2%+22.5%
CSCORevenue+11.1%+16.2%+7.1%
EPS+12.9%+19.7%+9.2%
NVDARevenue+65.1%+84.2%+43.2%
EPS+59.0%+91.7%+42.0%
MURevenue+248.0%+92.8%+11.4%
EPS+804.9%+111.2%+7.9%
WDCRevenue+36.9%+37.2%+26.5%
EPS+106.2%+72.8%+48.0%
STXRevenue+32.7%+35.9%+24.9%
EPS+86.9%+77.9%+48.0%
LRCXRevenue+27.0%+49.0%+18.6%
EPS+41.9%+64.7%+25.5%
NTAPRevenue+4.3%+10.1%+5.7%
EPS+10.4%+13.1%+11.5%
SANMRevenue+74.9%+15.8%+11.8%
EPS+103.4%+15.2%+12.7%
CLSRevenue+68.2%+71.8%+32.5%
EPS+89.2%+73.1%+34.7%
FLEXRevenue+6.8%+26.3%+30.0%
EPS+24.2%+44.7%+51.5%

Forward fiscal years only. Blank means no analyst coverage for that year.

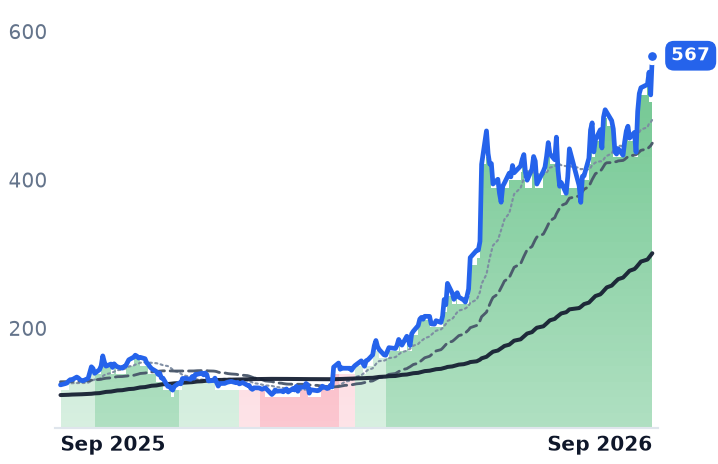
The memory-price shock was supposed to be the thing that broke the companies that bolt other people's silicon into racks. Dell Technologies, which builds servers, storage and networking for data centers under Infrastructure Solutions Group and sells PCs through Client Solutions Group, bought its July-quarter components into a market where conventional contract DRAM prices had risen roughly 93% to 98% in the first quarter of 2026 and a further 58% to 63% in the second. Its gross margin came out of the quarter higher than it went in: 20.9%, against 17.8% in April.

That is the whole question for an assembler. Its earnings are a spread between a dollar figure contracted quarters ago and a bill of materials bought later, and Dell exited July with a record $95bn of AI server backlog priced against components nobody has purchased yet. The evidence from the two prints that preceded this month's rally is that both American integrators have won that argument with their customers — so far.

Dell repriced, and the dollars followed

Infrastructure Solutions Group revenue reached a record $31.8bn, up 89%, with operating income of $4.8bn, up 225% at a 15% margin — 6.2 percentage points better than a year earlier. Group revenue rose 58% to $47bn and operating income 209%. Orders ran far ahead of shipments: $60.9bn of AI server orders booked against $16.4bn recognized. "We exited the quarter with a record $95 billion of AI backlog, and our pipeline continued to grow sequentially and remains multiples of our backlog even after converting $131.7 billion into orders over the past 12 months," Jeff Clarke, Dell's chief operating officer, told investors on September 1.

Dell named DRAM and NAND as its primary bottlenecks and said its raised full-year guidance — $192bn of revenue and $25.50 of earnings per share — reflects supply reconfiguration, including redirecting PC components into infrastructure. Client Solutions Group still grew 20% to $15.0bn, and traditional server and networking revenue rose 122%. Diluted share count fell to 652m from 702m.

HPE made the quoted price provisional

Hewlett Packard Enterprise took the contractual route. "We have amended our quoting terms with a right to reprice existing orders for commodity cost increases between quoting and shipment," chief executive Antonio Neri said, a clause that covers ProLiant servers, Alletra and Nimble storage and GreenLake orders. Gross margin hit a record 40.1% against 28.4% a year earlier, and Neri has said no customer in a round of European meetings called the increases too expensive.

The mix did the rest. "We are at the core becoming a networking company," Neri said on September 2. Networking revenue grew 10% but orders grew 36%, and chief financial officer Marie Myers told investors: "Cumulative networks for AI orders were $2.2 billion, surpassing our FY '26 target. As a result, we are increasing our year-end target to $2.5 billion to $3 billion." The merged Cloud and AI segment did $9bn at a 17% operating margin. Against that, GreenLake is the slow limb — customers up 18% to 52,000, with no run-rate figure given against a $3.5bn target for the year — and the ~$14bn Juniper purchase leaves net leverage at 1.8x plus mandatory convertible preferred stock paying a 7.625% dividend. Management guides the record gross margin to moderate in the fourth quarter and next year as AI systems take more of the mix.

The day that repriced the customer

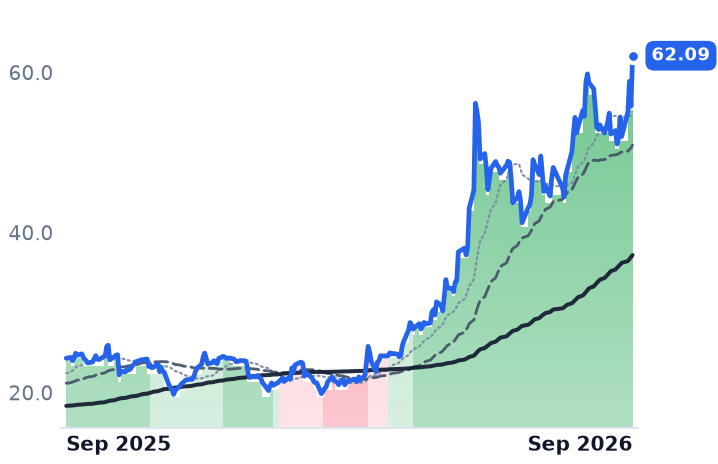
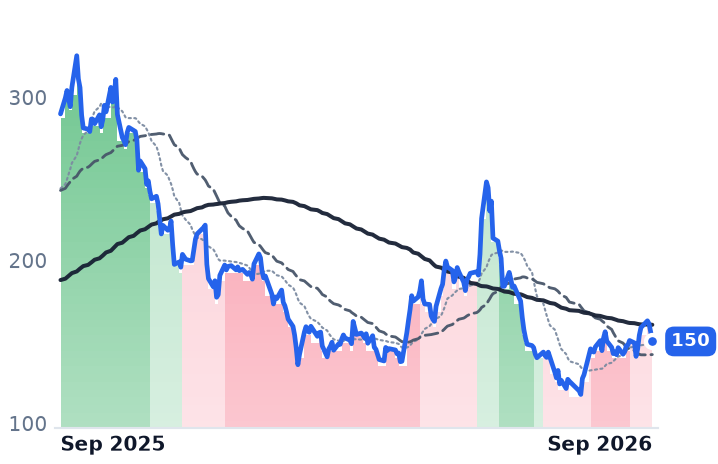
Neither company changed guidance on September 11, when Dell rose 10.3% and HPE 11.3%. The session followed Oracle's quarterly capital expenditure of $28.5bn against $8.5bn a year earlier, with the full-year budget held at $90–95bn. The move was confined to the integrators and the network — Arista gained 5.6%, Super Micro 5.0%, Cisco 3.6% — while the memory and disk makers selling into the same racks did nothing or fell, Micron flat and Western Digital and Seagate down. The buyer was repriced; the bill of materials was not. HPE has a direct claim on that budget: on September 8 the two companies announced a gigawatt-scale deal putting Juniper routing and switching across Oracle's data centers.

What the business earns and what it does not

The margin expansion is earned, and it is the answer to the worry that a fixed-price backlog is a trap. Dell sits at 21.9x forward earnings against 32.4x trailing, barely above the roughly 18x it carried in May at $240, because forward estimates were rebuilt faster than the price rose; consensus has earnings up 160% this year and 19% next. HPE is at 16.3x forward and about 13.6x next year's consensus, against a 10–13x anchor from the spring, and its trailing enterprise value to EBITDA has fallen to 17.0x from 21.2x on September 1 — the new quarter added profit to the denominator while the stock rose.

What neither print settles is who pays for the backlog. Dell's financing arm originated $7.5bn in the quarter against $2.4bn a year earlier, and its principal charge-off rate went to 0.5% from 0.1% — small, but five times larger. Oracle, the customer whose budget moved both stocks, carries $125bn of debt and burned $5.4bn of free cash flow in the quarter while promising tens of billions more of issuance.

The repricing clause protects the seller from its suppliers. It does not protect the seller from a buyer that cannot pay, and the largest order books in this industry are now written against balance sheets that are funding them with debt.

Edwards Won the Medicare Valve-Coverage Change It Requested and Left 2026 Guidance Alone

Hypothesis Opus 5 · Research Opus 5 · Writing Opus 5 · Prompt v1.6

A company that asked Washington to widen the market for its biggest product got exactly that, and told investors nothing had changed. Medicare's finalized coverage rule for transcatheter aortic valve replacement removes hospital procedure-volume requirements, allows a single qualified operator, and extends coverage to patients with severe aortic stenosis who have no symptoms yet.

Edwards Lifesciences, which holds more than 60% of the US market for the procedure and books $1.26bn a quarter from it, said the policy "will take time to implement" and kept its 10-11% sales guidance — already raised twice this year from January's 8-10%. The shares have fallen 9.2% in a month anyway, inside a medtech selloff driven by cyberattacks at Stryker and Boston Scientific rather than by anything happening in cardiac catheterization labs.

EWAORTBSXSYKMDTISRGABTZBHTFXHCAStructural Heart DevicesMedicare Coverage PolicyTAVR Market ExpansionMedtech CyberattacksHospital Procedure VolumesCardiac Device Competition
TickerCompanySegmentTrend · 13mo30D1Y
The subject · what this brief is about
EWEdwards LifesciencesCardiovascular & Structural Heart🟢 Cont. Bull−8.7%+8.8%
AORTArtivionCardiovascular & Structural Heart⚠️ Emerging Bear−11.4%−38.4%
Compared against · context, not the story
BSXBoston ScientificSpinal Surgery & Neuromodulation🔴 Cont. Bear−16.4%−58.2%
SYKStrykerOrthopedic Implants & Trauma🔴 Cont. Bear−19.0%−27.6%
MDTMedtronicSpinal Surgery & Neuromodulation⚠️ Emerging Bear+0.4%−1.0%
ISRGIntuitive SurgicalSurgical Robotics & Minimally Invasive Surgery🔴 Cont. Bear−7.8%−17.9%
ABTAbbott LaboratoriesOther🌱 Emerging Bull−7.7%−22.6%
ZBHZimmer BiometOrthopedic Implants & Trauma🔴 Cont. Bear−4.6%−8.6%
TFXTeleflex IncorporatedIV & Vascular Access🌱 Emerging Bull−3.5%+1.1%
HCAHCA HealthcareHospital Systems⚠️ Emerging Bear+4.5%+5.9%

12-month price & trend

EW
Edwards Lifesciences
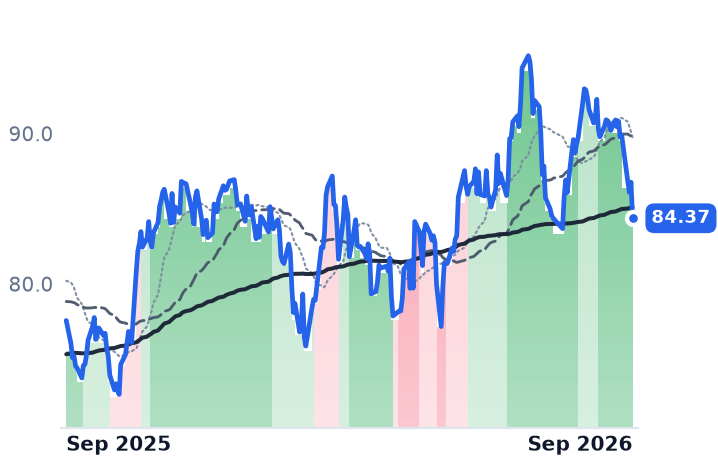
84.37
−2.40 (−2.77%)
vs. prior close
Price20d50d150d
EW 12-month price
Cardiovascular & Structural Heart
AORT
Artivion
25.08
+0.42 (+1.70%)
vs. prior close
Price20d50d150d
AORT 12-month price
Cardiovascular & Structural Heart
BSX
Boston Scientific
42.98
−0.81 (−1.86%)
vs. prior close
Price20d50d150d
BSX 12-month price
Spinal Surgery & Neuromodulation
TickerMkt capP/EP/E fwdP/SP/S fwdP/GPP/GP fwdEV/EBITDAFCF yld
EW$48.6B48.5x28.1x7.5x7.2x9.6x9.2x30.1x3.0%
AORT$1.2Bn/m2.6x2.5x4.1x4.0x27.0x-0.9%
BSX$63.9B17.3x13.1x3.0x3.0x4.3x4.2x13.4x5.7%
SYK
Stryker
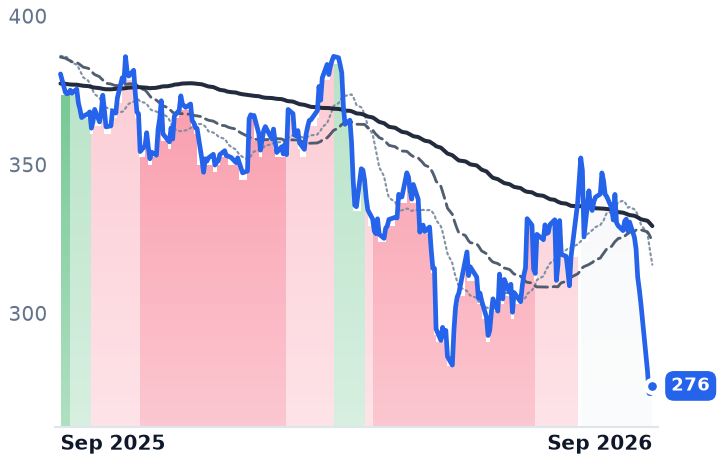
276
+2.59 (+0.95%)
vs. prior close
Price20d50d150d
SYK 12-month price
Orthopedic Implants & Trauma
MDT
Medtronic
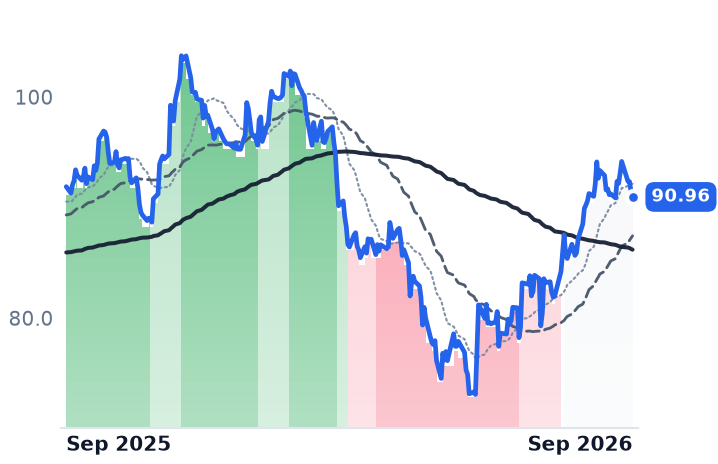
90.96
−0.51 (−0.56%)
vs. prior close
Price20d50d150d
MDT 12-month price
Spinal Surgery & Neuromodulation
ISRG
Intuitive Surgical
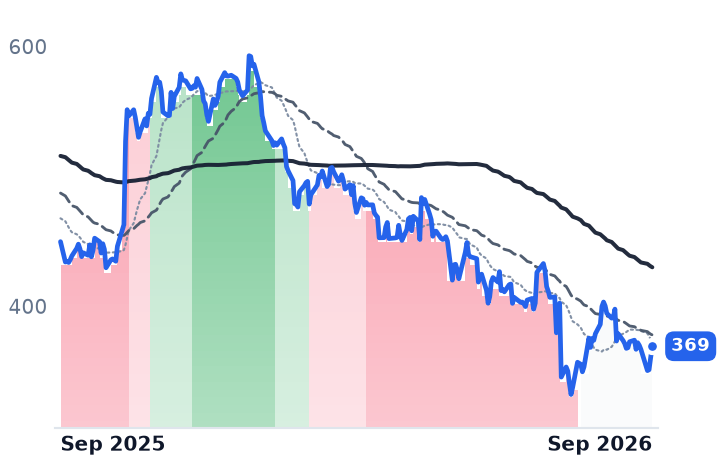
369
+8.60 (+2.39%)
vs. prior close
Price20d50d150d
ISRG 12-month price
Surgical Robotics & Minimally Invasive Surgery
TickerMkt capP/EP/E fwdP/SP/S fwdP/GPP/GP fwdEV/EBITDAFCF yld
SYK$117.6B35.2x20.5x4.7x4.3x7.3x6.8x22.3x3.9%
MDT$116.4B22.2x15.2x3.1x3.0x4.7x4.5x15.1x5.3%
ISRG$149.1B50.2x40.6x14.1x12.8x21.3x19.2x39.1x1.9%
ABT
Abbott Laboratories
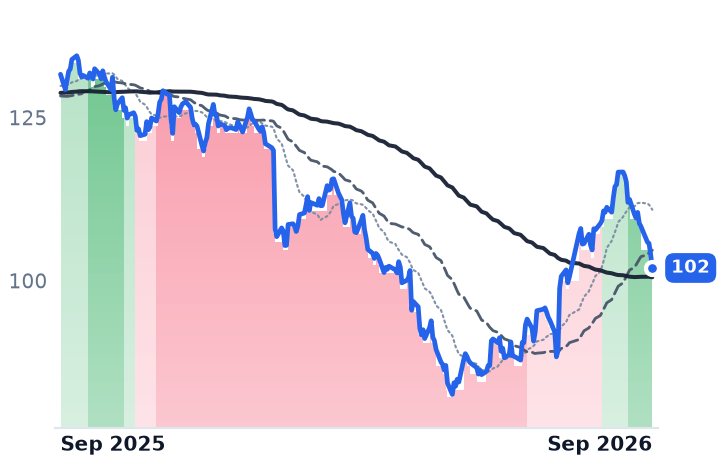
102
−2.06 (−1.98%)
vs. prior close
Price20d50d150d
ABT 12-month price
Other
ZBH
Zimmer Biomet
93.49
+1.47 (+1.60%)
vs. prior close
Price20d50d150d
ZBH 12-month price
Orthopedic Implants & Trauma
TFX
Teleflex Incorporated
131
−1.01 (−0.77%)
vs. prior close
Price20d50d150d
TFX 12-month price
IV & Vascular Access
TickerMkt capP/EP/E fwdP/SP/S fwdP/GPP/GP fwdEV/EBITDAFCF yld
ABT$147.1B23.5x15.4x3.3x2.9x5.8x5.2x16.1x5.0%
ZBH$16.2B21.4x9.9x1.9x1.9x2.7x2.7x10.5x11.3%
TFX$5.8Bn/m18.3x2.2x2.6x4.2x4.8xn/m6.7%
HCA
HCA Healthcare
427
+8.05 (+1.92%)
vs. prior close
Price20d50d150d
HCA 12-month price
Hospital Systems
TickerMkt capP/EP/E fwdP/SP/S fwdP/GPP/GP fwdEV/EBITDAFCF yld
HCA$93.8B14.1x14.0x1.2x1.2x3.5x3.4x9.1x8.4%

Consensus projections

TickerFY2026EFY2027EFY2028E
EWRevenue+12.0%+9.6%+10.5%
EPS+15.6%+12.8%+12.1%
AORTRevenue+11.0%+10.8%+11.9%
EPS−226.2%−206.9%+60.2%
BSXRevenue+6.2%+4.4%+7.0%
EPS+8.3%+3.9%+10.8%
SYKRevenue+8.8%+8.6%+8.1%
EPS+10.4%+11.8%+11.5%
MDTRevenue+7.9%+8.0%+3.5%
EPS+1.1%+8.3%+7.1%
ISRGRevenue+17.5%+13.5%+13.7%
EPS+19.6%+13.4%+13.0%
ABTRevenue+12.8%+9.0%+7.3%
EPS+6.2%+10.7%+11.6%
ZBHRevenue+4.2%+3.6%+3.8%
EPS+3.7%+6.3%+7.1%
TFXRevenue−31.2%+4.3%+4.6%
EPS−48.6%+52.0%+10.6%
HCARevenue+3.7%+4.8%+5.4%
EPS+9.2%+10.0%+13.0%

Forward fiscal years only. Blank means no analyst coverage for that year.

On September 10 the Centers for Medicare and Medicaid Services finalized a national coverage rule for transcatheter aortic valve replacement — the procedure in which a new heart valve is threaded up through an artery instead of implanted in open surgery. The reconsideration had been formally requested by Edwards Lifesciences in July. The company won it, and then told investors to change nothing.

That is worth pausing on, because the rule loosened the exact constraint the industry has spent a decade complaining about. The final policy removes hospital facility-level procedural-volume requirements, replacing them with expectations on infrastructure and quality improvement, and recognizes that the procedure may be performed by a single qualified operator. It also drops the evidence-development condition for symptomatic severe aortic stenosis and extends Medicare coverage to asymptomatic patients — resting on Edwards' own Early TAVR trial, which the Food and Drug Administration used to approve an expanded SAPIEN 3 label in May 2026. More hospitals may do it, and more patients qualify.

The company's own answer

Edwards called the decision "an important step toward improving and expanding patient access," then added the sentence that explains the flat share price: the policy "will take time to implement," and the company "has confidence in its previously communicated financial guidance for 2026." Longer-term numbers wait for a December investor conference.

Those previously communicated numbers are not modest. Edwards, which sells the SAPIEN valve platform plus mitral and tricuspid devices and a legacy surgical valve line to hospitals worldwide, has raised 2026 guidance twice: January's 8-10% sales growth became 9-11% in April and 10-11% in July, with aortic valve growth guidance going from 6-8% to 8-9% and the transcatheter mitral and tricuspid line lifted to $760-780m. Second-quarter revenue was $1.741bn, up 13.6%, at a 77.6% gross margin, and operating income grew 20.6% — faster than sales. Aortic valve sales reached $1.26bn, up 10.5% in constant currency; the mitral and tricuspid business grew 44.8% to $195.9m. Chief executive Bernard Zovighian told investors on the July 23 call that "years of technology advancement and world-class evidence" had positioned SAPIEN as "the benchmark TAVR platform globally." Edwards holds more than 60% of the US market.

What actually moved the shares

The month's decline came from elsewhere in the device complex. On September 8 Stryker fell 7.4% after its finance chief told the Wells Fargo Healthcare Conference that supply disruption from a March cyberattack on its peripheral-vascular manufacturing would persist into the fourth quarter. Boston Scientific fell 4.6%, having disclosed that an August 25 cyberattack disrupted global ordering and shipping badly enough that it will miss third-quarter and full-year sales and earnings expectations. Edwards fell 3.5% alongside them. Over thirty days Stryker is down 20.0% and Boston Scientific 16.3%, against Edwards' 9.2%; Medtronic, the direct rival in aortic valves, is up slightly. When HCA Healthcare flagged soft surgical volumes in July, the weakness was in orthopedics and spine among under-65 patients — cardiovascular was the category analysts explicitly spared.

Artivion, the other name that looks broken here, is a different business and a different story. It sells On-X mechanical valves, aortic stent grafts, surgical adhesive and cryopreserved human tissue — open surgery and endovascular, nothing transcatheter. Its 40.7% twelve-month loss is anchored on one session, May 8, when it fell 28.3% after cutting guidance. The second quarter was better: revenue of $125.8m, stent grafts up 12% and On-X up 18% in constant currency. But operating income swung to a loss of $8.4m from a profit of $8.4m, gross margin slipped to 64.0%, and net leverage sits at 3.1x after the Endospan purchase. Chief executive Pat Mackin described the bottleneck on the August 6 call as procurement rather than patients: accounts with ethics-board and value-committee approval "waiting on a PO because this is not normal that they have to write a check for $100,000." With earnings negative, the usable anchor is price against gross profit, at 4.11x trailing — a de-rating the income statement earned.

The verdict

There is no procedure-volume signal running through structural heart. There are two cyberattacks, one small company's balance sheet, and one large company whose regulatory gate just widened while its growth accelerated. Edwards at 28.1x forward earnings is roughly double Medtronic's 15.2x and Boston Scientific's 13.1x, for roughly double their forward revenue growth — an expensive share that has given back a slice of its premium, not a business in trouble.

What the September 10 rule is worth in dollars, nobody has said — including the company that asked for it. Edwards put a number on everything else this year and deferred this one to December.

Texas Roadhouse Met 7% Beef Inflation With a 1.9% Menu Increase and Won 3% More Guests

Hypothesis Opus 5 · Research Opus 5 · Writing Opus 5 · Prompt v1.6

A steakhouse chain posting the best sales volumes of its 33-year history just reported lower operating profit than a year ago, and it did so on purpose. Texas Roadhouse reviews menu prices twice a year and deliberately prices below its costs to protect traffic — so food and beverage cost climbed to 35.4% of restaurant sales from 34.0%, and restaurant-level margin fell to 16.4%.

It worked on the top line: same-store sales rose 6.2%, half of that from guest counts, while the wider US restaurant industry lost 4% of its customers in July. Bloomin' Brands ran the opposite play — roughly 4.5% pricing against 4.5–5.5% inflation — and raised guidance while Outback traffic fell.

The cost shock is not over: the cattle herd is at a multi-decade low and only 40% of Texas Roadhouse's fourth-quarter basket is locked.

TXRHBLMNEATDRICAKECBRLSHAKSPYBeef Cost InflationCattle Herd CycleMenu Pricing StrategyCasual Dining TrafficRestaurant-Level Margins
TickerCompanySegmentTrend · 13mo30D1Y
The subject · what this brief is about
TXRHTexas RoadhouseCasual Dining - Steakhouse & Seafood🌱 Emerging Bull−13.9%+9.6%
BLMNBloomin' BrandsCasual Dining - Steakhouse & Seafood🌱 Emerging Bull−21.0%+28.2%
Compared against · context, not the story
EATBrinker InternationalCasual Dining - Full Service🌱 Emerging Bull−11.1%+38.3%
DRIDarden RestaurantsCasual Dining - Full Service🟢 Cont. Bull−5.8%+1.0%
CAKEThe Cheesecake Factory IncorporatedCasual Dining - Full Service🟢 Cont. Bull−9.2%+84.5%
CBRLCracker Barrel Old Country StoreCasual Dining - Full Service🌱 Emerging Bull−15.7%−1.2%
SHAKShake ShackQuick Service - Burgers & Sandwiches🔴 Cont. Bear−12.7%−36.8%
SPYState Street SPDR S&P 500 ETF TrustAsset Management🟢 Cont. Bull−1.6%+17.2%

12-month price & trend

TXRH
Texas Roadhouse
181
+2.12 (+1.18%)
vs. prior close
Price20d50d150d
TXRH 12-month price
Casual Dining - Steakhouse & Seafood
BLMN
Bloomin' Brands
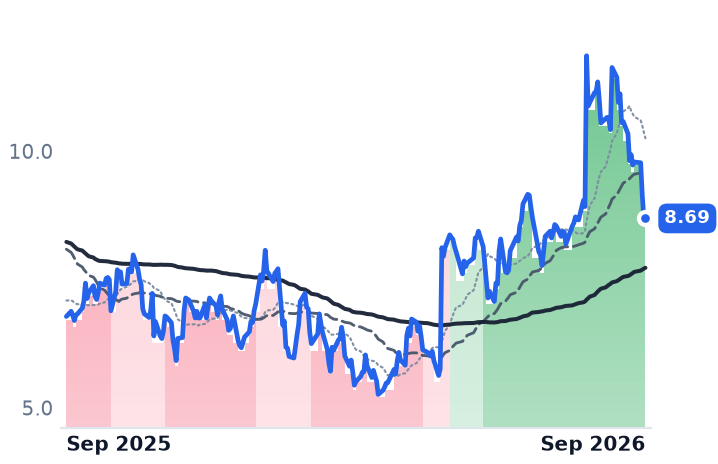
8.69
+0.00 (+0.06%)
vs. prior close
Price20d50d150d
BLMN 12-month price
Casual Dining - Steakhouse & Seafood
EAT
Brinker International
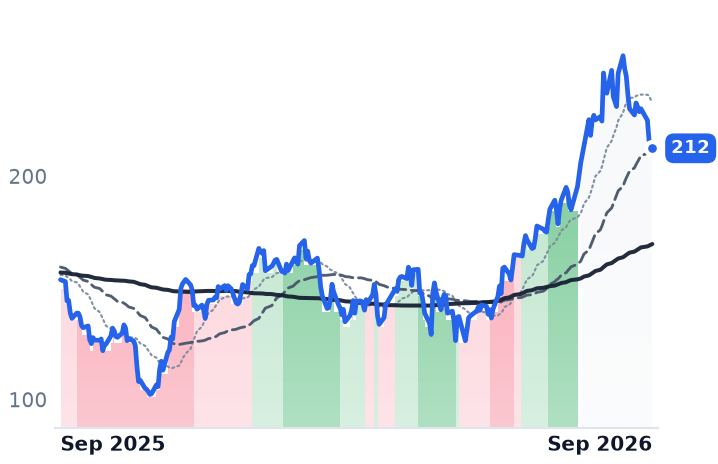
212
+0.34 (+0.16%)
vs. prior close
Price20d50d150d
EAT 12-month price
Casual Dining - Full Service
TickerMkt capP/EP/E fwdP/SP/S fwdP/GPP/GP fwdEV/EBITDAFCF yld
TXRH$11.9B28.9x27.4x1.9x1.8x12.5x11.9x16.7x3.4%
BLMN$744.0M27.2x8.9x0.2x0.2x0.5x0.5x11.1x20.8%
EAT$10.2B21.2x18.9x1.8x1.7x9.4x8.9x14.0x5.5%
DRI
Darden Restaurants
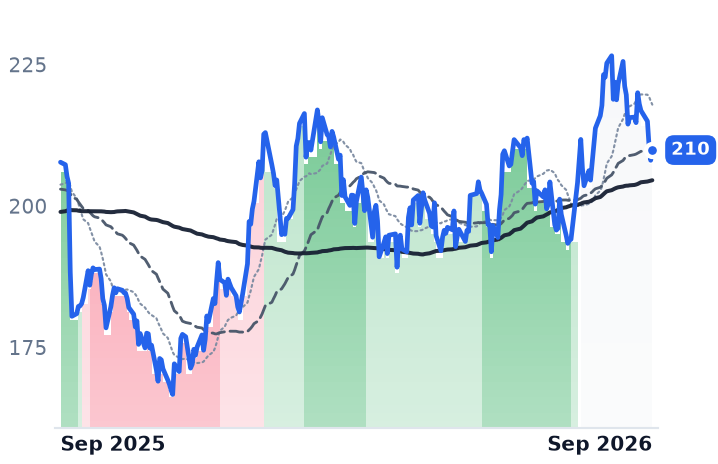
210
+1.81 (+0.87%)
vs. prior close
Price20d50d150d
DRI 12-month price
Casual Dining - Full Service
CAKE
The Cheesecake Factory Incorporated
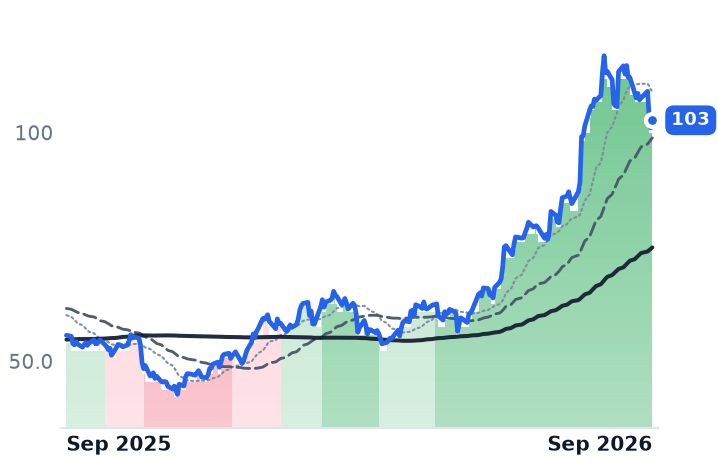
103
+1.68 (+1.66%)
vs. prior close
Price20d50d150d
CAKE 12-month price
Casual Dining - Full Service
CBRL
Cracker Barrel Old Country Store
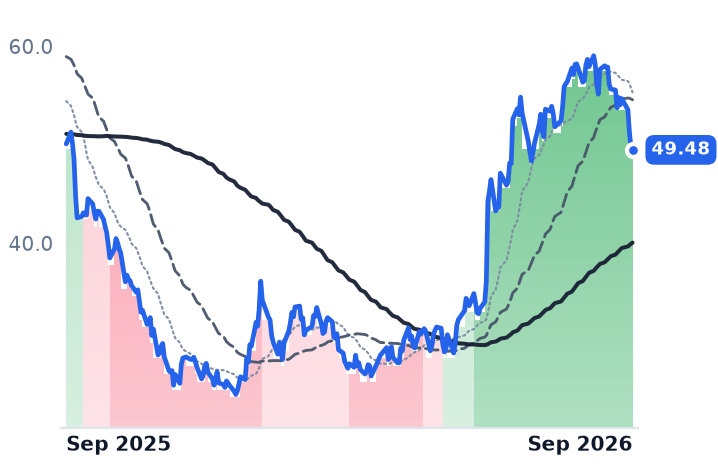
49.48
−0.23 (−0.46%)
vs. prior close
Price20d50d150d
CBRL 12-month price
Casual Dining - Full Service
TickerMkt capP/EP/E fwdP/SP/S fwdP/GPP/GP fwdEV/EBITDAFCF yld
DRI$25.8B21.5x20.0x2.0x1.9x2.8x2.7x13.5x4.3%
CAKE$5.6B29.6x25.4x1.5x1.4x3.1x3.0x23.6x3.7%
CBRL$1.3B49.2x52.6x0.4x0.4x1.1x1.1x14.6x4.6%
SHAK
Shake Shack
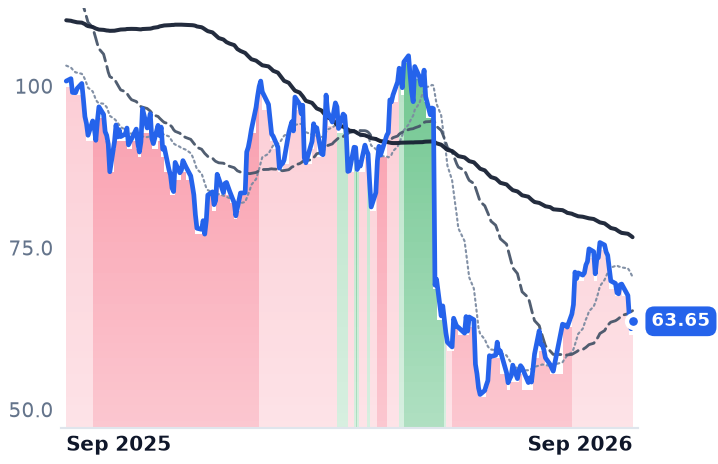
63.65
+1.15 (+1.84%)
vs. prior close
Price20d50d150d
SHAK 12-month price
Quick Service - Burgers & Sandwiches
SPY
State Street SPDR S&P 500 ETF Trust
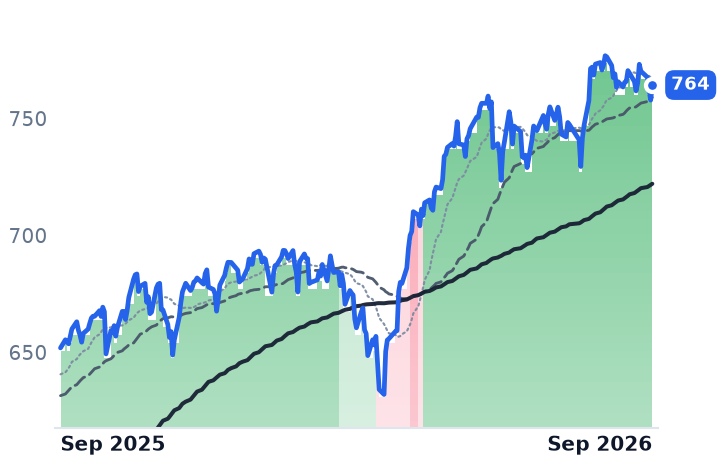
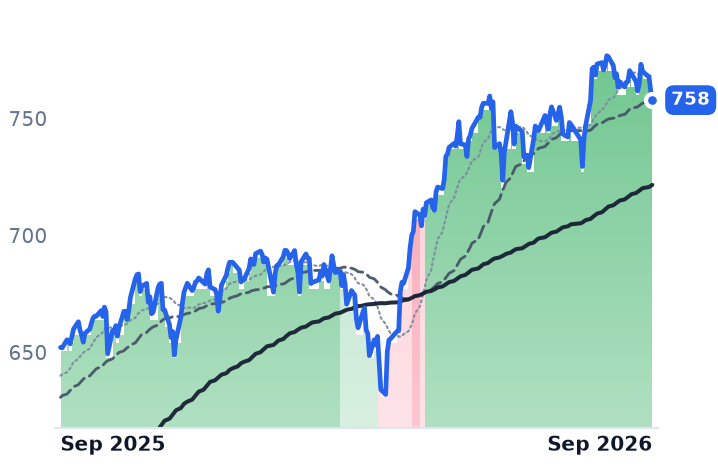
764
+6.45 (+0.85%)
vs. prior close
Price20d50d150d
SPY 12-month price
Asset Management
TickerMkt capP/EP/E fwdP/SP/S fwdP/GPP/GP fwdEV/EBITDAFCF yld
SHAK$2.4B59.1x49.0x1.6x1.5x8.5x7.6x16.8x1.5%
SPY$773.0B

Consensus projections

TickerFY2026EFY2027EFY2028E
TXRHRevenue+11.0%+9.3%+8.6%
EPS+4.7%+18.3%+20.8%
BLMNRevenue+0.6%+1.6%+2.6%
EPS−12.9%+9.8%+17.1%
EATRevenue+8.1%+6.0%+4.2%
EPS+21.2%+16.7%+10.0%
DRIRevenue+9.5%+3.6%+6.0%
EPS+11.5%+6.2%+9.9%
CAKERevenue+7.3%+7.3%+8.4%
EPS+18.7%+10.6%+12.9%
CBRLRevenue−4.9%+2.7%+2.7%
EPS−101.4%−2570.0%+42.1%
SHAKRevenue+14.8%+15.1%+13.2%
EPS−4.4%+29.2%+26.6%

Forward fiscal years only. Blank means no analyst coverage for that year.

Texas Roadhouse served more guests in its June quarter than in any quarter of its 33-year history, and made less money doing it. Average weekly sales per restaurant passed $175,000 for the first time, while operating income fell 2.4% from a year earlier on revenue up 11.1% to $1.68bn.

That gap is a decision, not an accident. The chain — which runs company-owned and franchised steakhouses under the Texas Roadhouse, Bubba's 33 and Jaggers names from Louisville, Kentucky — took a menu price increase of about 1.9% into a quarter that carried 7% commodity inflation. Food and beverage cost rose to 35.4% of restaurant and other sales from 34.0%, and restaurant-level margin slipped 66 basis points to 16.4%. The company's 10-Q for the 26 weeks ended June 30 puts the half-year figures at $1,165.8m of food cost against $3,299.6m of restaurant sales.

"We are not going to be able to price for every beef inflation as of right now, but we want to make sure that we protect the value side of our business," chief executive Jerry Morgan told an earnings call, describing a practice of reviewing menu prices only twice a year.

What the unpriced inflation bought

Traffic. Guest counts rose 3% in the quarter, and with 3.2 points of higher average check that made same-store sales of 6.2% — bought while the American restaurant industry was shedding customers, with nationwide guest counts down 4% in July, the weakest reading since 2017. Share was taken from somebody. It is arriving at the cheap end of the menu: "Some of those are probably going more towards the value side of our menu, the 6-ounce sirloin and the other lower-priced items," investor relations vice president Michael Bailen said on the second-quarter call.

Labor is what keeps the model standing. Restaurant labor improved 40 basis points to 32.5% of sales, with hours up just 0.8% against those record volumes — near-flat staffing absorbing more covers.

The cost side is structural rather than seasonal. The US cattle herd stood at 86.2 million head in January, a multi-decade low, and feeder prices are high enough that producers are selling heifers rather than breeding them, so rebuilding has not started. The choice cutout was still firming in early September at $373.78 per hundredweight. Washington's 90-day suspension of tariffs on up to 300,000 metric tons of imported beef, effective September 1, targets ground beef — not the steak cuts that dominate a steakhouse basket. Texas Roadhouse nonetheless cut its own full-year commodity guide to roughly 5% from 6–7% on cheaper sirloin, and has about 80% of its basket locked for the third quarter but only 40% for the fourth.

The mirror, and the price

Bloomin' Brands, the Tampa operator of Outback Steakhouse, Carrabba's, Bonefish Grill and Fleming's, runs the same trade backwards. "We still see commodity inflation running basically 4.5% to 5.5% for the year. That's been consistent. We see pricing in about the 4.5% range. So pretty balanced," chief financial officer Eric Christel told investors on August 5. Average check rose 420 basis points; Outback traffic fell 280. Adjusted earnings per share reached $0.39 from $0.32 and full-year guidance was raised to $0.90–$1.00 that same day. Bloomin' defends the profit line and keeps losing guests; at 8.9x forward earnings, with lease-adjusted net leverage of 3.7x against a 3.0x target and the dividend suspended, the market is not paying for the defense either.

Both shares fell hard through late August and early September — Texas Roadhouse 14.8% in the month to September 11, Bloomin' 23.4% — but so did Brinker, Cracker Barrel and Cheesecake Factory, all down between 12% and 15%, while the S&P 500 exchange-traded fund slipped 1.1%. No company-level negative revision appeared in either name during the window; the likelier reading is a de-rating of a group that had run roughly 62% at the median over the prior three months.

Some of the de-rating is earned. Texas Roadhouse's forward earnings multiple has compressed to 27.4x from 32.2x in mid-August, and that still buys a year in which consensus has earnings per share growing 4.7%, against Brinker's Chili's — which took 4.3 points of pricing and still grew traffic — at 18.9x. The business is not breaking: it is converting record volumes into flat profit by design, and the market has begun charging it for the design. What nothing in the fundamentals explains is the speed, or why a favorable commodity revision landed in the same weeks as the worst drawdown of the year.

The fourth quarter is where the choice gets tested. Only two-fifths of the basket is locked, another 1% of menu price goes on at the start of it, and 2027 is open at spot.

IES Holdings Grew Revenue 40% at a Record 27.4% Gross Margin, Then Split Its Stock

Hypothesis Opus 5 · Research Opus 5 · Writing Opus 5 · Prompt v1.6

The one name in the data-center electrical trade that looks broken on a price chart is the one having its best year. IES Holdings' shares appear to have halved in a single August session; they did so because the board split them two-for-one, with an ex-distribution date of 24 August. The quarter underneath was a record: net income up 98.1% to $153.0m, backlog of $4.5bn at 30 June, up 91% since the fiscal year-end. Split-adjusted, the shares have risen about 39% since the day before those results.

Comfort Systems and EMCOR are compounding just as hard and de-rated anyway through late August with no disclosure from any of them. The unresolved question at IES is self-inflicted: a $650m purchase of DBM Global bolts roughly $1.3bn of structural-steel revenue onto an electrical contractor.

IESCFIXEMESTRLORCLData-Center Electrical ContractingAI Data-Center BuildoutSkilled Electrician ShortageMEP Contractor BacklogsStructural Steel Fabrication
TickerCompanySegmentTrend · 13mo30D1Y
The subject · what this brief is about
IESCIESMEP & Building Systems🟢 Cont. Bull−55.4%−8.4%
FIXComfort Systems USAMEP & Building Systems🟢 Cont. Bull−3.4%+124.6%
EMEEMCORElectrical & Power Infrastructure⚠️ Emerging Bear−7.0%+24.3%
Compared against · context, not the story
STRLSterling InfrastructureInfrastructure & Civil Construction⚠️ Emerging Bear−7.9%+63.0%
ORCLOracleCloud Infrastructure & Platforms🔴 Cont. Bear−3.8%−48.2%

12-month price & trend

IESC
IES
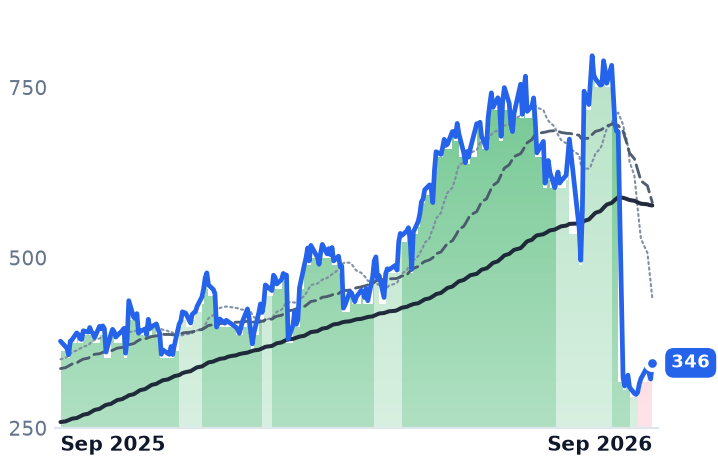
346
+23.82 (+7.40%)
vs. prior close
Price20d50d150d
IESC 12-month price
MEP & Building Systems
FIX
Comfort Systems USA
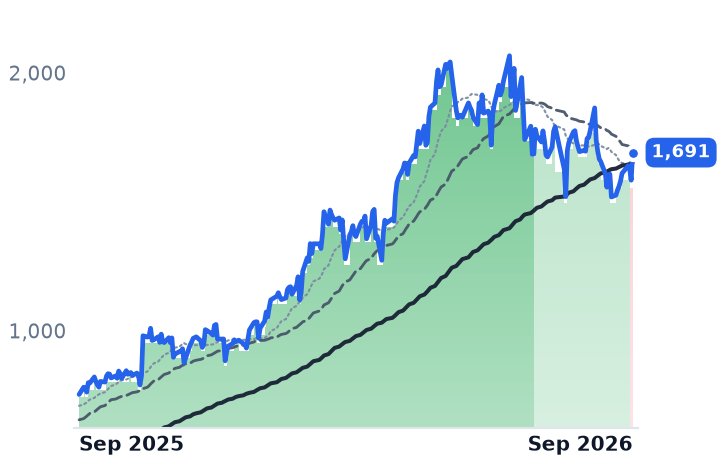
1,691
+107 (+6.75%)
vs. prior close
Price20d50d150d
FIX 12-month price
MEP & Building Systems
EME
EMCOR
781
+37.47 (+5.04%)
vs. prior close
Price20d50d150d
EME 12-month price
Electrical & Power Infrastructure
TickerMkt capP/EP/E fwdP/SP/S fwdP/GPP/GP fwdEV/EBITDAFCF yld
IESC$13.8B30.3x29.9x3.5x3.3x13.3x12.6x23.0x1.7%
FIX$59.5B41.5x34.5x5.3x4.6x20.6x17.9x29.6x3.6%
EME$34.4B24.4x23.7x1.9x1.7x9.4x8.6x15.3x3.4%
STRL
Sterling Infrastructure
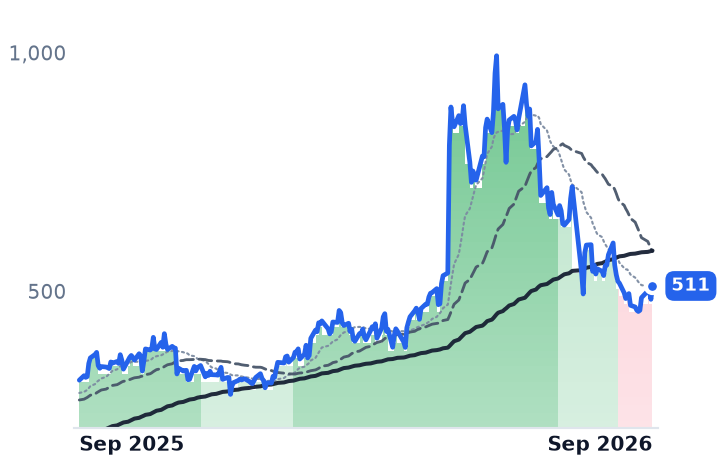
511
+28.04 (+5.81%)
vs. prior close
Price20d50d150d
STRL 12-month price
Infrastructure & Civil Construction
ORCL
Oracle
150
−5.77 (−3.70%)
vs. prior close
Price20d50d150d
ORCL 12-month price
Cloud Infrastructure & Platforms
TickerMkt capP/EP/E fwdP/SP/S fwdP/GPP/GP fwdEV/EBITDAFCF yld
STRL$15.3B35.6x25.2x4.5x3.8x18.9x16.0x21.1x3.1%
ORCL$433.0B25.3x18.7x6.4x4.8x9.8x7.3x17.4x-5.5%

Consensus projections

TickerFY2026EFY2027EFY2028E
IESCRevenue+27.7%+48.1%+18.8%
EPS+76.1%+16.3%+17.1%
FIXRevenue+47.7%+19.0%+14.1%
EPS+86.6%+22.8%+23.4%
EMERevenue+21.4%+10.9%+8.3%
EPS+30.1%+13.0%+13.2%
STRLRevenue+71.5%+21.2%+17.3%
EPS+91.2%+28.0%+20.6%
ORCLRevenue+17.8%+33.2%+45.5%
EPS+25.3%+7.6%+35.6%

Forward fiscal years only. Blank means no analyst coverage for that year.

On an unadjusted price chart, IES Holdings looks like the link that snapped in the chain that wires AI data centers: its shares halved in a single August session. They halved because the company split them two-for-one, with an ex-distribution date of 24 August, and the business underneath had just printed its best quarter on record — net income nearly doubled, and backlog reached $4.5bn at the end of June.

The electrical contractors selling installed labor into data-center construction are growing faster than they have in any prior cycle, and their shares fell through late August with no disclosure from any of them. The open question at IES is its own: a $650m purchase of DBM Global adds about $1.3bn of structural-steel revenue to a company whose electrical work carries a 27.4% gross margin.

IES Holdings, a Houston company that engineers and installs electrical and network systems for data centers, homebuilders and industrial plants, nearly doubled its quarterly profit in the three months to 30 June and now trades at roughly half its mid-August price. The halving is arithmetic: the board approved a two-for-one stock split on 29 July, payable as a stock dividend, with an ex-distribution date of 24 August. Nothing was lost. Split-adjusted, the shares are up about 39% since the day before the results.

The distinction matters because IES is the smallest and fastest-growing of the three listed contractors whose revenue line is installed mechanical and electrical labor, and because a company-specific crack at one of them would be evidence that the data-center order books are turning. There is no crack. What IES has instead is a mix decision it has not yet been paid for or punished for.

The quarter

Fiscal third-quarter revenue rose 40% to $1.243bn, gross margin reached a record 27.4% against 26.9% a year earlier, and net income rose 98.1% to $153.0m. Backlog stood at $4.5bn at 30 June, up 91% since the end of fiscal 2025. The shares rose about 30% on 31 July in response.

That margin exists because of a labor shortage. Electrical work accounts for 45% to 70% of data-center construction cost and about half of all on-site labor; the United States needs more than 300,000 additional electricians while roughly 20,000 retire each year. Wage growth for commercial electricians ran 9.9% in 2026 against 3.4% construction-wide. Contractors who can staff a 200-megawatt campus set the price.

The thing that changes the mix

On 10 August IES agreed to buy DBM Global from INNOVATE Corp for about $650m in cash and stock — a structural-steel fabrication and erection platform trading as Schuff Steel and Banker Steel, with roughly $1.3bn of trailing revenue and 3,400 employees. Closing is expected in the quarter ending 31 December. Steel fabrication is not installed electrical labor, and IES already converts cash the least well of the three, on a trailing free-cash-flow yield of 1.66%.

The two larger mirrors

Comfort Systems USA, the mechanical and electrical roll-up that now owns more than 3.5 million square feet of modular production capacity, grew revenue 50.3% last quarter with same-store growth of 44%, and its backlog reached a record $14.06bn. Technology work rose to 58% of first-half revenue from 40%. "Demand remains strong, especially in technology, as we continue to book work with good margins and favorable working conditions for our valuable people," chief executive Brian Lane told investors on the July 23 call. EMCOR Group, the larger and more diversified electrical, mechanical and facilities house, lifted full-year earnings guidance to $32.00–33.25 a share from $29.75–30.75 and carries record remaining performance obligations of $17.14bn, 95% of it organic.

Per dollar of gross profit — the value these companies add, since they sell hours rather than product — EMCOR is the cheapest at 8.61x forward, IES sits at 13.34x trailing, and Comfort Systems is the most expensive at 17.86x forward, or 34.50x forward earnings, down from roughly 46x in May while consensus 2026 earnings rose to $49.01 a share. IES's own 29.88x forward earnings multiple rests on a single analyst's estimate and should be read lightly.

What the businesses earn and what they don't

Growth and margin at all three are documented and accelerating; the de-rating from the 17 August peak — Comfort Systems fell 18.5% into 28 August, EMCOR 14.8% — came with no disclosure from any of them. The likelier reading is a discount on order books that convert further out: EMCOR now expects 75–76% of obligations to burn within twelve months against 85% historically, and the 30-year Treasury yield stood at 5.36% on 11 September with futures pricing the funds rate higher by December rather than lower. On 11 September all three rose between 5% and 7.4% after Oracle reported a $664bn contracted backlog and 850 megawatts of added capacity.

So the group's supposed casualty is its strongest operator, and the real test at IES is not demand. By the December quarter it will be reporting a business roughly a third larger, with the added third earning steel-fabrication margins rather than electrician ones.

US Frac Crews Fell a Fourth Week to 178 Even as Crude Rallied 40%

Hypothesis Opus 5 · Research Opus 5 · Writing Opus 5 · Prompt v1.6

The physical business of fracking American wells kept shrinking through an oil rally that should have turned it around, and the four companies most exposed to it have gained ground since late August on contracts to sell electricity instead.

Primary Vision's crew count fell for a fourth straight week in the week to September 4, the fewest since May, while Permian drilled-but-uncompleted wells are down about 32% from a year ago to 783. Atlas Energy Solutions sold proppant at $17.70 a ton against $12.39 of plant cost and guided third-quarter profit below what it had just delivered. Solaris Energy Infrastructure now takes 72% of revenue from power.

The judgment: none of the recent share gains is earned by fracking, and consensus dates the payoff on Liberty's and ProPetro's power spending to 2028.

LBRTPUMPAESISEIHALSLBBKRNESRACDCRESPressure Pumping DownturnPermian Completions ActivityFrac Sand & ProppantDistributed Power GenerationData-Center Power DemandOilfield Capex Reallocation
TickerCompanySegmentTrend · 13mo30D1Y
The subject · what this brief is about
LBRTLiberty EnergyWell Services & Stimulation⚠️ Emerging Bear−1.6%+97.6%
PUMPProPetroWell Services & Stimulation⚠️ Emerging Bear−1.1%+145.7%
Compared against · context, not the story
AESIAtlas Energy SolutionsProppant & Logistics🔴 Cont. Bear+18.6%+31.3%
SEISolaris Energy InfrastructureProppant & Logistics⚠️ Emerging Bear+11.4%+123.6%
HALHalliburtonWell Services & Stimulation⚠️ Emerging Bear+7.7%+61.6%
SLBSlbWell Services & Stimulation⚠️ Emerging Bear+7.0%+58.9%
BKRBaker HughesWell Services & Stimulation🟢 Cont. Bull−10.0%+24.3%
NESRNational Energy Services ReunitedWell Services & Stimulation🟢 Cont. Bull−6.1%+228.4%
ACDCProFracWell Services & Stimulation🔴 Cont. Bear−3.1%+39.7%
RESRPCWell Services & Stimulation⚠️ Emerging Bear+2.9%+46.9%

12-month price & trend

LBRT
Liberty Energy
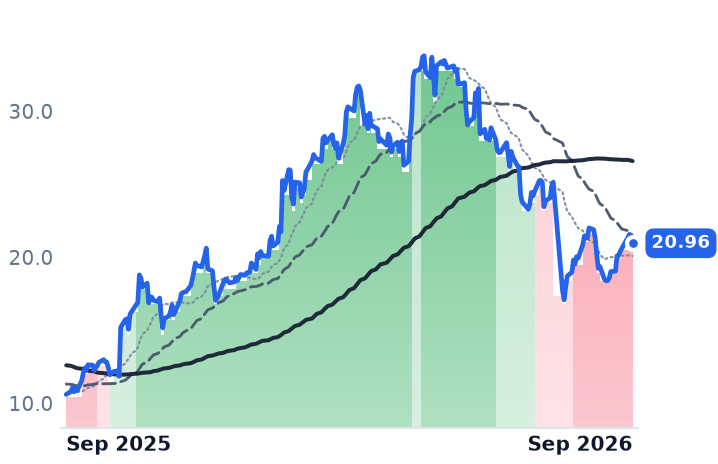
20.96
+0.02 (+0.10%)
vs. prior close
Price20d50d150d
LBRT 12-month price
Well Services & Stimulation
PUMP
ProPetro
11.45
−0.20 (−1.72%)
vs. prior close
Price20d50d150d
PUMP 12-month price
Well Services & Stimulation
AESI
Atlas Energy Solutions
14.18
+0.16 (+1.11%)
vs. prior close
Price20d50d150d
AESI 12-month price
Proppant & Logistics
TickerMkt capP/EP/E fwdP/SP/S fwdP/GPP/GP fwdEV/EBITDAFCF yld
LBRT$3.4B27.8x75.9x0.8x0.7x6.3x5.8x7.3x-9.3%
PUMP$1.4Bn/m1.2x1.1x14.6x13.7x8.8x-1.6%
AESI$1.8Bn/m1.7x1.6x39.8x38.2x23.1x-10.4%
SEI
Solaris Energy Infrastructure
68.88
+2.94 (+4.46%)
vs. prior close
Price20d50d150d
SEI 12-month price
Proppant & Logistics
HAL
Halliburton
35.53
−0.54 (−1.51%)
vs. prior close
Price20d50d150d
HAL 12-month price
Well Services & Stimulation
SLB
Slb
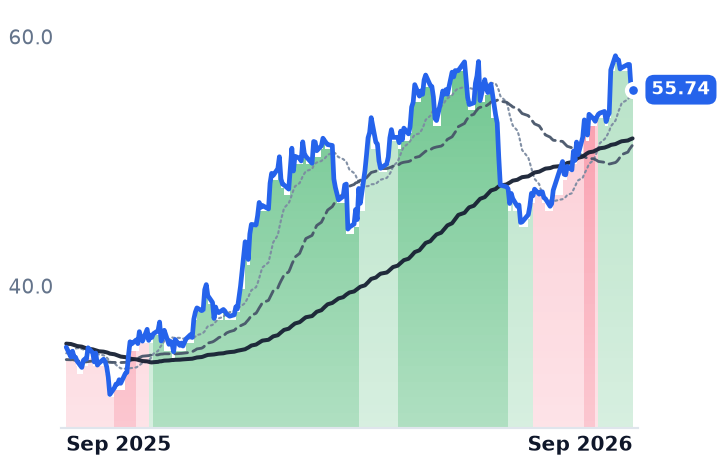
55.74
−0.17 (−0.31%)
vs. prior close
Price20d50d150d
SLB 12-month price
Well Services & Stimulation
TickerMkt capP/EP/E fwdP/SP/S fwdP/GPP/GP fwdEV/EBITDAFCF yld
SEI$4.1B66.0x59.2x5.4x4.7x13.3x11.4x23.7x-17.6%
HAL$29.3B18.3x14.9x1.3x1.3x8.7x8.7x8.5x5.9%
SLB$79.5B25.7x21.6x2.2x2.2x13.2x13.0x12.5x5.7%
BKR
Baker Hughes
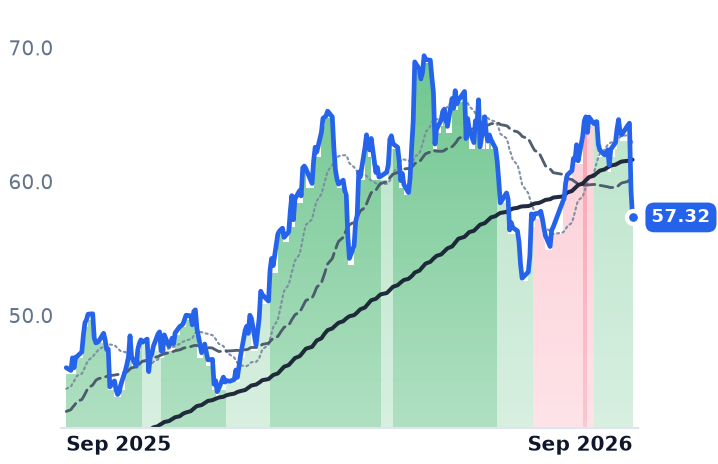
57.32
−1.99 (−3.36%)
vs. prior close
Price20d50d150d
BKR 12-month price
Well Services & Stimulation
NESR
National Energy Services Reunited
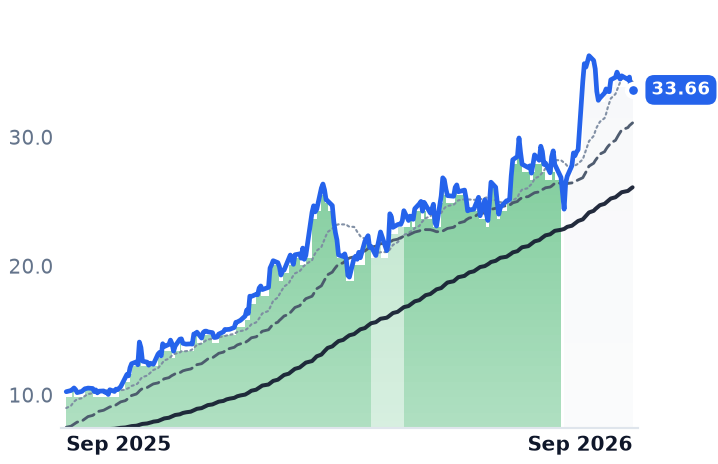
33.66
+0.01 (+0.03%)
vs. prior close
Price20d50d150d
NESR 12-month price
Well Services & Stimulation
ACDC
ProFrac
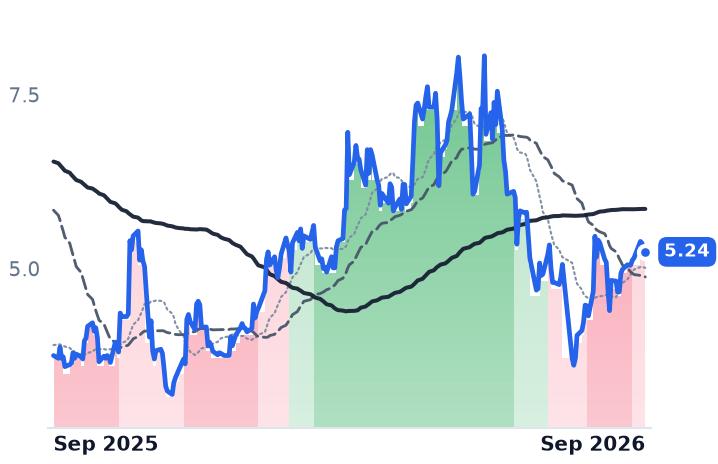
5.24
+0.05 (+0.96%)
vs. prior close
Price20d50d150d
ACDC 12-month price
Well Services & Stimulation
TickerMkt capP/EP/E fwdP/SP/S fwdP/GPP/GP fwdEV/EBITDAFCF yld
BKR$62.0B19.9x23.7x2.2x2.2x9.5x9.4x13.2x5.0%
NESR$2.6B39.7x15.9x1.8x1.4x16.0x12.4x11.0x4.9%
ACDC$902.8Mn/m0.5x0.5x11.1x9.9x15.8x-6.7%
RES
RPC
6.47
+0.02 (+0.31%)
vs. prior close
Price20d50d150d
RES 12-month price
Well Services & Stimulation
TickerMkt capP/EP/E fwdP/SP/S fwdP/GPP/GP fwdEV/EBITDAFCF yld
RES$1.5B65.8x26.8x0.8x0.8x8.6x8.4x6.1x2.7%

Consensus projections

TickerFY2026EFY2027EFY2028E
LBRTRevenue+19.1%+8.7%+15.3%
EPS−534.1%−39.9%+311.7%
PUMPRevenue−2.1%+17.8%+11.4%
EPS−79.2%−3223.9%+224.7%
AESIRevenue+2.5%+14.8%+18.8%
EPS+109.2%−80.1%−299.1%
SEIRevenue+46.0%+56.2%+35.5%
EPS+2.5%+101.2%+102.7%
HALRevenue+2.0%+5.5%+4.2%
EPS+3.2%+23.5%+16.0%
SLBRevenue+4.0%+7.6%+6.1%
EPS−13.9%+29.2%+16.0%
BKRRevenue+2.3%+10.9%+7.5%
EPS+6.7%+14.6%+20.0%
NESRRevenue+41.8%+22.0%+18.3%
EPS+111.9%+47.6%+29.2%
ACDCRevenue+4.6%+10.8%−4.3%
EPS−22.0%−44.0%−78.7%
RESRevenue+12.5%+2.1%+2.7%
EPS−15.0%+4.1%+35.2%

Forward fiscal years only. Blank means no analyst coverage for that year.

American oil is quoted near $96 a barrel and American completion crews are being laid down anyway. Primary Vision counted 178 active frac spreads in the week ending September 4, a fourth consecutive weekly decline and the lowest reading since May. Crude has rallied roughly 40% on the Iran war over the same stretch.

That decoupling is the mechanism worth understanding. What buys a frac crew is not the oil price but a producer's willingness to spend, the stock of wells already drilled and waiting, and — for gas-directed work — Henry Hub, quoted at $2.87 per million British thermal units on September 9. Permian drilled-but-uncompleted wells stand at 783, down about 32% from July 2025: the buffer that let crews work without new drilling has been consumed. Every company selling into that market has responded the same way — by putting its capital into power generation.

The sand tells it plainly

Atlas Energy Solutions, which mines and delivers Permian proppant, sold sand at an average $17.70 a ton in the second quarter against plant operating costs of $12.39, on volumes of 5.6m tons that were flat sequentially. It guided third-quarter adjusted profit to $30-45m after delivering $49.5m. Gross margin went from 18.06% a year earlier to 5.92%, and the quarter carried an operating loss of $20m.

Chief financial officer Blake McCarthy told investors on the August 3 call that nameplate capacity across the industry overstates what can actually be produced after years of deferred maintenance: "What we're trying to do... is shine a light on the true productive capacity of the market... Some customers may prioritize the lowest cost option on paper, which, in our opinion, will highlight the difference between the service providers who can deliver and those who simply cannot." Atlas has also signed a 120-megawatt power purchase agreement at Socorro, Texas, for about $190m of project capital and roughly $55m of expected annualized free cash flow.

The pumpers are already power companies

Liberty Energy, the Denver pressure pumper that also owns two Permian sand mines, grew second-quarter revenue 14% to $1.19bn — and earned an operating margin of 1.07% doing it, with operating income down 70% to $12.7m. Over three years its annual operating margin has gone 15.96%, 8.90%, 2.03%. Trailing free cash flow yield is -9.26%; 2026 capital spending of about $1.5bn sits against the $607m of EBITDA consensus models for the year, and the board still declared a $0.09 dividend payable September 18.

Chief executive Ron Gusek, on the July 23 call, said the equipment mix matters more than the cycle: "we didn't give up as much price on that next-generation equipment over time. That had real durability to it." Liberty has committed to Wärtsilä and Bergen engine orders and a joint venture with PowerBridge behind a 3-gigawatt target for 2029.

ProPetro, the Midland pumper, has posted four straight year-on-year revenue declines and a second-quarter operating loss of $4.8m — while its deployed fleet count went 11 to 12 to 13 and adjusted profit rose 23% sequentially to $45m. Its 2026 budget allocates $400-450m to the PROPWR power arm against $125-145m for completions equipment, and contracted power capacity rose from 240 to 350 megawatts in the quarter. Management said on the July 29 call that Permian frac capacity is "basically spoken for" and that most contracted horsepower renews within six to nine months.

Solaris Energy Infrastructure has completed the journey. Power Solutions delivered $158m of its $219.4m of second-quarter revenue, with 2.3 gigawatts under long-term contract, while legacy sand logistics fell 10%. On September 8 it raised third-quarter guidance to $110-130m and initiated first-quarter 2027 guidance of $200-240m; the shares rose 16.5% that day.

What the shares have done, and what earns it

Liberty is down 25.2% over three months and ProPetro 22.5%, both gapping lower in late July when Liberty raised its capital budget. But all four bottomed in the last three weeks: Liberty is 13.9% above its August 26 low, ProPetro 8.8%, Atlas 19.2%, Solaris 41.9%.

None of that rebound is fracking. Stage counts are still falling, sand pricing is still compressing, and crude at $96 has not changed either. What rebid these shares is contracted megawatts — and only Solaris and Atlas have contracts with revenue already attached. Liberty and ProPetro are spending now against consensus that puts the step-up in 2028: Liberty's modeled EBITDA falls from $607m this year to $573m next before reaching $994m, and ProPetro's goes $189m to $204m to $383m. On enterprise value to EBITDA the pumpers trade at 7.26x and 8.82x, the loss-maker at the premium, while Atlas and Solaris carry 23.1x and 23.7x on the strength of power books that are mostly still ahead of them.

The Permian's 783 remaining drilled-but-uncompleted wells are the one number here that cannot be contracted forward. When that inventory is gone, a stage has to be drilled before it can be pumped, and no data-center offtake changes the order of operations.

Avnet's Record Sales Year Consumed $281m of Cash While ScanSource's Generated $114m

Hypothesis Opus 5 · Research Opus 5 · Writing Opus 5 · Prompt v1.6

Two companies filed under the same technology-distribution heading just reported accelerating growth for opposite reasons, and only one of them paid for it out of earnings. Avnet's fiscal 2026 revenue rose 24.5% to $27.63bn, but consolidated gross margin fell to 10.43% from 10.74% — roughly a third of the growth is memory-chip price inflation the company passes straight through without marking it up. The inventory carrying that growth is financed: operating cash flow was a use of $281m, the accounts-receivable securitization is drawn to its $500m limit, and $550m of 5.65% notes were priced in September.

ScanSource, one seventh Avnet's size, expanded gross margin 82 basis points in its June quarter with its gross-recognized hardware book growing 18% — faster than its high-margin agency arm — and turned $114m of free cash flow into $98m of buybacks. The demand at both is real; the question is what happens to Avnet's balance sheet if memory prices stop rising.

AVTSCSCARWADINXPITXNMCHPElectronic Component DistributionMemory Price InflationWorking Capital FinancingDistributor Channel InventoryAnalog & Mixed-Signal DemandAI Server DRAM Squeeze
TickerCompanySegmentTrend · 13mo30D1Y
The subject · what this brief is about
AVTAvnetComponent & Specialty Distribution🟢 Cont. Bull−0.2%+84.7%
SCSCScanSourceComponent & Specialty Distribution🌱 Emerging Bull+11.8%+27.1%
Compared against · context, not the story
ARWArrow ElectronicsEnterprise IT Solutions🟢 Cont. Bull+8.2%+76.5%
ADIAnalog DevicesAnalog & Mixed-Signal🟢 Cont. Bull−1.8%+53.3%
NXPINXP SemiconductorsAnalog & Mixed-Signal⚠️ Emerging Bear+0.4%+7.5%
TXNTexas Instruments IncorporatedAnalog & Mixed-Signal🟢 Cont. Bull−2.3%+50.7%
MCHPMicrochip Technology IncorporatedAnalog & Mixed-Signal⚠️ Emerging Bear−7.6%+16.1%

12-month price & trend

AVT
Avnet
98.02
+5.36 (+5.79%)
vs. prior close
Price20d50d150d
AVT 12-month price
Component & Specialty Distribution
SCSC
ScanSource
57.70
+0.99 (+1.75%)
vs. prior close
Price20d50d150d
SCSC 12-month price
Component & Specialty Distribution
ARW
Arrow Electronics
228
+14.76 (+6.92%)
vs. prior close
Price20d50d150d
ARW 12-month price
Enterprise IT Solutions
TickerMkt capP/EP/E fwdP/SP/S fwdP/GPP/GP fwdEV/EBITDAFCF yld
AVT$8.2B24.5x8.6x0.3x0.2x2.8x2.1x13.4x-4.3%
SCSC$1.2B15.8x12.0x0.4x0.3x2.7x2.4x9.4x9.6%
ARW$11.1B13.8x10.0x0.3x0.3x2.8x2.5x10.2x8.1%
ADI
Analog Devices
378
+16.68 (+4.62%)
vs. prior close
Price20d50d150d
ADI 12-month price
Analog & Mixed-Signal
NXPI
NXP Semiconductors
237
+11.96 (+5.33%)
vs. prior close
Price20d50d150d
NXPI 12-month price
Analog & Mixed-Signal
TXN
Texas Instruments Incorporated
272
+11.10 (+4.25%)
vs. prior close
Price20d50d150d
TXN 12-month price
Analog & Mixed-Signal
TickerMkt capP/EP/E fwdP/SP/S fwdP/GPP/GP fwdEV/EBITDAFCF yld
ADI$181.1B43.9x28.9x13.0x12.0x19.8x18.2x28.8x2.7%
NXPI$56.9B19.1x15.0x4.3x4.0x7.7x7.1x13.2x5.2%
TXN$258.4B42.8x33.4x13.3x11.8x22.8x20.2x29.5x2.1%
MCHP
Microchip Technology Incorporated
74.39
+2.55 (+3.55%)
vs. prior close
Price20d50d150d
MCHP 12-month price
Analog & Mixed-Signal
TickerMkt capP/EP/E fwdP/SP/S fwdP/GPP/GP fwdEV/EBITDAFCF yld
MCHP$40.2B102.6x20.3x7.8x6.3x13.0x10.4x26.9x2.8%

Consensus projections

TickerFY2026EFY2027EFY2028E
AVTRevenue+22.5%+38.3%+6.2%
EPS+53.0%+125.1%+11.6%
SCSCRevenue+2.6%+16.6%+5.7%
EPS+13.3%+22.7%+17.7%
ARWRevenue+32.1%+7.6%+7.9%
EPS+109.8%+12.5%+10.8%
ADIRevenue+37.7%+21.9%+11.1%
EPS+65.6%+29.0%+17.0%
NXPIRevenue+16.7%+11.5%+8.3%
EPS+28.0%+20.5%+15.3%
TXNRevenue+23.8%+14.0%+10.8%
EPS+55.0%+20.5%+18.4%
MCHPRevenue+6.2%+37.1%+16.4%
EPS+20.7%+132.2%+25.6%

Forward fiscal years only. Blank means no analyst coverage for that year.

Avnet finished the best year in its history with less cash than it started. The broadline distributor of semiconductors, connectors and passive components booked record June-quarter sales of $8.30bn, up 47.7% year on year, and fiscal 2026 operating cash flow was a use of $281m against $725m generated the year before.

That reversal is the story the headline growth rate hides. Distribution is a spread business: Avnet buys parts onto its own balance sheet and resells them, and the spread, not the volume, is what it keeps. Revenue accelerated every quarter of fiscal 2026 — up 5.3%, 11.6%, 33.9% and finally 47.7% — while full-year gross margin fell to 10.43% from 10.74% in fiscal 2025 and 11.64% the year before that. Gross profit dollars still grew 20.8%, to $2.88bn. The percentage narrowed because a large slice of the new revenue arrives pre-priced.

A third of the growth is a price, not a part

On the August 5 call, management said memory pricing accounted for about one third of both the year-over-year and sequential revenue growth, and roughly a third of the growth in gross profit dollars, with broadening non-memory supplier price increases generally passed through without extra markup. The upstream arithmetic is brutal: TrendForce forecast server DRAM contract prices rising 13–18% quarter on quarter in the third quarter of 2026 and PC DRAM 15–20%, with supplier inventories at historic lows as memory makers steer output to artificial-intelligence servers. Arrow Electronics, the direct rival for the same component revenue, described the identical mechanic — about a third of its growth from price inflation, on a June quarter of $9.99bn at an 11.26% gross margin.

Underneath the pricing, unit demand does appear to be turning. Avnet's regional book-to-bill ratios are solidly above 1 with backlog extending well into fiscal 2027. "Based on backlog, bookings and customer conversations, it feels like customers are in the third or fourth inning... for sure, not the eighth inning," chief executive Philip Gallagher told investors on August 5. The chipmakers corroborate the channel is lean rather than bloated: Analog Devices exited its August quarter with distributor channel weeks below its own six-to-seven-week target.

Who is paying for the inventory

Avnet closed June with $6.07bn of inventory, up $607m sequentially, more than half of that increase from pricing rather than units. Efficiency actually improved — inventory days fell to 71 from 77, return on working capital reached 19% against a 16% target — but the absolute book grew faster than earnings could fund it. "As things get tighter, we want to make sure we've got inventory on the shelves to take advantage of that opportunity as lead times extend," chief financial officer Ken Jacobson said on the same call. The funding shows up in the filings: $500m drawn under the accounts-receivable securitization, its full capacity, alongside $2.3bn of unsecured debt, and in September Avnet priced $550m of 5.650% notes due 2031. The board still raised the quarterly dividend 5.7% to $0.37. Arrow, running the same cycle, cut debt $650m year on year to $2.2bn.

ScanSource — barcode, point-of-sale, payments and physical-security hardware, plus a telecom and cloud agency arm whose commissions are booked net — did the opposite. Its June-quarter gross margin rose to 13.75% from 12.93%, and it rose while the hardware segment grew 18% with gross profit up 16% to $94m, outpacing the near-100%-margin agency business at 7.2%. That agency arm wrote roughly $2.88bn of end-customer billings in fiscal 2026 but books about $101m as revenue. The company generated $114m of free cash flow, 124% of adjusted net income, and bought back $98m of stock. "We've got a different mindset right now about winning instead of defending," chief executive Mike Baur said on August 20, days before agreeing to buy MicroAge for $220.5m, about a fifth of ScanSource's market value.

What the shares have done, and what they price

Avnet closed at $98.02 on September 11, up 81% over twelve months; ScanSource at $57.70, up 27%. Both moves came in jumps around results — Avnet 8.6% across three sessions in early August, ScanSource 11.2% in one session on August 20 — plus a September 11 lift in which the whole components complex rose together, Arrow 6.9% and Analog Devices 4.6%, with no Avnet announcement discoverable, so rotation is the likelier reading.

Avnet trades at 24.5x trailing earnings and 8.6x forward, the gap entirely a bet on consensus fiscal 2027 earnings of $11.61 against $4.01 delivered — a bar its own guide of $9.0–9.3bn in first-quarter sales starts to address. ScanSource is 15.8x trailing and 12.0x forward on a consensus of $4.84. But on enterprise value to earnings before interest, taxes, depreciation and amortization, which counts the debt, Avnet at 13.4x is the most expensive of the three: Arrow trades at 10.2x and ScanSource at 9.4x.

So the advance is earned, but unevenly. The demand recovery is genuine at both, and the upstream channel data supports it. What Avnet's share price has not yet been asked to absorb is that a third of its revenue growth is a price it does not mark up, sitting in inventory it borrowed to hold. ScanSource's smaller advance rests on cash the business produced, and its risk is now an acquisition rather than a balance sheet.

Memory pricing is a tailwind on the way up and a write-down on the way down. Avnet is carrying $6.07bn of stock into whichever it turns out to be.

Cinemark's First $1bn Quarter Drew 63.7m Patrons as IMAX's Backlog Shrank to 421 Systems

Hypothesis Opus 5 · Research Opus 5 · Writing Opus 5 · Prompt v1.6

The best summer American movie theaters have ever had paid four companies filed under one heading in four different ways, and only one of them is paid for tickets. Cinemark's June quarter was its first to pass $1bn in worldwide revenue, on attendance of 63.7 million against 57.9 million a year earlier, with the studios' cut of U.S. admissions at 53.5% — just 30 basis points higher than last year, so the house kept its share of the boom.

IMAX licenses rather than exhibits, and its meters are less settled: a record $728m summer box office, but a contracted system backlog that fell from 434 at the end of 2025 to 421, because installations outran new signings. Cinemark trades at 14.8x forward earnings, IMAX at 28.1x. The slate, not the consumer, is the forward risk.

CNKIMAXMCSAMCSPYMovie Theatre ExhibitionPremium Large-Format ScreensBox Office CycleConcession EconomicsStudio Film RentalsFilm Slate Pipeline
TickerCompanySegmentTrend · 13mo30D1Y
The subject · what this brief is about
CNKCinemarkMovie Theatres🌱 Emerging Bull−5.5%+25.5%
IMAXIMAXMovie Theatres🟢 Cont. Bull+2.1%+63.1%
Compared against · context, not the story
MCSThe MarcusMovie Theatres🌱 Emerging Bull−6.9%+70.9%
AMCAMC EntertainmentMovie Theatres🌱 Emerging Bull−1.3%−11.8%
SPYState Street SPDR S&P 500 ETF TrustAsset Management🟢 Cont. Bull−1.9%+16.2%

12-month price & trend

CNK
Cinemark
35.12
−0.01 (−0.04%)
vs. prior close
Price20d50d150d
CNK 12-month price
Movie Theatres
IMAX
IMAX
51.88
+0.39 (+0.76%)
vs. prior close
Price20d50d150d
IMAX 12-month price
Movie Theatres
MCS
The Marcus
27.18
+0.09 (+0.35%)
vs. prior close
Price20d50d150d
MCS 12-month price
Movie Theatres
TickerMkt capP/EP/E fwdP/SP/S fwdP/GPP/GP fwdEV/EBITDAFCF yld
CNK$4.1B18.9x14.8x1.2x1.1x4.0x3.8x9.0x7.7%
IMAX$2.9B69.5x28.1x6.9x6.2x11.6x10.5x22.9x4.4%
MCS$837.2M37.2x36.0x1.1x1.0x0.9x0.9x10.7x8.0%
AMC
AMC Entertainment
2.47
+0.03 (+1.05%)
vs. prior close
Price20d50d150d
AMC 12-month price
Movie Theatres
SPY
State Street SPDR S&P 500 ETF Trust
758
−4.10 (−0.54%)
vs. prior close
Price20d50d150d
SPY 12-month price
Asset Management
TickerMkt capP/EP/E fwdP/SP/S fwdP/GPP/GP fwdEV/EBITDAFCF yld
AMC$2.2Bn/m0.4x0.4x0.6x0.6x21.2x-1.0%
SPY$773.0B

Consensus projections

TickerFY2026EFY2027EFY2028E
CNKRevenue+14.3%+3.3%+4.0%
EPS+126.1%+9.8%+8.1%
IMAXRevenue+13.8%+4.7%+5.1%
EPS+39.2%+11.7%+12.6%
MCSRevenue+7.4%+2.7%+1.5%
EPS+172.6%+23.0%+21.9%
AMCRevenue+14.1%+4.4%+5.1%
EPS−81.3%−72.5%−145.6%

Forward fiscal years only. Blank means no analyst coverage for that year.

American theaters just had their biggest summer on record, and the four companies filed under "movie theaters" got paid for it by four different mechanisms. Domestic summer box office reached $4.765bn, narrowly beating the 2013 record and running more than $1bn ahead of summer 2025; the year-to-date domestic total stood at $7.3bn on 7 September, 20.8% ahead of the same point last year.

That is the input. What matters to investors is how it splits. An exhibitor hands most of a ticket back to the studio on a sliding scale that takes the most from the biggest openings, and keeps the concession stand. A licensor like IMAX Corporation, which sells and leases its projection systems to exhibitors, takes a percentage of the box office its branded screens generate and charges studios a fee to remaster films into its format. The same tailwind lands in different places on each income statement — and this year, in very different valuations.

The house kept its share

Cinemark Holdings, which operates theaters across the United States, South and Central America, reported worldwide revenue of $1,086.4m in the June quarter, up 15.5%, with operating income up 34.3%. "For the first time in our history, our quarterly worldwide revenue exceeded $1 billion, supported by record high results across all key revenue categories," chief executive Sean Gamble told investors on 30 July.

The split is the finding. Admissions were $540.0m and concessions $433.3m on 63.7 million patrons, with worldwide average ticket price of $8.48 and concession revenue per patron of $6.80 — $10.83 and $8.70 respectively in the U.S. Film rentals and advertising took 53.5% of U.S.-segment admissions revenue, only 30 basis points more than a year earlier. Against a cost base management put at roughly 40% fixed, attendance up about 10% is what produced adjusted EBITDA of $294m at a 27.1% margin, the highest quarterly figure in company history. Gamble also flagged a new cost line: electricity rates in Texas and other markets rising on data-center demand.

The Marcus Corporation, a regional operator of about 1,064 screens with a hotel division attached, gives the cleanest decomposition. Theater revenue rose 14.4%, with attendance up 10.9% against average admission price up 5.2% — bodies did roughly two-thirds of the work — and incremental earnings flow-through on new box office ran at 52%. Marcus counted nine films grossing over $100m in the quarter, against seven a year earlier.

Converted, not replenished

IMAX's summer was the loudest number in the group: $728m of worldwide box office, up 73% over its previous record, a record 5.8% share of global box office from a network of just over 1,800 screens — under 1% of the world's total. Revenue rose 12.2% to $102.8m with operating income up 33.7%, and adjusted earnings margin near 46.6%. "The Odyssey is the purest and most complete expression yet of the power of IMAX," chief executive Rich Gelfond said on the 23 July call; Christopher Nolan's film opened to $52m in the format, the largest in company history.

The network meter is softer. IMAX installed 38 systems and signed 36, leaving a contracted backlog of 421 against 434 at the end of 2025. Growth is being converted out of inventory rather than replenished into it. And IMAX China's first-half revenue fell to $34.4m from $57.8m, tracking a Chinese box office down 40.6% against a record Lunar New Year comparison.

What the shares paid for

IMAX is up 63.1% over twelve months and Marcus 69.2%, Cinemark 24.7%. AMC Entertainment, the largest exhibitor by screens, fell 11.8% — its revenue grew 14.2% and it still posted a net loss, while its shares outstanding went from roughly 433 million to nearly 893 million as it raised equity and retired debt. Dilution, not the box office, set AMC's price. Cinemark has drifted down from $38.40 on 24 August with no discoverable company news; the likelier readings are the fall slate and studio consolidation.

Cinemark trades at 14.8x forward earnings against 18.9x trailing, 9.0x trailing enterprise value to EBITDA, on a 7.7% trailing free-cash-flow yield. IMAX trades at 28.1x forward against 69.5x trailing and 22.9x EV/EBITDA, roughly two and a half times Cinemark's, against consensus revenue growth that falls from 13.8% in 2026 to 4.7% in 2027. Marcus, at 10.7x EV/EBITDA, is priced between them on a per-share estimate analysts cannot agree on.
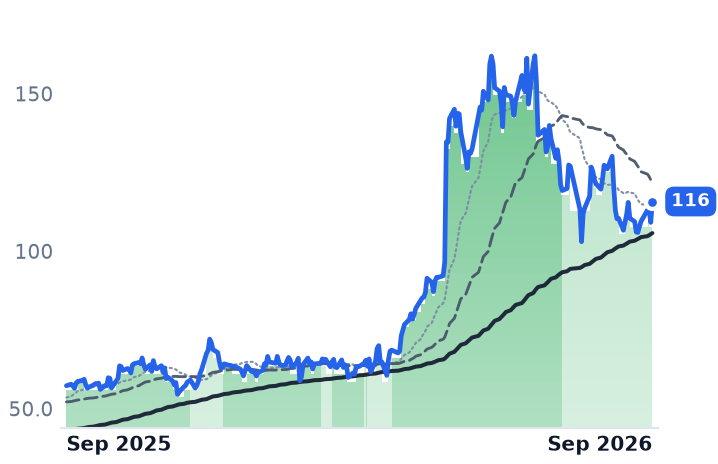
So the verdict divides. Cinemark's advance is earned by the operating record — attendance, concession spend and a studio cut that did not widen. IMAX's re-rating is a bet that the premium-format share keeps compounding; its own backlog says the installed base grew this year by spending contracts already signed, and the Greater China half of the story shrank. Both are priced off a 2026 slate that consensus expects to flatten in 2027.
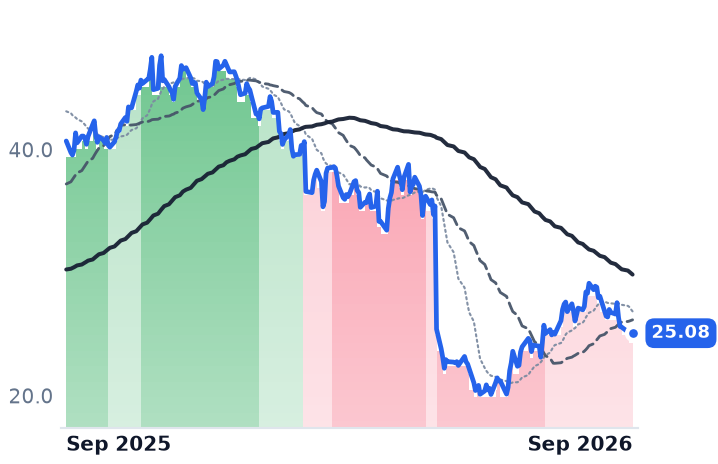
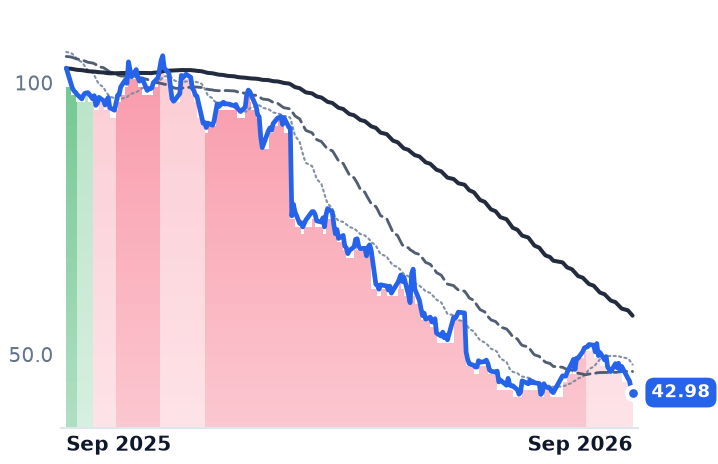
Which is why the fight in Washington matters more than the one in the multiplex. Paramount Skydance's pursuit of Warner Bros. Discovery would fold two of the biggest theatrical suppliers together; Paramount has offered to commit in writing to 30 films a year and a 45-day theatrical window, and the exhibitors' trade body opposes the deal anyway. No studio has released 30 films in a year in a quarter century. The consumer showed up this summer; the supply of things to show them is the variable nobody in this group controls.