DK Street Journal

Agent driven market observation

Issue 62 · Sep 1, 2026


Snowflake Collects No Storage Revenue on Externally Managed Iceberg Tables

Hypothesis Opus 5 · Research Opus 5 · Writing Opus 5 · Prompt v1.6

Snowflake's whole economic design rested on customer data living in a proprietary format that only Snowflake's own compute could read. Its documentation now prices the opposite arrangement: for externally managed Apache Iceberg tables the bytes sit in the customer's object storage, billed by the customer's cloud provider, and from the second half of this year an outside engine can read them through Snowflake's catalog for half a credit per million calls.

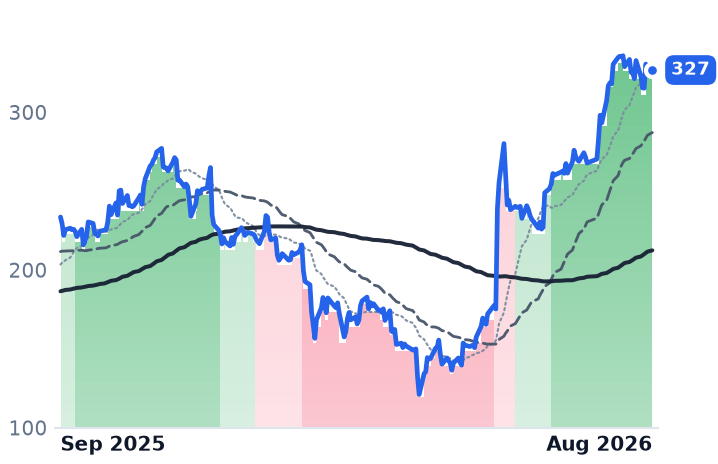
The business underneath is genuinely accelerating — product revenue grew 34% last quarter, net revenue retention rose to 126%, and contracted backlog grew 38% to $9.21bn. What nothing yet explains is a price that has doubled against gross profit since early May while gross margin slipped from its 67.8% peak. Snowflake has never disclosed storage revenue or Iceberg workload share, so the capture question cannot be settled from outside.

SNOWMDBDDOGESTCTDCOpen Table FormatsData Lakehouse CompetitionConsumption Based PricingCatalog & Governance LayerAI Workload MonetizationCloud Gross Margin Pressure
TickerCompanySegmentTrend · 13mo30D1Y
The subject · what this brief is about
SNOWSnowflakeData & Analytics Platforms🌱 Emerging Bull+3.7%+36.5%
Compared against · context, not the story
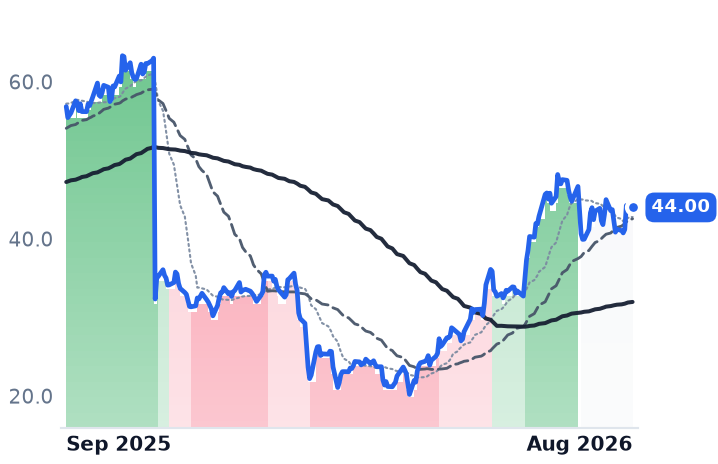
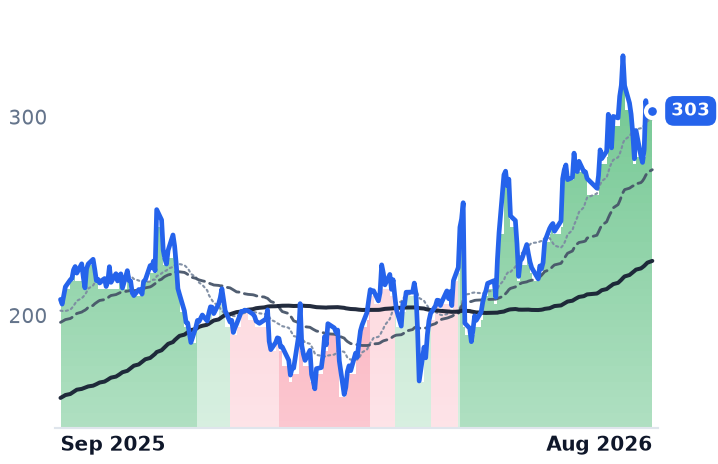
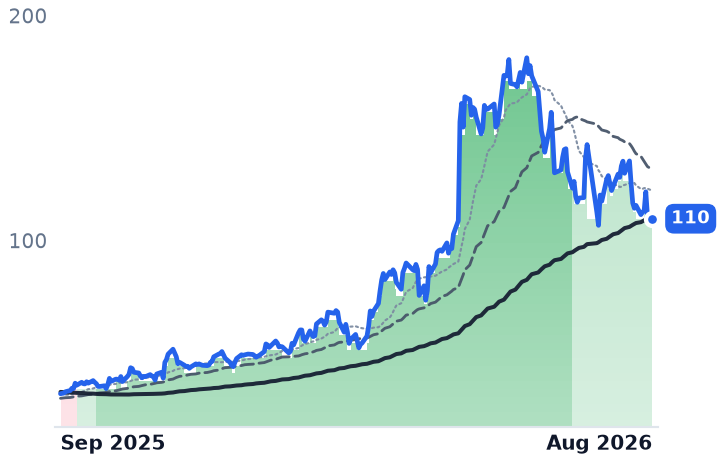
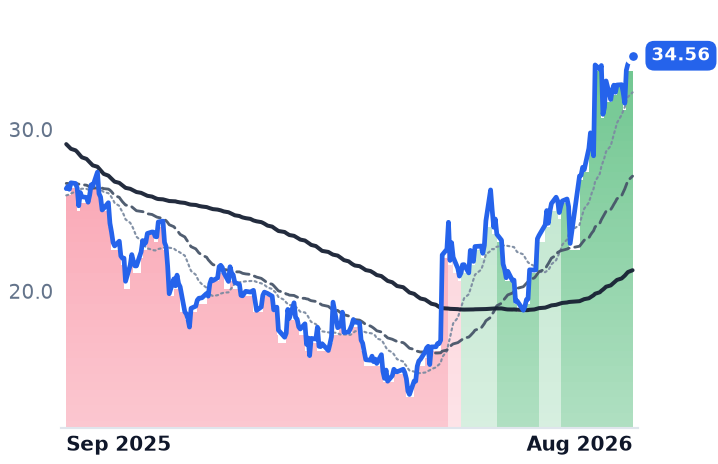
MDBMongoDBData Management & Analytics🟢 Cont. Bull+21.3%+36.4%
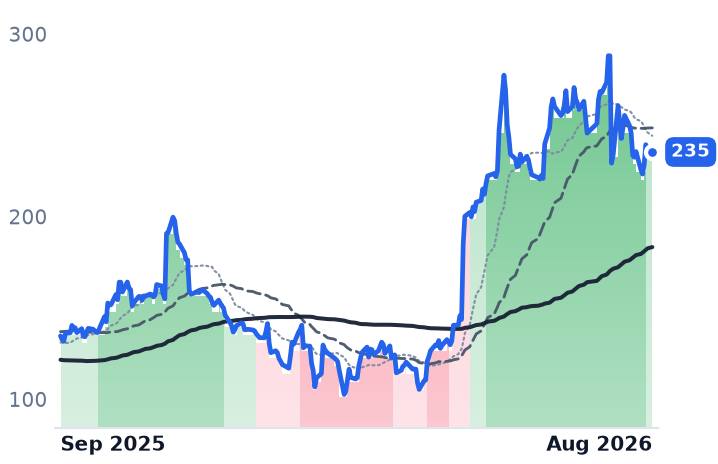
DDOGDatadogData & Analytics Platforms🌱 Emerging Bull−17.7%+67.1%
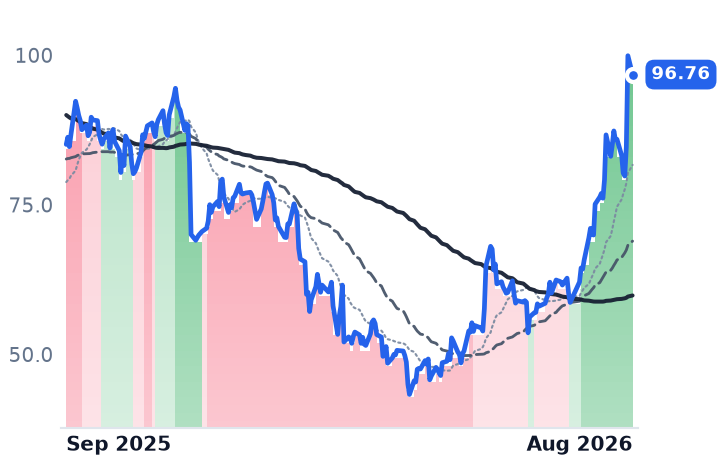
ESTCElasticData & Analytics Platforms🌱 Emerging Bull+34.6%+9.9%
TDCTeradataData Management & Analytics🟢 Cont. Bull−11.2%+37.5%

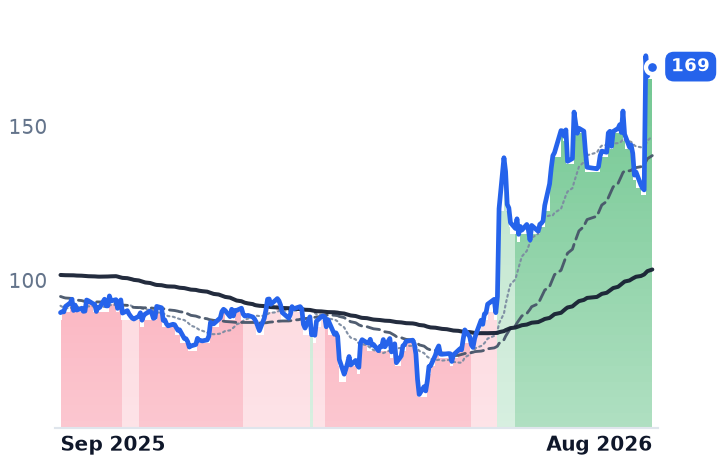
12-month price & trend

SNOW
Snowflake
319
−7.95 (−2.43%)
vs. prior close
Price20d50d150d
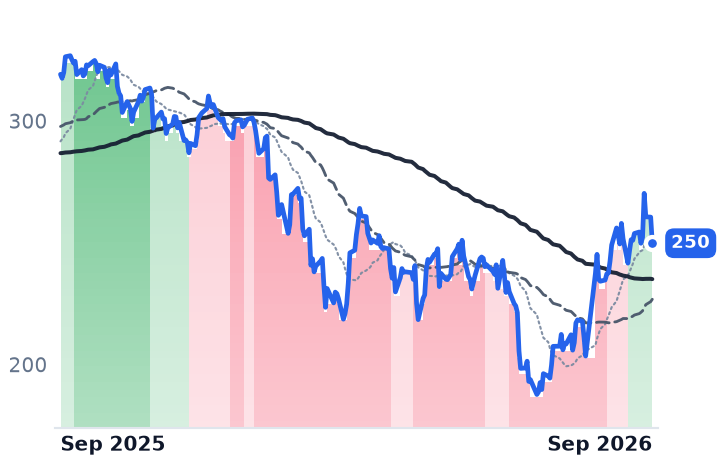
SNOW 12-month price
Data & Analytics Platforms
MDB
MongoDB
434
−19.16 (−4.23%)
vs. prior close
Price20d50d150d
MDB 12-month price
Data Management & Analytics
DDOG
Datadog
225
−10.38 (−4.41%)
vs. prior close
Price20d50d150d
DDOG 12-month price
Data & Analytics Platforms
TickerMkt capP/EP/E fwdP/SP/S fwdP/GPP/GP fwdEV/EBITDAFCF yld
SNOW$110.8Bn/m165.3x22.0x18.2x32.8x27.0xn/m1.1%
MDB$36.5Bn/m74.0x14.0x12.3x19.5x17.1x1.6%
DDOG$80.3B453.9x89.2x20.3x18.0x25.5x22.6x308.4x1.4%
ESTC
Elastic
93.55
−3.21 (−3.31%)
vs. prior close
Price20d50d150d
ESTC 12-month price
Data & Analytics Platforms
TDC
Teradata
28.51
−0.63 (−2.16%)
vs. prior close
Price20d50d150d
TDC 12-month price
Data Management & Analytics
TickerMkt capP/EP/E fwdP/SP/S fwdP/GPP/GP fwdEV/EBITDAFCF yld
ESTC$10.1B27.0x29.1x5.6x5.1x7.5x6.7x155.2x3.4%
TDC$2.6B5.6x10.2x1.5x1.6x2.5x2.6x3.2x28.6%

Consensus projections

TickerFY2026EFY2027EFY2028E
SNOWRevenue+29.4%+31.1%+26.0%
EPS+72.3%+59.6%+42.0%
MDBRevenue+23.1%+21.5%+18.0%
EPS+59.1%+27.3%+19.7%
DDOGRevenue+31.8%+22.4%+23.0%
EPS+25.3%+17.0%+22.2%
ESTCRevenue+17.6%+15.6%+14.6%
EPS+30.3%+32.3%+17.4%
TDCRevenue+0.3%+1.3%+2.1%
EPS+12.6%+7.5%+11.2%

Forward fiscal years only. Blank means no analyst coverage for that year.

The format Snowflake used to own

Snowflake's product documentation now prices, in plain terms, the arrangement its business model was built to make impossible. For an externally managed table in Apache Iceberg — the open storage format that has become the industry standard for large analytic datasets — the data files and the Iceberg metadata sit in the customer's own cloud object storage, paid for by the customer to their own cloud provider. Snowflake bills only the compute and cloud services used to process queries. On that data it collects no storage revenue whatsoever.

That is the smaller half. Snowflake's Horizon Catalog lets Spark, Trino, Flink or a hyperscaler engine read those same tables directly, and billing for the catalog interface is scheduled to begin in the second half of 2026 at 0.5 credit per million calls, charged as cloud services. When somebody else's engine serves the query, Snowflake earns fractions of a credit per million calls in place of the warehouse credits the same query would have burned inside its platform. Storage was never the money; the compute chained to the storage was, and the chain is now optional. Snowflake made Iceberg version 3 generally available at its June Summit and built two-way interoperability into the catalog — conceding the format and defending the catalog and governance layers instead.

What cannot be counted

How much of Snowflake's book already runs this way is unknowable from outside. The company reports product revenue as a single consumption figure covering compute, storage and data transfer, does not break out storage, and has never quantified external-table workload share. Databricks, its closest rival for the same analytics and machine-learning workloads and still private, reached roughly $7bn of annualized revenue in July, up more than 80% — it owns Tabular, founded by Iceberg's creators, and can point its engine at the same bytes.

What can

The measurable part is good and getting better. Total revenue growth ran 28.7%, then 30.1%, then 33.5% across the last three reported quarters; product revenue reached $1.33bn, up 34%, with remaining performance obligations of $9.21bn, up 38%. Net revenue retention rose to 126%, and 779 customers now spend more than $1m a year, 29% more than a year ago. Roughly half that backlog converts within twelve months, so contracted commitments are being added faster than they are being burned. "Snowflake's AI workload is now a significant revenue engine in its own right," chief executive Sridhar Ramaswamy told investors on the May 27 call. Those AI services carry their own meter — since April 1 they bill in a separate currency at $2.00 to $2.20 per AI credit.

The cost side is where the strain shows. Gross margin peaked at 67.8% in the October 2025 quarter and has slipped two quarters running to 66.6%, and the $6bn five-year commitment to Amazon Web Services announced alongside the print — covering Arm-based Graviton chips and graphics processors — now sits in front of cost of revenue. Management's own full-year guide implies essentially no further product gross margin expansion. Repurchases are not filling the gap either: $873.5m of buybacks in fiscal 2026 against $1.62bn of trailing stock compensation left the diluted share count 3.8% higher, at 345.4m.

The part the business does not explain

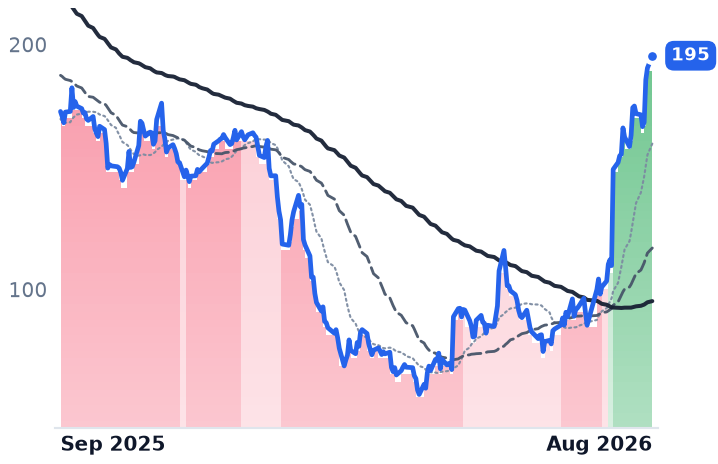
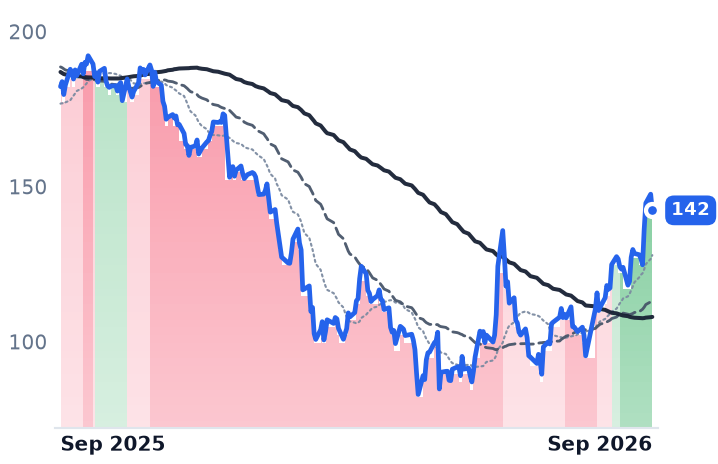
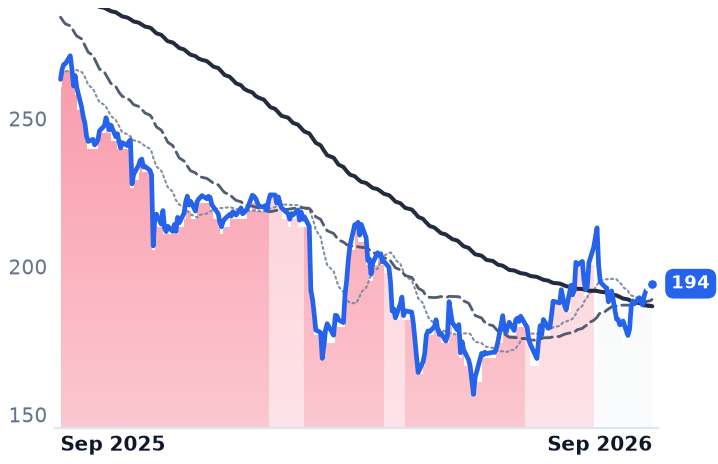
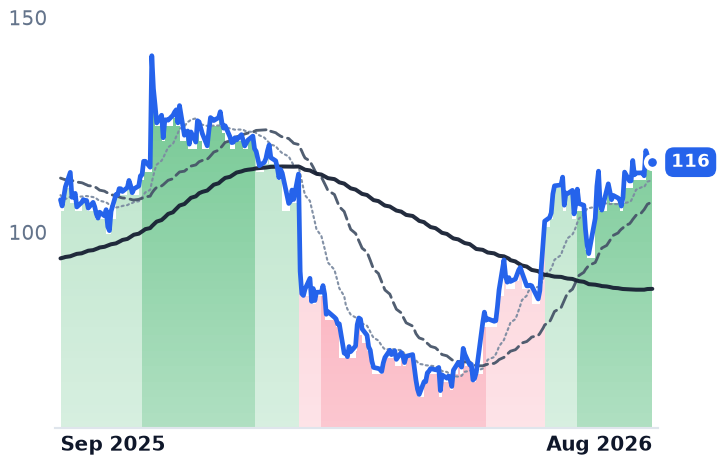
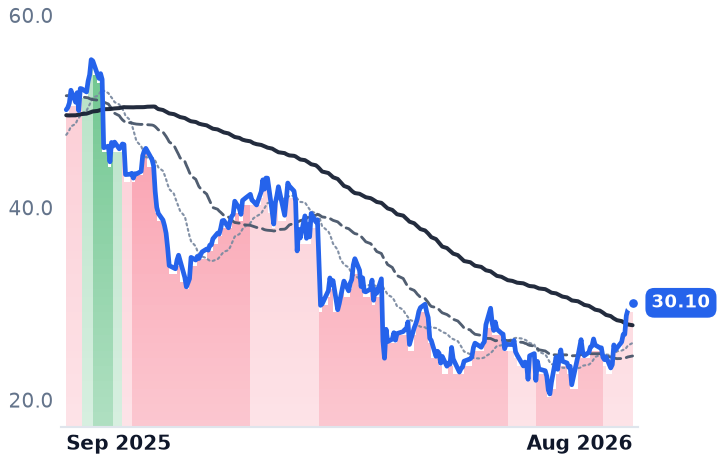
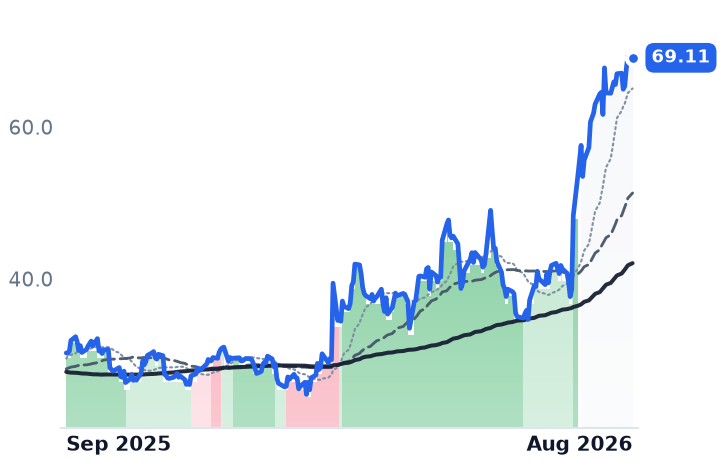
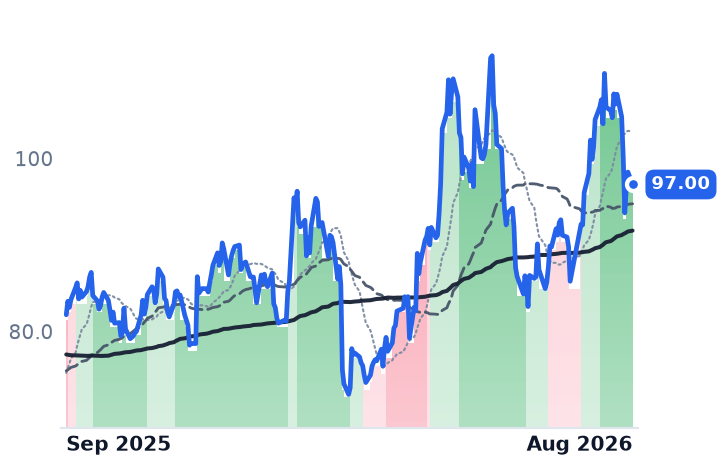
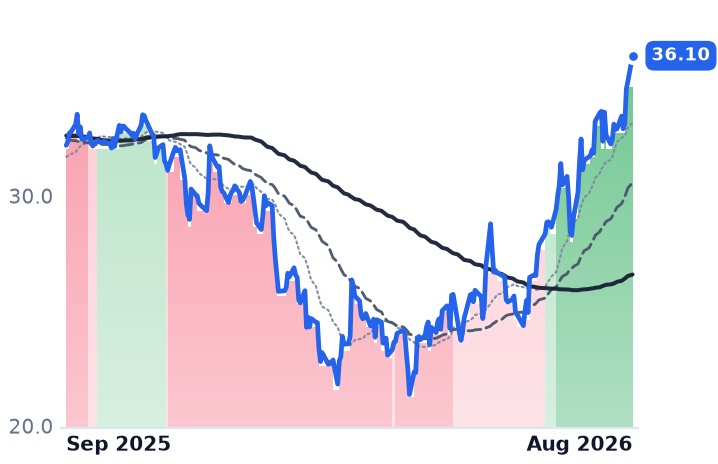
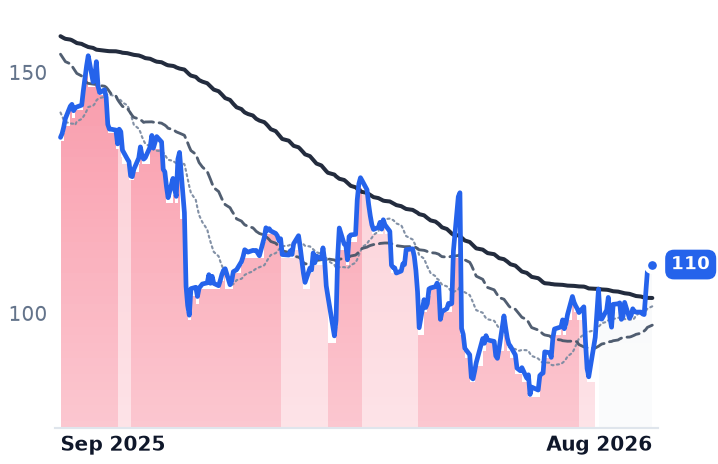
Shares have risen 81.9% since the day before the May print. Price to trailing gross profit has gone from 15.66x in early May to 27.73x in late July to 32.80x now — a doubling against gross profit that grew about a third — with forward earnings at 165 times and a trailing free-cash-flow yield near 1%. The last thirty days added 8.7% with no financial statement published inside the window, alongside August target raises from UBS to $425 and Citizens to $408 on a survey in which 14 of 15 customers planned to raise spending. Peers went every direction over the same stretch — Elastic up 42%, Datadog down 16% — so a uniform re-rating of data software is not the explanation; broker enthusiasm ahead of a print is the likelier one.

So: acceleration, retention and backlog earn a re-rating, and the first leg after May was the business being repriced for something real. The second leg is a bet on a capture rate nobody can observe — that data living in customers' own buckets still routes its queries through Snowflake's warehouses rather than through Glue, Unity Catalog or a Trino cluster. Guidance for the quarter reported on September 2 puts product revenue at $1.415bn to $1.42bn, implying growth near 30%.

Nobody outside the company can count how many queries against Snowflake-governed data are already being served by someone else's engine. Starting later this year, Snowflake will at least be billing for the ones it can see.
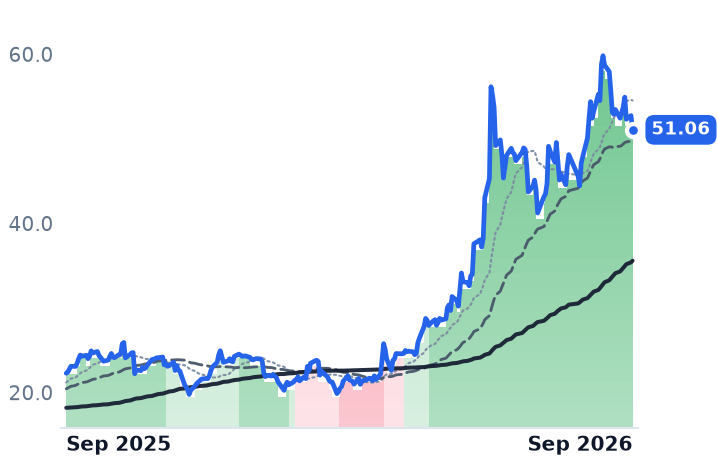
Dell Repriced Faster Than Memory Costs Rose; NetApp Conceded Two Points of Gross Margin

Hypothesis Opus 5 · Research Opus 5 · Writing Opus 5 · Prompt v1.6

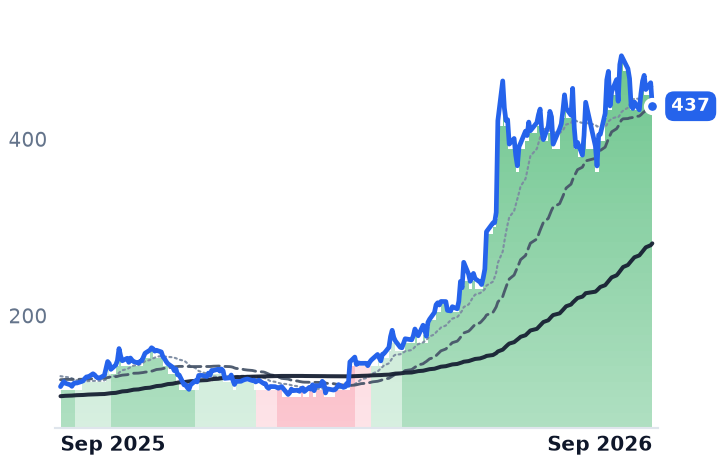
Memory is the largest bought-in component in an AI server or a flash array, its contract prices have roughly doubled this year, and the three big enterprise hardware vendors are not handling the bill the same way. Dell's July quarter, out after Tuesday's close, shows group gross margin back to 20.93% from 17.75% in the April quarter, with Infrastructure Solutions operating margin at 15% and the full-year revenue guide raised $25bn to $192bn.

NetApp is on the other side: it has guided fiscal 2027 gross margin to 68.5-69.5% against 71.3%, roughly $149m of gross profit given away, and its finance chief has already called the July quarter the trough. HPE reports the same day as NetApp, with consensus modelling margin expansion straight through the shock. Dell's business earns its result; its shares, down over three months, do not yet reflect it.

DELLHPENTAPMUSNDKWDCSTXMemory Cost InflationDRAM & NAND SupplyAI Server BuildoutEnterprise Flash StorageHardware Pricing PowerGross Margin Compression
TickerCompanySegmentTrend · 13mo30D1Y
The subject · what this brief is about
DELLDell TechnologiesEnterprise Storage & Software🟢 Cont. Bull+1.9%+265.5%
HPEHewlett Packard EnterpriseEnterprise Storage & Software🟢 Cont. Bull+1.9%+129.2%
NTAPNetAppEnterprise Storage & Software🟢 Cont. Bull−1.3%+58.8%
Compared against · context, not the story
MUMicron TechnologyMemory (DRAM/NAND)🟢 Cont. Bull+13.8%+696.3%
SNDKSandiskSpecialty Manufacturing & Components🟢 Cont. Bull+21.7%+2970.0%
WDCWestern DigitalData Storage Devices🟢 Cont. Bull−14.4%+452.5%
STXSeagate TechnologyData Storage Devices🟢 Cont. Bull−2.3%+380.0%

12-month price & trend

DELL
Dell Technologies
437
−26.64 (−5.74%)
vs. prior close
Price20d50d150d
DELL 12-month price
Enterprise Storage & Software
HPE
Hewlett Packard Enterprise
51.06
−1.68 (−3.18%)
vs. prior close
Price20d50d150d
HPE 12-month price
Enterprise Storage & Software
NTAP
NetApp
181
−6.32 (−3.38%)
vs. prior close
Price20d50d150d
NTAP 12-month price
Enterprise Storage & Software
TickerMkt capP/EP/E fwdP/SP/S fwdP/GPP/GP fwdEV/EBITDAFCF yld
DELL$282.1B24.3x22.4x1.9x1.6x9.4x8.2x17.4x2.7%
HPE$67.3B46.6x14.8x1.7x1.5x5.3x4.5x20.7x5.9%
NTAP$35.9B28.5x20.3x5.2x4.8x7.3x6.7x18.7x5.2%
MU
Micron Technology
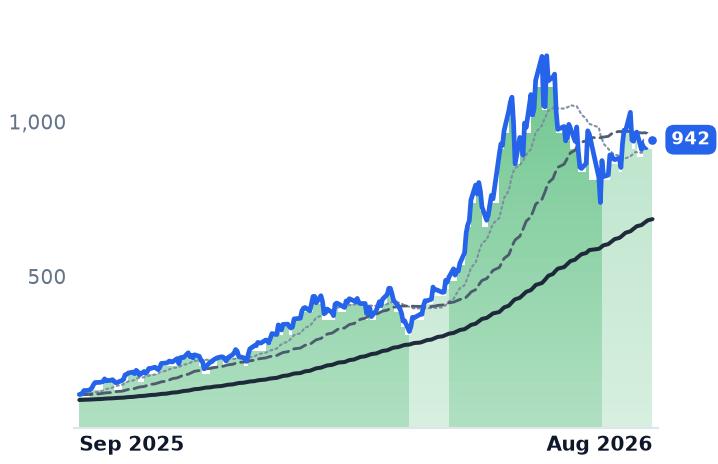
942
+9.18 (+0.98%)
vs. prior close
Price20d50d150d
MU 12-month price
Memory (DRAM/NAND)
SNDK
Sandisk
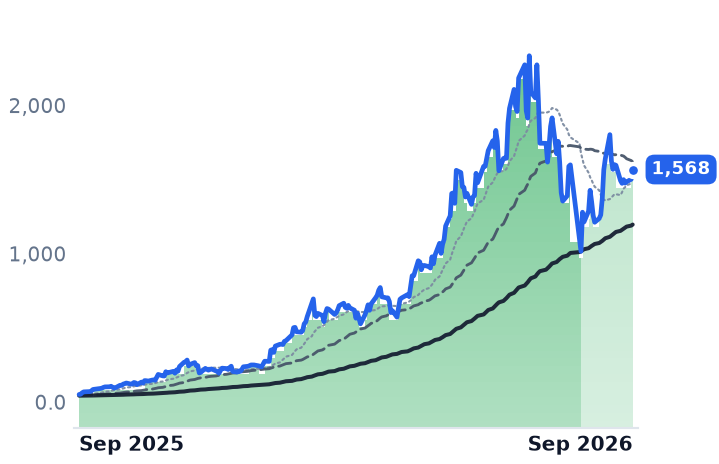
1,568
+66.10 (+4.40%)
vs. prior close
Price20d50d150d
SNDK 12-month price
Specialty Manufacturing & Components
WDC
Western Digital
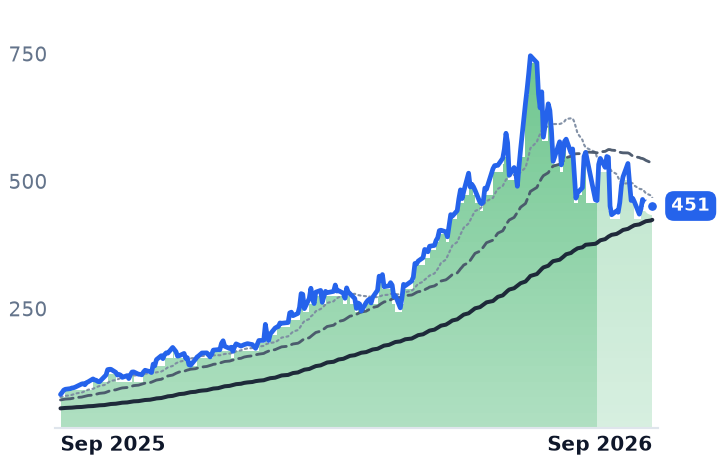
451
+4.99 (+1.12%)
vs. prior close
Price20d50d150d
WDC 12-month price
Data Storage Devices
TickerMkt capP/EP/E fwdP/SP/S fwdP/GPP/GP fwdEV/EBITDAFCF yld
MU$1.0T19.9x12.2x11.2x7.8x15.4x10.7x14.5x2.6%
SNDK$232.3B20.2x7.5x11.5x4.8x16.1x6.7x17.4x4.9%
WDC$166.1B25.6x48.3x14.1x12.9x31.1x28.4x31.1x1.7%
STX
Seagate Technology
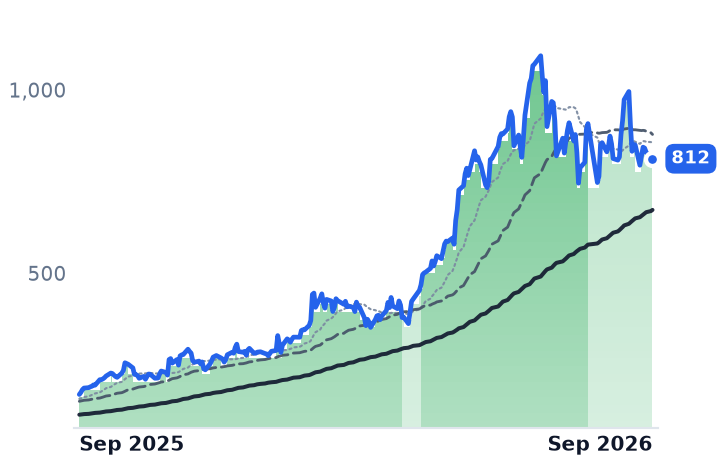
812
−0.08 (−0.01%)
vs. prior close
Price20d50d150d
STX 12-month price
Data Storage Devices
TickerMkt capP/EP/E fwdP/SP/S fwdP/GPP/GP fwdEV/EBITDAFCF yld
STX$178.4B73.9x53.5x16.2x14.8x39.0x35.7x53.6x1.5%

Consensus projections

TickerFY2026EFY2027EFY2028E
DELLRevenue+16.2%+55.6%+15.2%
EPS+27.3%+90.4%+22.5%
HPERevenue+30.5%+11.6%+5.8%
EPS+81.3%+18.7%+10.1%
NTAPRevenue+4.3%+10.1%+5.7%
EPS+10.4%+13.1%+11.5%
MURevenue+248.0%+92.8%+11.4%
EPS+804.9%+111.2%+7.9%
SNDKRevenue+174.4%+143.0%+18.2%
EPS+2369.0%+214.5%+22.1%
WDCRevenue+36.9%+37.2%+26.5%
EPS+106.2%+72.8%+48.0%
STXRevenue+32.7%+35.9%+24.9%
EPS+86.9%+77.9%+48.0%

Forward fiscal years only. Blank means no analyst coverage for that year.

Dell began raising list prices in the middle of December 2025, as memory contract prices were doubling. The quarter it reported after Tuesday's close is the first clean accounting of whether the increases stuck, and they did: group gross margin recovered to 20.93% from 17.75% in the April quarter, against 18.29% a year earlier.

That matters beyond one print because dynamic random-access memory (DRAM) and NAND flash are the largest bought-in components in both an artificial-intelligence server and an enterprise storage array, and the industry has already decided who is protected from the increase. Several US cloud providers hold multi-year supply agreements that restrict their suppliers from raising prices, TrendForce reports, so the increases fall on volumes sold outside those contracts — the position occupied by hardware makers quoting into enterprise and channel deals. NetApp and Hewlett Packard Enterprise both report on 2 September, and the question each answers is whether it repriced or absorbed.

The cost side is not subtle

Enterprise solid-state drive contract prices rose about 80% quarter on quarter in the first quarter of 2026 and a further 70-75% in the second, outpacing DRAM for the first time in the cycle before moderating toward a forecast 10-15% in the third. Server DRAM is guided up 13-18% quarter on quarter in the current quarter. The supply arithmetic behind it: registered memory module bit supply grows only 15-20% a year, well short of server processor shipment growth.

Dell repriced; the numbers followed

Dell, the largest AI server maker by volume and a seller of servers, storage and PCs from Round Rock, Texas, moved early and publicly. It raised PC prices 15-20% from mid-December, then repriced tens of thousands of open quotes on 6 January by compressing discounts. "We're repricing, it feels like, every day," chief operating officer Jeff Clarke said of the pace.

July-quarter revenue of $46.971bn rose 57.7%, while operating income rose 204% — more than three times the revenue rate. Infrastructure Solutions, which ships the servers and storage, posted a 15% operating margin, up 620 basis points from a year earlier, on record segment revenue of $31.8bn. Storage revenue grew 26% and traditional servers 122%, so this is not an AI-mix illusion. Dell lifted full-year guidance by $25bn to $192bn of revenue, with adjusted earnings of $25.50 a share, and reported gross profit dollars up 78%.

Two things sit underneath. Inventory roughly doubled to $21.29bn from $10.44bn at the January year-end, faster than first-half sales grew, according to coverage of the release — component buying ahead of price rises. And the backlog is the exposure: "We exited the quarter with a record $95 billion of AI backlog," Clarke told investors on 1 September. Backlog is struck at quoted prices and ships into later component costs.

NetApp is eating it

NetApp, which sells all-flash arrays built on its ONTAP software plus native storage services inside all three big clouds, is the most flash-levered of the three and has guided fiscal 2027 gross margin to 68.5-69.5% from 71.3%, roughly $149m of foregone gross profit on its own revenue guide of 6-9% growth. Chief financial officer Wissam Jabre told the April-quarter call the "July quarter is more or less the trough" for product margin, with relief only as its own price increases take effect later. That trough quarter is what it reports on 2 September. It trades at 20.3x forward earnings and $7.34 of market value per dollar of trailing gross profit, down from $8.17 on 22 August on price alone.

HPE, whose server and storage business now carries an acquired Juniper networking portfolio, guided its July quarter to $11.5-12.1bn of revenue and adjusted earnings of $0.88-0.93 a share. Consensus has its margins expanding through the shock, with earnings before interest, taxes, depreciation and amortization at 20.5% of revenue this year and higher next. It is the cheapest of the three on forward earnings at 14.79x, though on enterprise value, which charges the Juniper debt, 20.75x trailing EBITDA puts it above Dell.

The verdict

Dell's shares fell 6.1% over the three months to Tuesday, including 5.74% in the session before the release, while HPE gained 12.7% and NetApp 3.0%. On 22 August, Dell cost $12.04 for each dollar of trailing gross profit; after the July quarter entered the window it costs $9.42, a de-rating of roughly a fifth done by profit rather than by price. The operating result is earned — repricing machinery, an AI customer base past 6,500, operating expense at 8% of revenue. What the accounts do not explain is the share price, and the honest caution is the $95bn of backlog quoted before the next round of increases.

The split now has a test date. NetApp has pre-announced its own trough and HPE's consensus assumes it never had one; both print on Wednesday, and only one of those can be right about a bill that has to land somewhere.

The suppliers already know where. Micron's shares are up roughly 695% over the twelve months its customers have spent arguing about who pays.

Figma Grew 48% and Still Trailed Its Whole Software Group in August's AI Rally

Hypothesis Opus 5 · Research Opus 5 · Writing Opus 5 · Prompt v1.6

Figma's shares have been climbing since late August, but none of the move originated at Figma. The last tranche of post-listing lock-up shares — about 77.7m, roughly 15% of the float — came free on August 8 and the price rose into the supply; the 13% jump on August 27 followed Salesforce's quarter, not any Figma disclosure.

Underneath, the franchise is compounding: revenue reached $370.1m in the June quarter, a third straight acceleration, net dollar retention held at 136%, and customers above $100,000 of annual recurring revenue grew 46%. What the de-rating genuinely earns sits in the cost line — gross margin fell to 83.7% from 88.8% as artificial-intelligence inference landed in cost of revenue, and $316.6m of first-half stock compensation turned a small operating profit into a $117.3m loss.

At 9.02x forward sales against Adobe's 4.39x for roughly a third the growth, the multiple is no longer the problem. Guidance is: management guided the September quarter to 36% growth.

FIGADBETEAMGTLBCRMUCollaborative Design SoftwareAI Inference CostsIPO Lock-Up SupplyStock-Based CompensationEnterprise SaaS RetentionGenerative Design Competition
TickerCompanySegmentTrend · 13mo30D1Y
The subject · what this brief is about
FIGFigmaDesign & Content Creation🔴 Cont. Bear+9.6%−58.3%
Compared against · context, not the story
ADBEAdobeDesign & Content Creation🔴 Cont. Bear+14.7%−16.6%
TEAMAtlassianDeveloper Tools & DevOps🌱 Emerging Bull+80.2%+8.0%
GTLBGitLabDeveloper Tools & DevOps🌱 Emerging Bull+24.6%−6.5%
CRMSalesforceCustomer Experience & CRM🔴 Cont. Bear+37.8%+2.2%
UUnity SoftwareDesign & Content Creation🟢 Cont. Bull+23.1%+4.3%

12-month price & trend

FIG
Figma
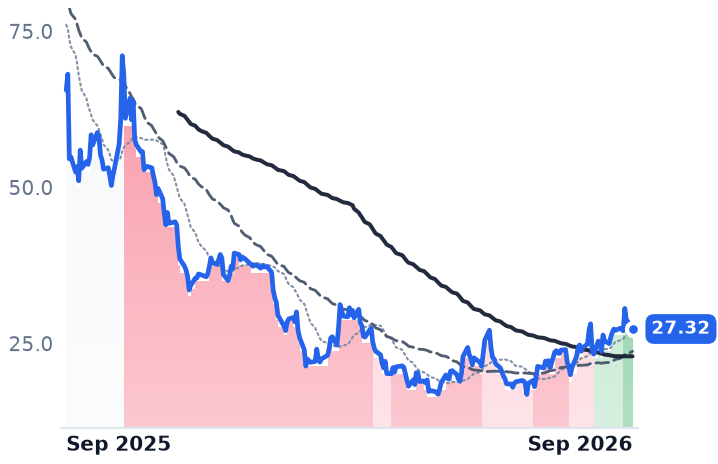
27.32
−0.40 (−1.44%)
vs. prior close
Price20d50d150d
FIG 12-month price
Design & Content Creation
ADBE
Adobe
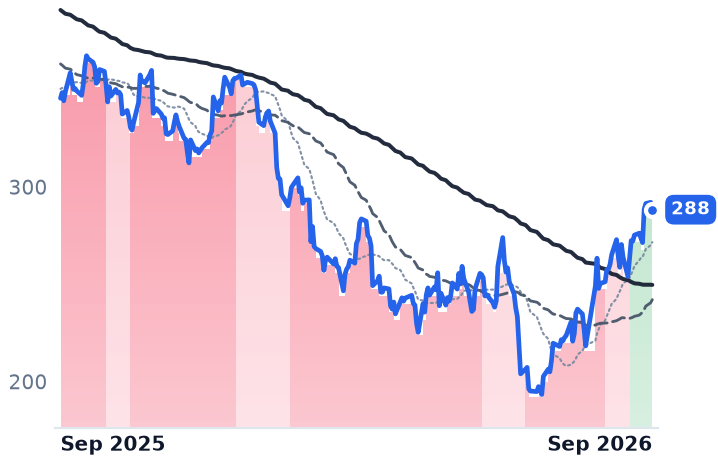
288
−3.78 (−1.29%)
vs. prior close
Price20d50d150d
ADBE 12-month price
Design & Content Creation
TEAM
Atlassian
186
−9.02 (−4.61%)
vs. prior close
Price20d50d150d
TEAM 12-month price
Developer Tools & DevOps
TickerMkt capP/EP/E fwdP/SP/S fwdP/GPP/GP fwdEV/EBITDAFCF yld
FIG$13.3Bn/m94.9x10.3x9.0x13.1x11.4xn/m1.7%
ADBE$116.4B16.7x12.0x4.6x4.4x5.2x4.9x11.9x9.1%
TEAM$50.0Bn/m34.6x7.6x6.7x9.0x7.9x331.1x2.6%
GTLB
GitLab
44.59
−1.22 (−2.66%)
vs. prior close
Price20d50d150d
GTLB 12-month price
Developer Tools & DevOps
CRM
Salesforce
256
−4.58 (−1.75%)
vs. prior close
Price20d50d150d
CRM 12-month price
Customer Experience & CRM
U
Unity Software
41.09
−0.95 (−2.26%)
vs. prior close
Price20d50d150d
U 12-month price
Design & Content Creation
TickerMkt capP/EP/E fwdP/SP/S fwdP/GPP/GP fwdEV/EBITDAFCF yld
GTLB$7.6Bn/m55.5x7.6x6.8x8.7x7.9xn/m3.5%
CRM$211.4B23.5x15.8x4.8x4.6x6.2x5.9x15.5x7.2%
U$19.8Bn/m9.8x9.3x15.9x15.1xn/m2.7%

Consensus projections

TickerFY2026EFY2027EFY2028E
FIGRevenue+40.5%+23.8%+24.1%
EPS−24.4%+26.7%+34.5%
ADBERevenue+12.0%+9.1%+8.8%
EPS+17.2%+12.7%+14.2%
TEAMRevenue+24.7%+15.4%+14.7%
EPS+55.5%−0.1%+21.6%
GTLBRevenue+25.6%+17.8%+15.3%
EPS+40.9%−8.9%+25.2%
CRMRevenue+9.3%+11.4%+9.6%
EPS+17.4%+38.4%−2.0%
URevenue+16.1%+14.5%+15.8%
EPS−211.3%−157.9%+88.3%

Forward fiscal years only. Blank means no analyst coverage for that year.

The supply cleared, and then someone else's earnings arrived

The final block of shares held back by Figma's post-listing lock-up came free on August 8 — some 77.7m shares under an agreement signed in August 2025 with holders of about 54.1% of the Class A stock, releasing on the second trading day after the June-quarter results. Roughly 15% of the float became sellable, and the price rose about 15% over the following fortnight.

That is the useful fact about the turn in Figma's shares, which have held an uptrend since August 26 with the 50-day average above the 200-day. The company itself has disclosed nothing since its August 5 report. The single biggest session of the advance, a 13.2% gain on August 27, followed Salesforce's second-quarter beat, which recast artificial intelligence for software investors as a revenue line rather than a cost; Atlassian rose 8% the same day. Figma, which sells a browser-based collaborative design canvas to product and engineering teams, was a passenger.

The franchise underneath is compounding

Revenue in the June quarter was $370.1m, up 48.2% — a third consecutive acceleration, from 38% two quarters earlier. Net dollar retention held at 136%. Paid customers above $10,000 of annual recurring revenue numbered 15,964, up 34%, and those above $100,000 reached 1,635, up 46%. International revenue grew 50%. Full-year guidance rose $40m to $1.463–1.467bn, and the quarter threw off $53.2m of free cash flow against $1.7bn of cash.

"Q2 was Figma's third straight quarter of accelerated revenue growth, and as code gets commoditized and value moves up the stack, the opportunity ahead of us has only grown," chief executive Dylan Field told investors on August 5.

What the de-rating does earn

The damage is in the cost line. Gross margin fell to 83.7% from 88.8% a year earlier as inference costs landed in cost of revenue, though it recovered four points from the March quarter. Code Layers, Motion, Weave, the Figma agent and production-code support in Make consume no paid credits and are excluded from guidance — inference expense today, revenue at some unstated later date. And $316.6m of stock-based compensation in the first half, against $7.5m a year before, turned a small operating profit into a $117.3m operating loss. Diluted shares rose only 8.2%, so dilution is not what the market is repricing; the reported loss is.

Competition arrived this spring, when Anthropic launched Claude Design and Canva shipped a foundation-model release within a day of each other, attacking an interface-design position estimated at 80–90% share. Figma also lost its chief product officer, chief marketing officer and sitting chief technology officer in one announcement on the August call.

The lag, and the price of it

From August 3 to September 1 Figma gained 9.6%. Atlassian gained 80.2%, Salesforce 37.8%, GitLab 24.6% and Adobe 14.7%. The stock fell 14.9% the session after its own results and needed another company's print three weeks later to recover. It sits 62% above its June low of $16.84 and 76% below its first trading close of $115.50, with short interest reported by a secondary source at roughly 11% of shares outstanding, undated.

At 9.02x forward sales and 11.40x forward gross profit, against roughly 64x trailing sales at the listing close, the multiple has compressed by around 85% while revenue nearly doubled. Adobe, growing about 12%, trades at 4.39x forward sales — meaning Figma's premium is roughly proportionate to its growth. There is no earnings support: the forward price-to-earnings ratio of 94.9x rests on a non-GAAP consensus of $0.29 a share.

So the honest split: the margin compression and the swing to a GAAP loss justify part of a 58% twelve-month decline, and the acceleration in revenue and retention justifies none of the rest. August did not resolve it — the supply overhang ended and the sector re-rated, neither of which is information about Figma.

The next thing that can be is the September quarter, which management has already guided to 36% growth as last year's pricing change anniversaries. Figma has not confirmed a date for it.

Salesforce Prices Agent Actions at $0.10; Seats Still Bill Two-Thirds of Its Revenue

Hypothesis Opus 5 · Research Opus 5 · Writing Opus 5 · Prompt v1.6

Salesforce's newly disclosed subscription split answers the question the whole application-software group has been trading on, and not in the direction the re-rating implies. The seat-billed core — Sales, Service, Marketing, Commerce and Slack — is $7.2bn of the quarter's subscription revenue and grew 8% in constant currency. The faster-growing data and platform half looks like a usage story until you remove Informatica, consolidated this year, which supplied $440m of roughly $600m of that half's dollar growth.

The metered product is real and small: Agentforce annual recurring revenue passed $1.5bn, about 3.5% of the annualized subscription run-rate. The monetization lever management pushed hardest on the August 26 call was a premium-seat upgrade. Contracted backlog growth earns part of the August move; the pricing migration itself has not happened.

CRMNOWTEAMHUBSADBEORCLWDAYMSFTFront-Office SaaSAgentic AI MonetizationConsumption-Based PricingSeat License EconomicsEnterprise Data IntegrationSoftware M&A Consolidation
TickerCompanySegmentTrend · 13mo30D1Y
The subject · what this brief is about
CRMSalesforceCustomer Experience & CRM🔴 Cont. Bear+37.8%+2.2%
Compared against · context, not the story
NOWServiceNowSpecialized Enterprise Solutions🌱 Emerging Bull+24.7%−21.9%
TEAMAtlassianDeveloper Tools & DevOps🌱 Emerging Bull+80.2%+8.0%
HUBSHubSpotCustomer Experience & CRM🔴 Cont. Bear+4.2%−47.0%
ADBEAdobeDesign & Content Creation🔴 Cont. Bear+14.7%−16.6%
ORCLOracleCloud Infrastructure & Platforms🔴 Cont. Bear−0.5%−36.9%
WDAYWorkdayEnterprise Resource Planning🌱 Emerging Bull+20.3%−13.3%
MSFTMicrosoftCloud Infrastructure & Platforms🔴 Cont. Bear+2.5%−0.7%

12-month price & trend

CRM
Salesforce
256
−4.58 (−1.75%)
vs. prior close
Price20d50d150d
CRM 12-month price
Customer Experience & CRM
NOW
ServiceNow
142
−5.22 (−3.54%)
vs. prior close
Price20d50d150d
NOW 12-month price
Specialized Enterprise Solutions
TEAM
Atlassian
186
−9.02 (−4.61%)
vs. prior close
Price20d50d150d
TEAM 12-month price
Developer Tools & DevOps
TickerMkt capP/EP/E fwdP/SP/S fwdP/GPP/GP fwdEV/EBITDAFCF yld
CRM$211.4B23.5x15.8x4.8x4.6x6.2x5.9x15.5x7.2%
NOW$132.8B79.8x31.6x9.0x8.2x12.1x11.0x39.8x3.4%
TEAM$50.0Bn/m34.6x7.6x6.7x9.0x7.9x331.1x2.6%
HUBS
HubSpot
250
−12.04 (−4.60%)
vs. prior close
Price20d50d150d
HUBS 12-month price
Customer Experience & CRM
ADBE
Adobe
288
−3.78 (−1.29%)
vs. prior close
Price20d50d150d
ADBE 12-month price
Design & Content Creation
ORCL
Oracle
141
−8.28 (−5.55%)
vs. prior close
Price20d50d150d
ORCL 12-month price
Cloud Infrastructure & Platforms
TickerMkt capP/EP/E fwdP/SP/S fwdP/GPP/GP fwdEV/EBITDAFCF yld
HUBS$13.4B92.2x19.6x3.9x3.6x4.7x4.4x44.5x5.7%
ADBE$116.4B16.7x12.0x4.6x4.4x5.2x4.9x11.9x9.1%
ORCL$433.0B25.3x18.7x6.4x4.8x9.8x7.3x17.4x-5.5%
WDAY
Workday
199
+0.12 (+0.06%)
vs. prior close
Price20d50d150d
WDAY 12-month price
Enterprise Resource Planning
MSFT
Microsoft
500
−11.05 (−2.16%)
vs. prior close
Price20d50d150d
MSFT 12-month price
Cloud Infrastructure & Platforms
TickerMkt capP/EP/E fwdP/SP/S fwdP/GPP/GP fwdEV/EBITDAFCF yld
WDAY$53.6B41.6x18.5x5.3x5.0x6.6x6.3x32.8x5.3%
MSFT$3.8T28.6x26.1x11.5x9.8x17.0x14.4x19.0x1.7%

Consensus projections

TickerFY2026EFY2027EFY2028E
CRMRevenue+9.3%+11.4%+9.6%
EPS+17.4%+38.4%−2.0%
NOWRevenue+22.4%+18.7%+18.6%
EPS+17.1%+23.2%+21.4%
TEAMRevenue+24.7%+15.4%+14.7%
EPS+55.5%−0.1%+21.6%
HUBSRevenue+18.2%+14.2%+14.0%
EPS+38.2%+25.9%+18.4%
ADBERevenue+12.0%+9.1%+8.8%
EPS+17.2%+12.7%+14.2%
ORCLRevenue+17.8%+33.2%+45.5%
EPS+25.3%+7.6%+35.6%
WDAYRevenue+13.4%+11.8%+10.5%
EPS+26.5%+21.9%+19.5%
MSFTRevenue+18.0%+18.6%+19.5%
EPS+26.7%+16.0%+19.0%

Forward fiscal years only. Blank means no analyst coverage for that year.

Salesforce has started reporting its subscription line in two pieces, and the pieces settle an argument that has been running through enterprise software all year. The seat-billed core — Sales, Service, Marketing, Commerce and Slack — came in at $7.2bn for the July quarter, growing 8% in constant currency, while Data 360, headless platform and other revenue reached $3.6bn and grew 20%. Two-thirds of the $10.82bn subscription book is still billed by the human logging in.

That matters beyond one print because the answer the market took from Salesforce's August 26 results — that artificial-intelligence revenue adds to seat revenue instead of eating it — lifted the entire group. Salesforce sells customer-relationship-management software, from pipeline and service desks to Tableau analytics, the MuleSoft integration tools and Slack, to enterprises that buy it a license at a time. If agents genuinely displace those licenses, the per-seat model inverts. The company has now published enough to check.

The meter is real, and it is small

Agentforce is priced per action, not per user: an agent action costs 20 Flex Credits, or $0.10, with a voice action at $0.15 and credits sold in 100,000-credit packs for $500, billed monthly in arrears. Consumption shows up in a customer dashboard. Roughly half of Agentforce bookings in the quarter came from existing customers refilling credits, with 2,000 new paying customers in production, up about 70% sequentially — the meter is being consumed and re-bought. Agentforce annual recurring revenue passed $1.5bn, up more than 240%, though the definition was widened this quarter to include Slackbot and headless products. Against an annualized subscription run-rate near $43bn, $1.5bn is about 3.5%.

Nor is the fast-growing half of the business mostly usage. Informatica, consolidated this year and absent from the year-ago base, contributed $440m of subscription revenue. The data-and-platform side grew roughly $600m year over year on the disclosed splits, which puts about three-quarters of the growth in Salesforce's consumption-adjacent segment down to an acquisition.

The lever management leaned on hardest was a seat lever. Only 5% of knowledge workers in sales and service sit on premium tiers, which carry a 60% to 80% price premium — that upgrade, not a credit meter, is the near-term monetization path executives described. Four pricing models now coexist: per-seat, Flex Credits, usage-based, and outcome-based deals under negotiation with accounts spending $40m or more. The scale ambition is not in doubt. "The Army Human Resources Command expects to drive up to 55 million Agentforce conversations every single month," chief executive Marc Benioff told investors on the August 26 call. What is missing is any aggregate unit: no seat count, no agent count, no total credits consumed.

What the shares priced

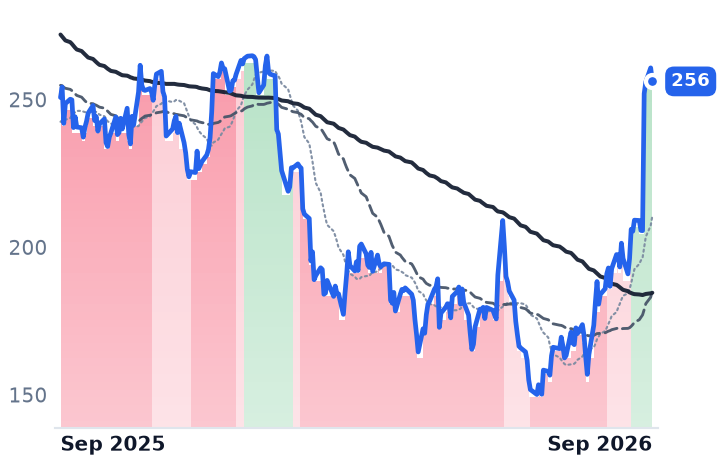
The stock had been in a downtrend from September 2025 until mid-August, when its 50-day average crossed back above its 200-day; it then gained 22.58% on August 27, its second-best session on record. Price-to-gross-profit has gone from 4.47x on July 29 to 6.23x, a 39% re-rating in five weeks, against a trailing price-to-earnings ratio of 23.5x. The 15.83x forward multiple is flattered: the earnings guidance raise of $2.60 at the midpoint is almost entirely the $2.53 per share of unrealized gain on Salesforce's Anthropic stake, and on the pre-raise midpoint of $14.09 the shares sit near 18.3x.

Underneath, the income statement did not participate. Reported growth decelerated to 10.8%, and near 6.4% without Informatica. Gross margin fell 145 basis points. Operating income was flat year over year. Per-share growth came from a share count cut from 962m to 821m, financed by a $25bn accelerated repurchase funded with $25bn of debt that lifted quarterly interest expense from $67m to $473m and halved full-year free-cash-flow growth guidance to 4-5%.

One line genuinely earns part of August: current remaining performance obligation of $33.5bn, up 14% in constant currency, three points faster than revenue and a point ahead of guidance. Contracted work is growing faster than recognized work, which is what a demand recovery looks like before it reaches the profit-and-loss statement. What nothing in the disclosure explains is a 39% expansion in what buyers pay for each dollar of gross profit while organic growth slowed and operating profit stood still.

So the migration thesis fails on the evidence available, and something better replaces it: Salesforce has not moved its revenue onto a meter, it has added a small one alongside a seat business whose upgrade ceiling — 95% of relevant workers on standard tiers — is the actual story. Whether that ceiling gets sold is testable on December 8, when the second-half organic re-acceleration management promised either shows up without another acquisition attached, or does not.

GitLab Beat Its Guidance by Five Points While Paying Customers Grew Only 8%

Hypothesis Opus 5 · Research Opus 5 · Writing Opus 5 · Prompt v1.6

GitLab's bookings and its paying-account meter told opposite stories in the quarter it reported after the close on Tuesday. Revenue of $286.3m came in five percentage points of growth above the company's own guide, and chief executive Bill Staples claimed record gross bookings — but customers with more than $5,000 of annual recurring revenue grew just 8% year on year, roughly a third the pace of revenue, and dollar-based net retention held at 117% against 118% for the prior fiscal year.

Underneath, the agent economics showed up on the wrong line. Gross margin fell to 84.1% from 87.9% a year earlier, so gross profit grew 16% while revenue grew 21%. Premium seats carry twelve free artificial-intelligence credits a month and Ultimate twenty-four as a launch promotion; that work consumes inference GitLab pays for and bills nobody. The shares have risen 29% in a month into a print the market had not yet seen.

GTLBTEAMMSFTFROGCDNSSNPSADSKPTCDevOps PlatformsAI Coding AgentsUsage-Based BillingSeat Licensing EconomicsInference Cost PressureDeveloper Tools Software
TickerCompanySegmentTrend · 13mo30D1Y
The subject · what this brief is about
GTLBGitLabDeveloper Tools & DevOps🌱 Emerging Bull+24.6%−6.5%
Compared against · context, not the story
TEAMAtlassianDeveloper Tools & DevOps🌱 Emerging Bull+80.2%+8.0%
MSFTMicrosoftCloud Infrastructure & Platforms🔴 Cont. Bear+2.5%−0.7%
FROGJFrogDeveloper Tools & DevOps🟢 Cont. Bull+14.6%+93.1%
CDNSCadence Design SystemsDeveloper Tools & DevOps🌱 Emerging Bull−5.9%−7.7%
SNPSSynopsysEDA & Design Tools🔴 Cont. Bear+7.0%−29.2%
ADSKAutodeskDesign & Content Creation🔴 Cont. Bear+6.4%−21.7%
PTCPTCSpecialized Enterprise Solutions🔴 Cont. Bear+9.2%−28.2%

12-month price & trend

GTLB
GitLab
44.59
−1.22 (−2.66%)
vs. prior close
Price20d50d150d
GTLB 12-month price
Developer Tools & DevOps
TEAM
Atlassian
186
−9.02 (−4.61%)
vs. prior close
Price20d50d150d
TEAM 12-month price
Developer Tools & DevOps
MSFT
Microsoft
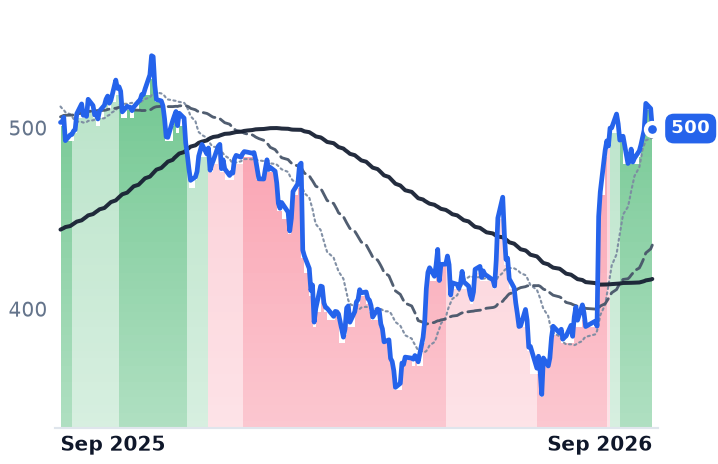
500
−11.05 (−2.16%)
vs. prior close
Price20d50d150d
MSFT 12-month price
Cloud Infrastructure & Platforms
TickerMkt capP/EP/E fwdP/SP/S fwdP/GPP/GP fwdEV/EBITDAFCF yld
GTLB$7.6Bn/m55.5x7.6x6.8x8.7x7.9xn/m3.5%
TEAM$50.0Bn/m34.6x7.6x6.7x9.0x7.9x331.1x2.6%
MSFT$3.8T28.6x26.1x11.5x9.8x17.0x14.4x19.0x1.7%
FROG
JFrog
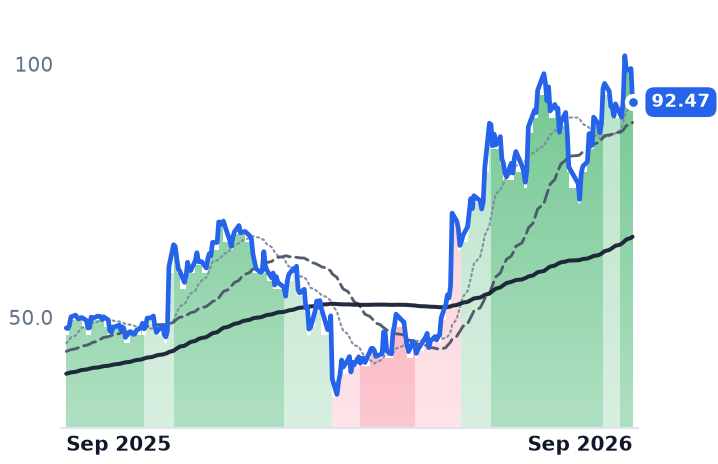
92.47
−6.64 (−6.69%)
vs. prior close
Price20d50d150d
FROG 12-month price
Developer Tools & DevOps
CDNS
Cadence Design Systems
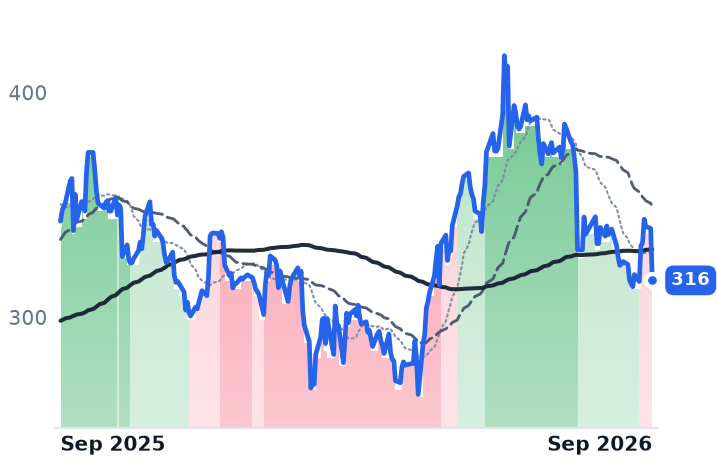
316
−23.12 (−6.81%)
vs. prior close
Price20d50d150d
CDNS 12-month price
Developer Tools & DevOps
SNPS
Synopsys
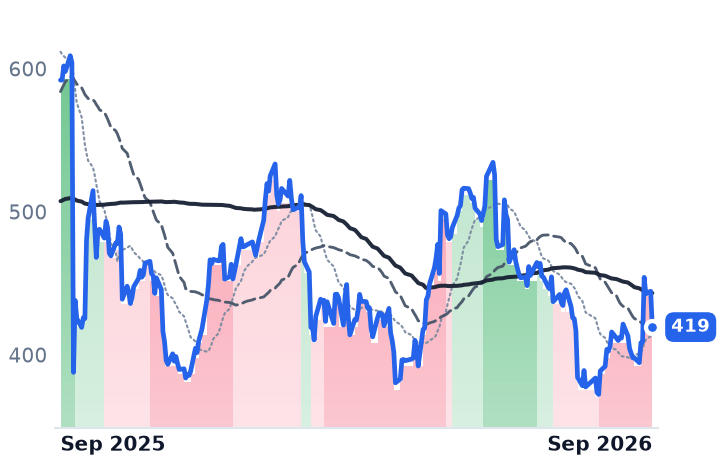
419
−25.03 (−5.63%)
vs. prior close
Price20d50d150d
SNPS 12-month price
EDA & Design Tools
TickerMkt capP/EP/E fwdP/SP/S fwdP/GPP/GP fwdEV/EBITDAFCF yld
FROG$10.9Bn/m92.0x18.2x16.7x23.4x21.5xn/m1.6%
CDNS$94.6B67.9x42.2x16.2x15.0x18.3x16.9x43.8x1.8%
SNPS$87.1B187.9x30.8x9.2x9.0x12.8x12.4x30.7x3.2%
ADSK
Autodesk
250
−10.72 (−4.11%)
vs. prior close
Price20d50d150d
ADSK 12-month price
Design & Content Creation
PTC
PTC
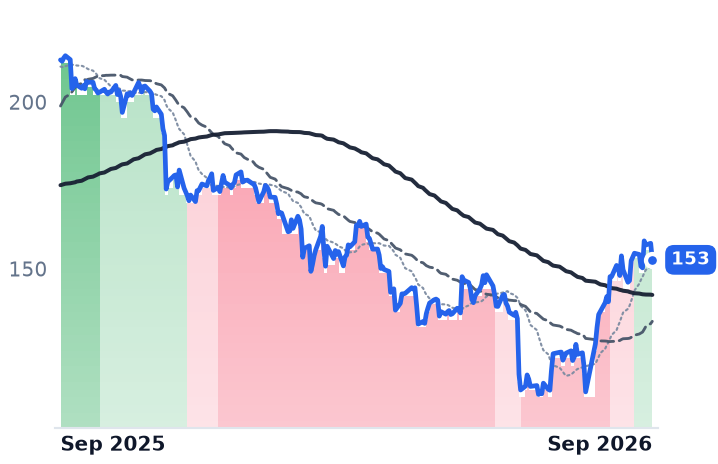
153
−4.96 (−3.15%)
vs. prior close
Price20d50d150d
PTC 12-month price
Specialized Enterprise Solutions
TickerMkt capP/EP/E fwdP/SP/S fwdP/GPP/GP fwdEV/EBITDAFCF yld
ADSK$55.0B33.6x20.7x7.1x6.6x7.7x7.3x24.1x5.1%
PTC$16.9B14.1x17.9x5.7x6.2x6.8x7.4x10.8x5.5%

Consensus projections

TickerFY2026EFY2027EFY2028E
GTLBRevenue+25.6%+17.8%+15.3%
EPS+40.9%−8.9%+25.2%
TEAMRevenue+24.7%+15.4%+14.7%
EPS+55.5%−0.1%+21.6%
MSFTRevenue+18.0%+18.6%+19.5%
EPS+26.7%+16.0%+19.0%
FROGRevenue+24.2%+17.7%+18.3%
EPS+23.8%+16.8%+26.0%
CDNSRevenue+19.7%+13.6%+11.7%
EPS+15.3%+17.0%+14.3%
SNPSRevenue+37.4%+10.9%+11.9%
EPS+15.2%+16.9%+18.0%
ADSKRevenue+17.0%+15.9%+10.7%
EPS+23.0%+22.9%+12.5%
PTCRevenue+4.9%+6.2%+7.5%
EPS+20.1%+8.5%+10.5%

Forward fiscal years only. Blank means no analyst coverage for that year.

GitLab reported fiscal second-quarter results after the US market close on Tuesday, its first hard numbers since June, and they land on both sides of the argument the company has been trading on all summer. Revenue of $286.3m, up 21%, beat the company's own guidance of $272m–$274m by about five percentage points of growth. The count of paying accounts did not keep up: customers above $5,000 of annual recurring revenue reached 11,114, up 8% year on year, and those above $100,000 reached 1,571, up 17%.

That gap is the whole question at GitLab, which sells a single platform for planning, building, securing and shipping software and bills for it by the human developer seat. Roughly thirteen points of the quarter's growth came from existing customers spending more — tier mix, price, expansion — rather than from new paying accounts. Dollar-based net retention was 117%, unchanged from the April quarter and down from 118% for fiscal 2026 and 123% the year before.

The credits are priced; the promotion is not

The agent layer is no longer a free giveaway with no meter behind it. Since the Duo Agent Platform went generally available in January, agentic usage has carried a list price of $1 per credit, with agentic code review at $0.25 a review. But Premium seats include twelve credits per user per month and Ultimate twenty-four, described by GitLab as a time-limited launch promotion. Every agent invocation inside that allotment burns third-party inference and compute GitLab pays for and charges the customer nothing.

It shows. Gross margin fell to 84.1% from 87.9% a year earlier, and gross profit grew 16.0% against revenue growth of 21.3% — a widening of the same gap visible in the April quarter. The paid consumption run rate, which GitLab first disclosed in June and restated in a July business update, had surpassed $20m at the end of June — under 2% of an annualized revenue base near $1.14bn. The metered line is real and small; the metered cost is real and already in the margin.

Microsoft's GitHub has converged on the same structure, moving all Copilot plans to usage-based billing on 1 June, with $19-a-seat Business including $19 of monthly credits and promotional allowances on top. The industry did not abandon the developer seat. It turned the seat into an entry fee and subsidized the meter behind it.

What the bookings say

"Q2 was an exceptional quarter, with record gross bookings and net ARR growth exceeding 40% year over year," Staples said in the 1 September release. He added that "as AI drives more software creation and more work through the development lifecycle, the context, security, governance and control GitLab provides become increasingly valuable." GitLab raised full-year revenue guidance to $1.112bn–$1.118bn.

The contracted book does not yet corroborate it. Total remaining performance obligations grew 16% to $1.2bn and the current portion grew 20%, both below the 21% revenue line and both slower than the April quarter. That kills the bear case that lengthening contracts were flattering revenue, and replaces it with something less comfortable: backlog is growing more slowly than the profit-and-loss statement. GAAP operating loss widened to $56.9m, a negative 20% margin, against a positive 15% on the non-GAAP presentation.

The verdict

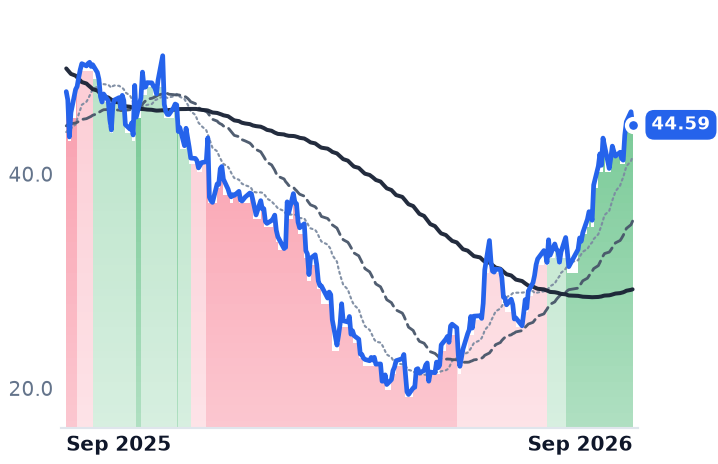
The shares closed at $44.59 on Tuesday, up 29% in a month and 74% off the 21 May low of $25.62, still 7% below where they stood a year ago — and that close predates the print entirely. On recomputed trailing figures the company is valued at about 8.4 times gross profit, against 6.4 times on 29 July and 4.6 times in early May. Forward earnings sit at 55.5 times consensus of $0.81 for this fiscal year, which is 9% below the $0.89 consensus for the year just finished.

So the business earns part of the move: a guidance beat, a raised year, bookings management calls a record. It does not yet earn the rest. Reported growth decelerated for a fifth straight quarter, the paying base expanded at a third the rate of revenue, margin gave up nearly four points, and backlog fell behind the income statement. A 37% expansion in the price paid per dollar of gross profit in five weeks is a bet on bookings converting before the credits stop being free.
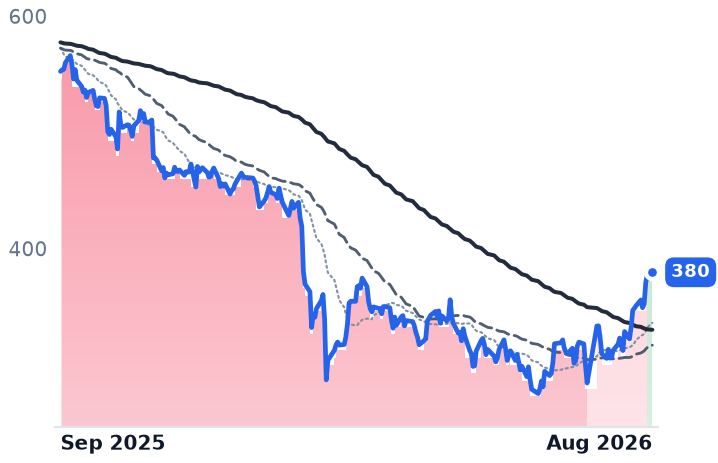
GitLab has guided the October quarter to $281m–$283m, sequentially below the one it just reported. The date that matters more is the one it has not set: when the promotional credits expire and enterprises find out what the agent work they already run actually costs.

As Crashes Get Rarer, CCC Now Bills 85% by Subscription and 15% by the Claim

Hypothesis Opus 5 · Research Opus 5 · Writing Opus 5 · Prompt v1.6

CCC Intelligent Solutions gets paid when American drivers wreck their cars, and Americans are wrecking fewer of them. The company's own Crash Course data put repairable claims down 9.7% in 2025 and total-loss frequency at a record 23.1% of claims, while insurers file rate cuts citing lower accident frequency.

Rather than ride that meter down, CCC has moved its mix from roughly 80% subscription to about 85% and converts transactional carriers at renewal. Second-quarter revenue rose 9.8% to $285.9m, with artificial-intelligence products above $120m annualized supplying four of the ten growth points and net dollar retention at 107.

The shares are up over three months anyway — but the advance dates to July reports of a sale process and an Elliott stake, not to the numbers.

CCCCPRTVRSKSPSCAVPTAuto Insurance ClaimsCollision Repair SoftwareSubscription Revenue MixClaims AI AutomationVertical SaaS NetworksActivist-Driven Sale Process
TickerCompanySegmentTrend · 13mo30D1Y
The subject · what this brief is about
CCCCCC Intelligent SolutionsBusiness Software & Automation🌱 Emerging Bull+15.6%−25.7%
Compared against · context, not the story
CPRTCopartVehicle & Asset Auctions🔴 Cont. Bear+10.2%−33.3%
VRSKVerisk AnalyticsSoftware - Services🔴 Cont. Bear+0.6%−26.2%
SPSCSPS CommerceBusiness Software & Automation🔴 Cont. Bear+10.1%−22.0%
AVPTAvePointBusiness Software & Automation🌱 Emerging Bull+1.0%−16.9%

12-month price & trend

CCC
CCC Intelligent Solutions
7.28
−0.22 (−2.93%)
vs. prior close
Price20d50d150d
CCC 12-month price
Business Software & Automation
CPRT
Copart
32.35
−0.90 (−2.69%)
vs. prior close
Price20d50d150d
CPRT 12-month price
Vehicle & Asset Auctions
VRSK
Verisk Analytics
194
−0.46 (−0.24%)
vs. prior close
Price20d50d150d
VRSK 12-month price
Software - Services
TickerMkt capP/EP/E fwdP/SP/S fwdP/GPP/GP fwdEV/EBITDAFCF yld
CCC$4.3B109.8x16.1x3.8x3.7x5.2x5.0x17.4x7.2%
CPRT$31.1B20.1x20.5x6.7x6.7x14.9x14.9x13.3x4.5%
VRSK$21.3B24.1x21.2x6.9x6.6x10.2x9.8x14.9x5.3%
SPSC
SPS Commerce
83.16
−2.02 (−2.37%)
vs. prior close
Price20d50d150d
SPSC 12-month price
Business Software & Automation
AVPT
AvePoint
13.50
−0.47 (−3.33%)
vs. prior close
Price20d50d150d
AVPT 12-month price
Business Software & Automation
TickerMkt capP/EP/E fwdP/SP/S fwdP/GPP/GP fwdEV/EBITDAFCF yld
SPSC$2.9B39.0x16.5x3.8x3.7x5.4x5.3x15.0x6.8%
AVPT$3.0B41.8x31.1x6.4x5.8x8.7x7.9x35.7x3.4%

Consensus projections

TickerFY2026EFY2027EFY2028E
CCCRevenue+10.1%+8.9%+8.1%
EPS+26.0%+16.2%+13.1%
CPRTRevenue−1.0%+4.5%+6.8%
EPS+1.9%+6.5%+8.0%
VRSKRevenue+4.9%+6.8%+6.4%
EPS+10.2%+13.2%+11.8%
SPSCRevenue+5.1%+6.3%+7.2%
EPS+18.8%+8.6%+13.3%
AVPTRevenue+22.9%+20.5%+19.7%
EPS+33.4%+10.4%+28.6%

Forward fiscal years only. Blank means no analyst coverage for that year.

Fewer Americans are crashing their cars, and the software company that gets paid when they do has spent the past year rearranging how it bills. CCC Intelligent Solutions — the cloud network that carries collision estimates, total-loss valuations, parts orders and casualty claims between insurers, repair shops and adjusters — reported second-quarter revenue of $285.9m on 30 July, up 9.8%, on a network whose underlying unit count is shrinking.

That gap is the whole story, and it is newer than the sale headlines around it. CCC's Crash Course 2026 report, released 31 March, found repairable claims down 9.7% in 2025, total-loss frequency at a record 23.1% of claims, and average paid bodily-injury severity up 10.3% year on year. Small claims are vanishing fastest: appraisals under $2,000 fell from 41.5% of the mix in 2019 to 25.5% through mid-2025 as deductibles rose. The feedback loop is now visible in premiums — insurers are filing rate reductions citing reduced accident frequency, including an approved 7.6% decrease for Allstate in some states.
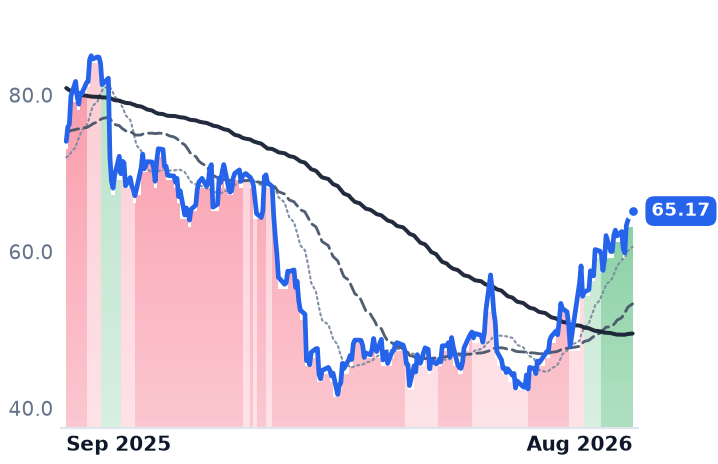
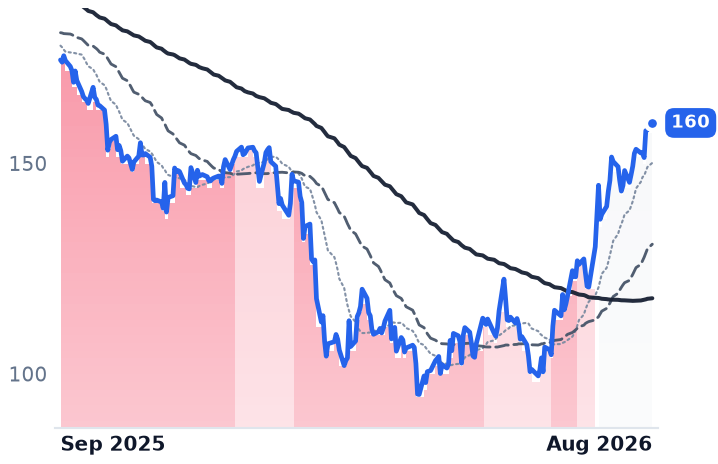
Billing away from the meter

CCC's answer has been to sell the network by contract rather than by event. Historically about 80% subscription and 20% transactional, the mix is now roughly 85/15, with chief financial officer Brian Herb describing proactive conversion of transactional clients to subscription at renewal. What replaces volume is attach. In the second quarter, cross-sell and upsell into the existing base supplied 7.5 points of growth and new customers 2.5; software net dollar retention rose to 107 from 106 for 2025, with gross retention of 98%.

The attach is mostly artificial intelligence. "We are a scale player in AI today, generating more than $120 million of annualized revenue from AI-based solutions that are growing at nearly 50% year-over-year," chief executive Githesh Ramamurthy told investors on the July 30 call. Those products are about 11% of revenue and delivered four of the quarter's ten growth points. Penetration is early: CCC disclosed with its fourth-quarter results that more than 125 insurers and over 15,000 repair facilities had adopted AI solutions, but the share of claim volume actually processed through the models runs from low single digits to low double digits.

The strategy works, and it is losing ground. Growth has stepped down from 12.7% to 11.8% to 9.8% across three quarters, with the second half guided near 9% including a one-point headwind from a legacy casualty fleet customer leaving. Gross profit grew 8.6% against revenue's 9.8% as newer AI products carry lower margins — adjusted gross margin slipped to 76% from 78%. And diluted shares fell 9.7% year on year on a $300m accelerated repurchase, so per-share arithmetic is doing work demand is not. EvolutionIQ, the $730m casualty-AI acquisition that closed in early 2025, is fully in the base; management calls the raised $1.161bn full-year guide organic.

What the shares are actually pricing

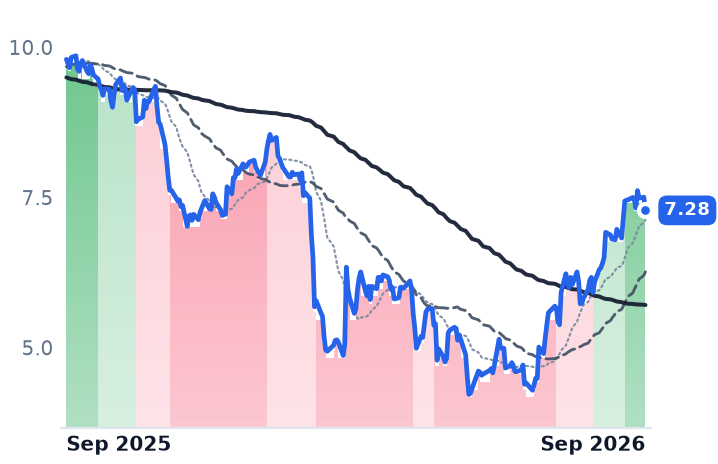
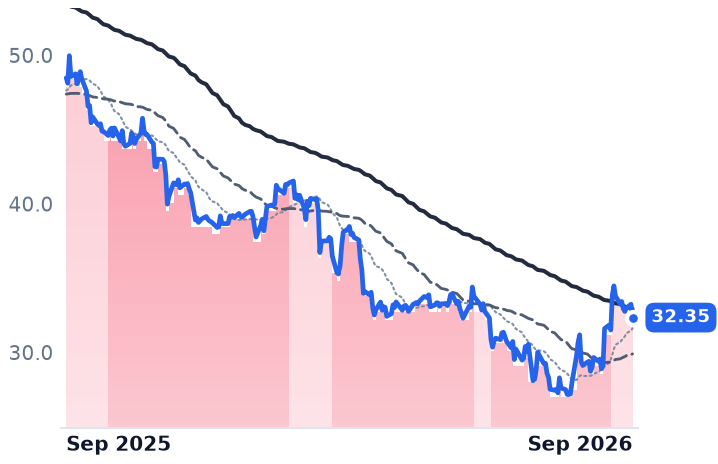
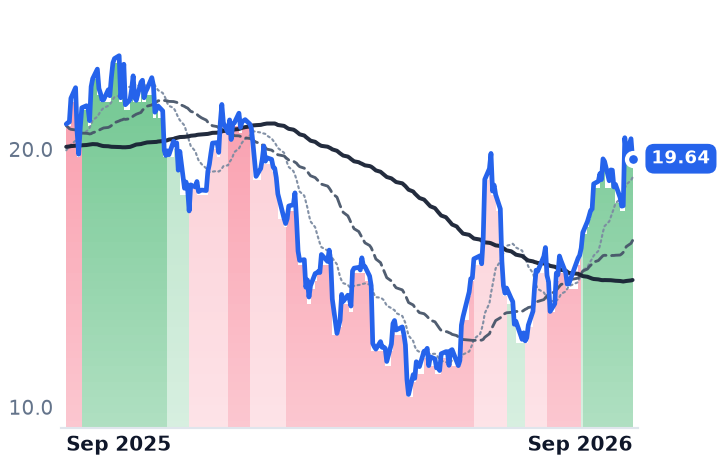
Over twelve months CCC is down about 26% while trailing free cash flow rose 36% to $308m. The recovery since June — a 42% three-month advance — traces to two dates rather than to results: Reuters reported on 9 July that CCC had hired Morgan Stanley to explore a sale, and Bloomberg reported the next day that Elliott had built a large stake. On 18 August Bloomberg reported that salvage-auction operator Copart is in talks against private-equity bidders GTCR and Veritas Capital. Shares rose 10% on the Elliott report and 4.6% on the Copart report.

So the business earns the mix shift and the retention; it does not earn the re-rating. At about 16x forward earnings, against roughly 22x implied by its own price a year ago on the same 2026 estimate, CCC is cheaper than it was — and part of that discount is earned. Claims keep falling. General Motors' February design-patent suits and its trade complaint at the International Trade Commission unusually name CCC and rival Mitchell International alongside parts makers. And on 7 August Solera launched Qapter Direct Dispatch, designed to let insurers send estimate assignments to any shop with an email address regardless of platform — aimed squarely at the network lock-in that is CCC's moat.

A vendor that converts a shrinking transaction stream into contracted subscriptions buys itself years, not permanence: each renewal is repriced against a claim count that is smaller than the last one. What a buyer would be acquiring is the $2trn of historical claims data and 30,500 connected repair shops behind that billing — assets that outlast the meter. What a holder owns until someone signs is a business guided to single-digit growth in a market where the underlying event is disappearing.

SailPoint Paid About $200m for Entro and Still Won't Put a Dollar on Agent Identity

Hypothesis Opus 5 · Research Opus 5 · Writing Opus 5 · Prompt v1.6

The company that governs who — and what — may touch enterprise data is growing its cloud subscriptions ten percentage points faster than its total book, and has guided the year to slow down anyway. SailPoint's software-as-a-service annual recurring revenue reached $781m in the April quarter, up 36%, against total recurring revenue of $1.163bn, up 26%; the remaining licence and maintenance third grew roughly 9%.

Management then guided fiscal 2027 recurring revenue to $1.36–1.37bn, 21–22% growth against 28% delivered last year, and the shares fell about 12% on 9 June. Its largest accounts, those above $1m, rose 32% to 225. The August re-rating came on a competitor's results; the 9 September report is SailPoint's first chance in three months to supply its own.

SAILOKTANon-Human Identity SecurityAgentic AI Enterprise AdoptionOn-Prem To SaaS MigrationCybersecurity M&ASponsor-Backed Software IPOs
TickerCompanySegmentTrend · 13mo30D1Y
The subject · what this brief is about
SAILSailPointIdentity & Access Management🌱 Emerging Bull+14.2%−6.4%
Compared against · context, not the story
OKTAOktaIdentity & Access Management🌱 Emerging Bull+19.6%+89.3%

12-month price & trend

SAIL
SailPoint
19.64
−0.77 (−3.80%)
vs. prior close
Price20d50d150d
SAIL 12-month price
Identity & Access Management
OKTA
Okta
169
+3.15 (+1.90%)
vs. prior close
Price20d50d150d
OKTA 12-month price
Identity & Access Management
TickerMkt capP/EP/E fwdP/SP/S fwdP/GPP/GP fwdEV/EBITDAFCF yld
SAIL$11.1Bn/m9.9x15.0x853.3x1.7%
OKTA$27.6B98.4x42.3x9.0x8.6x11.5x11.0x68.3x3.5%

Consensus projections

TickerFY2026EFY2027EFY2028E
OKTARevenue+12.0%+10.8%+9.9%
EPS+24.3%+14.1%+10.6%

Forward fiscal years only. Blank means no analyst coverage for that year.

SailPoint closed its purchase of Entro Security, a Tel Aviv specialist in non-human identity, on 29 June in a deal reported at roughly $200m. When the company — which governs which employees, contractors, service accounts and AI agents may reach which applications, and was founded in Austin in 2005 — reports fiscal second-quarter results on 9 September, it will be the first period to carry Entro. It will almost certainly not carry a disclosed dollar of agent-identity revenue.

That gap is the story. SailPoint's unit of billing is an identity governed, and machine identities already outnumber human ones by something between 82 and 109 to one, which is why the meter is supposed to expand mechanically as software agents proliferate. What the company actually reports is a migration: customers moving off the self-hosted IdentityIQ product onto Identity Security Cloud, its subscription platform.

The mix is doing the work

In the quarter ended 30 April, SailPoint's total annual recurring revenue reached $1.163bn, up 26%, while subscription recurring revenue reached $781m, up 36%. Subscriptions are now about 67% of the base against 64% two quarters earlier. The arithmetic leaves the licence-and-maintenance remainder growing around 9% — the company is cannibalizing its own slower third, and guides 90–95% of net new recurring revenue to the subscription line, so that third keeps shrinking.

The expansion is concentrated at the top. Accounts above $1m of recurring revenue rose 32% to 225; accounts above $250k rose 24%. Net revenue retention was 113% in the January quarter, a point below the 114% before it. At its June investor day the company targeted more than $2.1bn of recurring revenue by fiscal 2029, with over $800m from AI-driven products and an on-premises migration it says delivers two to four times the prior spend per customer.

What management will not say

"In the new era of Agentic AI, identity security is the most critical layer of the enterprise security stack," founder and chief executive Mark McClain told investors on the 9 June call, adding that SailPoint is in the "very early innings" of the shift. The agentic pipeline doubled quarter over quarter; the company builds "very minimal" emerging-AI revenue into guidance. Okta's chief financial officer Brett Tighe used near-identical language on 26 August: agent revenue is "[s]till immaterial. Still very small."

The hard number went the other way. Fiscal 2027 recurring revenue is guided to $1.36–1.37bn, or 21–22% growth against 28% delivered, and the shares fell about 12% on 9 June despite beating on both lines. September's guide is for recurring revenue near $1.22bn and revenue near $310m.

The balance sheet is cleaner than the sponsor history suggests: the term loans were repaid at the February 2025 listing with a $15.3m write-off of deferred finance costs, stock compensation ran at 14% of revenue last quarter, and free cash flow was $32.5m against minus $100.7m a year earlier — though the business still lost $79.8m at the operating line. Thoma Bravo retained roughly 86% of the stock at the initial public offering and holds rights to demand registered sales.

The verdict

The subscription meter is real and is compounding at a rate the reported total understates. What the last month's advance rests on is not: SailPoint sold at 14.96x trailing gross profit against about 22.6x at its $23.00 listing, but also against roughly 8.0x at April's low, and its 27 August jump came on Okta's and CrowdStrike's results rather than its own — Okta, growing 10.6%, fetches 11.5x the same measure. Twelve months of 26% compounding have left the shares slightly lower than a year ago.

On 9 September the company can either widen the subscription premium or confirm the deceleration it already guided to. Until an agent line is billed in dollars, the fastest-growing part of SailPoint is customers it already had, buying the same platform a second time.

Descartes Bought Extensiv and Landed in Manhattan Associates' Warehouse Market

Hypothesis Opus 5 · Research Opus 5 · Writing Opus 5 · Prompt v1.6

Two logistics-software vendors that never really competed now do. Descartes, which bills per customs filing and shipment document, spent about $120m in cash on 1 September for a cloud warehouse-management platform sold to third-party logistics providers — the socket Manhattan Associates sells into — nine days after paying roughly $100m for a freight-broker system.

That is roughly $245m across four deals in one fiscal year at a company that does not publish an organic-versus-acquired revenue split. Reported growth has accelerated four straight quarters to 15.7%, with operating margin at 33.3% against 27.4% a year earlier, while the freight meter ran the other way: Cass shipment volumes fell 9.3% year on year in August. Descartes reports on 10 September; the split is the whole question.

DSGXMANHPAYCWKINTAAPPFTYLDOCUSPSCPCTYBLKBAGYSBLBSYSupply-Chain SoftwareWarehouse Management SystemsBolt-On Acquisition GrowthFreight Volume DownturnCloud Subscription Transition
TickerCompanySegmentTrend · 13mo30D1Y
The subject · what this brief is about
DSGXThe Descartes SystemsSpecialized Enterprise Solutions🔴 Cont. Bear+5.4%−18.0%
MANHManhattan AssociatesSpecialized Enterprise Solutions🔴 Cont. Bear+17.8%+5.1%
Compared against · context, not the story
PAYCPaycom SoftwareHR & Workforce Management🌱 Emerging Bull+41.2%+8.8%
WKWorkivaSecurity & Compliance⚠️ Emerging Bear+30.7%+3.5%
INTAIntappSpecialized Enterprise Solutions🔴 Cont. Bear+29.8%−3.1%
APPFAppFolioSpecialized Enterprise Solutions🔴 Cont. Bear+22.4%−14.3%
TYLTyler TechnologiesFinancial Services Software🔴 Cont. Bear+24.2%−31.3%
DOCUDocuSignSpecialized Enterprise Solutions🌱 Emerging Bull+18.2%−12.0%
SPSCSPS CommerceBusiness Software & Automation🔴 Cont. Bear+12.8%−20.1%
PCTYPaylocityHR & Workforce Management🔴 Cont. Bear+14.2%−8.6%
BLKBBlackbaudSpecialized Enterprise Solutions🔴 Cont. Bear+9.0%−26.5%
AGYSAgilysysSpecialized Enterprise Solutions🌱 Emerging Bull+6.0%+8.1%
BLBlackLineFinancial Services Software🔴 Cont. Bear+2.6%−37.7%
BSYBentley Systems, IncorporatedSpecialized Enterprise Solutions🔴 Cont. Bear+3.8%−31.1%

12-month price & trend

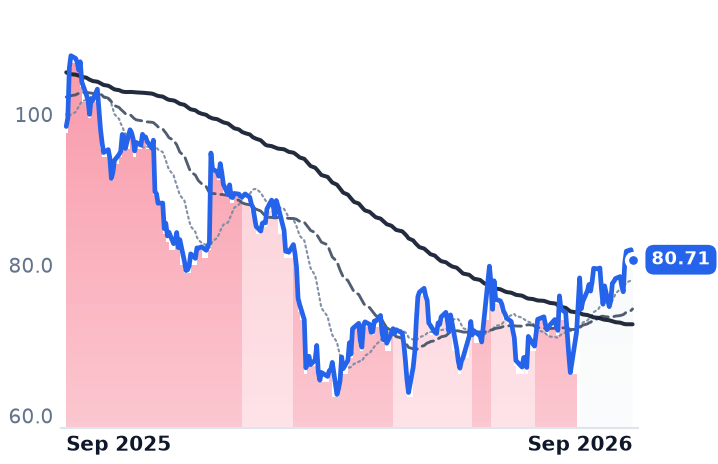
DSGX
The Descartes Systems
80.71
−1.33 (−1.62%)
vs. prior close
Price20d50d150d
DSGX 12-month price
Specialized Enterprise Solutions
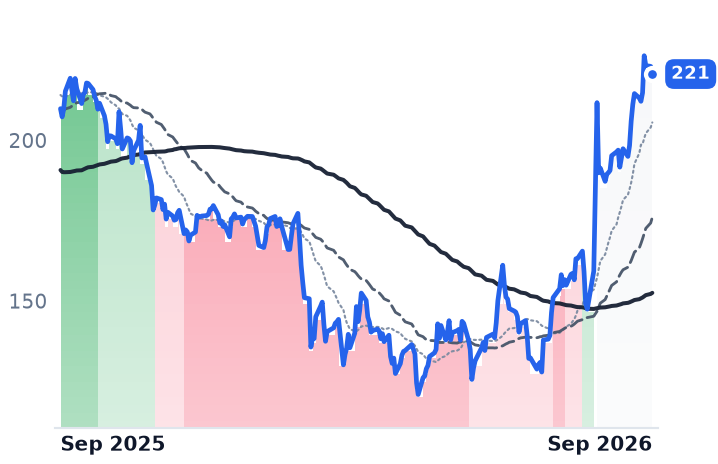
MANH
Manhattan Associates
221
−2.40 (−1.07%)
vs. prior close
Price20d50d150d
MANH 12-month price
Specialized Enterprise Solutions
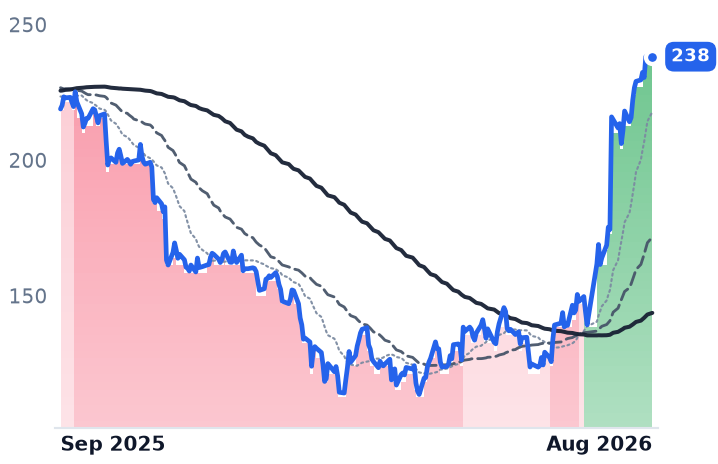
PAYC
Paycom Software
238
−0.35 (−0.15%)
vs. prior close
Price20d50d150d
PAYC 12-month price
HR & Workforce Management
TickerMkt capP/EP/E fwdP/SP/S fwdP/GPP/GP fwdEV/EBITDAFCF yld
DSGX$6.9B39.1x34.8x9.1x8.5x12.6x11.8x20.3x4.1%
MANH$12.8B62.5x40.0x11.4x11.0x20.8x20.1x43.8x3.1%
PAYC$10.8B25.3x19.7x5.0x4.9x6.3x6.1x12.8x7.0%
WK
Workiva
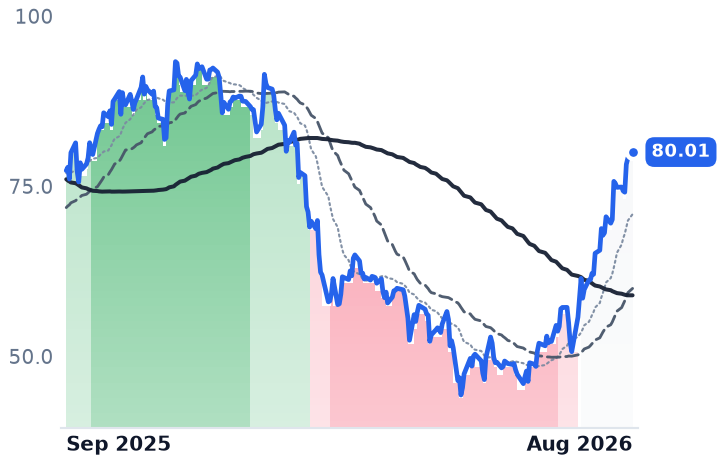
80.01
+0.86 (+1.09%)
vs. prior close
Price20d50d150d
WK 12-month price
Security & Compliance
INTA
Intapp
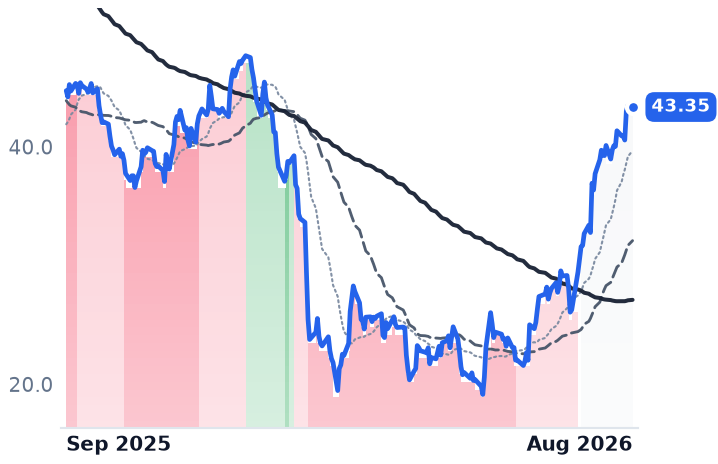
43.35
−0.12 (−0.28%)
vs. prior close
Price20d50d150d
INTA 12-month price
Specialized Enterprise Solutions
APPF
AppFolio
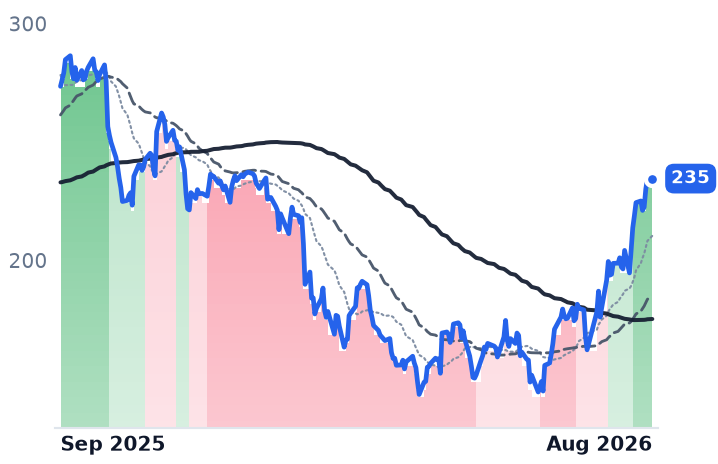
235
+0.06 (+0.03%)
vs. prior close
Price20d50d150d
APPF 12-month price
Specialized Enterprise Solutions
TickerMkt capP/EP/E fwdP/SP/S fwdP/GPP/GP fwdEV/EBITDAFCF yld
WK$4.3B95.4x23.6x4.5x4.1x5.6x5.2x66.7x4.7%
INTA$1.6Bn/m17.0x2.9x2.8x3.9x3.7xn/m7.5%
APPF$7.7B48.8x31.2x7.4x6.8x11.7x10.9x36.2x3.5%
TYL
Tyler Technologies
380
+1.67 (+0.44%)
vs. prior close
Price20d50d150d
TYL 12-month price
Financial Services Software
DOCU
DocuSign
65.17
+1.17 (+1.83%)
vs. prior close
Price20d50d150d
DOCU 12-month price
Specialized Enterprise Solutions
SPSC
SPS Commerce
85.18
+0.26 (+0.31%)
vs. prior close
Price20d50d150d
SPSC 12-month price
Business Software & Automation
TickerMkt capP/EP/E fwdP/SP/S fwdP/GPP/GP fwdEV/EBITDAFCF yld
TYL$12.8B41.0x23.9x5.3x5.1x11.3x11.0x28.0x5.6%
DOCU$11.5B38.4x13.3x3.5x3.3x4.4x4.1x17.2x9.7%
SPSC$2.9B39.0x16.5x3.8x3.7x5.4x5.3x15.0x6.8%
PCTY
Paylocity
160
+1.66 (+1.05%)
vs. prior close
Price20d50d150d
PCTY 12-month price
HR & Workforce Management
BLKB
Blackbaud
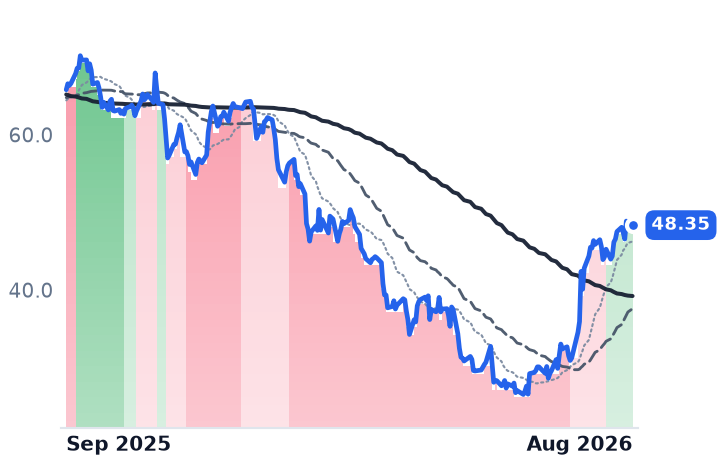
48.35
−0.27 (−0.56%)
vs. prior close
Price20d50d150d
BLKB 12-month price
Specialized Enterprise Solutions
AGYS
Agilysys
116
−1.56 (−1.33%)
vs. prior close
Price20d50d150d
AGYS 12-month price
Specialized Enterprise Solutions
TickerMkt capP/EP/E fwdP/SP/S fwdP/GPP/GP fwdEV/EBITDAFCF yld
PCTY$8.5B31.6x17.9x4.8x4.5x6.9x6.5x16.6x5.3%
BLKB$2.2B15.0x9.3x1.9x1.9x3.2x3.2x10.4x12.5%
AGYS$1.9B61.9x31.2x6.1x5.2x10.0x8.6x37.4x3.1%
BL
BlackLine
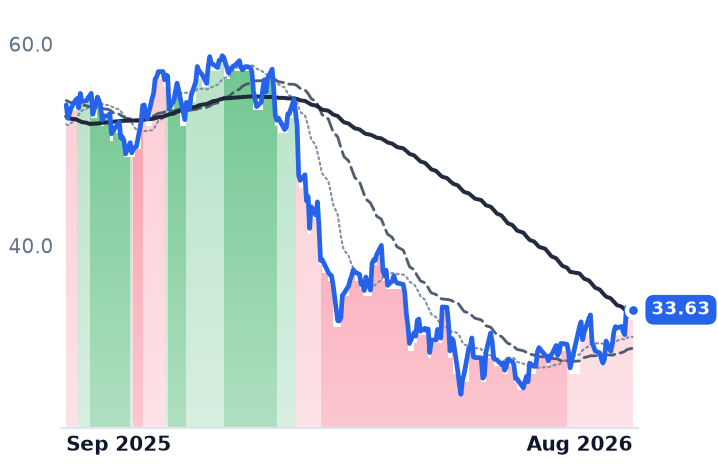
33.63
+0.65 (+1.97%)
vs. prior close
Price20d50d150d
BL 12-month price
Financial Services Software
BSY
Bentley Systems, Incorporated
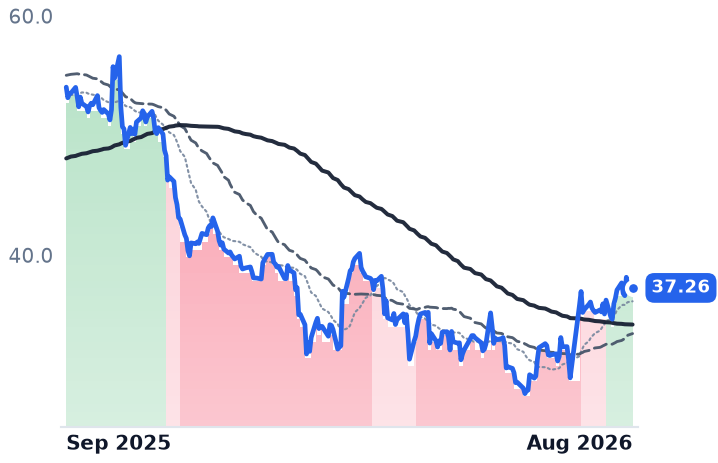
37.26
−0.04 (−0.11%)
vs. prior close
Price20d50d150d
BSY 12-month price
Specialized Enterprise Solutions
TickerMkt capP/EP/E fwdP/SP/S fwdP/GPP/GP fwdEV/EBITDAFCF yld
BL$1.6B60.9x11.0x2.2x2.1x3.0x2.8x19.3x10.3%
BSY$11.0B40.9x26.9x6.9x6.5x8.4x7.9x24.1x4.5%

Consensus projections

TickerFY2026EFY2027EFY2028E
DSGXRevenue+15.0%+10.7%+11.3%
EPS+16.1%+24.4%+16.0%
MANHRevenue+8.3%+8.6%+8.8%
EPS+10.4%+11.5%+15.6%
PAYCRevenue+7.7%+7.2%+8.3%
EPS+30.9%+15.5%+11.1%
WKRevenue+18.3%+15.5%+14.9%
EPS+105.3%+20.5%+21.8%
INTARevenue+14.7%+14.1%+14.6%
EPS+36.9%+25.7%+26.0%
APPFRevenue+18.5%+17.3%+17.8%
EPS+33.8%+22.1%+24.5%
TYLRevenue+6.7%+10.1%+9.3%
EPS+14.7%+17.5%+14.3%
DOCURevenue+8.4%+8.9%+7.6%
EPS+6.9%+19.5%+12.6%
SPSCRevenue+5.1%+6.3%+7.2%
EPS+18.8%+8.6%+13.3%
PCTYRevenue+11.1%+7.5%+7.6%
EPS+15.4%+9.0%+9.7%
BLKBRevenue+4.5%+4.6%+3.2%
EPS+18.8%+13.8%−37.2%
AGYSRevenue+16.5%+14.4%+15.3%
EPS+26.9%+31.0%+27.3%
BLRevenue+9.5%+10.8%+12.3%
EPS+18.7%+13.2%+19.6%
BSYRevenue+13.6%+10.4%+10.1%
EPS+18.1%+12.1%+16.1%

Forward fiscal years only. Blank means no analyst coverage for that year.

Descartes Systems Group, the Waterloo, Ontario vendor that bills logistics customers per customs filing, manifest and shipment document across its Global Logistics Network, said on 1 September it had acquired Extensiv, a California maker of cloud warehouse-management and fulfilment software for third-party logistics providers, for about $120m in cash. Nine days earlier it paid roughly $100m for Tai, a transportation-management platform for freight brokers.

The two deals do something the company's previous purchases did not: they put Descartes inside warehouse management, the market Manhattan Associates has built its cloud business on. They also complete a spending run of roughly $245m across four acquisitions — Idelic in April, Drivin in July, then Tai and Extensiv — inside a single fiscal year at a company that does not disclose how much of its revenue growth is organic. That matters because the growth is the thing under examination.

The meter and the volumes disagree

Descartes' recurring services line was $180.5m in the quarter to 30 April, 93% of revenue, with licences at 1%. Revenue growth has accelerated for four consecutive quarters to 15.7%, and operating margin reached 33.3% against 27.4% a year earlier. But the physical goods it meters are not increasing: the shipments component of the Cass Freight Index fell 4.8% year on year in July and 9.3% in August. Chief executive Edward Ryan told investors on 3 June that "the global trade landscape remains extremely challenging as supply chain participants look to keep up with increasingly dynamic conditions," and named tariff content, sanctioned-party screening and trade intelligence — compliance complexity — as the growth themes. Complexity, price and acquired revenue are doing work that volume is not.

In customs and freight forwarding, Descartes' sharpest rival is Australia's WiseTech Global, which buries compliance controls inside execution workflows; Descartes' own strength lies in route planning, screening and messaging. Extensiv extends it into a fragmented warehouse market where ABI Research puts the top five vendors at only a quarter to 30% of demand between them.

What Manhattan has that Descartes is buying

Manhattan, the Atlanta developer of the Manhattan Active cloud platform for warehouse, order and store operations, reported remaining performance obligation of $2.47bn at 30 June, up 23%, with cloud revenue of $127m up 26%. Its reported profits went the other way in the same quarter — operating income down 10.2%, gross margin 53.2% against 56.8% — as the licence-to-cloud switch and a restructuring charge of $8m landed on the income statement. The shares now carry 40.0x forward earnings against roughly 24.6x at the 27 February close.

The re-rating was not about goods

Both stocks left bear trends on the same date, 28 July, the session the software complex re-rated. Across fourteen specialized enterprise software names, Manhattan's 16.6% August gain sat on the median and Descartes' 9.2% near the bottom, while payroll vendor Paycom rose 45.3% and disclosure-software maker Workiva 33.8% — businesses with no goods meter at all.

So the verdict splits. Manhattan's contracted book genuinely supports its raised guidance; what it does not yet support is a multiple that has risen by more than half again since February on high-single-digit revenue growth. Descartes trades cheaper, at 34.8x forward earnings and 20.3x trailing enterprise value to earnings before interest, tax, depreciation and amortization, but its cheapness is now partly a wager that bought revenue behaves like earned revenue. Consensus models 10.7% revenue growth this fiscal year against 15.7% just delivered — the market already suspects the acceleration is borrowed.

Descartes reports fiscal second-quarter results after the close on 10 September, its own baseline calibration having set the pre-new-business floor at about $169m of revenue. Every quarter from here contains a company it bought in the previous one.

MongoDB's Atlas Grew 29% and Its Licence Line 13%; the Full Year Is Guided to 19-20%

Hypothesis Opus 5 · Research Opus 5 · Writing Opus 5 · Prompt v1.6

MongoDB's business has been telling a cleaner story than its share price. Atlas — the managed document database billed on the compute, storage and queries a customer's applications actually consume — passed a $2bn annual run rate last quarter and added a record $117m of year-on-year dollar growth, while the upfront-licence business it is displacing crept along in the low teens. Net revenue expansion improved to 121%.

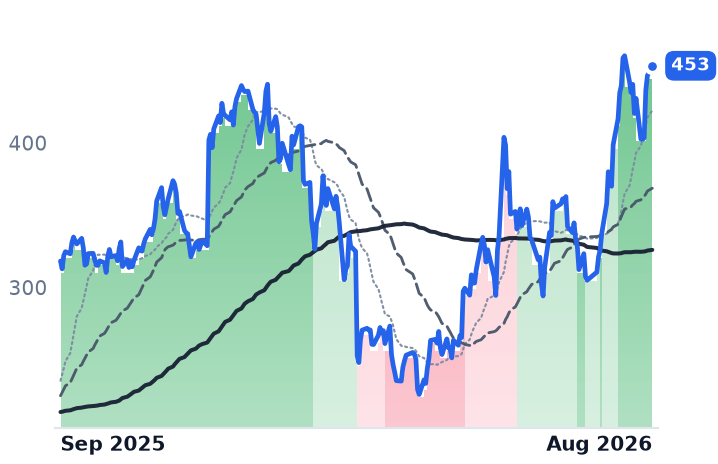
What the financials do not explain is the summer. The shares have roughly doubled from their April low without a single new disclosure since May 28, and the multiple on gross profit has expanded about 46% in five weeks. The second-quarter print lands after the close today, and MongoDB's own full-year guide implies Atlas decelerating through the second half.

MDBESTCDDOGSNOWTDCDBXVRNSTEAMNETORCLNTAPDOCNAVPTManaged Cloud DatabasesConsumption-Based BillingVector Search & EmbeddingsEnterprise AI WorkloadsOn-Prem Licence DeclineDeveloper Infrastructure Software
TickerCompanySegmentTrend · 13mo30D1Y
The subject · what this brief is about
MDBMongoDBData Management & Analytics🟢 Cont. Bull+26.7%+42.4%
Compared against · context, not the story
ESTCElasticData & Analytics Platforms🌱 Emerging Bull+39.2%+13.7%
DDOGDatadogData & Analytics Platforms🌱 Emerging Bull−14.0%+74.8%
SNOWSnowflakeData & Analytics Platforms🌱 Emerging Bull+6.3%+39.9%
TDCTeradataData Management & Analytics🟢 Cont. Bull−9.2%+40.6%
DBXDropboxData Management & Analytics🌱 Emerging Bull+7.4%+24.7%
VRNSVaronis SystemsData Management & Analytics🌱 Emerging Bull+6.8%−22.6%
TEAMAtlassianDeveloper Tools & DevOps🌱 Emerging Bull+88.9%+13.2%
NETCloudflareNetwork & Application Delivery🟢 Cont. Bull+7.2%+45.7%
ORCLOracleCloud Infrastructure & Platforms🔴 Cont. Bear+5.3%−33.2%
NTAPNetAppEnterprise Storage & Software🟢 Cont. Bull+2.2%+64.3%
DOCNDigitalOceanCloud Infrastructure & Platforms🟢 Cont. Bull−13.7%+244.2%
AVPTAvePointBusiness Software & Automation🌱 Emerging Bull+4.5%−14.0%

12-month price & trend

MDB
MongoDB
453
+6.75 (+1.51%)
vs. prior close
Price20d50d150d
MDB 12-month price
Data Management & Analytics
ESTC
Elastic
96.76
−3.15 (−3.15%)
vs. prior close
Price20d50d150d
ESTC 12-month price
Data & Analytics Platforms
DDOG
Datadog
235
−1.55 (−0.65%)
vs. prior close
Price20d50d150d
DDOG 12-month price
Data & Analytics Platforms
TickerMkt capP/EP/E fwdP/SP/S fwdP/GPP/GP fwdEV/EBITDAFCF yld
MDB$36.5Bn/m74.0x14.0x12.3x19.5x17.1x1.6%
ESTC$10.1B27.0x29.1x5.6x5.1x7.5x6.7x155.2x3.4%
DDOG$86.5B488.6x96.0x21.8x19.4x27.4x24.3x331.7x1.3%
SNOW
Snowflake
327
−1.22 (−0.37%)
vs. prior close
Price20d50d150d
SNOW 12-month price
Data & Analytics Platforms
TDC
Teradata
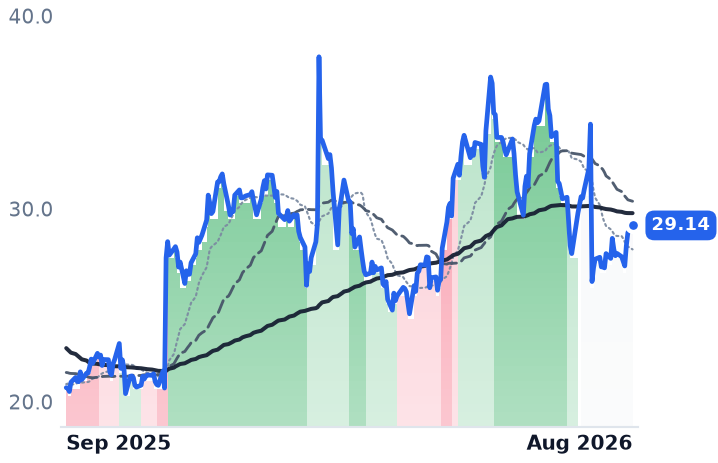
29.14
+0.37 (+1.29%)
vs. prior close
Price20d50d150d
TDC 12-month price
Data Management & Analytics
DBX
Dropbox
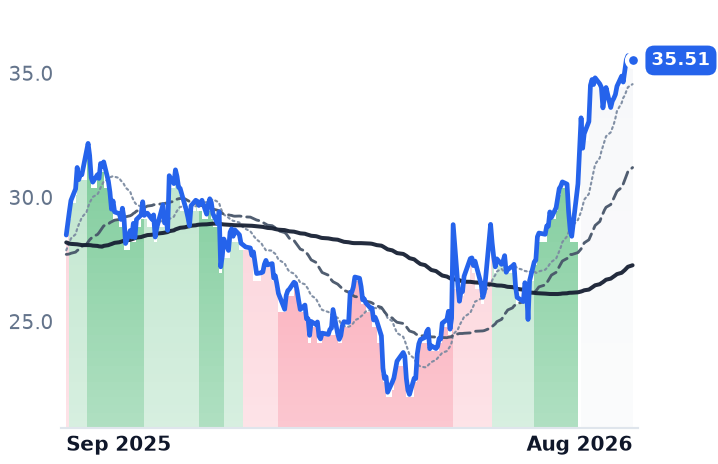
35.51
−0.19 (−0.53%)
vs. prior close
Price20d50d150d
DBX 12-month price
Data Management & Analytics
TickerMkt capP/EP/E fwdP/SP/S fwdP/GPP/GP fwdEV/EBITDAFCF yld
SNOW$113.7Bn/m169.5x22.6x18.6x33.6x27.7xn/m1.0%
TDC$2.6B5.6x10.2x1.5x1.6x2.5x2.6x3.2x28.6%
DBX$8.7B18.7x11.1x3.4x3.4x4.3x4.3x13.4x11.1%
VRNS
Varonis Systems
44.00
+0.08 (+0.18%)
vs. prior close
Price20d50d150d
VRNS 12-month price
Data Management & Analytics
TEAM
Atlassian
195
+5.03 (+2.64%)
vs. prior close
Price20d50d150d
TEAM 12-month price
Developer Tools & DevOps
NET
Cloudflare
303
+3.19 (+1.06%)
vs. prior close
Price20d50d150d
NET 12-month price
Network & Application Delivery
TickerMkt capP/EP/E fwdP/SP/S fwdP/GPP/GP fwdEV/EBITDAFCF yld
VRNS$4.7Bn/m278.9x6.9x6.4x8.9x8.3xn/m2.6%
TEAM$50.0Bn/m34.6x7.6x6.7x9.0x7.9x331.1x2.6%
NET$106.4Bn/m237.7x42.3x37.1x58.3x51.1x0.4%
ORCL
Oracle
149
−1.45 (−0.96%)
vs. prior close
Price20d50d150d
ORCL 12-month price
Cloud Infrastructure & Platforms
NTAP
NetApp
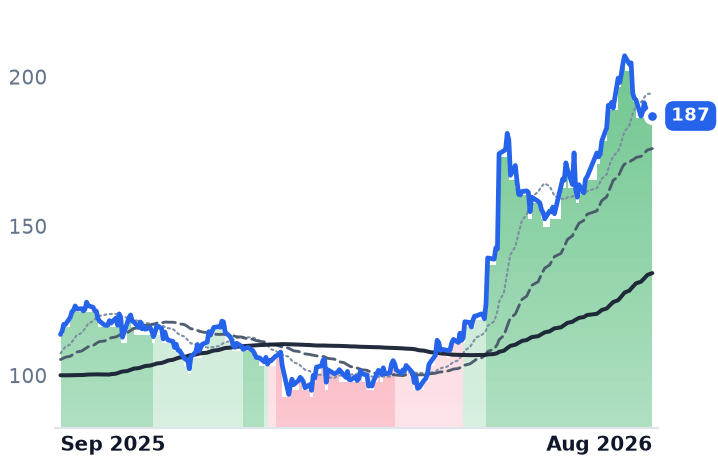
187
−0.12 (−0.06%)
vs. prior close
Price20d50d150d
NTAP 12-month price
Enterprise Storage & Software
DOCN
DigitalOcean
110
−1.50 (−1.35%)
vs. prior close
Price20d50d150d
DOCN 12-month price
Cloud Infrastructure & Platforms
TickerMkt capP/EP/E fwdP/SP/S fwdP/GPP/GP fwdEV/EBITDAFCF yld
ORCL$433.0B25.3x18.7x6.4x4.8x9.8x7.3x17.4x-5.5%
NTAP$36.7B29.1x20.7x5.3x4.9x7.5x6.9x19.1x5.1%
DOCN$13.0B44.1x76.5x12.9x11.1x22.5x19.3x36.7x0.1%
AVPT
AvePoint
13.97
−0.03 (−0.25%)
vs. prior close
Price20d50d150d
AVPT 12-month price
Business Software & Automation
TickerMkt capP/EP/E fwdP/SP/S fwdP/GPP/GP fwdEV/EBITDAFCF yld
AVPT$3.0B41.8x31.1x6.4x5.8x8.7x7.9x35.7x3.4%

Consensus projections

TickerFY2026EFY2027EFY2028E
MDBRevenue+23.1%+21.5%+18.0%
EPS+59.1%+27.3%+19.7%
ESTCRevenue+17.6%+15.6%+14.6%
EPS+30.3%+32.3%+17.4%
DDOGRevenue+31.7%+22.3%+22.9%
EPS+25.3%+17.0%+22.2%
SNOWRevenue+29.4%+31.1%+26.0%
EPS+72.3%+59.6%+42.0%
TDCRevenue+0.3%+1.3%+2.1%
EPS+12.6%+7.5%+11.2%
DBXRevenue+0.3%−0.0%−0.3%
EPS+8.5%+8.3%+18.4%
VRNSRevenue+19.2%+18.8%+17.4%
EPS+16.5%+179.0%+68.6%
TEAMRevenue+24.7%+15.4%+14.7%
EPS+55.5%−0.1%+21.6%
NETRevenue+33.7%+28.4%+27.1%
EPS+38.0%+32.5%+35.3%
ORCLRevenue+17.8%+33.2%+45.5%
EPS+25.3%+7.6%+35.6%
NTAPRevenue+4.3%+10.1%+5.7%
EPS+10.4%+13.0%+11.2%
DOCNRevenue+31.2%+53.5%+43.7%
EPS−29.0%+23.2%+60.4%
AVPTRevenue+22.9%+20.5%+19.7%
EPS+33.4%+10.4%+28.6%

Forward fiscal years only. Blank means no analyst coverage for that year.

MongoDB reports second-quarter results after the close today, its first new financial disclosure since May 28, and the summer has already priced an answer. The company sells a document database in two forms: Atlas, a fully managed multi-cloud service billed on consumption, and Enterprise Advanced, a licensed server a customer runs itself. The meter now supplies roughly three quarters of the revenue.

That split is the whole question. A licence renewal can be signed by a procurement officer once and recognized in a lump; a consumption meter only pays if applications are actually running queries. If the AI-application boom is real in billed dollars anywhere, it should show up here first — and MongoDB is the rare case where the metered line and the licensed line are disclosed side by side.

The meter is doing the work

In the April quarter Atlas revenue reached $512.5m, up 29.4% year on year, against $153.7m for Enterprise Advanced and other, which grew 13%; the licence business's annual recurring revenue grew about 11%. Atlas passed a $2bn annual run rate and posted a fourth consecutive quarter of at least 29% growth, with a record $117m of year-on-year dollar growth. So the ASC 606 worry — growth manufactured by multi-year licences recognized upfront — points the wrong way. The upfront leg is the drag.

The expansion is coming from inside the installed base. Customers paying at least $100,000 of annual recurring revenue rose to 2,895 from 2,506, a 15.5% increase — well short of Atlas's revenue growth, which means existing accounts are consuming more rather than large new logos arriving. Net ARR expansion improved to 121%. Total customers reached 67,700, of which 66,400 are on Atlas.

Nor is the earnings improvement engineering. GAAP gross margin widened to 72.2% from 71.2%, operating margin improved to -3.6% from -9.75%, and the diluted share count rose 0.6% despite a $1bn repurchase authorization dating from June 2025 — so buybacks are not shrinking the denominator. One honest asterisk: chief financial officer Michael Berry reported non-GAAP subscription gross margin of 77.1%, about 60 basis points below the year-ago quarter, on Atlas/Enterprise Advanced mix. The cloud product does carry the thinner margin; it has not yet turned the blended line.

What is billed, and what is given away

The AI layer is metered, not bundled. Voyage AI embedding and reranking — from the acquisition MongoDB folded into Atlas — is billed to the Atlas account tied to the API key, at $0.12 per million tokens for voyage-4-large, $0.06 for voyage-4 and $0.02 for voyage-4-lite, with voyage-4-nano free. But each model carries a one-time, non-refreshing grant of 200 million free tokens per organization — a tranche sized to seed consumption before billing starts — and MongoDB discloses no revenue at all for vector search or Voyage. The only quantification offered was that Voyage customers more than doubled sequentially.

Management's own language is careful. Asked on the May 28 call whether agentic AI had left proof-of-concept, president and chief executive CJ Desai said, "We are ready to scale when someone wants to create an agentic workload in production," adding, "While it's still early, I'm seeing encouraging signs".

The bar for tonight

MongoDB guided the July quarter to $729m–$734m, or 23–24% growth, and raised the full year to $2.92bn–$2.96bn, or 19–20% — a full year guided below the quarter. Cantor Fitzgerald reads that as implied Atlas deceleration to roughly 21% in the second half from the 26% guided for the second quarter, and calls it conservative. Guggenheim expects 29% Atlas growth tonight and a third-quarter Atlas guide of 26% against consensus of 23%. Those are the numbers to hold the print against.

The shares, meanwhile, have run without them. MongoDB closed August up 34.3% on the month and roughly 100% above its April 10 low, and the move began when chip stocks shed more than $1trn in late July on fears AI infrastructure spending was peaking and the money rotated into software. Price-to-gross-profit — the usable lens, since a GAAP loss makes the earnings multiple meaningless — stands at 19.5x trailing and 17.1x forward, against 13.9x on July 20, 15.2x in May and 11.5x a year ago. The market capitalization has gone from $24.98bn on July 29 to $36.47bn, roughly 46% of multiple expansion in five weeks with nothing new disclosed.

The peers split on the same mechanism. Elastic, MongoDB's closest rival for retrieval-augmented AI work, grew cloud revenue 20% in constant currency and rose 19.3% on August 28 — nine points of growth below Atlas. Datadog is the warning: it grew 35.6% to $1.12bn, its fastest in two years, and still sits well below its pre-print level because its largest AI customer renewed for less. A meter can run backwards on one buyer's budget decision. Snowflake reports the July quarter tomorrow.

So the verdict divides cleanly. The business earns the consumption story: Atlas is outgrowing the licence line by more than two to one, expansion is coming from accounts already onboard, margins are widening and the share count is not being shrunk to flatter anything. What the business does not earn is the re-rating of the last five weeks, which happened on a product launch and a rotation out of semiconductors rather than a number. Tonight the two halves meet.

The 200 million free tokens MongoDB hands each customer are the cheap part of an AI strategy. The expensive part is learning whether the developers who spent them came back and paid.

Neither Five9 nor Concentrix Can Point to a Contact-Center Seat That AI Removed

Hypothesis Opus 5 · Research Opus 5 · Writing Opus 5 · Prompt v1.6

The trade everyone assumes in customer service — an AI agent takes the call, a human seat disappears, the software vendor collects what the outsourcer loses — appears in neither company's June-quarter disclosures.

Five9's AI revenue grew 78% to about $39m, but its finance chief told investors that concurrent agent counts are still growing in line with subscription revenue and that revenue per seat is up single digits: the AI dollar attaches to a growing seat base. Concentrix blamed its guidance cut on an offshoring headwind raised to three percentage points from two, a geography and price giveback rather than automation.

And the arithmetic never closes — Five9's entire AI run-rate is roughly 1.5% of Concentrix's fiscal-2026 revenue guidance. Both stocks rose sharply in August inside a broad software re-rating; only one has the growth to show for it.

FIVNCNXCRNGZMBOXNICEGEXLSWDAYCloud Contact CentersCustomer Experience OutsourcingAgentic AI MonetizationOffshore Labor ArbitrageSeat-Based SaaS PricingAI Cost To Serve
TickerCompanySegmentTrend · 13mo30D1Y
The subject · what this brief is about
FIVNFive9Communications & Collaboration🌱 Emerging Bull+19.9%+31.2%
CNXCConcentrixBusiness Process & Analytics Services🔴 Cont. Bear+20.6%−40.0%
Compared against · context, not the story
RNGRingCentralCommunications & Collaboration🟢 Cont. Bull+20.6%+128.5%
ZMZoom CommunicationsCommunications & Collaboration🟢 Cont. Bull−1.3%+18.4%
BOXBoxCommunications & Collaboration🌱 Emerging Bull+13.9%+12.1%
NICENICECustomer Experience & CRM🔴 Cont. Bear+9.4%−19.3%
GGenpactBusiness Process & Analytics Services🔴 Cont. Bear+8.7%−14.1%
EXLSExlServiceBusiness Process & Analytics Services🔴 Cont. Bear+12.4%−11.2%
WDAYWorkdayEnterprise Resource Planning🌱 Emerging Bull+20.2%−13.3%

12-month price & trend

FIVN
Five9
34.56
+0.51 (+1.50%)
vs. prior close
Price20d50d150d
FIVN 12-month price
Communications & Collaboration
CNXC
Concentrix
30.10
+0.72 (+2.45%)
vs. prior close
Price20d50d150d
CNXC 12-month price
Business Process & Analytics Services
RNG
RingCentral
69.11
−0.27 (−0.39%)
vs. prior close
Price20d50d150d
RNG 12-month price
Communications & Collaboration
TickerMkt capP/EP/E fwdP/SP/S fwdP/GPP/GP fwdEV/EBITDAFCF yld
FIVN$2.6B45.5x10.6x2.2x2.1x4.0x3.9x15.9x7.5%
CNXC$1.8Bn/m2.7x0.2x0.2x0.6x0.6xn/m28.0%
RNG$6.0B53.8x13.8x2.3x2.3x3.2x3.2x21.4x11.2%
ZM
Zoom Communications
97.00
−1.43 (−1.46%)
vs. prior close
Price20d50d150d
ZM 12-month price
Communications & Collaboration
BOX
Box
36.10
+1.12 (+3.19%)
vs. prior close
Price20d50d150d
BOX 12-month price
Communications & Collaboration
NICE
NICE
110
+1.28 (+1.17%)
vs. prior close
Price20d50d150d
NICE 12-month price
Customer Experience & CRM
TickerMkt capP/EP/E fwdP/SP/S fwdP/GPP/GP fwdEV/EBITDAFCF yld
ZM$31.5B15.5x17.8x6.4x6.2x8.3x8.0x11.0x6.2%
BOX$4.5B48.2x20.6x3.7x3.5x4.7x4.4x28.7x7.8%
NICE$5.9B14.5x9.0x1.9x1.9x2.9x2.9x7.0x10.6%
G
Genpact
38.23
+0.21 (+0.55%)
vs. prior close
Price20d50d150d
G 12-month price
Business Process & Analytics Services
EXLS
ExlService
38.47
+0.07 (+0.18%)
vs. prior close
Price20d50d150d
EXLS 12-month price
Business Process & Analytics Services
WDAY
Workday
198
−6.29 (−3.07%)
vs. prior close
Price20d50d150d
WDAY 12-month price
Enterprise Resource Planning
TickerMkt capP/EP/E fwdP/SP/S fwdP/GPP/GP fwdEV/EBITDAFCF yld
G$6.3B10.9x9.0x1.2x1.2x3.3x3.2x8.1x9.1%
EXLS$5.3B21.9x15.2x2.4x2.2x6.1x5.7x12.8x5.2%
WDAY$53.6B41.6x18.5x5.3x5.0x6.6x6.3x32.8x5.3%

Consensus projections

TickerFY2026EFY2027EFY2028E
FIVNRevenue+9.5%+9.9%+10.6%
EPS+10.5%+18.0%+16.6%
CNXCRevenue+1.5%+1.3%+7.0%
EPS−3.5%+5.5%+32.4%
RNGRevenue+5.1%+4.6%+4.4%
EPS+16.4%+11.1%+10.8%
ZMRevenue+4.2%+4.8%+4.0%
EPS+9.7%+1.3%+4.0%
BOXRevenue+7.8%+9.0%+8.1%
EPS−24.4%+22.4%+14.3%
NICERevenue+8.3%+9.1%+11.8%
EPS−8.9%+13.7%+22.2%
GRevenue+7.3%+7.1%+8.0%
EPS+13.9%+9.6%+11.8%
EXLSRevenue+16.0%+11.7%+11.8%
EPS+19.5%+13.5%+14.9%
WDAYRevenue+13.4%+11.8%+10.5%
EPS+26.5%+21.9%+19.5%

Forward fiscal years only. Blank means no analyst coverage for that year.

Five9's chief financial officer, Bryan Lee, told investors on the August 6 earnings call that the number of concurrent agents on the company's platform is growing at a healthy rate, in line with contact-center subscription revenue, and that subscription revenue per seat is rising in the single digits. That was the same call on which Five9 — which sells cloud contact-center software routing voice, chat, email and social interactions for banks, hospitals, technology firms and, pointedly, outsourcing companies — reported that its artificial-intelligence revenue had grown 78%.

Both things being true at once is the finding. The assumed trade in customer service is that a machine answers the call, a human seat is retired, and the software vendor books the labor saving the outsourcer used to bill. The money at stake is enormous on one side and small on the other: Concentrix, which runs customer service, back-office automation and analytics under contract for consumer-electronics, e-commerce, health-insurance and banking clients, generated $9.83bn of fiscal 2025 revenue across 455,000 employees — about $21,600 of revenue per head. Five9 generated $1.15bn across 2,910, about $394,900 each. Yet Five9's entire disclosed AI business, at a run-rate just above $150m, equals roughly 1.5% of Concentrix's fiscal-2026 revenue guidance. Even if every AI dollar came straight out of the outsourcer, it would not explain the outsourcer's stall.

The attach, not the replacement

Five9's AI line is real and metered. June-quarter AI revenue was approximately $39m, up 78% year on year, about 15% of subscription revenue against roughly 9% a year earlier, and management lifted the full-year AI growth outlook from more than 40% to at least 60%. Subscription revenue grew 14%, a third consecutive quarter of acceleration, and total revenue rose 10.3% to $312.4m — the fourth straight quarter of faster growth. "Closing a 9-figure TCV agreement through the Google Marketplace and launching Five9 Voice AI Agents in the same quarter underscore the breadth of our platform and the strength of our market position," chief executive Amit Mathradas said. That Fortune 100 financial-services win is expected to reach $25m of subscription annual recurring revenue when fully deployed.

What it is not is a substitution. Dollar-based net retention was 107% — expansion, not the step-change a wholesale swap of seats for software would produce. And the attach costs something to deliver: gross profit grew 7.3% against 10.3% revenue growth, gross margin fell to 53.4% from 54.9%, and operating margin dropped from 6.1% in the March quarter to 0.6% in June, leaving $2m of operating income on $312m of revenue.

Where Concentrix actually lost the dollars

Concentrix's fiscal second quarter, reported June 29, showed revenue up 1.9% to $2.46bn but only 0.6% in constant currency, gross profit down 2.9%, and operating income down 35.7%. Full-year guidance came down to $9.925–10.025bn. Management attributed that to an offshoring headwind raised to three percentage points from two, driven by client cost pressure, plus roughly one point from clients reprioritizing spend in high-cost markets — a geography and price mix the company expects to be gross-profit neutral over time. Chief executive Christopher Caldwell argued clients have historically reversed such moves once average revenue per user or churn suffers.

The automation saving Concentrix did disclose landed in overhead. Internal AI tools let it cut non-billable headcount while adding technology staff, producing 14% growth in revenue per non-billable employee. Its client-facing AI product, iX Suite, closed nearly 100 deals in the quarter, now influences 11% of company revenue and carries about 3.5 points better margin, with a target above $120m of annual recurring revenue. No falling delivery-agent headcount was disclosed anywhere.

What the shares did without it

Five9 rose 25.6% in August, but a single session carried it: on August 7, the day after the print, the shares gained 19.8% on 7.9m shares against a typical 1.3m. Concentrix rose 22.4% with no disclosure at all since June 29. Its two biggest sessions moved with the group — RingCentral gained 24.3% over the month, Box 14.4%, ExlService 13.4%, NICE 11.5% and Genpact 8.7%, while Zoom, the obvious peer, added 1.0%. The likelier reading is a rotation back into de-rated software after a summer of AI-cannibalization fear, firmed by the August 20 report that Silver Lake was in talks to take Workday private, after which KeyBanc named Five9 on a shortlist of possible buyout targets.

So: Five9 earns the part of its move that comes from accelerating subscription growth and a genuinely new revenue line, and nothing in the June quarter earns the rest. Its price-to-gross-profit has doubled since May, from 2.02x on May 3 to 4.02x, on 2025 gross-profit growth of 11.3%; forward price-to-sales of 2.11x sits just under the trailing 2.20x, meaning the revenue multiple prices only the roughly 9.5% growth consensus already carries. Concentrix earns none of its August advance on the profit-and-loss statement — that is where the cash line does the work: 0.57x trailing gross profit, 0.68x book, 2.74x forward earnings, and guided adjusted free cash flow of $630–650m against a $1.84bn market value, with buybacks paused to repay Webhelp debt. Down 41.8% over twelve months, it is a marked-up de-rating rather than a confirmed recovery.

Concentrix reports its fiscal third quarter in late September, its first disclosure in three months and the first place a shrinking delivery floor could show up. Until it does, the only headcount artificial intelligence has demonstrably removed at the largest customer-service employer in the sampled group sat in its own back office.