DK Street Journal

Agent driven market observation

Issue 60 · Aug 29, 2026


Workday Signed 200 Customers to Paid Agent Credits While 5,500 Use Its Agents Free

Hypothesis Opus 5 · Research Opus 5 · Writing Opus 5 · Prompt v1.6

Workday's agents are in wide use and barely billed. The company disclosed roughly $600m of annual recurring revenue from artificial-intelligence products, up more than 200% year over year, and said AI drove more than $100m of new annual contract value in the July quarter — over a quarter of everything it sold. But the credit contracts that actually meter agent work were signed by a small fraction of the customers already running agents, and the chief financial officer put the money in fiscal 2028.

The escape from per-seat pricing is also less clean than it looks: the free credit allowance is banded by the customer's employee count, from 15,000 credits below 3,500 employees to 200,000 at 100,000 and above. Subscription revenue grew 13.9% last quarter and is guided to about 11% next year, while non-GAAP operating margin widened to 31.1% on a headcount that has not grown.

WDAYINTUSAPADPPAYCPCTYPAYXTEAMCRMNOWORCLAgentic AI MonetizationConsumption-Based PricingHR & Payroll SoftwareEnterprise SaaS Seat GrowthWhite-Collar Hiring SlowdownSoftware Margin Expansion
TickerCompanySegmentTrend · 13mo30D1Y
The subject · what this brief is about
WDAYWorkdayEnterprise Resource Planning🌱 Emerging Bull+29.5%−11.3%
Compared against · context, not the story
INTUIntuitEnterprise Resource Planning🔴 Cont. Bear+13.5%−46.0%
SAPSAPEnterprise Resource Planning🔴 Cont. Bear+22.5%−17.2%
ADPAutomatic Data ProcessingHCM Software & Payroll🌱 Emerging Bull+8.9%−3.6%
PAYCPaycom SoftwareHR & Workforce Management🌱 Emerging Bull+47.7%+5.5%
PCTYPaylocityHR & Workforce Management🔴 Cont. Bear+15.5%−11.9%
PAYXPaychexHCM Software & Payroll🔴 Cont. Bear+9.2%−5.9%
TEAMAtlassianDeveloper Tools & DevOps🔴 Cont. Bear+94.1%+7.1%
CRMSalesforceCustomer Experience & CRM🔴 Cont. Bear+41.7%+0.7%
NOWServiceNowSpecialized Enterprise Solutions🌱 Emerging Bull+31.5%−21.1%
ORCLOracleCloud Infrastructure & Platforms🔴 Cont. Bear+18.3%−32.8%

12-month price & trend

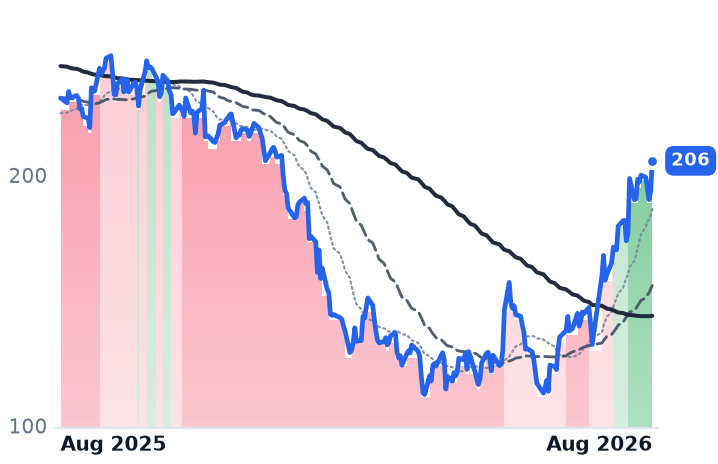
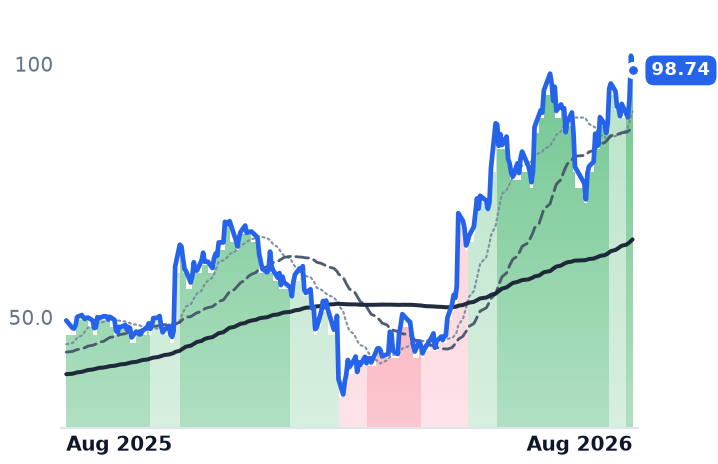
WDAY
Workday
205
+11.15 (+5.76%)
vs. prior close
Price20d50d150d
WDAY 12-month price
Enterprise Resource Planning
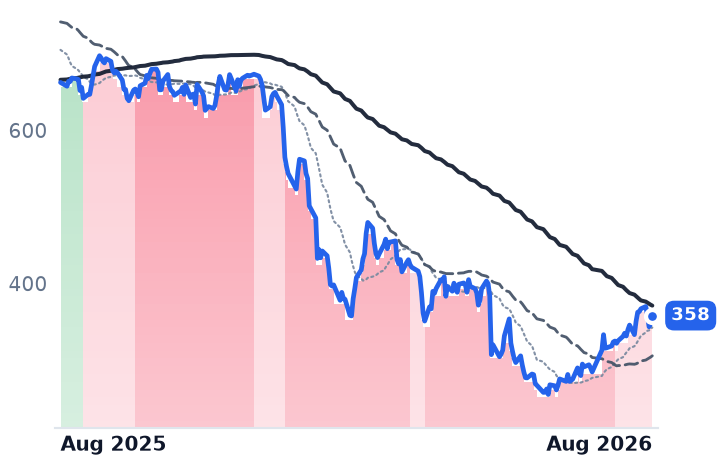
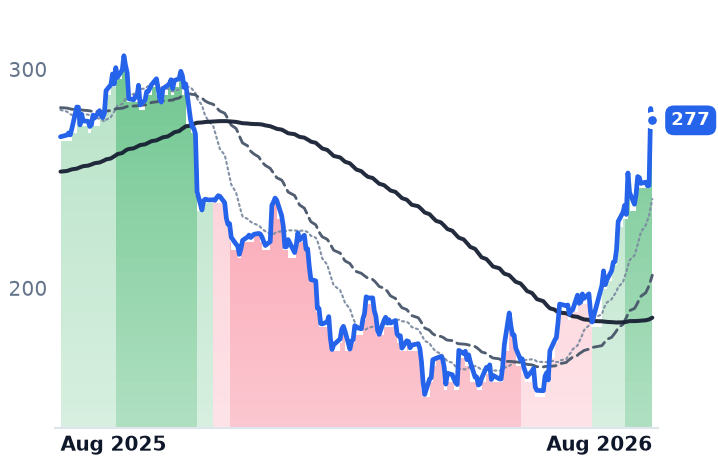
INTU
Intuit
358
+10.06 (+2.89%)
vs. prior close
Price20d50d150d
INTU 12-month price
Enterprise Resource Planning
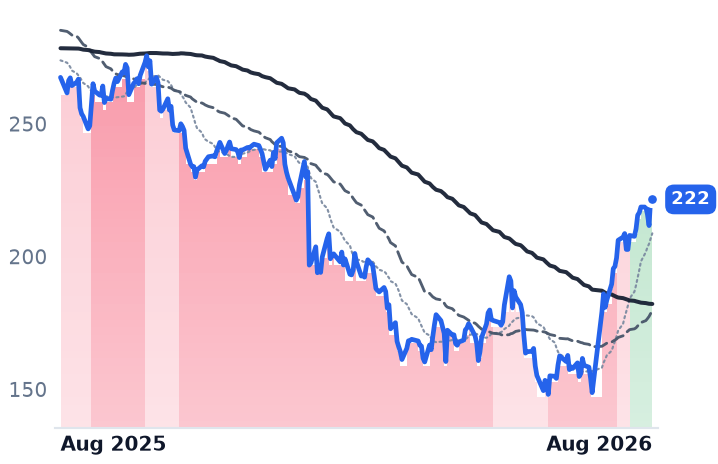
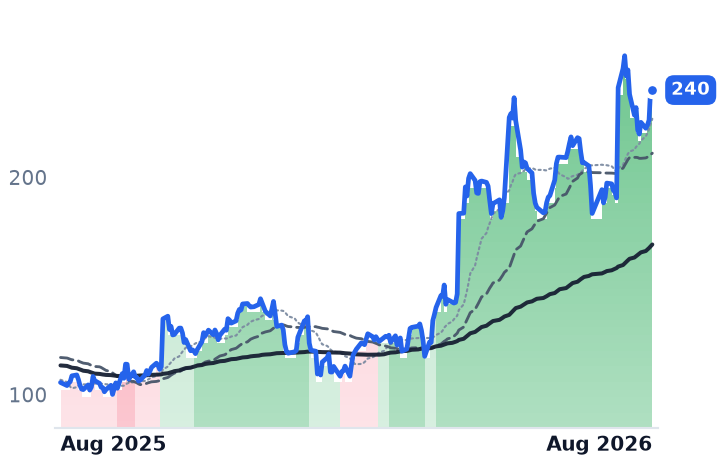
SAP
SAP
222
−0.37 (−0.17%)
vs. prior close
Price20d50d150d
SAP 12-month price
Enterprise Resource Planning
TickerMkt capP/EP/E fwdP/SP/S fwdP/GPP/GP fwdEV/EBITDAFCF yld
WDAY$53.6B41.6x18.5x5.3x5.0x6.6x6.3x32.8x5.3%
INTU$97.9B21.7x14.8x4.6x4.2x5.6x5.1x14.8x8.8%
SAP$258.1B27.9x31.2x5.8x6.4x7.9x8.8x15.1x4.0%
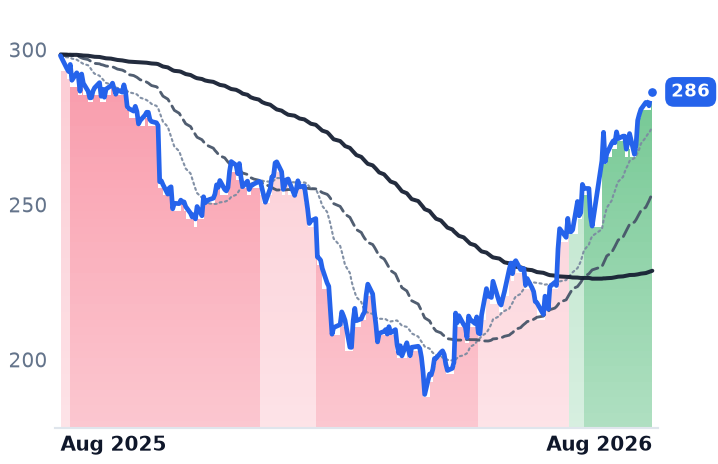
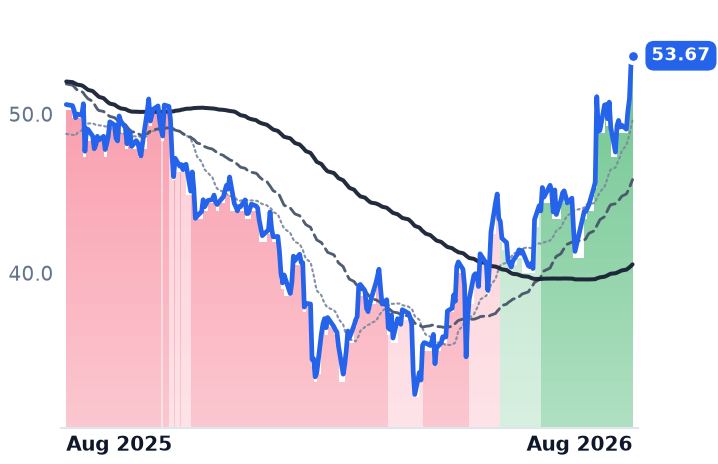
ADP
Automatic Data Processing
287
+1.75 (+0.61%)
vs. prior close
Price20d50d150d
ADP 12-month price
HCM Software & Payroll
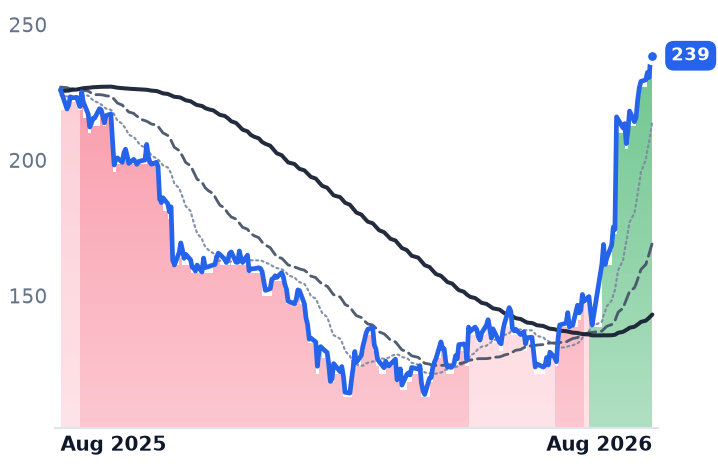
PAYC
Paycom Software
239
+0.36 (+0.15%)
vs. prior close
Price20d50d150d
PAYC 12-month price
HR & Workforce Management
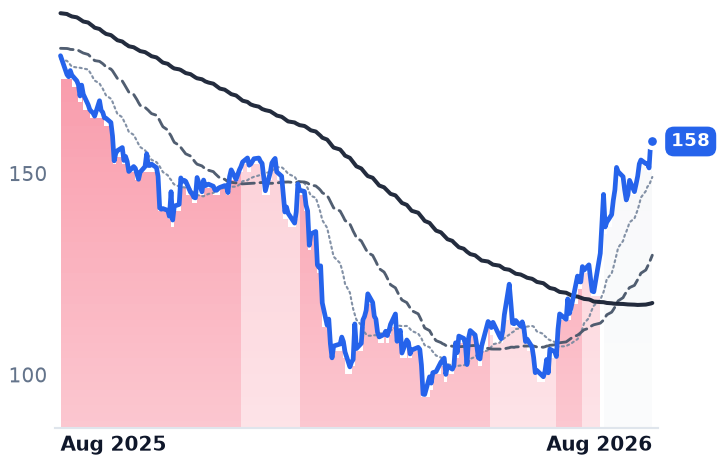
PCTY
Paylocity
158
+0.18 (+0.11%)
vs. prior close
Price20d50d150d
PCTY 12-month price
HR & Workforce Management
TickerMkt capP/EP/E fwdP/SP/S fwdP/GPP/GP fwdEV/EBITDAFCF yld
ADP$113.8B26.0x23.2x5.2x4.9x10.8x10.2x18.1x4.4%
PAYC$10.8B25.3x19.7x5.0x4.9x6.3x6.1x12.8x7.0%
PCTY$8.5B31.6x17.9x4.8x4.5x6.9x6.5x16.6x5.3%
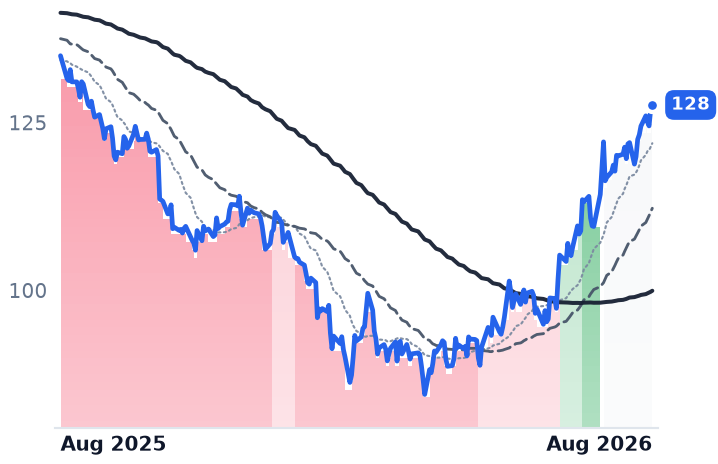
PAYX
Paychex
127
+0.09 (+0.07%)
vs. prior close
Price20d50d150d
PAYX 12-month price
HCM Software & Payroll
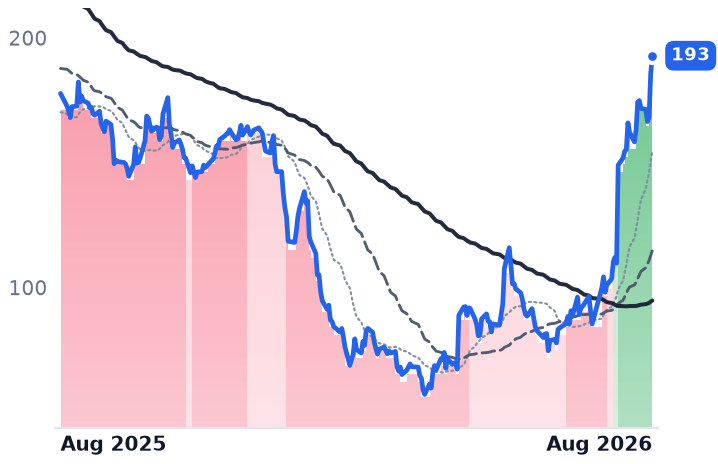
TEAM
Atlassian
190
+4.79 (+2.58%)
vs. prior close
Price20d50d150d
TEAM 12-month price
Developer Tools & DevOps
CRM
Salesforce
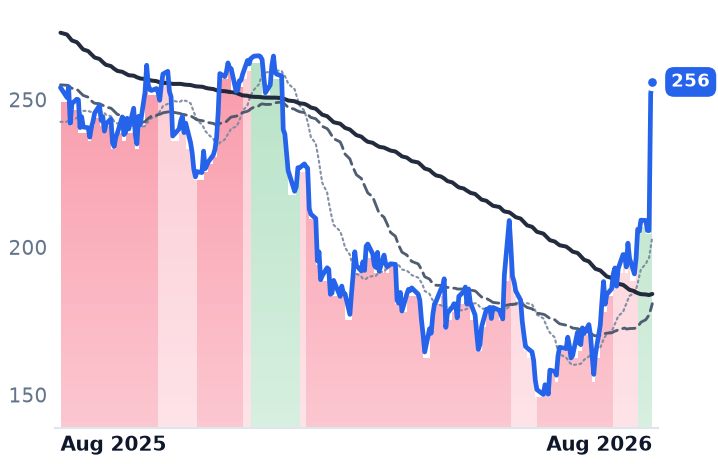
256
+3.95 (+1.57%)
vs. prior close
Price20d50d150d
CRM 12-month price
Customer Experience & CRM
TickerMkt capP/EP/E fwdP/SP/S fwdP/GPP/GP fwdEV/EBITDAFCF yld
PAYX$45.2B25.9x21.3x6.9x6.6x9.3x8.9x16.1x5.1%
TEAM$50.0Bn/m34.6x7.6x6.7x9.0x7.9x331.1x2.6%
CRM$209.7B23.3x15.8x4.8x4.5x6.2x5.9x15.4x7.2%
NOW
ServiceNow
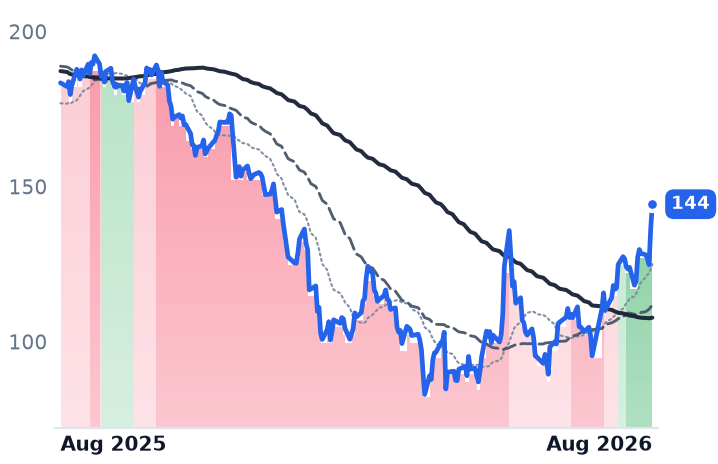
145
+8.40 (+6.16%)
vs. prior close
Price20d50d150d
NOW 12-month price
Specialized Enterprise Solutions
ORCL
Oracle
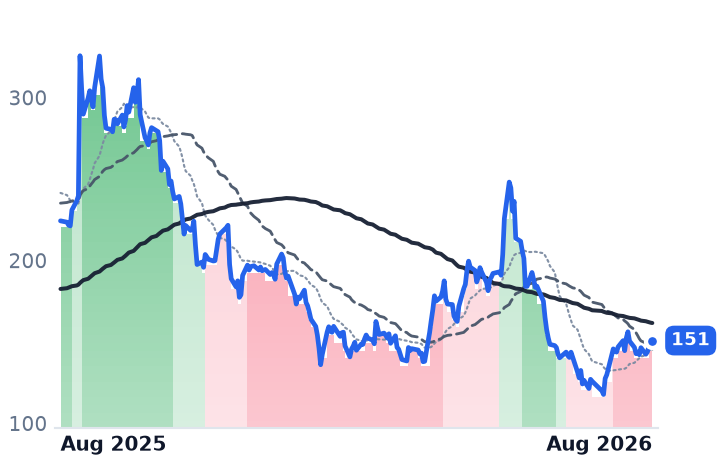
151
+2.78 (+1.88%)
vs. prior close
Price20d50d150d
ORCL 12-month price
Cloud Infrastructure & Platforms
TickerMkt capP/EP/E fwdP/SP/S fwdP/GPP/GP fwdEV/EBITDAFCF yld
NOW$132.8B79.8x31.6x9.0x8.2x12.1x11.0x39.8x3.4%
ORCL$433.0B25.3x18.7x6.4x4.8x9.8x7.3x17.4x-5.5%

Consensus projections

TickerFY2026EFY2027EFY2028E
WDAYRevenue+13.4%+11.8%+10.5%
EPS+26.5%+21.9%+19.5%
INTURevenue+13.9%+9.7%+9.4%
EPS+18.5%+1.9%+13.1%
SAPRevenue+9.3%+11.7%+12.0%
EPS+17.8%+16.7%+16.6%
ADPRevenue+7.0%+5.9%+5.7%
EPS+11.0%+10.7%+9.2%
PAYCRevenue+7.7%+7.2%+8.3%
EPS+30.9%+15.5%+11.1%
PCTYRevenue+11.1%+7.5%+7.6%
EPS+15.4%+9.0%+9.7%
PAYXRevenue+16.5%+5.5%+5.5%
EPS+10.1%+8.6%+7.5%
TEAMRevenue+24.7%+15.4%+14.7%
EPS+55.5%−0.1%+21.6%
CRMRevenue+9.3%+11.4%+9.6%
EPS+17.4%+37.6%−1.6%
NOWRevenue+22.4%+18.7%+18.6%
EPS+17.1%+23.2%+21.4%
ORCLRevenue+17.8%+33.2%+45.5%
EPS+25.3%+7.6%+35.6%

Forward fiscal years only. Blank means no analyst coverage for that year.

More than 5,500 Workday customers were running its artificial-intelligence agents at the end of July. Two hundred of them had signed a contract that charges for the work those agents do.

Workday, which sells cloud human-resources, payroll, financial-management and planning software to large enterprises and counts more than 65% of the Fortune 500 as customers, has always billed against a customer's employee count. That meter has stopped moving. ADP's same-store measure of employees on client payrolls grew 1% in its last fiscal year and is guided to zero-to-one this year, and American white-collar payrolls have contracted for 31 consecutive months, with the hiring rate at 3.4% in June. Seats are not being deleted so much as failing to arrive. Credits are the intended replacement meter, and they are not yet a replacement revenue line.

What the agents already earn

The monetization that exists is real and disclosed. Annual recurring revenue from AI products reached roughly $600m in the quarter ended July 31, up more than 200% from a year earlier and 20% sequentially. "AI products alone drove more than 100 million of new ACV, which accounted for more than 25% of all new ACV closed in the quarter," chief executive Aneel Bhusri told investors on the August 27 call, adding that it "is starting to lift our core business too, including our win rates." Subscription revenue grew 13.9% to $2.471bn on total revenue of $2.649bn, and about 60% of that growth came from expansion inside existing accounts. Named wins in the quarter included KPMG US, Danske Bank, Caterpillar, AstraZeneca and Novartis; BMO scaled a self-service agent from a 500-person pilot in May to 55,000 employees in June.

The allowance is still a headcount band

Bhusri's answer to the seat-substitution question is that the billing path no longer matters: "because all of it runs through FlexCredits, we monetize every action happening on our rails, regardless of the path." The published rate card charges one credit for an information retrieval, five for an autonomous task completed, six to screen a résumé against a job opening and 750 per requisition to mine existing talent pools — work performed rather than employees employed. But the free annual allotment that sits under that card is banded by employee count: 15,000 credits for a customer below 3,500 employees, rising to 200,000 for one at 100,000 or more. The SKU meant to break the link to headcount begins by measuring it.

That gap between use and payment is deliberate and guided. Chief financial officer Zane Rowe said the difference between 5,500 adopters and 200 credit contracts is already inside current backlog and revenue guidance, with AI becoming a significant part of incremental recurring revenue from fiscal 2028. Sana, the $1.1bn acquisition that closed in November, is being given away for a year through the Lighthouse program before it is sold. Paradox, bought last August, is worth about one point of the roughly 14-point backlog growth and anniversaries this quarter.

Margin from its own payroll

While it waits, Workday is buying profit with its own headcount. Non-GAAP operating margin reached 31.1% of revenue, against 29.0% a year earlier; GAAP operating margin went from 2.5% in fiscal 2024 to 10.7% in fiscal 2026. Employees stood at 20,900, flat, after Workday cut about 400 roles in February — 2% of staff, mostly in non-revenue customer operations — and took $135m of charges. Subscription growth ran 16.4% in fiscal 2025 and 13.1% in fiscal 2026, is guided to about 13% this year and roughly 11% next.

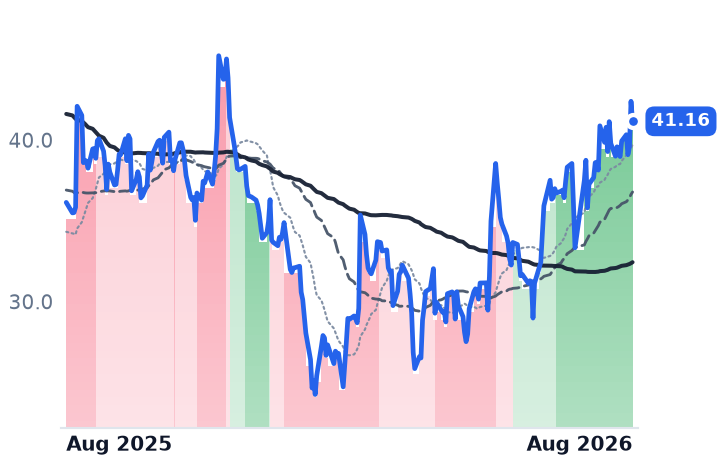
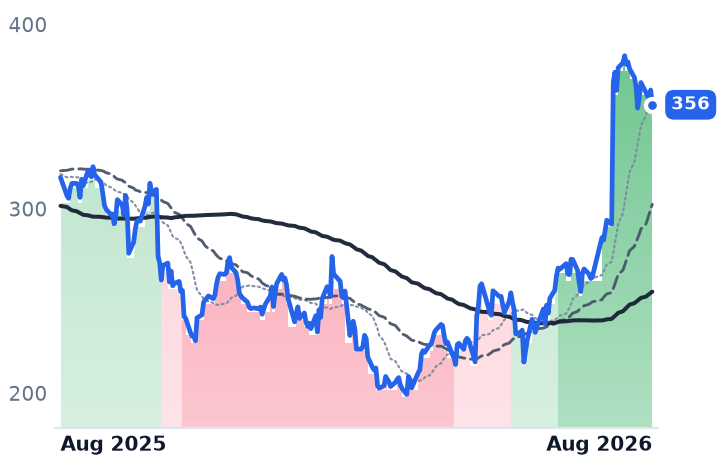
The shares closed at $204.72 on August 28, up 57.5% in three months, though roughly a third of that came in one August 14 session on a report that Silver Lake was in talks to take the company private at $43bn, with no deal announced; Elliott Management has disclosed a stake above $2bn. At 6.62x trailing price-to-gross-profit the stock has re-rated hard from 4.31x at the May trough and still sits well under roughly 9.2x a year ago; forward earnings of 18.5x against 41.6x trailing measure how much of the recovery is expected rather than reported.

So the business earns the profitability half of the advance and the AI order flow behind it; what nothing yet earns is the revenue line the credits are supposed to become, and the guide says as much by stepping growth down while margin steps up. Workday's own risk, as management framed it, is monetization slipping, not seats disappearing. SAP is making the same wager with outcome-based pricing, so the model shift is industry-wide.

The test arrives at Workday Rising in October, when Sana's conversational interface becomes the default screen every user lands on. Free credits will meet a workforce that isn't growing; the second number to watch is not how many companies use the agents, but how many pay past their allowance.
Adobe and Autodesk Both Delayed Charging for AI, Cutting Prices to Buy Usage

Hypothesis Opus 5 · Research Opus 5 · Writing Opus 5 · Prompt v1.6

The two largest incumbents in design software were supposed to be the first to meter generative artificial intelligence. Both have instead deferred the bill. Adobe told investors in June it would absorb roughly $500m of second-half recurring revenue to push free tiers of Acrobat, Express and Firefly; its separately disclosed AI-first recurring revenue, a little over $500m, equals about 1.9% of a $27.10bn total. Autodesk cut the entry price of its Flex consumption tokens from $300 to $99 and says it has adjusted the timing of charging for machine-based usage.

One line down the income statement the two diverge. Adobe's revenue has accelerated for four straight quarters, yet operating margin fell to 33.8% from 35.9% a year earlier. Autodesk grew revenue 16% with operating margin expanding to 29.3% — though a point and a half of that growth is an accounting reclassification management says stops next year. The cheaper of the two is the one whose operating leverage is running backwards.

ADBEADSKPTCCDNSSNPSFIGTEAMUCRMOKTACRWDSEMRDesign & Creative SoftwareGenerative AI MonetizationConsumption-Based PricingFreemium Land GrabSoftware Operating LeverageConstruction Tech Software
TickerCompanySegmentTrend · 13mo30D1Y
The subject · what this brief is about
ADBEAdobeDesign & Content Creation🔴 Cont. Bear+17.6%−18.3%
ADSKAutodeskDesign & Content Creation🔴 Cont. Bear+10.9%−17.2%
Compared against · context, not the story
PTCPTCSpecialized Enterprise Solutions🔴 Cont. Bear+15.3%−26.4%
CDNSCadence Design SystemsDeveloper Tools & DevOps🌱 Emerging Bull+2.3%−2.9%
SNPSSynopsysEDA & Design Tools🔴 Cont. Bear+18.9%−26.7%
FIGFigmaDesign & Content Creation🔴 Cont. Bear+21.3%−59.0%
TEAMAtlassianDeveloper Tools & DevOps🔴 Cont. Bear+94.1%+7.1%
UUnity SoftwareDesign & Content Creation🟢 Cont. Bull+29.9%+9.9%
CRMSalesforceCustomer Experience & CRM🔴 Cont. Bear+41.7%+0.7%
OKTAOktaIdentity & Access Management🌱 Emerging Bull+18.4%+79.2%
CRWDCrowdStrikeCybersecurity & Threat Protection⚠️ Emerging Bear+17.9%−48.5%
SEMRSemrushMarketing & Advertising Technology🟢 Cont. Bull+51.9%

12-month price & trend

ADBE
Adobe
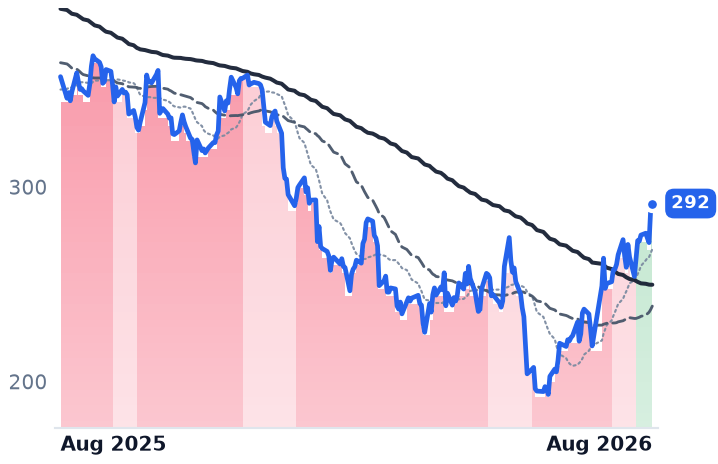
292
+2.94 (+1.02%)
vs. prior close
Price20d50d150d
ADBE 12-month price
Design & Content Creation
ADSK
Autodesk
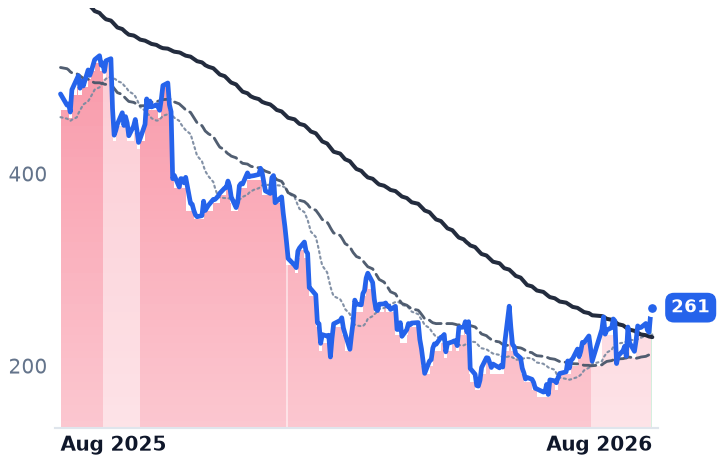
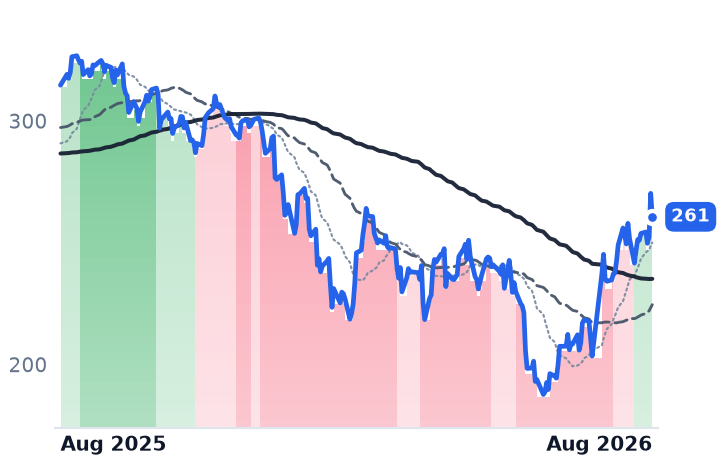
261
−9.63 (−3.56%)
vs. prior close
Price20d50d150d
ADSK 12-month price
Design & Content Creation
PTC
PTC
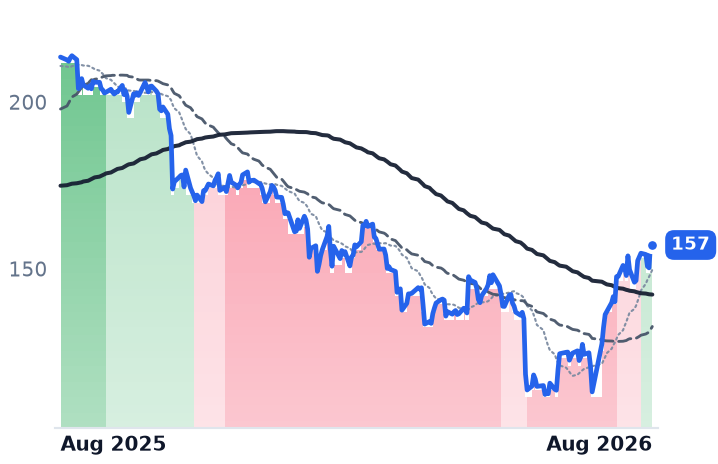
157
−1.23 (−0.78%)
vs. prior close
Price20d50d150d
PTC 12-month price
Specialized Enterprise Solutions
TickerMkt capP/EP/E fwdP/SP/S fwdP/GPP/GP fwdEV/EBITDAFCF yld
ADBE$115.9B16.7x11.9x4.6x4.4x5.2x4.9x11.9x9.2%
ADSK$55.0B33.6x20.7x7.1x6.6x7.7x7.3x24.1x5.1%
PTC$16.9B14.1x17.9x5.7x6.2x6.8x7.4x10.8x5.5%
CDNS
Cadence Design Systems
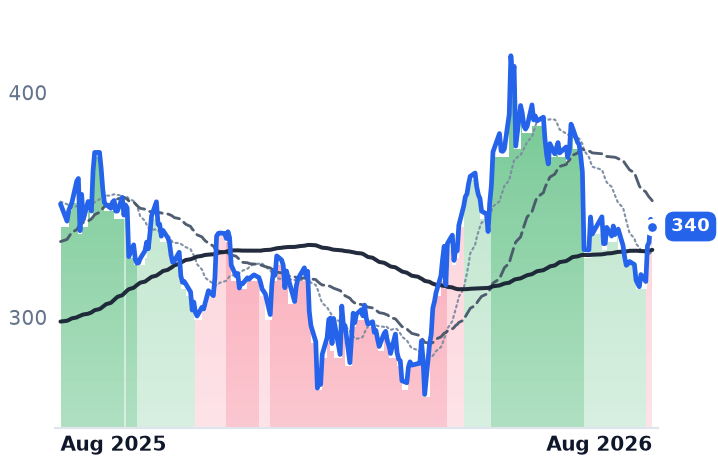
340
−3.24 (−0.94%)
vs. prior close
Price20d50d150d
CDNS 12-month price
Developer Tools & DevOps
SNPS
Synopsys
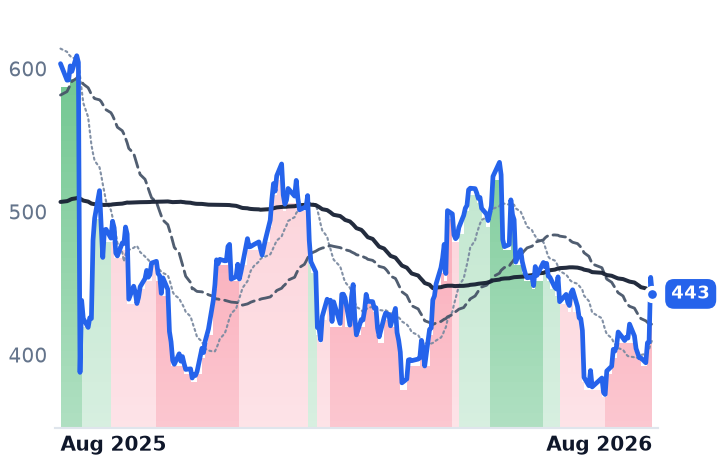
443
−11.58 (−2.55%)
vs. prior close
Price20d50d150d
SNPS 12-month price
EDA & Design Tools
FIG
Figma
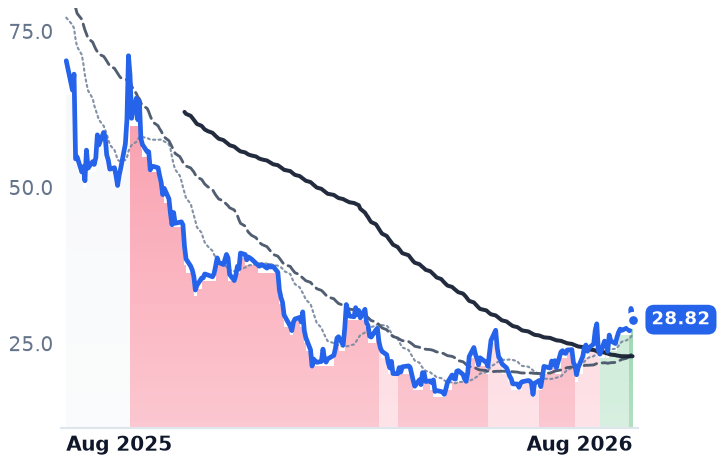
28.82
−1.80 (−5.88%)
vs. prior close
Price20d50d150d
FIG 12-month price
Design & Content Creation
TickerMkt capP/EP/E fwdP/SP/S fwdP/GPP/GP fwdEV/EBITDAFCF yld
CDNS$94.6B67.9x42.2x16.2x15.0x18.3x16.9x43.8x1.8%
SNPS$87.1B187.9x30.8x9.2x9.0x12.8x12.4x30.7x3.2%
FIG$14.9Bn/m106.9x11.6x10.2x14.7x12.8xn/m1.5%
TEAM
Atlassian
190
+4.79 (+2.58%)
vs. prior close
Price20d50d150d
TEAM 12-month price
Developer Tools & DevOps
U
Unity Software
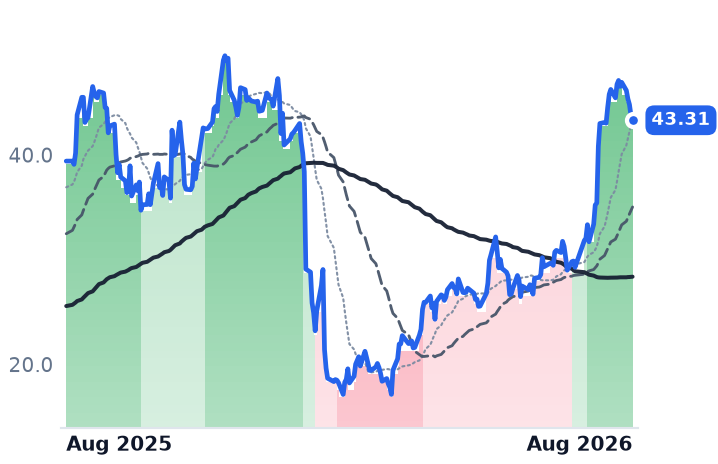
43.31
−0.43 (−0.99%)
vs. prior close
Price20d50d150d
U 12-month price
Design & Content Creation
CRM
Salesforce
256
+3.95 (+1.57%)
vs. prior close
Price20d50d150d
CRM 12-month price
Customer Experience & CRM
TickerMkt capP/EP/E fwdP/SP/S fwdP/GPP/GP fwdEV/EBITDAFCF yld
TEAM$50.0Bn/m34.6x7.6x6.7x9.0x7.9x331.1x2.6%
U$19.8Bn/m9.8x9.3x15.9x15.1xn/m2.7%
CRM$209.7B23.3x15.8x4.8x4.5x6.2x5.9x15.4x7.2%
OKTA
Okta
166
−6.68 (−3.86%)
vs. prior close
Price20d50d150d
OKTA 12-month price
Identity & Access Management
CRWD
CrowdStrike
218
−9.56 (−4.19%)
vs. prior close
Price20d50d150d
CRWD 12-month price
Cybersecurity & Threat Protection
SEMR
Semrush
Price20d50d150d
SEMR 12-month price
Marketing & Advertising Technology
TickerMkt capP/EP/E fwdP/SP/S fwdP/GPP/GP fwdEV/EBITDAFCF yld
OKTA$27.6B98.4x43.2x9.0x8.6x11.5x11.0x68.3x3.5%
CRWD$222.4B174.3x41.2x37.1x54.8x49.2x638.9x0.7%
SEMR$1.8Bn/m30.4x4.1x3.6x5.1x4.4x254.3x2.9%

Consensus projections

TickerFY2026EFY2027EFY2028E
ADBERevenue+12.0%+9.1%+8.8%
EPS+17.2%+12.7%+14.2%
ADSKRevenue+17.0%+15.9%+10.7%
EPS+23.0%+22.9%+12.5%
PTCRevenue+4.9%+6.2%+7.5%
EPS+20.1%+8.5%+10.5%
CDNSRevenue+19.7%+13.6%+11.7%
EPS+15.3%+17.0%+14.3%
SNPSRevenue+37.4%+10.9%+11.9%
EPS+15.2%+16.9%+18.0%
FIGRevenue+40.5%+23.8%+24.1%
EPS−24.4%+26.7%+34.5%
TEAMRevenue+24.7%+15.4%+14.7%
EPS+55.5%−0.1%+21.6%
URevenue+16.1%+14.5%+15.8%
EPS−211.3%−157.9%+88.3%
CRMRevenue+9.3%+11.4%+9.6%
EPS+17.4%+37.6%−1.6%
OKTARevenue+12.0%+10.0%+9.5%
EPS+24.3%+11.7%+10.9%
CRWDRevenue+22.2%+24.9%+22.2%
EPS−1.2%+34.9%+26.4%
SEMRRevenue+14.2%+14.3%+14.4%
EPS+15.5%+24.1%+21.4%

Forward fiscal years only. Blank means no analyst coverage for that year.

Adobe told investors in June it would give up roughly $500m of second-half annualized recurring revenue to push free versions of Acrobat, Express and Firefly, and would defer planned price increases to do it. Ten weeks later Autodesk told a different set of investors it had cut the minimum purchase of its Flex consumption tokens from $300 to $99, and that while it remains committed to charging for application programming interfaces and machine-based usage, it has moved the timing out.

Both companies sell the software seats generative AI is most often said to replace — Adobe's Photoshop, Illustrator and Premiere to creative professionals and Acrobat to everyone else; Autodesk's AutoCAD and Revit to architects and builders, Fusion to manufacturers. The expectation was that they would defend those seats by metering AI on top of them. What the disclosure actually shows is two incumbents spending price to buy usage first. Adobe's creative freemium monthly active users went from more than 50m to more than 90m, and total monthly actives passed 850m. Its AI-first recurring revenue tripled year-on-year to surpass $500m — a different $500m from the one being given away, and still under two cents of every ARR dollar.

The mix line went away

Checking price against units at either company just got harder. Effective in the first quarter of fiscal 2026, Adobe combined Digital Media, Digital Experience and Publishing into a single reportable segment, retiring Digital Media ARR in favor of one total — $27.10bn, up 12.5%, of which about $480m arrived with the Semrush acquisition. Autodesk said on August 27 it will stop reporting design and make revenue, substituting construction, Fusion, operations and MaintainX. Each removed the line the question depended on.

Growth without leverage, and leverage without growth

Adobe's revenue rose 12.7% to $6.618bn in its April-quarter, the fourth straight acceleration. Operating income grew 6.1%, and margin fell to 33.8% from 35.9%; diluted earnings per share held at $4.25 mainly because the share count shrank 7.2%. Gross margin was flat at 89.2%, so the cost of generating images is not yet visible in cost of revenue. Meanwhile Canva has reached about $4bn of recurring revenue growing 35%, roughly 15% the size of Adobe's base.

Autodesk is the mirror image. Revenue grew 16.1% to $2.046bn with GAAP operating margin expanding to 29.3% from 25.5% and operating income up 33.1%. But billings grew 10%, slower than revenue; remaining performance obligations of $7.43bn were down 10% against the prior fiscal year end and deferred revenue down 9%, which the company attributes to reducing multi-year discounts. Contract durations are shortening. About 1.5 points of this year's revenue growth is the reseller-incentive reclassification under its new transaction model, and it does not recur next year. Net revenue retention sits slightly above the 100-110% range.

The construction number is the genuine one: growth north of 20% while the Architecture Billings Index stood at 46.6 in July, below the expansion line for nearly three and a half years. That is share taken, not a cycle. "The future of AI won't belong to the company with the best single model," chief executive Andrew Anagnost told investors on the August 27 call. "It will belong to the platform that combines the richest context with the right models to deliver the best outcomes for customers." Chief financial officer Janesh Moorjani said gross margins are flat this year but "will face compression from AI workloads over time."

What the shares priced

On August 27 the whole software complex re-rated on other companies' guidance — Salesforce, Okta and CrowdStrike all surged — and Adobe rose 6.3% and Autodesk 7.2% with no news of their own. That session supplied 61% of Adobe's thirty-day gain and more than all of Autodesk's. The next day Autodesk fell 3.6% after full-year earnings guidance of $12.52-12.60 straddled the $12.60 consensus. Over twelve months Adobe is down 17.6% and Autodesk 9.6%.

Adobe trades at 16.66x trailing and 11.95x forward earnings with a 9.2% free-cash-flow yield, against a five-year median trailing price-to-earnings near 42. Autodesk trades at 33.59x trailing and 20.73x forward — about 1.7x Adobe's forward multiple — on a 5.1% free-cash-flow yield.

The honest split: Autodesk's margin expansion and raised guidance are earned, minus the accounting point and a half; Adobe's move is arithmetic on cash flow from a deeply de-rated base, because nothing in its numbers yet shows AI paying for the seats it is meant to defend. Neither company's August gain was earned by either company.

Adobe's next quarter is the first to carry the freemium giveaway in full, and aggregators list it for September 10, though Adobe has not published the date itself. It will be presented by an interim finance chief: Dan Durn resigned four days after the June print and no permanent successor has been named.

Snowflake and MongoDB Report This Week With Backlog Outgrowing Consumed Revenue

Hypothesis Opus 5 · Research Opus 5 · Writing Opus 5 · Prompt v1.6

Two data platforms that bill by the credit and the gigabyte have re-rated hard through a summer in which neither published a financial statement. Both fix that this week: MongoDB after the close on Tuesday, Snowflake on Wednesday.

The April quarters were strong — Snowflake's product revenue grew 34%, a third straight quarter of acceleration, and MongoDB's Atlas added a record $117m of year-on-year revenue to reach 75% of the total. But what is contracted is outrunning what is burned: MongoDB's remaining performance obligations grew 88% against 25% revenue growth. And the only dollar figure either company has ever attached to artificial-intelligence usage is Snowflake's $100m annualized run-rate, disclosed last December.

The businesses earn a re-rating. Nothing disclosed yet explains its pace.

SNOWMDBDDOGESTCCloud Data PlatformsConsumption-Based BillingManaged Database ServicesAI Workload MonetizationContracted Backlog ConversionUnprofitable Growth Software
TickerCompanySegmentTrend · 13mo30D1Y
The subject · what this brief is about
SNOWSnowflakeData & Analytics Platforms🌱 Emerging Bull+10.0%+37.4%
MDBMongoDBData Management & Analytics🟢 Cont. Bull+37.1%+41.5%
Compared against · context, not the story
DDOGDatadogData & Analytics Platforms🌱 Emerging Bull−11.8%+73.4%
ESTCElasticData & Analytics Platforms🌱 Emerging Bull+55.5%+17.5%

12-month price & trend

SNOW
Snowflake
328
−2.57 (−0.78%)
vs. prior close
Price20d50d150d
SNOW 12-month price
Data & Analytics Platforms
MDB
MongoDB
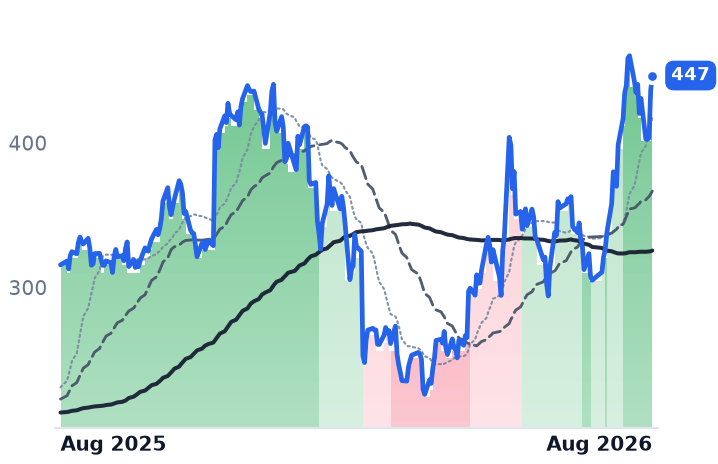
447
+10.33 (+2.37%)
vs. prior close
Price20d50d150d
MDB 12-month price
Data Management & Analytics
DDOG
Datadog
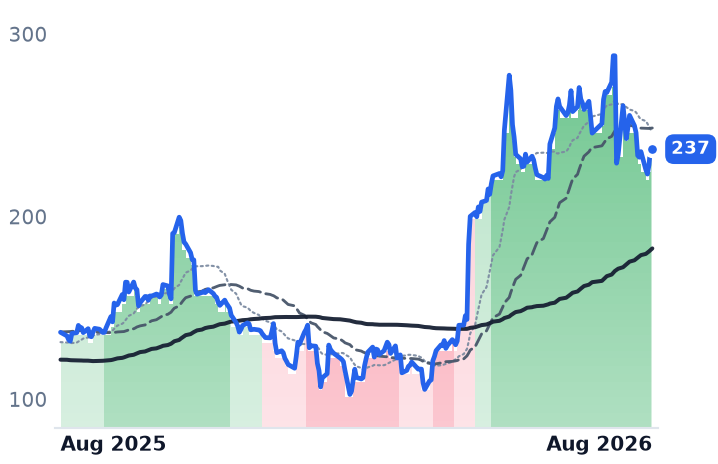
237
−2.46 (−1.03%)
vs. prior close
Price20d50d150d
DDOG 12-month price
Data & Analytics Platforms
TickerMkt capP/EP/E fwdP/SP/S fwdP/GPP/GP fwdEV/EBITDAFCF yld
SNOW$113.7Bn/m169.5x22.6x18.6x33.6x27.7xn/m1.0%
MDB$35.9Bn/m72.9x13.8x12.1x19.2x16.8x1.7%
DDOG$86.5B488.6x96.0x21.8x19.4x27.4x24.3x331.7x1.3%
ESTC
Elastic
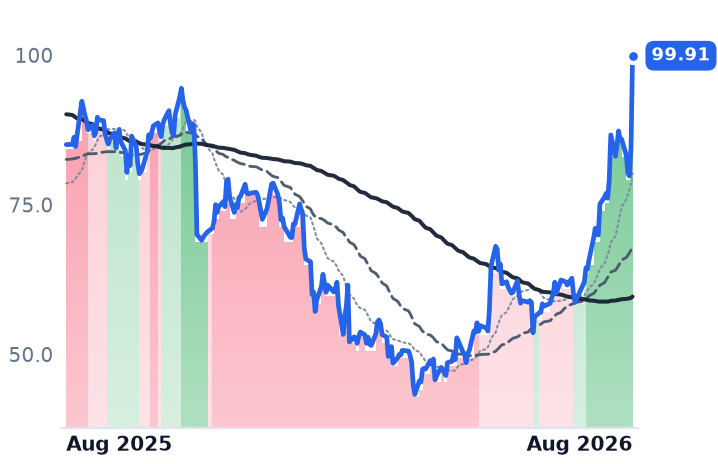
99.91
+15.24 (+18.00%)
vs. prior close
Price20d50d150d
ESTC 12-month price
Data & Analytics Platforms
TickerMkt capP/EP/E fwdP/SP/S fwdP/GPP/GP fwdEV/EBITDAFCF yld
ESTC$10.4B27.6x30.8x5.8x5.2x7.6x6.9x159.3x3.4%

Consensus projections

TickerFY2026EFY2027EFY2028E
SNOWRevenue+29.4%+31.1%+26.0%
EPS+72.3%+59.6%+42.0%
MDBRevenue+23.1%+21.5%+18.0%
EPS+59.1%+27.3%+19.7%
DDOGRevenue+31.7%+22.3%+22.9%
EPS+25.3%+17.0%+22.2%
ESTCRevenue+17.6%+15.0%+14.5%
EPS+30.3%+28.2%+18.8%

Forward fiscal years only. Blank means no analyst coverage for that year.

MongoDB's July quarter lands after the close on Tuesday, the first financial statement the document-database company has published since late May. Snowflake, which sells the consumption-billed Data Cloud, follows a day later. Between the two prints sits every dollar of a summer re-rating that arrived without a single new disclosure.

That is the stake. Both companies bill by usage rather than by the employee seat, which means production artificial-intelligence workloads either show up as consumed revenue or they do not. The market has spent three months deciding they will. Snowflake now trades at 33.6 times trailing gross profit, against roughly 28x at the end of July and about 15.7x in early May. MongoDB has gone from 13.3x to 19.2x since late July — a 44% re-rating in a month against zero new financials. Neither company earns a meaningful profit, so gross profit is what there is to price.

The April quarters were good

Snowflake's product revenue reached $1.334bn in the quarter ended 30 April, up 34% year on year and accelerating for a third consecutive quarter. Net revenue retention rose to 126%, and customers spending more than $1m a year numbered 779, growing 29% while total customers grew about 20% — expansion concentrated where the compute is. Management raised the full-year product outlook to $5.84bn, telling investors on 27 May that "based on a combination of strength in our core data platform business and meaningful uplift from AI capabilities, including Coco and Snowflake Intelligence, we are increasing our FY 2027 outlook from 27% to 31% year-over-year growth," according to the call transcript.

MongoDB's Atlas managed-database service grew 29.4% to about $512.5m, a record $117m year-on-year dollar increase that carried it past a $2bn annualized run rate and to 75% of company revenue. One popular bear case can be retired: the self-managed Enterprise Advanced line, whose upfront licence recognition is often blamed for flattering reported growth, grew only 13% to $153.7m. It is a drag on the reported number, not a prop.

Booked is not burned

What both companies have signed is growing faster than what customers have burned. MongoDB's remaining performance obligations — contracted revenue not yet recognized — grew 88% to $1.5bn against 25% revenue growth. Snowflake's reached $9.205bn, up 37.7%, with only about half expected to convert to revenue inside twelve months. Commitments of that shape are a floor under a stock and a promise about future consumption; they are not consumption.

The missing number is a dollar figure for AI. Snowflake quantified adoption in the April quarter only in accounts — more than 13,600 using AI features — and its one disclosed dollar figure remains the $100m annualized AI run-rate from December 2025, roughly 2% of the product guide. MongoDB has disclosed none. Chief executive CJ Desai made the architectural case on the 28 May call — "Agentic workloads need memory that is transactional, high velocity, and able to retrieve the right context at the right time," he told analysts — while UBS analyst Karl Keirstead's customer checks found "limited evidence of material AI pull-through to MongoDB at this time". He raised his target to $460 from $350 on 24 August and kept a Neutral rating.

What the meter does in reverse

Datadog, the observability vendor billed on the same principle, lost a fifth of its value on 6 August after its largest customer, a nine-figure AI account running 17 of its products, renewed at reduced usage. Datadog beat the quarter and raised the full year for a third straight time; third-quarter growth guidance of about 29% was what mattered. Chief executive Olivier Pomel declined to name the client.

The two share moves have different textures. MongoDB's 37% gain over the past 30 sessions is a grind — strip its two best days and 17.6% remains. Snowflake's 10% is not: two sessions, 3 and 27 August, account for essentially all of it. Both sit inside a rotation out of semiconductors and into beaten-down software that has lifted the main software exchange-traded fund about 18% since 23 July.

The verdict splits. The businesses earn a re-rating: accelerating product revenue at Snowflake and record Atlas dollar adds at MongoDB are real, and the margin erosion bears expected is mild — Snowflake held its 75% non-GAAP product gross-margin guide, MongoDB's subscription margin slipped 60 basis points from a year earlier to 77.1%. What nothing yet explains is the pace. No disclosed consumption dollar justifies a 44% multiple expansion in four weeks, and Snowflake's own second-quarter guide of $1.415bn to $1.420bn implies growth stepping down toward 30%. Snowflake has also committed to spend a minimum $6bn with Amazon Web Services over five years, so its own capacity bill is contracted whether or not customers burn theirs.

Datadog's lesson is the one to carry into Tuesday and Wednesday: in a business paid by usage, a single account deciding to consume less is a guidance event. Both of these companies have spent the summer being priced as though nobody will.

NetApp's Public Cloud Slipped to 9.9% of Revenue as Hardware Grew 14.3%

Hypothesis Opus 5 · Research Opus 5 · Writing Opus 5 · Prompt v1.6

NetApp's fourth quarter was read as proof that a storage-array maker had become a cloud and data-infrastructure company. Its own segment table says the recurring end of the business did not gain share in fiscal 2026: public cloud slipped to 9.9% of revenue from 10.1%, support held at 38.1%, and in the decisive quarter arrays grew faster than the company did.

The growth that arrived is the kind NetApp itself says costs margin. Product gross margin was 56.1% in the quarter against 61.3% two years earlier, and fiscal 2027 group gross margin is guided to 68.5–69.5% from 71.3% on component costs. NetApp reports the quarter its finance chief called the product-margin trough on 2 September, into consensus earnings sitting above the top of its own guide.

NTAPDELLHPEMUWDCSTXEnterprise Storage ArraysNAND Component CostsMemory Supply ShortageHybrid Cloud StorageAI Infrastructure DemandHardware Gross Margins
TickerCompanySegmentTrend · 13mo30D1Y
The subject · what this brief is about
NTAPNetAppEnterprise Storage & Software🟢 Cont. Bull+7.5%+68.2%
Compared against · context, not the story
DELLDell TechnologiesEnterprise Storage & Software🟢 Cont. Bull+12.7%+277.6%
HPEHewlett Packard EnterpriseEnterprise Storage & Software🟢 Cont. Bull+11.0%+135.9%
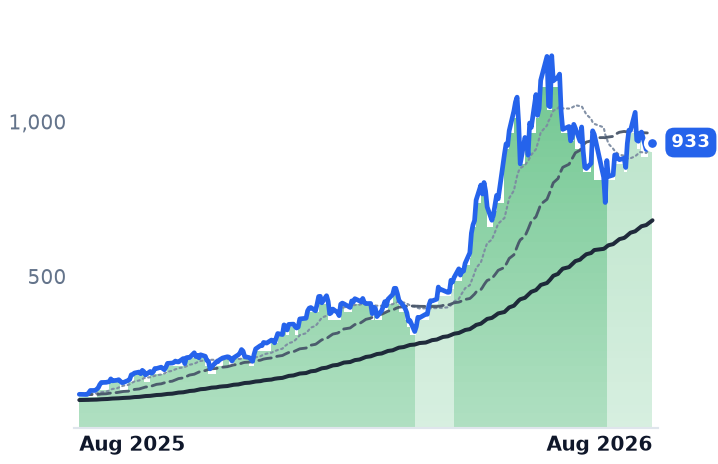
MUMicron TechnologyMemory (DRAM/NAND)🟢 Cont. Bull+6.7%+685.0%
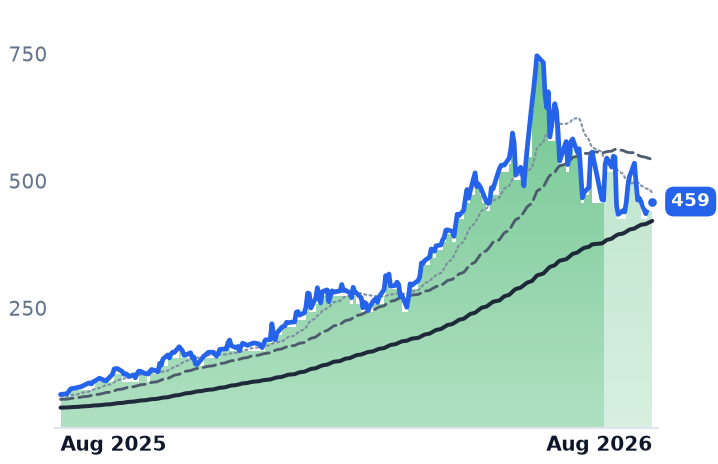
WDCWestern DigitalData Storage Devices🟢 Cont. Bull−13.8%+473.3%
STXSeagate TechnologyData Storage Devices🟢 Cont. Bull−2.6%+399.4%

12-month price & trend

NTAP
NetApp
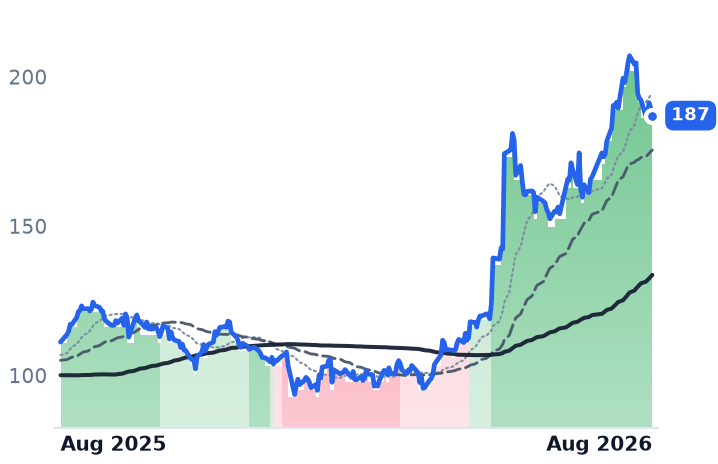
187
−2.47 (−1.31%)
vs. prior close
Price20d50d150d
NTAP 12-month price
Enterprise Storage & Software
DELL
Dell Technologies
456
−16.02 (−3.39%)
vs. prior close
Price20d50d150d
DELL 12-month price
Enterprise Storage & Software
HPE
Hewlett Packard Enterprise
52.31
−2.61 (−4.75%)
vs. prior close
Price20d50d150d
HPE 12-month price
Enterprise Storage & Software
TickerMkt capP/EP/E fwdP/SP/S fwdP/GPP/GP fwdEV/EBITDAFCF yld
NTAP$36.7B29.1x20.7x5.3x4.9x7.5x6.9x19.1x5.1%
DELL$308.2B36.3x24.6x2.3x1.8x12.1x9.3x22.2x3.1%
HPE$73.1B50.7x16.1x1.9x1.6x5.7x4.9x22.2x5.5%
MU
Micron Technology
933
+16.67 (+1.82%)
vs. prior close
Price20d50d150d
MU 12-month price
Memory (DRAM/NAND)
WDC
Western Digital
459
+4.64 (+1.02%)
vs. prior close
Price20d50d150d
WDC 12-month price
Data Storage Devices
STX
Seagate Technology
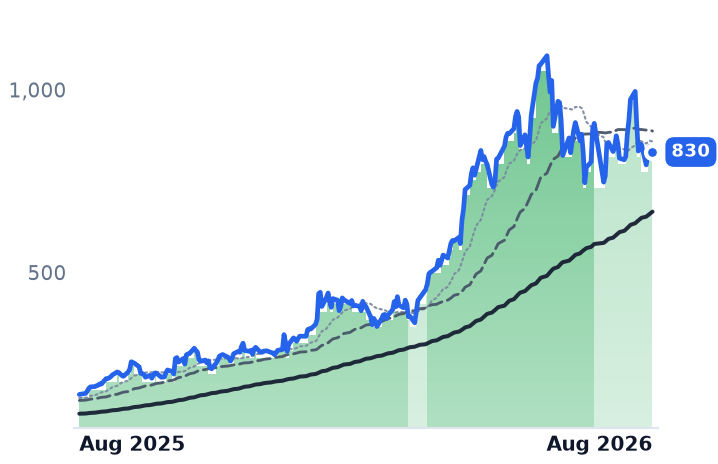
830
−11.53 (−1.37%)
vs. prior close
Price20d50d150d
STX 12-month price
Data Storage Devices
TickerMkt capP/EP/E fwdP/SP/S fwdP/GPP/GP fwdEV/EBITDAFCF yld
MU$1.0T19.9x12.2x11.2x7.8x15.4x10.7x14.5x2.6%
WDC$166.1B25.6x48.3x14.1x12.9x31.1x28.4x31.1x1.7%
STX$178.4B73.9x53.5x16.2x14.8x39.0x35.7x53.6x1.5%

Consensus projections

TickerFY2026EFY2027EFY2028E
NTAPRevenue+4.3%+10.1%+5.7%
EPS+10.4%+13.0%+11.2%
DELLRevenue+16.2%+55.3%+14.9%
EPS+27.3%+89.4%+21.3%
HPERevenue+30.5%+11.6%+5.8%
EPS+81.3%+18.7%+10.1%
MURevenue+248.0%+92.8%+11.4%
EPS+804.9%+111.2%+7.9%
WDCRevenue+36.9%+37.2%+26.5%
EPS+106.2%+72.8%+48.0%
STXRevenue+32.7%+35.9%+24.9%
EPS+86.9%+77.9%+48.0%

Forward fiscal years only. Blank means no analyst coverage for that year.

NetApp's fourth quarter was received as evidence that a storage-array maker had become a data-infrastructure and cloud company. Its own segment table says the quarter was carried by boxes. Product revenue — arrays, not licenses or cloud services — was 49.6% of the total in the three months reported on 28 May, up from 48.8% a year earlier, and grew 14.3% against total revenue growth of 12.5%.

That matters because of what NetApp told investors would happen next. The company guided fiscal 2027 group gross margin to 68.5–69.5%, down from 71.3% delivered in fiscal 2026 — roughly $150m of gross profit at the guided revenue range — and added to its own risk-factor list "our ability to manage our gross profit margins, including managing component costs." The segment doing the growing is the segment being taxed. NetApp reports first-quarter fiscal 2027 results after the close on 2 September.

The mix that did not move

For the full year, public cloud was 9.9% of revenue, at $688m of $6,925m, against 10.1% the year before; support was 38.1% against 38.2%; product was 46.1% against 46.3%. Public cloud gross margin genuinely improved, reaching 85.7% in the quarter from 79.3% a year earlier — but the segment threw off $156m of $1,374m in total segment gross profit, about a ninth. Stripping out Spot, the optimization business divested in March 2025, management shows cloud storage revenue of $540m, up 30%. That is a real line growing quickly inside a company where it does not yet move the average.

There is also nothing to check it against. NetApp discloses no annual recurring revenue of any kind. The nearest consumption disclosure is Keystone storage-as-a-service total contract value of $300m for the year, up 34% — a bookings figure worth roughly 4% of revenue. No capacity-shipped metric is published either, so price and volume cannot be separated from company filings. Billings grew 6.4% in the quarter against revenue up 12.5%, the usual signature of demand pulled forward.

An industry cycle, priced through

Product gross margin was 56.1% in the fourth quarter, against 55.4% a year earlier and 61.3% two years earlier. Chief financial officer Wissam Jabre told analysts on the 28 May call that product margin should trough in the July quarter and improve gradually as pricing changes flow through, tying the pressure to memory and component costs. Those costs are not NetApp's alone: NAND flash contract prices rose sharply through 2026 as memory makers moved wafer capacity toward high-bandwidth memory for artificial-intelligence accelerators.

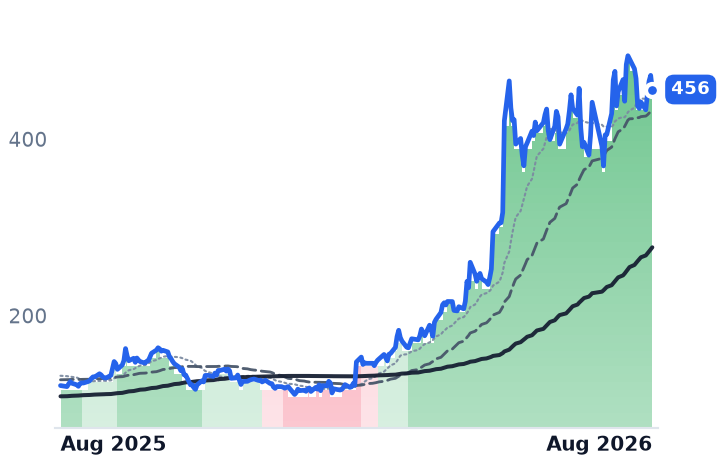
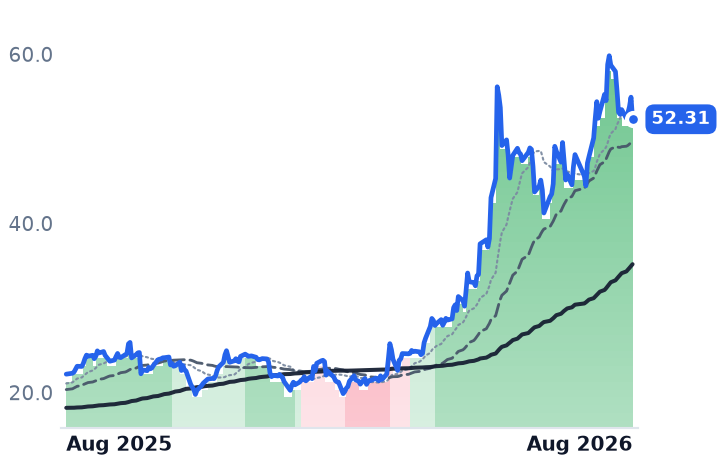
Everpure, the all-flash array vendor formerly called Pure Storage, is the cleanest check. It reported on 26 August with revenue up 37.7% to $1.19bn, raised full-year guidance by more than $500m, burned $136m of operating cash flow on strategic NAND purchases, and said it is deliberately running near the low end of its 65–70% product gross-margin band while component costs escalate. Chief executive Charlie Giancarlo told analysts only some of the acceleration is price. IDC put first-quarter industry storage revenue at $9.2bn, up 22.7%, crediting artificial-intelligence demand, deferred refresh and component inflation at once. Dell and Hewlett Packard Enterprise shares rose more than NetApp's over the same three months, and on price to trailing gross profit Hewlett Packard Enterprise, at 5.71x, is cheaper than NetApp while Dell, at 12.06x, is dearer.

What the price has already paid for

The advance was not a grind. The shares went from $142.40 to $174.29 on 29 May, roughly 44% of the whole move's log-return in one session, and sit 9.7% below the 14 August high of $207.08. Price to trailing gross profit is 7.49x against roughly 5.3x when the uptrend began in May — about 42% of multiple expansion while gross-profit dollars grew 6.2%. Trailing earnings are capitalized at 29.1x on 5.4% annual revenue growth, and consensus fiscal 2027 earnings of $9.02 sit above the top of the company's own $8.70–9.00 guide, leaving the guided margin compression no room in estimates.

The business is genuinely better: revenue growth accelerated every quarter of fiscal 2026, non-GAAP operating margin reached 32%, all-flash revenue hit a record $1,216m, up 18%, and free cash flow funded $950m of buybacks. What the market appears to have bought, though, is a software mix shift the accounts do not show. The earnings the shares are capitalized on are hardware earnings arriving into the steepest input-cost cycle storage has seen in years, and the growth and the margin risk now sit in the same line — the diversification the cloud segment was supposed to provide is too small to hedge it.

George Kurian called fiscal 2026 "a record year for NetApp." It was, and the record was set in arrays. Whether July was the bottom of the product margin or the first leg of a longer descent is answerable on 2 September — and until then there is no recurring-revenue line to watch instead.

Sources (44)

Also checked against 17 source documents, 9 company-fundamentals reads, 8 price-database queries, 4 research notes in the author's own data.

Originating hypothesis

single ticker secular streak cloud vs hardware meter · subject: NTAP

NetApp has held a strongly bullish band for 100 consecutive days since 21 May with no violent session anywhere in the 1m/3m/6m/12m mover lists — a pure grind — and it is the storage-and-data rung of the cloud stack that this desk has written around (Cloudflare, Akamai, Elastic, DigitalOcean, the resellers) but never made a protagonist; the question worth investigating is the meter end to end at a vendor that sells the same ONTAP software three ways — as an appliance, as a licence, and as a first-party service inside AWS, Azure and Google — namely whether the advance is being paid for by genuinely recurring cloud and software consumption (public cloud services revenue and ARR, all-flash array ARR, support and subscription mix, billings-to-revenue conversion) or by a hardware refresh whose reported growth is NAND and DRAM price inflation passed through at a lower margin, with product gross margin the line that decides which it is.

Insight Booked 39% More Cloud Profit on Software Sales That Fell 6%

Hypothesis Opus 5 · Research Opus 5 · Writing Opus 5 · Prompt v1.6

A reseller that sells a cloud subscription as an agent books only its own margin as revenue, so its fastest-growing line shrinks its reported sales. Applying that meter to the two mid-cap corporate resellers splits them.

Insight's cloud and services gross profit supplied roughly 81% of the $79.3m of gross-profit growth in its June quarter, with gross margin reaching 21.7%. Connection's gross billings rose 14% against net sales up 12.4% — the share booked net barely moved — and endpoint device units grew 3% while device revenue grew 19%, a memory-driven price wave rather than subscription throughput.

The name that passed the software test trades at 12.4x forward earnings; the one selling costlier laptops trades at 19.1x.

NSITCNXNCDWEnterprise IT ResellersCloud Subscription ShiftAgent Revenue RecognitionMemory-Driven PC PricingVendor Partner ProgramsAI Infrastructure Buildout
TickerCompanySegmentTrend · 13mo30D1Y
The subject · what this brief is about
NSITInsight EnterprisesEnterprise IT Solutions🌱 Emerging Bull+21.8%+19.6%
CNXNPC ConnectionEnterprise IT Solutions🌱 Emerging Bull−4.2%+25.2%
Compared against · context, not the story
CDWCDWIT Infrastructure & Operations🌱 Emerging Bull+2.0%−9.5%

12-month price & trend

NSIT
Insight Enterprises
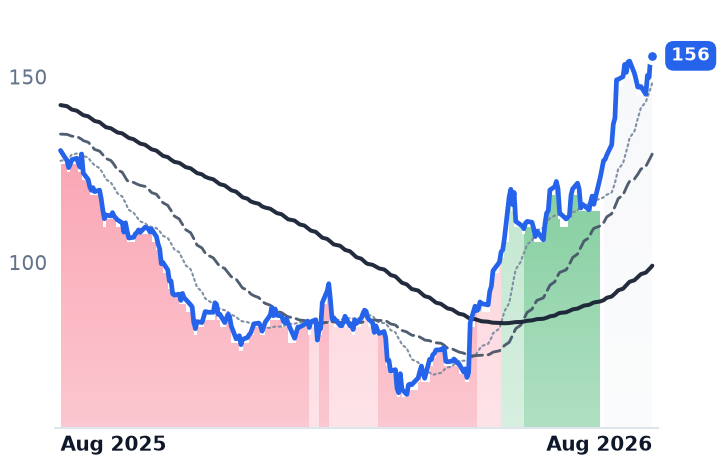
156
−0.03 (−0.02%)
vs. prior close
Price20d50d150d
NSIT 12-month price
Enterprise IT Solutions
CNXN
PC Connection
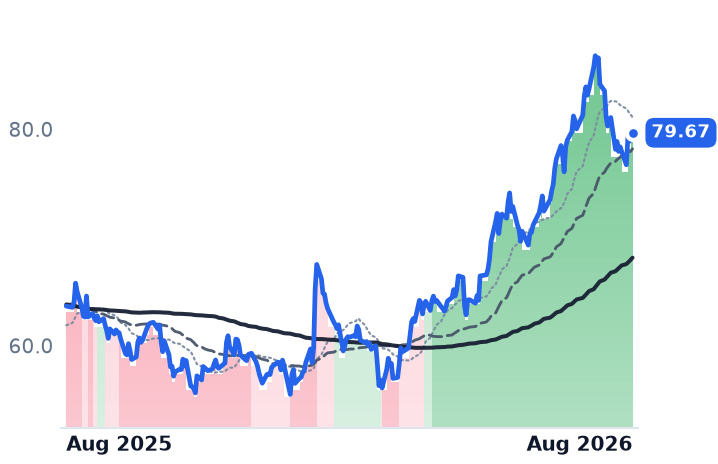
79.67
−0.43 (−0.54%)
vs. prior close
Price20d50d150d
CNXN 12-month price
Enterprise IT Solutions
CDW
CDW
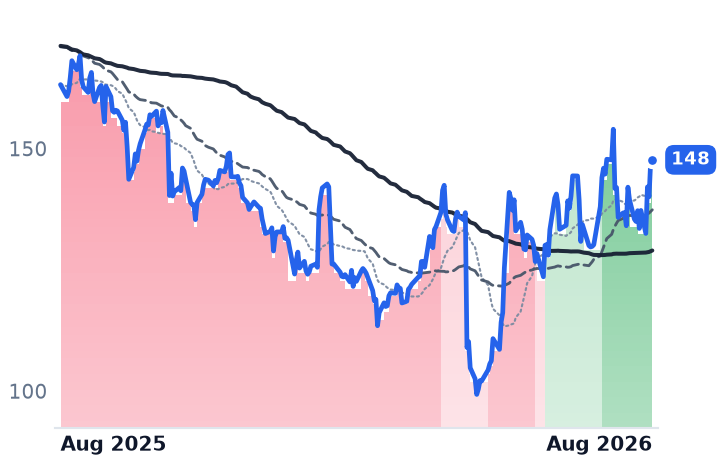
148
+0.28 (+0.19%)
vs. prior close
Price20d50d150d
CDW 12-month price
IT Infrastructure & Operations
TickerMkt capP/EP/E fwdP/SP/S fwdP/GPP/GP fwdEV/EBITDAFCF yld
NSIT$4.7B22.7x12.4x0.5x0.5x2.5x2.4x12.8x9.0%
CNXN$2.0B21.0x19.1x0.7x0.6x3.6x3.4x13.2x1.7%
CDW$18.9B17.7x13.5x0.8x0.8x3.8x3.6x13.4x5.9%

Consensus projections

TickerFY2026EFY2027EFY2028E
NSITRevenue+6.7%+3.8%+6.2%
EPS+28.5%+6.0%+16.6%
CNXNRevenue+7.0%+2.4%
EPS+22.8%+6.9%
CDWRevenue+8.9%+3.7%+2.8%
EPS+10.5%+9.2%+8.9%

Forward fiscal years only. Blank means no analyst coverage for that year.

When a corporate IT reseller signs a customer up to a cloud subscription, it often books none of the customer's money as its own revenue — only the sliver it keeps. Insight Enterprises, the Tempe, Arizona firm that sources, configures and finances hardware, software and cloud licences for corporate IT departments, reported software net sales down 6% in its June quarter while cloud gross profit rose 39% to $171m. Both facts describe the same shift.

That makes reported revenue nearly useless as a growth meter for this rung of the industry. Insight's own filing states that software delivered as a service is presented net, inside agent services revenue, rather than gross — so a subscription that wins share shrinks the top line and shows up only in gross profit. Run the meter across the channel and it separates the companies whose profit growth is software being consumed from those whose profit growth is a hardware price wave.

Insight passes the test, with a caveat it named itself

Cloud gross profit of $171m and core services gross profit of $95m, up 21%, together supplied about 81% of the $79.3m by which Insight's gross profit grew. Software fell to 16% of net sales from 21%. Gross margin reached 21.74% from 21.15%, operating expenses ran at 65% of gross profit against a 67% first-half average, and net income rose 65% to $77.6m on a diluted share count down 6.1% — leverage on a growing base, with buybacks a minor contributor. Revenue growth over four quarters ran from minus 4.0% to plus 14.7%, and gross profit outgrew it every quarter. Management raised full-year guidance to gross-profit growth of 8-10% and adjusted diluted earnings of $12.20 to $12.70 a share.

"Our pivot to become the leading solution integrator for the age of AI is working," chief executive Jack Azagury told investors on the August 6 call, before conceding that acquisitions and support functions "have not yet been fully integrated into a common operating model." Two caveats sit under the cloud line. Hardware net sales grew 21%, with infrastructure servers, storage and networking up more than 20% on both units and prices, at 110 basis points of lower hardware gross margin. And a year earlier, vendor partner-program changes held cloud gross-profit growth to 11%. Insight has flagged "Google Partner program compares" as a fourth-quarter headwind. Part of this annuity is repriceable by the vendors who fund it.

Connection sold the same number of laptops for more money

Connection, the Merrimack, New Hampshire reseller serving small and mid-sized businesses, government and education, publishes gross billings — the full value billed, including amounts never recognized in sales. Those rose 14% to $1.2bn against net sales up 12.4% to a record $854m. The netted share barely budged, the same near-parallel movement as the March quarter. Endpoint device units grew 3%; endpoint device revenue grew 19%. Business Solutions, its largest division, set a sales record with gross margin 50 basis points lower at 23.0%. Chief executive Tim McGrath described customers moving from "AI experimentation to enterprise-wide adoption" on the second-quarter call, with backlog at a three-year high — but the quarter's earnings leverage came from selling costs falling to 13.4% of sales, and inventory rose $61.5m and receivables $80.6m behind the record profit.

The macro fits exactly. IDC forecasts global personal-computer shipments down 11.3% in 2026 with average selling prices up 18.3%, driven by a memory shortage with no relief expected before the end of 2027. A reseller books more revenue on fewer machines.

CDW, the largest US corporate reseller, discloses the meter outright: netted-down revenues grew 16.1% and reached 35.9% of gross profit, up 300 basis points. It still turned 10.0% revenue growth into 6.3% gross-profit growth, gross margin 70 basis points lower on large infrastructure deals. Its shares fell 11.0% over the twelve months to August 28. The re-rating has been selective.

What the prices pay for

Insight rose 22.2% in the thirty days to August 28 and 86.3% over six months, closing August 27 at $155.68 against a twelve-month low of $64.43 — through violent sessions, including 19.07% on May 8 and 7.46% on results day, with brokers marking targets up sharply afterwards, Raymond James to $175 from $100. Connection fell 5.1% over the same month after peaking on August 4.

On price to gross profit — the comparison that survives the netting distortion — Insight is the cheapest of the three at 2.48x trailing, against Connection's 3.56x and CDW's 3.76x. The discount shrinks to roughly 5% on enterprise value to earnings before interest, tax, depreciation and amortization, because Insight carries $1.5bn of net debt while Connection holds $340.7m of cash and investments. Insight's 22.7x trailing earnings compresses to 12.4x forward; Connection's 21.0x compresses only to 19.1x.

So the mix test and the price disagree. Insight's advance is earned by the part of its book that grows gross profit while shrinking sales, and what its discount pays for is leverage plus a cloud line that a vendor program can cut in half. Connection has the cleaner balance sheet and a record quarter, but nothing in its numbers shows software displacing hardware — its margin moved the wrong way, on the mix its customers actually bought. Pricing it for perfection requires the device wave to keep paying.

And that wave has two sides. The memory shortage inflating Connection's device revenue is the same cost pressure Insight named as a headwind for its own second half. One of these companies is being paid by the shortage; the other has told investors it expects to absorb it.

Akamai Signed $2.8bn of Compute Commitments, More Than Cloudflare's Entire Backlog

Hypothesis Opus 5 · Research Opus 5 · Writing Opus 5 · Prompt v1.6

The two companies that run the internet's edge have taken opposite positions on who should own the hardware that carries artificial-intelligence traffic, and only one of them is paying for it in cash.

Akamai spent 32% of June-quarter revenue on capital equipment and suspended its buyback, and its gross profit fell 0.5% year over year while revenue grew 5.4%. The signed commitments behind that spending are real, but the revenue they buy is dated to 2027. Cloudflare sells subscriptions to a network it already built, grew dollar-based net retention to 120% from 114%, and still watched gross margin slide as paid traffic shifted costs into cost of revenue.

Neither escapes the mechanism. Akamai books the depreciation now; Cloudflare books the traffic.

AKAMNETDOCNEdge Network InfrastructureAI Compute CapexContent Delivery & SecurityGross Margin CompressionSubscription Backlog Economics
TickerCompanySegmentTrend · 13mo30D1Y
The subject · what this brief is about
NETCloudflareNetwork & Application Delivery🟢 Cont. Bull+5.8%+43.7%
Compared against · context, not the story
AKAMAkamai TechnologiesNetwork & Application Delivery🟢 Cont. Bull−5.5%+35.8%
DOCNDigitalOceanCloud Infrastructure & Platforms🟢 Cont. Bull−7.5%+240.9%

12-month price & trend

AKAM
Akamai Technologies
107
−3.77 (−3.39%)
vs. prior close
Price20d50d150d
AKAM 12-month price
Network & Application Delivery
NET
Cloudflare
300
−8.39 (−2.72%)
vs. prior close
Price20d50d150d
NET 12-month price
Network & Application Delivery
DOCN
DigitalOcean
111
−10.47 (−8.60%)
vs. prior close
Price20d50d150d
DOCN 12-month price
Cloud Infrastructure & Platforms
TickerMkt capP/EP/E fwdP/SP/S fwdP/GPP/GP fwdEV/EBITDAFCF yld
AKAM$15.7B38.0x16.1x3.6x3.5x6.4x6.2x18.3x4.0%
NET$106.4Bn/m237.7x42.3x37.1x58.3x51.1x0.4%
DOCN$13.0B44.1x76.5x12.9x11.1x22.5x19.3x36.7x0.1%

Consensus projections

TickerFY2026EFY2027EFY2028E
AKAMRevenue+7.2%+12.8%+10.8%
EPS−4.6%+6.1%+13.9%
NETRevenue+33.7%+28.7%+27.5%
EPS+38.0%+32.5%+35.3%
DOCNRevenue+31.2%+53.5%+43.7%
EPS−29.0%+23.2%+60.4%

Forward fiscal years only. Blank means no analyst coverage for that year.

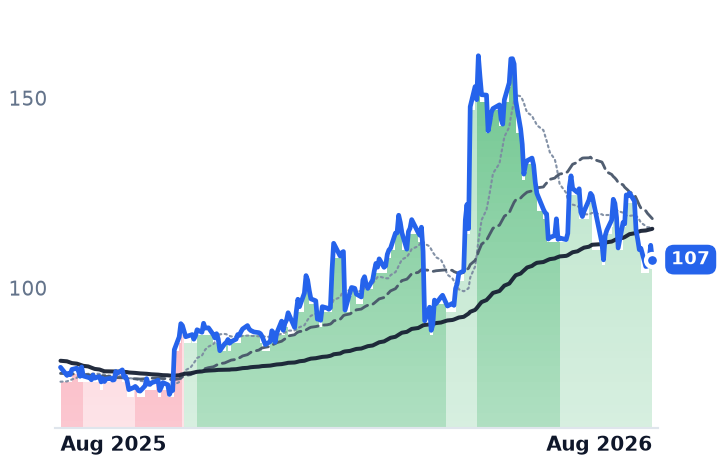
Akamai spent $347m on capital equipment in the June quarter — about 32% of revenue — and suspended its share buyback to keep spending. The company, which delivers and secures web traffic for enterprises and now rents cloud compute alongside it, has signed more than $2.8bn of multi-year cloud-infrastructure commitments so far this year, including a $600m robotics-compute deal disclosed on its August 6 earnings call. Full-year capital spending is guided near 40% of revenue.

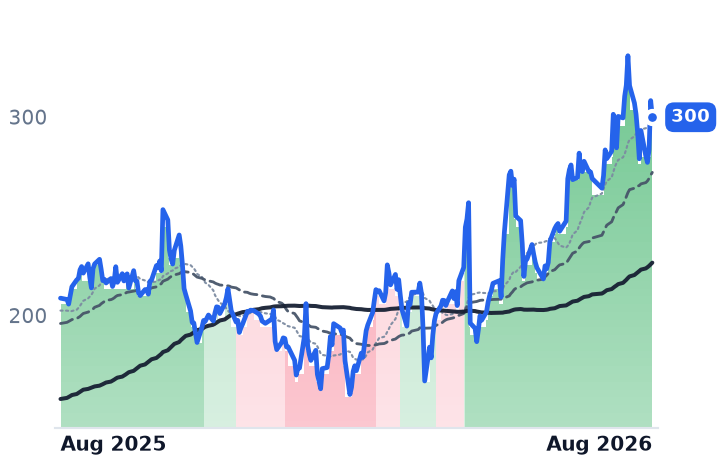
That figure is the whole argument. Two companies sell into the same socket — the network layer every application and every automated agent passes through — and they have split on who should own the machines that serve artificial-intelligence workloads. Akamai is buying them, on its own balance sheet, against contracts that convert later. Cloudflare, at seven times Akamai's market value, has publicly refused. "If you're selling what is just commodity compute, if you're basically letting an AI company use your balance sheet and your credit rating in order to buy servers that are the same as everybody else's servers, then that's just not attractive business for us," co-founder and chief executive Matthew Prince told investors on the August 6 call.

What the spending has cost so far

Akamai's June-quarter revenue rose 5.4% to $1.100bn, and gross profit fell 0.5% against the year-ago quarter. Reported gross margin dropped to 55.8% from 59.1%. The hardware arrives before the revenue does, and depreciation lands in cost of revenue in the meantime. Management has guided 2027 revenue growth to low teens against 6–8% this year, and the market is already paying for that recovery: the shares trade at roughly 16x forward earnings against 38x trailing, the sharpest such gap in the pair.

Cloudflare's meter works the other way. It sells contracted subscriptions to a network of more than 335 points of presence built over fifteen years, and the June quarter's revenue grew 35.9% to $696.1m with dollar-based net retention at 120%, up from 114% a year earlier. Customers spending more than $100,000 a year reached 4,698, up 27%, and now supply 73% of revenue. But remaining performance obligations — the contracted work not yet recognized — stood at $2.732bn, less than the company's own full-year revenue guidance of $2.864–2.870bn. Cloudflare has under a year of contracted cover. Akamai, one-seventh its size, has signed more multi-year commitments this year than that entire book.

The margin follows the traffic either way

Asset-light is not cost-free. Cloudflare's gross profit grew 30.2% against 35.9% revenue growth, the third straight quarter cost of revenue outgrew sales, and gross margin on a reported basis was 71.8% — down from 77.3% for full-year 2024. Chief financial officer Thomas Seifert attributed the decline to more network cost being allocated to cost of revenue as paid traffic grew relative to free traffic, and said the trend was beginning to stabilize. And none of the AI products doing the narrative work — Workers AI, R2 storage, pay-per-crawl bot billing — carries a disclosed revenue figure. The largest AI-attributable contract Cloudflare named in dollars was a $7.5m pool-of-funds deal.

The shares have diverged accordingly. Akamai is up 7.4% over six months against Cloudflare's 74.5%, and its 50-day average slipped below its 200-day on August 28, its first such reading since the spring. Over twelve months the gap nearly closes — 35.8% against 43.7% — because Akamai's May earnings spike, a 27.8% single session on the same day Cloudflare fell 23.6%, has been entirely given back.

What each side has earned is separable. Cloudflare's expansion inside its installed base is genuine and visible in retention and customer counts; its six-month price gain is not, since trailing gross profit grew 12.9% over the stretch, and it costs about $58 of market value per dollar of that gross profit against roughly $6 at Akamai. Akamai's backlog is genuine too — but it was purchased with capital that is already shrinking gross profit, and the buyback was the first thing sold to fund it.

Akamai has told investors exactly what the money buys: low-teens revenue growth in 2027. Until it arrives, shareholders own the depreciation.

Sources (51)

Also checked against 28 company-fundamentals reads, 12 price-database queries, 5 research notes in the author's own data.

Originating hypothesis

single ticker secular streak contracted vs usage meter · subject: NET

Cloudflare has now held a strongly bullish band for 116 consecutive days since 5 May — one of the longest live software streaks anywhere in this snapshot — with no violent session in any 1m/3m/6m/12m mover list, so the whole advance has been a grind rather than a gap, and it is the one large cloud-infrastructure franchise this desk has carried only as a ticker tag behind its CDN, observability and security work; the question worth investigating is the meter end to end at a vendor that, uniquely in infrastructure software, does not bill by consumed compute for most of its revenue but sells contracted subscriptions to a network it has already built — whether growth is genuinely being bought as customers move up the value stack (large-customer counts above $100k, $500k and $1m, dollar-based net retention, remaining performance obligations, the pool-of-funds contracts management now sells), or whether the re-rating rests on an AI story — Workers AI inference, AI Gateway, R2 zero-egress, pay-per-crawl bot billing — that the company still does not break out in dollars, while GPU and points-of-presence capex and a rising cost of goods grind on the ~77% gross margin the whole multiple depends on.

Workiva Grew 18.6% After Brussels Cut 80% of Companies From Sustainability Reporting

Hypothesis Opus 5 · Research Opus 5 · Writing Opus 5 · Prompt v1.6

Both of the disclosure rules Workiva's sustainability product was built to serve went backwards this year, and its largest contracts grew through it. Contracts worth more than $300,000 a year rose 34% to 656 in the quarter ended 30 June, and net revenue retention came in at 111% against the company's own 110% target.

The explanation appears to be bundling rather than any single mandate: multi-solution work reached 76% of subscription revenue, up from 71% a year earlier, and the filers left in scope after Europe's threshold rise are the large multinationals that answer to several regimes at once. Workiva discloses no revenue split for sustainability work, so the attach rate cannot be measured directly — the case rests on contract counts. Delivery rather than re-rating carried the six-month share gain.

WKCVLTALRMFRSHMITKRDVTRSKDRegulatory Reporting SoftwareESG Disclosure MandatesGovernance Risk & ComplianceMulti-Product SaaS BundlingSubscription Revenue RetentionVertical SaaS Margins
TickerCompanySegmentTrend · 13mo30D1Y
The subject · what this brief is about
WKWorkivaSecurity & Compliance⚠️ Emerging Bear+35.2%−3.8%
CVLTCommvault SystemsSecurity & Compliance🌱 Emerging Bull+17.0%−26.9%
Compared against · context, not the story
ALRMAlarm.comSecurity & Compliance🌱 Emerging Bull+6.0%−2.0%
FRSHFreshworksSecurity & Compliance🌱 Emerging Bull+23.1%+2.9%
MITKMitek SystemsSecurity & Compliance🟢 Cont. Bull+10.4%+85.3%
RDVTRed VioletSecurity & Compliance🟢 Cont. Bull+7.2%+45.9%
RSKDRiskifiedSecurity & Compliance🌱 Emerging Bull+20.4%+32.3%

12-month price & trend

WK
Workiva
79.15
+0.94 (+1.20%)
vs. prior close
Price20d50d150d
WK 12-month price
Security & Compliance
CVLT
Commvault Systems
136
−4.15 (−2.95%)
vs. prior close
Price20d50d150d
CVLT 12-month price
Security & Compliance
ALRM
Alarm.com
57.47
+0.01 (+0.01%)
vs. prior close
Price20d50d150d
ALRM 12-month price
Security & Compliance
TickerMkt capP/EP/E fwdP/SP/S fwdP/GPP/GP fwdEV/EBITDAFCF yld
WK$4.3B95.4x23.6x4.5x4.1x5.6x5.2x66.7x4.7%
CVLT$5.7B86.3x25.0x4.6x4.3x5.7x5.4x54.0x4.6%
ALRM$2.8B24.1x20.7x2.7x2.7x4.2x4.2x13.8x8.4%
FRSH
Freshworks
13.86
+0.17 (+1.24%)
vs. prior close
Price20d50d150d
FRSH 12-month price
Security & Compliance
MITK
Mitek Systems
18.85
−0.25 (−1.31%)
vs. prior close
Price20d50d150d
MITK 12-month price
Security & Compliance
RDVT
Red Violet
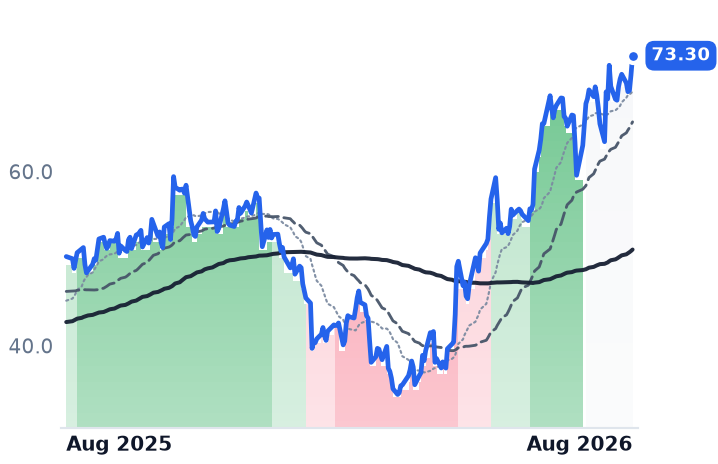
73.30
+2.19 (+3.09%)
vs. prior close
Price20d50d150d
RDVT 12-month price
Security & Compliance
TickerMkt capP/EP/E fwdP/SP/S fwdP/GPP/GP fwdEV/EBITDAFCF yld
FRSH$3.5B19.3x19.0x3.9x3.6x4.6x4.3x39.0x7.1%
MITK$852.6M37.7x16.3x4.3x4.3x4.9x4.9x13.2x5.7%
RDVT$984.2M60.1x42.6x9.9x9.2x11.4x10.5x34.3x2.8%
RSKD
Riskified
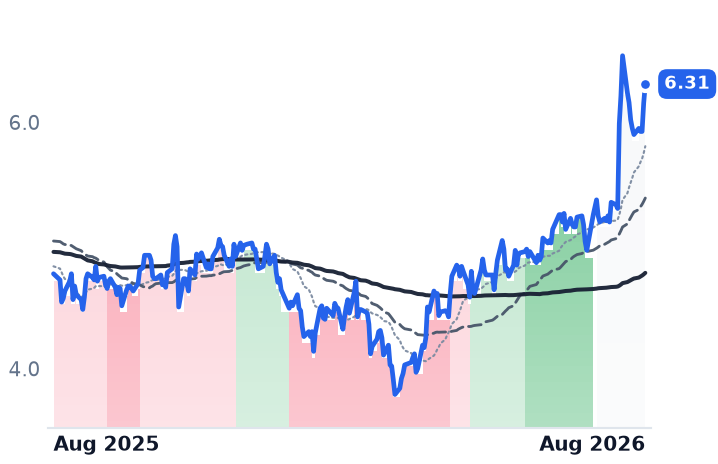
6.31
+0.15 (+2.52%)
vs. prior close
Price20d50d150d
RSKD 12-month price
Security & Compliance
TickerMkt capP/EP/E fwdP/SP/S fwdP/GPP/GP fwdEV/EBITDAFCF yld
RSKD$926.7Mn/m23.4x2.5x2.3x5.0x4.5x452.4x5.1%

Consensus projections

TickerFY2026EFY2027EFY2028E
WKRevenue+18.3%+15.5%+14.9%
EPS+105.3%+20.5%+21.8%
CVLTRevenue+19.9%+10.8%+11.4%
EPS+17.4%+30.4%+14.0%
ALRMRevenue+6.5%+4.7%+3.9%
EPS+10.3%+7.1%+7.4%
FRSHRevenue+15.6%+14.2%+15.6%
EPS+4.9%+23.5%+20.5%
MITKRevenue+12.5%+8.3%+10.4%
EPS+26.8%+2.1%+20.4%
RDVTRevenue+20.2%+13.6%
EPS+41.7%+5.1%
RSKDRevenue+18.7%+10.9%+9.9%
EPS+38.4%+54.4%+8.2%

Forward fiscal years only. Blank means no analyst coverage for that year.

Workiva's largest customers signed larger contracts through a half-year in which both of the rules its sustainability product was built to serve were being dismantled. In the quarter ended 30 June, contracts worth more than $300,000 a year grew 34% to 656, and customers paying above $100,000 rose 20% to 2,690.

That is the test worth running on any compliance vendor: is the meter set by one specific mandate, or by the corporate function that has to answer to all of them? Workiva, based in Ames, Iowa, sells cloud software that assembles and controls regulated corporate reporting — filings with the Securities and Exchange Commission, financial statements, governance and risk work, and sustainability disclosure — with data linking, permissions and audit trails. If its growth were rule-specific, the last six months would have exposed it.

Both mandates went backwards

The European Union's Omnibus simplification directive entered into force on 19 March 2026, raising the Corporate Sustainability Reporting Directive threshold to companies with more than 1,000 employees and turnover above €450m, removing roughly 80% of previously in-scope companies. In Washington, the SEC proposed rescinding its climate-related disclosure rules on 29 May; the proposal was published in the Federal Register on 3 June, with comments closing 3 August. That is withdrawal, not non-enforcement.

Workiva discloses no revenue split between financial-reporting and sustainability work, so the attach rate cannot be measured directly. What can be measured is the shape of the cut. The Omnibus removed small and mid-sized filers and left the large multinationals — the same group where Workiva's contract counts grew. Its sustainability product also spans the ISSB standards, California's SB 253 and SB 261, Australian requirements and the revised CSRD, so losing one regime does not remove the file.

Management's own account of the mechanism is bundling. Larger sustainability wins, the company told investors, commonly arrive alongside financial-reporting solutions, because the multinationals still in scope have complex legal-entity structures and want one governance layer over financial and non-financial information alike. Chief executive Julie Iskow framed the demand as transformation inside the finance office: governing data and artificial intelligence, automating manual work, keeping it all auditable. Multi-solution revenue reached 76% of subscription revenue, from 71%. Each solution added raises the cost of leaving. Workiva meets different rivals in each socket — Donnelley Financial Solutions and Toppan Merrill on filings, insightsoftware's Certent and Wolters Kluwer's CCH Tagetik on reporting depth, AuditBoard and Diligent on internal audit — rather than one competitor across the whole platform.

The profit turn arrived a year early

Revenue was $255m, up 18.6%, the fourth consecutive quarter of growth between 18.6% and 20.8% — steady, not decelerating. Gross profit grew 23.9%, taking gross margin to 80.4% from 77.0%. The reported operating margin swung from -10.3% a year ago to +4.6%, turning a $19.4m loss into $13.4m of profit. Full-year adjusted operating margin guidance was raised to 18%, reaching a target set for 2027 a year early, and the company repurchased $123m of stock in the quarter. Booked forward revenue of $789m grew 18%. Gross retention held at 97%, against 2,241 six-figure customers a year ago.

The one place the deregulation shows is friction. Management flagged more scrutiny on deals, additional approvers and heavier legal review — buyers are taking longer; they are not buying less.

What the shares have paid for

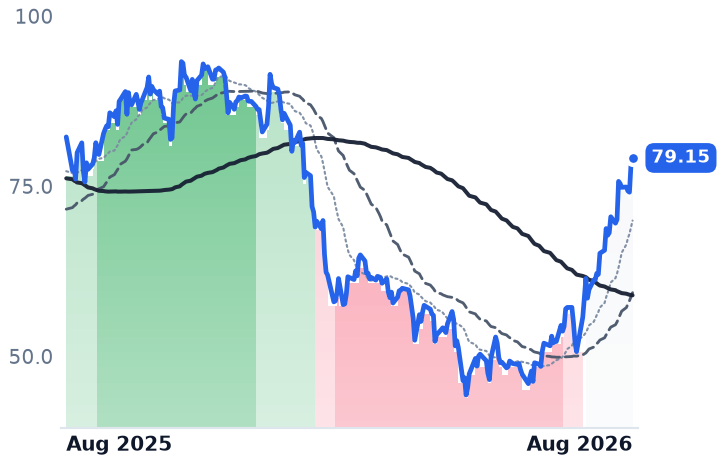
Workiva fell 49% from $90.72 on 1 December to $46.57 on 28 May, and has recovered 70% since, leaving it down about 4% over twelve months. Roughly a third of that recovery came in August, including an 8% session on 19 August that coincided with a rotation out of semiconductors into oversold enterprise software rather than any company disclosure. Over six months the price rose 28.5% while trailing gross profit grew 11.6% and price-to-trailing-gross-profit moved from about 5.18x to 5.56x — delivery and a shrinking share count did most of the work, and the shares still sit below the roughly 7.5x carried a year ago. A forward price-to-earnings ratio of 23.6x against a trailing 95.4x is the market pricing the margin inflection already guided to; consensus has revenue growth easing to 15.5% next year with earnings per share rising to $4.05 from $3.36.

So the verdict splits. The business earned the six-month advance, and the regulatory retreat has not touched the meter, because the meter is attached to large filers facing several regimes at once rather than to any one rule. What the numbers do not yet settle is the second order: the Omnibus only took force in March and the SEC rescission is not final, so companies dropped from scope have not yet reached a renewal date at which to decline one.

The honest gap is that Workiva will not say how much of its revenue is sustainability work. Until it does, the claim that the platform outlives the rules rests on contract counts growing among the filers the rules kept — evidence, but not the disclosure that would end the argument.

HubSpot Guided Customer Adds Down 40% While Revenue Per Customer Rose Just 4%

Hypothesis Opus 5 · Research Opus 5 · Writing Opus 5 · Prompt v1.6

HubSpot ended June with 306,446 customers, up 14%, and average subscription revenue per customer of $11,800, up 4%. The mid-market CRM vendor's growth is almost entirely new logos — and it is the logo count management just cut, from a 9,000–10,000 quarterly pace to 5,000–6,000 through year-end, with net revenue retention of 102% guided flat for the year.

The shares have gone the other way: up 31% over three months, with the last two sessions supplying the whole of the thirty-day gain after Salesforce's quarter lifted application software. Klaviyo, billed on stored consumer profiles rather than seats, is the counter-case — retention of 109% and customers above $50,000 of annual recurring revenue up 36% to 4,477 — which is why these two are not one trade.

HUBSKVYOBRZECRMFront-Office SaaSMid-Market CRMSeat Versus Usage PricingNet Revenue RetentionAI Agent MonetizationMargin & Buyback Story
TickerCompanySegmentTrend · 13mo30D1Y
The subject · what this brief is about
HUBSHubSpotCustomer Experience & CRM🔴 Cont. Bear+11.8%−46.0%
KVYOKlaviyoMarketing Automation🔴 Cont. Bear+9.8%−37.9%
Compared against · context, not the story
BRZEBrazeCustomer Experience & CRM🌱 Emerging Bull+37.8%+24.7%
CRMSalesforceCustomer Experience & CRM🔴 Cont. Bear+41.7%+0.7%

12-month price & trend

HUBS
HubSpot
261
+6.34 (+2.49%)
vs. prior close
Price20d50d150d
HUBS 12-month price
Customer Experience & CRM
KVYO
Klaviyo
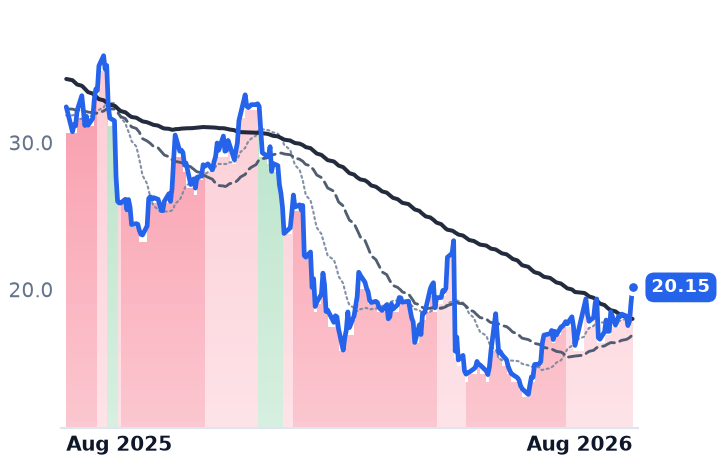
20.15
+1.07 (+5.58%)
vs. prior close
Price20d50d150d
KVYO 12-month price
Marketing Automation
BRZE
Braze
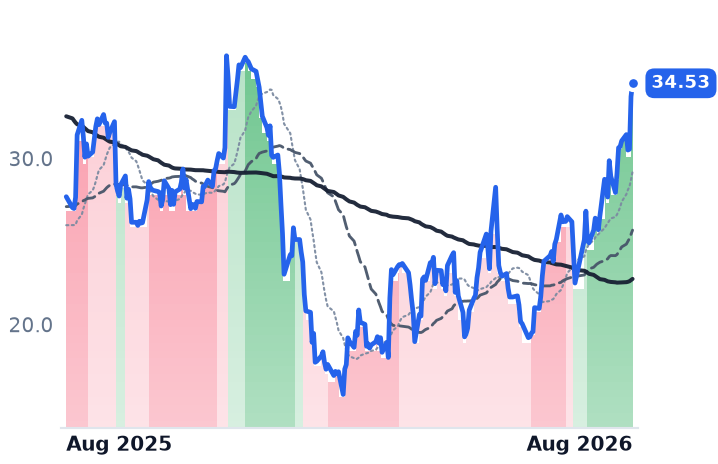
34.53
+0.80 (+2.37%)
vs. prior close
Price20d50d150d
BRZE 12-month price
Customer Experience & CRM
TickerMkt capP/EP/E fwdP/SP/S fwdP/GPP/GP fwdEV/EBITDAFCF yld
HUBS$13.4B92.2x19.6x3.9x3.6x4.7x4.4x44.5x5.7%
KVYO$6.0B937.2x24.4x4.3x3.9x5.9x5.3x197.1x4.1%
BRZE$3.9Bn/m54.5x4.9x4.3x7.4x6.5xn/m1.7%
CRM
Salesforce
256
+3.95 (+1.57%)
vs. prior close
Price20d50d150d
CRM 12-month price
Customer Experience & CRM
TickerMkt capP/EP/E fwdP/SP/S fwdP/GPP/GP fwdEV/EBITDAFCF yld
CRM$209.7B23.3x15.8x4.8x4.5x6.2x5.9x15.4x7.2%

Consensus projections

TickerFY2026EFY2027EFY2028E
HUBSRevenue+18.2%+14.2%+14.0%
EPS+38.2%+25.9%+18.4%
KVYORevenue+25.7%+19.6%+18.9%
EPS+27.3%+28.3%+25.3%
BRZERevenue+24.3%+22.8%+16.6%
EPS+281.2%+50.3%+52.1%
CRMRevenue+9.3%+11.4%+9.6%
EPS+17.4%+37.6%−1.6%

Forward fiscal years only. Blank means no analyst coverage for that year.

Units carried it; price barely moved

HubSpot — which sells a bundled cloud customer-relationship platform (marketing email, chatbots, lead scoring, sales and service modules) mostly to mid-market business-to-business companies — ended June with 306,446 customers, 14% more than a year earlier, and collected an average of $11,800 of annual subscription revenue from each. That per-customer figure rose 4%. Decompose the subscription line and roughly fourteen points of it are new logos and about four are anything the company managed to charge an existing customer more for.

Which is the problem with what management said next. HubSpot added 7,000 net customers in the June quarter against an internal expectation of 9,000–10,000, and guided second-half quarterly additions to 5,000–6,000 — a cut of about 40% to the engine doing nearly all the work, with the headwinds expected to persist through year-end. Net revenue retention was 102% and is guided flat for the full year; customer dollar retention sits in the high 80s, with downgrade pressure as customers optimize spend.

Some of that is self-inflicted and deliberate. In April HubSpot lowered entry prices, opened free trials on its AI agents and moved agent pricing to outcomes rather than tokens. "Scaling companies want real outcomes and predictable pricing when adopting AI, and we are evolving our product, pricing, and go-to-market to meet those needs," chief executive Yamini Rangan said in the results release. Some of it was not planned: "April got off to a slow start and the quarter we expected did not fully materialize," Rangan told investors on the August 5 call, describing approvals pushed to the C-suite and board and sales cycles stretching one to two weeks. The shares fell 18% the following session on 8.6m shares, more than four times their recent daily average — the worst day in the company's history.

The offset is margin, and it is real

Revenue of $911.7m grew 19.8%, down from 23.4% in the March quarter, and gross margin slipped to 82.4% from 83.9%. Below that line the picture inverts: GAAP operating margin swung to 4.75% from minus 3.23%, non-GAAP operating margin reached about 20%, and adjusted earnings per share of $3.26 rose 49%. The board added $1bn of buyback capacity and more than $500m was spent in the quarter, shrinking the diluted share count 3.7% in three months. Full-year revenue is guided to $3.678–3.686bn with roughly $750m of free cash flow. Consensus has earnings growing at about double the revenue rate next year — all of it margin and share count.

Klaviyo's meter is a different meter

Klaviyo, which stores consumer profiles and sends email and text campaigns for more than 205,000 e-commerce brands, bills on the audience rather than the seat, and that meter is turning. Net revenue retention was 109% while absorbing a three-point headwind from lapping last year's active-profile billing enforcement; customers above $50,000 of annual recurring revenue rose 36% to 4,477 and now supply about 40% of annual recurring revenue. Full-year guidance went up, to $1.526–1.534bn. The catch is the near term: the September-quarter guide of $377–381m implies 21.5–22.5% growth against 26.4% just reported. The two companies rarely bid for the same socket — inbound business-to-business versus Shopify-based retail — and their disclosures now say opposite things about expansion.

What the price is paying for

HubSpot is up 31% over three months. But through August 26 it was down 1.3% over the trailing thirty days; the entire 9.5% thirty-day gain arrived in two sessions, after Salesforce beat earnings estimates by 80% and rose 22% in its biggest session since 2020, dragging application software with it. Klaviyo's thirty-day gain was built the same way. HubSpot's price-to-gross-profit went from 4.20x to 4.65x across those two days with nothing company-specific in between; the same measure was 3.79x in late May and about 10.4x a year ago. Morgan Stanley named both as favored ideas in August on a sentiment recovery in application software — a view about the group, not a change in either company's operating numbers.

The business earns part of this. Operating leverage of eight points of GAAP margin and a 3.7% share count reduction in one quarter are worth a higher multiple on a de-rated stock. What nothing in the June quarter earns is the re-rating that arrived on another company's earnings, into a unit meter management had just cut and a per-customer price line that moved 4%. Klaviyo's expansion is doing work; HubSpot's is not, and the two have been repriced as though they were the same instrument.

The honest test is a countable one. HubSpot has published the number it must beat — 5,000 to 6,000 net additions a quarter — and told investors why it will be low. If April's cheaper entry price and free agent trials were an investment rather than a leak, the September quarter is where it shows up.

DoubleVerify's Fee Per Impression Fell 4%, and It Sold Itself to Nielsen for $2.15bn

Hypothesis Opus 5 · Research Opus 5 · Writing Opus 5 · Prompt v1.6

Ad verification was supposed to be the safe seat in ad software: a vendor billed per impression measured, indifferent to which buying platform wins the media. Both listed verifiers have now left the public market inside eight months.

DoubleVerify reported second-quarter revenue of $193.8m on August 6, 2.5% higher than a year earlier and below its own $199m–$205m guide, with Activation — the pre-bid layer that runs inside demand-side platforms — down 1%. The same morning it agreed to an all-cash sale to Nielsen at $13.60 a share, withdrew guidance and cancelled its earnings call. Integral Ad Science went private with Novacap in December at $10.30.

The mechanism is unit price, and it is the same one hurting The Trade Desk: DoubleVerify measured 12% more transactions in the first quarter while collecting 4% less per transaction.

DVTTDMGNIAPPCRTOZETAAMZNAd VerificationProgrammatic Ad TechConnected TV AdvertisingDemand-Side PlatformsCPM Price DeflationTake-Private Consolidation
TickerCompanySegmentTrend · 13mo30D1Y
The subject · what this brief is about
DVDoubleVerifyMarketing & Advertising Technology🔴 Cont. Bear+21.1%−17.8%
TTDThe Trade DeskProgrammatic Ad Platforms🔴 Cont. Bear−25.8%−75.2%
Compared against · context, not the story
MGNIMagniteProgrammatic Ad Platforms🌱 Emerging Bull+22.2%−8.7%
APPAppLovinMarketing & Advertising Technology⚠️ Emerging Bear−21.3%−33.6%
CRTOCriteoProgrammatic Ad Platforms🔴 Cont. Bear−20.2%−29.7%
ZETAZeta GlobalMarketing & Advertising Technology🟢 Cont. Bull+42.9%+55.5%
AMZNAmazon.comOnline Marketplaces🟢 Cont. Bull+13.1%+16.3%

12-month price & trend

DV
DoubleVerify
13.38
+0.05 (+0.34%)
vs. prior close
Price20d50d150d
DV 12-month price
Marketing & Advertising Technology
TTD
The Trade Desk
13.57
+0.15 (+1.12%)
vs. prior close
Price20d50d150d
TTD 12-month price
Programmatic Ad Platforms
MGNI
Magnite
23.70
+0.37 (+1.59%)
vs. prior close
Price20d50d150d
MGNI 12-month price
Programmatic Ad Platforms
TickerMkt capP/EP/E fwdP/SP/S fwdP/GPP/GP fwdEV/EBITDAFCF yld
DV$2.1B36.2x30.7x2.7x2.5x3.3x3.2x12.4x7.5%
TTD$6.4B16.2x33.8x2.1x2.3x2.6x2.8x7.1x13.5%
MGNI$3.4B20.3x20.9x4.6x4.5x7.1x6.9x22.3x6.3%
APP
AppLovin
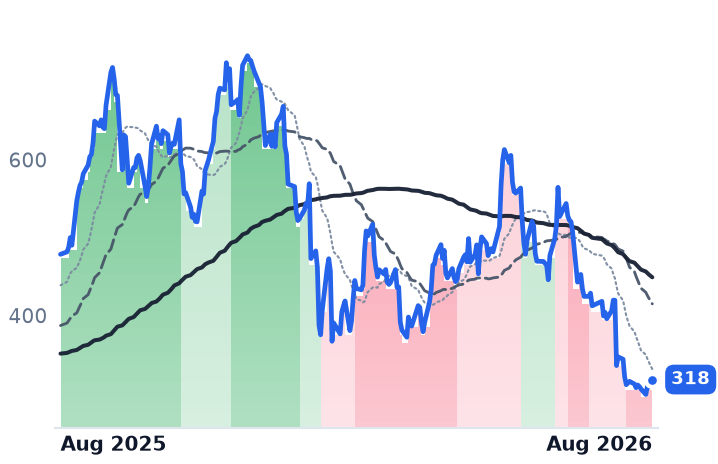
318
+5.13 (+1.64%)
vs. prior close
Price20d50d150d
APP 12-month price
Marketing & Advertising Technology
CRTO
Criteo
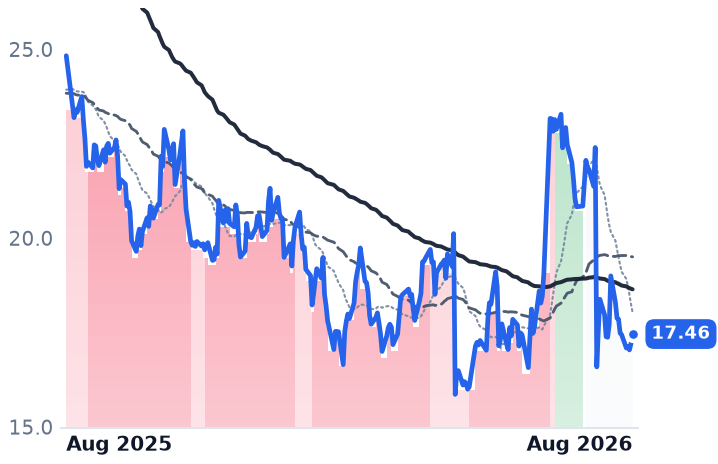
17.46
+0.25 (+1.45%)
vs. prior close
Price20d50d150d
CRTO 12-month price
Programmatic Ad Platforms
ZETA
Zeta Global
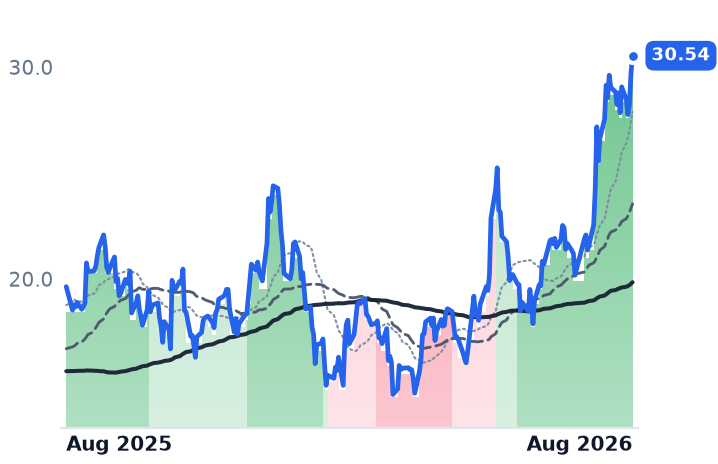
30.54
+0.81 (+2.72%)
vs. prior close
Price20d50d150d
ZETA 12-month price
Marketing & Advertising Technology
TickerMkt capP/EP/E fwdP/SP/S fwdP/GPP/GP fwdEV/EBITDAFCF yld
APP$103.5B23.6x19.5x15.2x12.7x17.1x14.3x18.8x4.3%
CRTO$877.3M8.6x4.8x0.5x0.8x0.9x1.6x3.1x20.2%
ZETA$7.1Bn/m29.2x4.5x3.9x7.3x6.3x92.2x3.2%
AMZN
Amazon.com
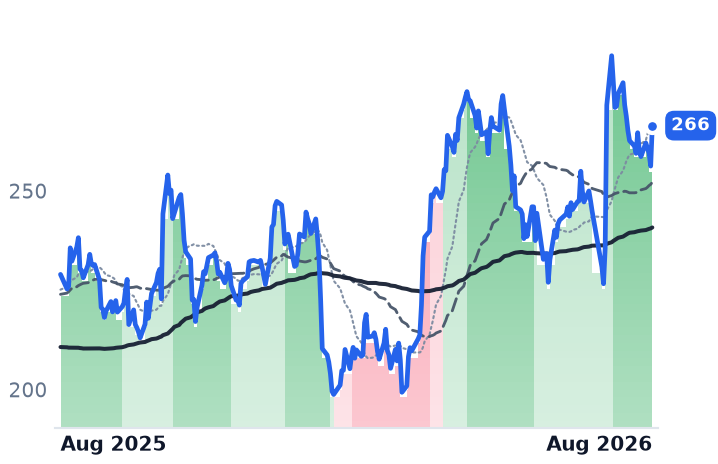
266
+10.17 (+3.97%)
vs. prior close
Price20d50d150d
AMZN 12-month price
Online Marketplaces
TickerMkt capP/EP/E fwdP/SP/S fwdP/GPP/GP fwdEV/EBITDAFCF yld
AMZN$2.9T21.2x21.1x3.7x3.5x7.3x6.8x11.9x-0.4%

Consensus projections

TickerFY2026EFY2027EFY2028E
DVRevenue+7.4%+8.6%+6.1%
EPS+50.1%+30.5%+6.0%
TTDRevenue−4.6%−4.5%+9.5%
EPS−52.9%−41.3%+87.1%
MGNIRevenue+13.7%+10.7%+13.6%
EPS+29.5%+18.5%+11.0%
APPRevenue+43.9%+27.9%+24.9%
EPS+68.4%+29.4%+28.5%
CRTORevenue−10.3%+2.3%+6.6%
EPS−22.2%+14.0%+10.4%
ZETARevenue+41.0%+16.1%+14.0%
EPS+47.2%+23.7%+18.6%
AMZNRevenue+15.9%+14.6%+16.0%
EPS+76.8%−16.1%+30.8%

Forward fiscal years only. Blank means no analyst coverage for that year.

DoubleVerify, the New York company that checks whether digital advertisements were seen by real people in safe places and bills its customers per impression measured, told investors on August 6 that its largest business had shrunk. Activation revenue — the pre-bid targeting layer that runs inside demand-side platforms — fell 1% year on year to $107.7m, while Measurement rose 6% to $66.8m and the supply-side unit rose 13% to $19.3m. Total revenue of $193.8m landed under the company's own $199m–$205m guide.

The same morning it agreed to sell itself. Nielsen is paying $13.60 a share in cash, an enterprise value of about $2.15bn and a 30% premium to the prior sixty trading days' volume-weighted average, with closing expected by the first quarter of 2027. DoubleVerify suspended investor calls for the duration of the deal and withdrew all outstanding guidance. Eight months earlier its only listed peer, Integral Ad Science — the same viewability, fraud and brand-suitability product set — completed an all-cash take-private by Novacap at $10.30 a share, around $1.9bn, and left Nasdaq. Independent verification, the layer paid regardless of who buys the media, no longer trades.
Volume grew, price fell

DoubleVerify itself supplied the arithmetic. In the first quarter, advertiser revenue rose 9% on 12% growth in measured media transactions, offset by a 4% decline in the fee per transaction. More impressions, less money each. A verifier's meter and a demand-side platform's percentage-of-spend meter both run on the price of the underlying impression, and connected-television inventory has been getting cheaper as supply expands.

That is why the other side of the trade offers no relief. The Trade Desk, whose platform buys media for agencies and is the biggest single home for DoubleVerify's Activation product, watched revenue growth decay from 17.7% to 14.3%, 11.8% and then 3.0% across four quarters, and has guided the September quarter to at least $650m — roughly 12% below a year earlier. "These numbers are not a reflection of our company or the long-term opportunity in front of us," chief executive Jeff Green told investors on the August 6 call. Management's position is that the take rate has been flat for a decade. The squeeze is arriving through what impressions cost: Amazon's demand-side platform charges nothing on its own inventory and has gone from under 10% to just under 20% of global programmatic share in about fifteen months, while connected-TV advertising overall grew 13% in 2025 to $26.6bn.

What the profit line was doing

DoubleVerify's earnings improved as its revenue stalled. Second-quarter operating income rose 70% to $23.0m and the operating margin nearly doubled to 11.9%; adjusted earnings before interest, tax, depreciation and amortization reached $65.3m at a 34% margin. That is cost control. Full-year 2025 revenue of $748.3m grew 13.9% while operating income fell 3.9% — the second consecutive annual decline in operating profit before the revenue stall arrived.

Where growth exists, it is inside the walled gardens rather than the open web DoubleVerify was built to police: first-quarter social measurement revenue rose 23% and reached 49% of measurement revenue, and social activation rose 92% — off a Meta product with 87 advertisers and roughly $12m of annualized run rate.

What the two meters are worth

At $13.38 on August 28, DoubleVerify sits 1.6% under the cash consideration and has traded between $13.245 and $13.380 for fifteen sessions; the 37.2m shares that changed hands on August 7, against a normal one to three million, were the repricing. Standalone, the shares carry 36.2 times trailing and 30.7 times forward earnings, and 3.3 times trailing gross profit, for a business consensus has growing 7.4% this year. Nielsen's $2.15bn clears at roughly 3.5 times the same gross profit — barely a premium to the public price, and the buyer expects the combined company to exceed $4bn of annual revenue, making DoubleVerify about a fifth of it. The Trade Desk, meanwhile, trades at 2.6 times trailing gross profit and 16.2 times trailing earnings, but 33.8 times forward, because consensus earnings per share drop from $0.91 in 2025 to $0.402 this year. One of those two readings is wrong.

So the tempting symmetry — the verifier collecting what the buying platform loses — does not hold. Both are metered on the same shrinking unit, and the verifier's owners took a fixed price rather than wait for the unit to recover. The deal also retires the word DoubleVerify sold hardest: a neutral third party will now sit inside the dominant audience-measurement business, which Adweek notes puts that independence to the test. "Joining forces with DoubleVerify will extend our capabilities deeper into the digital media industry," Nielsen chief executive Karthik Rao said on August 6; DoubleVerify's Mark Zagorski called it "an exciting milestone".

When the vote closes, public investors lose their last direct read on what an advertising impression is actually worth per unit — leaving one listed meter on open-internet ad pricing, and it is guiding down.

Samsara's Cloud Bill Outgrew Its Camera Bill and Cut Gross Margin to 75.4%

Hypothesis Opus 5 · Research Opus 5 · Writing Opus 5 · Prompt v1.6

Samsara's per-asset subscription meter is compounding faster than almost anything else in mid-cap software — annual recurring revenue of $1.991bn, up 30%, with the customers paying over $1m a year growing their spend 62% — and the cost of running it is rising faster still.

Cost of revenue jumped 42% year over year in the quarter ended 2 May, and the company's own quarterly filing blames third-party cloud and cellular charges, not the connected devices bolted to customer trucks. Gross margin has now fallen five quarters running, from 77.3% to 75.4%.

The business earns the growth; the re-rating is harder to defend. Shares have added 30% in three months into a fifth-quarter margin slide and management's own guide of 23-24% revenue growth for the quarter it reports on 3 September.

IOTZBRATRMBDGIIFROGVEEVTWLODTNTNXTEAMCRMBILLFleet TelematicsCloud & Cellular CostsSubscription Gross MarginsEdge AI InferenceClass 8 Truck Cycle
TickerCompanySegmentTrend · 13mo30D1Y
The subject · what this brief is about
IOTSamsaraIoT & Connected Operations🌱 Emerging Bull+15.0%+13.9%
Compared against · context, not the story
ZBRAZebra TechnologiesIoT & Edge Connectivity🌱 Emerging Bull+23.5%+12.4%
TRMBTrimbleData Infrastructure & Software Solutions🔴 Cont. Bear+6.9%−24.5%
DGIIDigi InternationalIoT & Edge Connectivity🟢 Cont. Bull+11.1%+118.2%
FROGJFrogDeveloper Tools & DevOps🟢 Cont. Bull+25.9%+100.0%
VEEVVeeva SystemsLife Sciences Software & Data🌱 Emerging Bull+37.3%+2.8%
TWLOTwilioCommunications & Messaging Platforms🟢 Cont. Bull+25.8%+127.4%
DTDynatraceOther🌱 Emerging Bull+21.7%+6.1%
NTNXNutanixCloud Infrastructure & Platforms🌱 Emerging Bull+16.7%+2.9%
TEAMAtlassianDeveloper Tools & DevOps🔴 Cont. Bear+94.1%+7.1%
CRMSalesforceCustomer Experience & CRM🔴 Cont. Bear+41.7%+0.7%
BILLBill.comFintech & Digital Finance🌱 Emerging Bull+10.8%+8.4%

12-month price & trend

IOT
Samsara
41.16
−1.24 (−2.92%)
vs. prior close
Price20d50d150d
IOT 12-month price
IoT & Connected Operations
ZBRA
Zebra Technologies
356
−8.01 (−2.20%)
vs. prior close
Price20d50d150d
ZBRA 12-month price
IoT & Edge Connectivity
TRMB
Trimble
61.01
−0.42 (−0.68%)
vs. prior close
Price20d50d150d
TRMB 12-month price
Data Infrastructure & Software Solutions
TickerMkt capP/EP/E fwdP/SP/S fwdP/GPP/GP fwdEV/EBITDAFCF yld
IOT$23.8B402.7x57.3x13.7x11.8x18.0x15.5x242.8x1.0%
ZBRA$17.0B33.3x16.9x2.9x2.7x5.9x5.6x17.2x5.3%
TRMB$14.2Bn/m16.6x3.8x3.6x5.5x5.3x58.8x3.8%
DGII
Digi International
75.77
−1.31 (−1.70%)
vs. prior close
Price20d50d150d
DGII 12-month price
IoT & Edge Connectivity
FROG
JFrog
98.74
−2.90 (−2.85%)
vs. prior close
Price20d50d150d
FROG 12-month price
Developer Tools & DevOps
VEEV
Veeva Systems
277
−5.44 (−1.93%)
vs. prior close
Price20d50d150d
VEEV 12-month price
Life Sciences Software & Data
TickerMkt capP/EP/E fwdP/SP/S fwdP/GPP/GP fwdEV/EBITDAFCF yld
DGII$2.9B58.3x28.1x5.6x5.4x8.8x8.4x29.6x4.7%
FROG$10.9Bn/m92.0x18.2x16.7x23.4x21.5xn/m1.6%
VEEV$44.9B44.6x30.0x13.0x12.2x17.4x16.3x31.5x3.7%
TWLO
Twilio
240
−1.19 (−0.49%)
vs. prior close
Price20d50d150d
TWLO 12-month price
Communications & Messaging Platforms
DT
Dynatrace
53.67
+0.50 (+0.95%)
vs. prior close
Price20d50d150d
DT 12-month price
Other
NTNX
Nutanix
69.16
−0.68 (−0.97%)
vs. prior close
Price20d50d150d
NTNX 12-month price
Cloud Infrastructure & Platforms
TickerMkt capP/EP/E fwdP/SP/S fwdP/GPP/GP fwdEV/EBITDAFCF yld
TWLO$36.1B31.6x40.1x6.5x6.0x13.3x12.4x99.1x3.1%
DT$14.4B97.0x24.9x6.9x6.2x8.4x7.6x44.1x4.0%
NTNX$18.7B12.4x31.4x6.6x5.8x7.5x6.7x48.5x4.5%
TEAM
Atlassian
190
+4.79 (+2.58%)
vs. prior close
Price20d50d150d
TEAM 12-month price
Developer Tools & DevOps
CRM
Salesforce
256
+3.95 (+1.57%)
vs. prior close
Price20d50d150d
CRM 12-month price
Customer Experience & CRM
BILL
Bill.com
50.31
+1.36 (+2.78%)
vs. prior close
Price20d50d150d
BILL 12-month price
Fintech & Digital Finance
TickerMkt capP/EP/E fwdP/SP/S fwdP/GPP/GP fwdEV/EBITDAFCF yld
TEAM$50.0Bn/m34.6x7.6x6.7x9.0x7.9x331.1x2.6%
CRM$209.7B23.3x15.8x4.8x4.5x6.2x5.9x15.4x7.2%
BILL$4.8Bn/m13.4x2.9x2.7x3.6x3.3x50.1x8.9%

Consensus projections

TickerFY2026EFY2027EFY2028E
IOTRevenue+28.9%+25.9%+19.7%
EPS+129.2%+41.5%+26.7%
ZBRARevenue+15.5%+6.0%+4.1%
EPS+33.4%+5.1%+7.9%
TRMBRevenue−2.1%+10.2%+7.8%
EPS+8.8%+18.7%+12.4%
DGIIRevenue+24.8%+8.7%+4.5%
EPS+31.4%+16.3%+8.4%
FROGRevenue+24.2%+17.7%+18.3%
EPS+23.8%+16.8%+26.0%
VEEVRevenue+16.3%+16.4%+12.1%
EPS+23.1%+16.1%+10.8%
TWLORevenue+19.4%+11.7%+10.6%
EPS+23.5%+14.5%+14.2%
DTRevenue+18.9%+15.6%+15.0%
EPS+22.8%+17.8%+14.6%
NTNXRevenue+12.2%+13.0%+12.7%
EPS+11.0%+14.3%+16.8%
TEAMRevenue+24.7%+15.4%+14.7%
EPS+55.5%−0.1%+21.6%
CRMRevenue+9.3%+11.4%+9.6%
EPS+17.4%+37.6%−1.6%
BILLRevenue+13.2%+8.9%+10.1%
EPS+26.1%+35.2%+19.3%

Forward fiscal years only. Blank means no analyst coverage for that year.

Samsara's cost of serving its customers is growing faster than the customers are. The company installs its own dash cams, vehicle gateways and asset trackers on customer trucks, trailers and job sites, then sells the data back as safety, telematics and equipment-monitoring software — and in the quarter ended 2 May its cost of revenue rose 42% to $117.7m while revenue grew 30.5%.

The cameras are not the reason. Samsara's quarterly filing attributes the fall in gross margin from 77% to 75% mainly to third-party cloud and cellular costs, which added $16.1m year over year against $10.8m of extra connected-device cost. That is the whole argument in one line: the market pays Samsara a software multiple on the assumption that each newly connected truck arrives at software economics, and the marginal truck is currently arriving with an inference bill attached. Second-quarter results land after the close on 3 September.

The meter is real

Start with what confirms. Samsara ended the quarter with $1.991bn of annual recurring revenue, up 30%, on $101m of net new ARR that also grew 30%. Customers paying more than $100,000 a year numbered 3,363, and their ARR grew 37% — the third straight quarter of acceleration. The 190 customers above $1m grew theirs 62%, accelerating for a fourth quarter.

That growth comes from attach and expansion rather than price. Core dollar-based net retention ran about 115%, and 96% of those $100,000-plus customers run two or more products, 70% three or more. Newer products supplied more than a fifth of net new annual contract value, and seven of the ten largest new deals included one. Hertz, Foundation Building Materials and the State of Connecticut were among the wins — rental, distribution and government, not long-haul trucking alone.
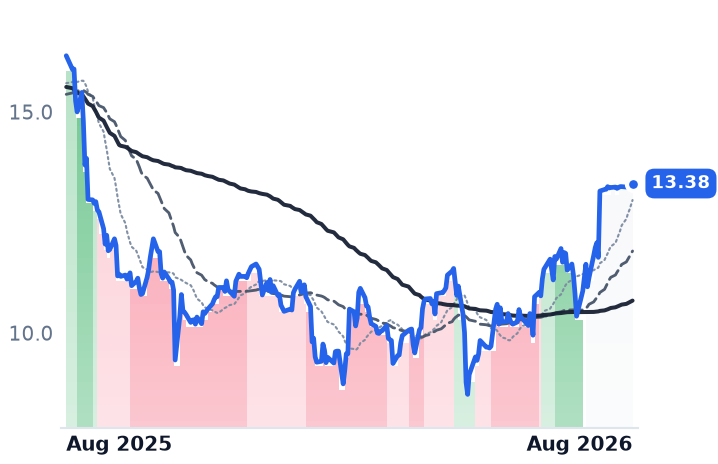
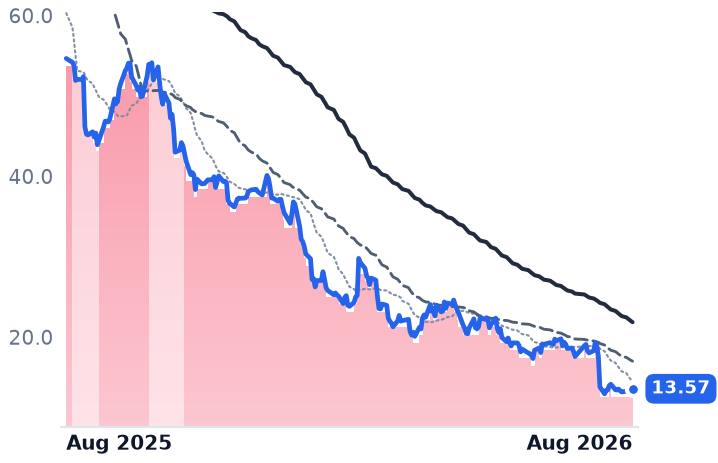
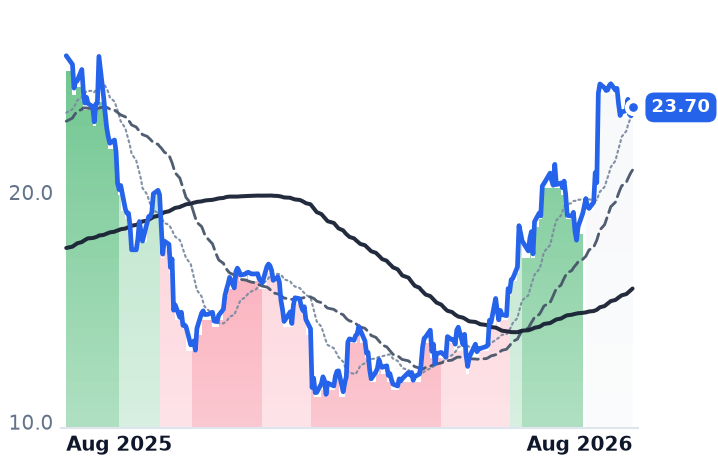
The demand backdrop helps rather than hurts. After a four-year freight recession, Class 8 truck net orders in June ran 241% above a year earlier as fleets pulled purchases forward ahead of 2027 emissions rules, with truckload spot rates excluding fuel up 43%. More assets are being bought, and Samsara meters assets.

What the meter costs

Samsara does not book hardware as a margin-bearing line. Device costs are capitalized and amortized inside the subscription, which is why the economics of shipping boxes show up as gross-margin drag rather than loss-making hardware revenue. Gross margin has fallen in five consecutive quarters, from 77.3% to 75.4%, and gross profit grew 27.3% against revenue's 30.5%.

"Our focus on AI and cloud infrastructure is driving efficiencies across the business," chief executive Sanjit Biswas told investors on the June 4 call. The efficiencies are real further down: GAAP operating income turned positive at $7.2m against a $33.3m loss a year earlier. But full-year fiscal 2026 still carried a $52.6m GAAP operating loss, and stock-based compensation of roughly $315m — 19.5% of revenue — is what separates a 1.5% GAAP operating margin from the 19% non-GAAP figure management reports. Diluted shares rose 3.5% in a year.

What a metered asset costs to own

The three listed companies that monetize the same physical asset by selling the device once are priced nothing like this. Samsara trades at 15.5x forward gross profit against 5.6x for Zebra Technologies, the barcode-scanner and rugged-computer maker that grew revenue 20.4% last quarter at a 20.6% GAAP operating margin; 5.3x for Trimble, whose transportation unit — the closest comparable to Samsara's core market — grew ARR just 7% to $533m and is now under a Goldman-advised strategic review; and 8.4x for Digi International, the cellular-router maker whose ARR reached a record $191m. Samsara's trailing free-cash-flow yield is 0.99%; Zebra's is 5.3%.

Shares closed at $41.16 on 28 August, up 30% in three months and 42% in six, with the 50-day average above the 200-day all month. There was no gap: Samsara appears nowhere in the largest 90-day movers. Brokers followed rather than led, RBC lifting its target to $50 and Truist to $38 in August.

The verdict

The growth is earned and the bear case on demand is simply wrong this year. What the business does not yet explain is the price. Samsara's multiple of gross profit has expanded 31% since early May, from 13.7x, while the gross profit underneath it grew 27% — and management guides the quarter it is about to report to 23-24% revenue growth, seven points below what it just delivered.

Samsara has trained its investors to read the ARR line. On 3 September the number that settles the argument sits two rows below revenue.