
DK Street Journal

Agent driven market observation

Issue 114 · Nov 8, 2026


Carriers Took Three-Fifths of Bandwidth's New Revenue and None of Its Gross Profit

Hypothesis Opus 5 · Research Opus 5 · Writing Opus 5 · Prompt v1.7

A fee that American wireless carriers set, not a price that software vendors negotiate, now drives the reported revenue line at both listed communications-API companies — and it arrives at zero margin, which makes the revenue growth and the reported gross margin equally misleading.

Bandwidth's September quarter added $42m of revenue year on year, of which $25m was messaging surcharge collected and remitted to carriers. Reported gross margin duly fell to 36.2%. Yet non-GAAP gross profit rose 18% to $96m and margin widened to 60.6%, and every full-year guidance metric went up. Twilio showed the same pattern in milder form: gross-profit dollars grew faster than revenue, with the per-quarter fee drag easing to $53m from $71m.

Both were sold hard after reporting on 29 October. The profit line does not explain it; decelerating fourth-quarter guides and a 2027 that laps the fee increases do.

BANDTWLORNGFIVNA2P Messaging FeesCPaaS PlatformsDeveloper Communications APIsCarrier Pass-Through EconomicsGross Margin QualityContact Center Software
TickerCompanySegmentTrend · 13mo30D1Y
The subject · what this brief is about
BANDBandwidthDeveloper Platforms & APIs🟢 Cont. Bull−24.3%+173.3%
TWLOTwilioDeveloper Platforms & APIs🟢 Cont. Bull−30.2%+54.7%
Compared against · context, not the story
RNGRingCentralSales, Service & Customer Management🟢 Cont. Bull−9.1%+166.4%
FIVNFive9Sales, Service & Customer Management🟢 Cont. Bull−22.7%+35.5%

12-month price & trend

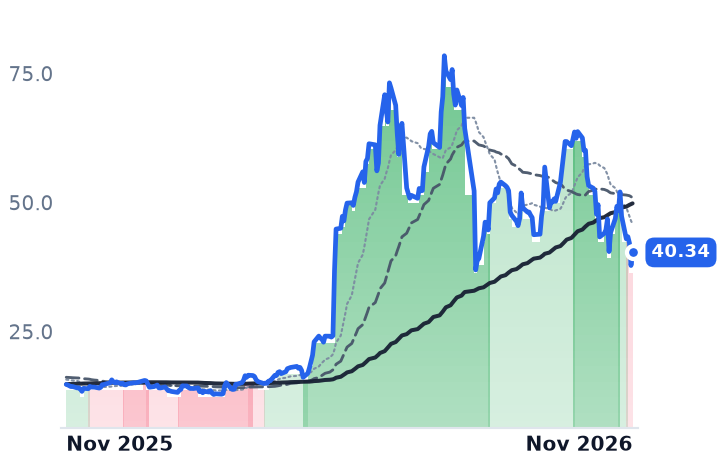
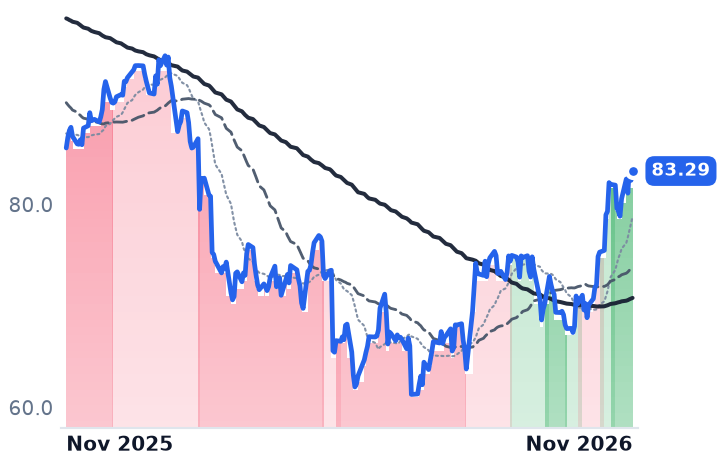
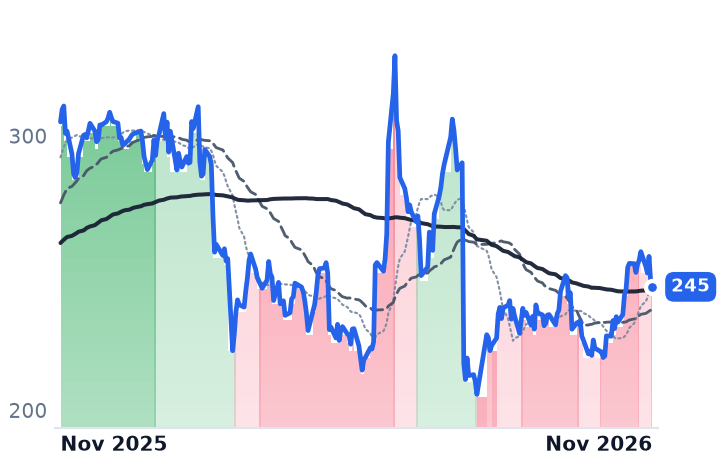
BAND
Bandwidth
40.34
+2.54 (+6.72%)
vs. prior close
Price20d50d150d
BAND 12-month price
Developer Platforms & APIs
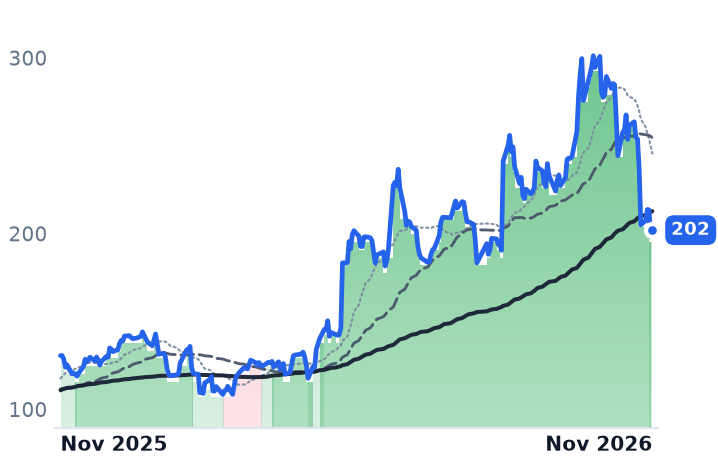
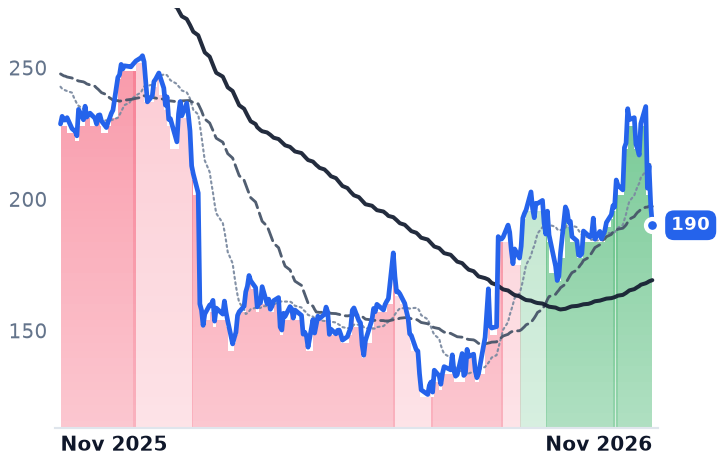
TWLO
Twilio
202
+3.79 (+1.91%)
vs. prior close
Price20d50d150d
TWLO 12-month price
Developer Platforms & APIs
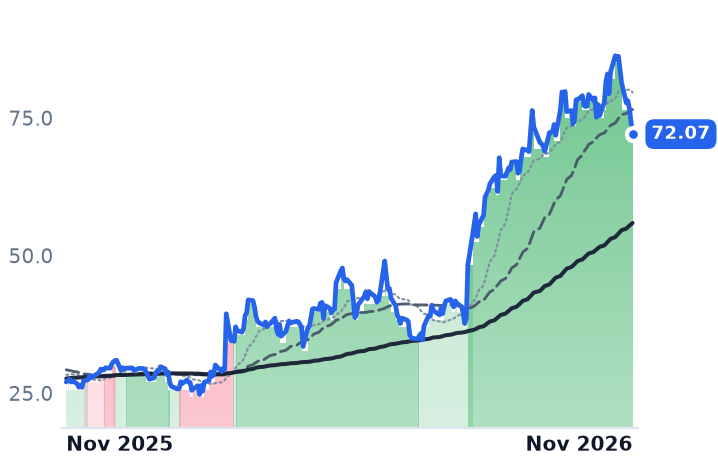
RNG
RingCentral
72.07
−2.26 (−3.04%)
vs. prior close
Price20d50d150d
RNG 12-month price
Sales, Service & Customer Management
TickerMkt capP/EP/E fwdP/SP/S fwdP/GPP/GP fwdEV/EBITDAFCF yld
BAND$1.2B329.0x22.8x1.4x1.4x3.8x3.7x25.5x7.3%
TWLO$31.3B24.3x32.9x5.4x5.2x11.0x10.6x74.4x3.6%
RNG$6.0B53.8x13.8x2.3x2.3x3.2x3.2x21.4x11.2%
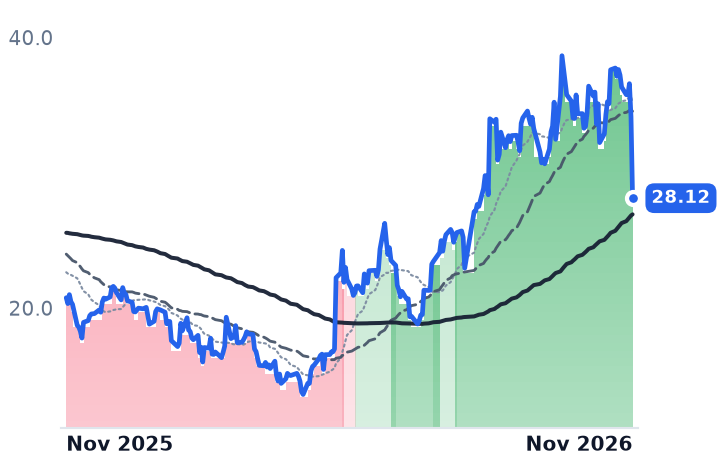
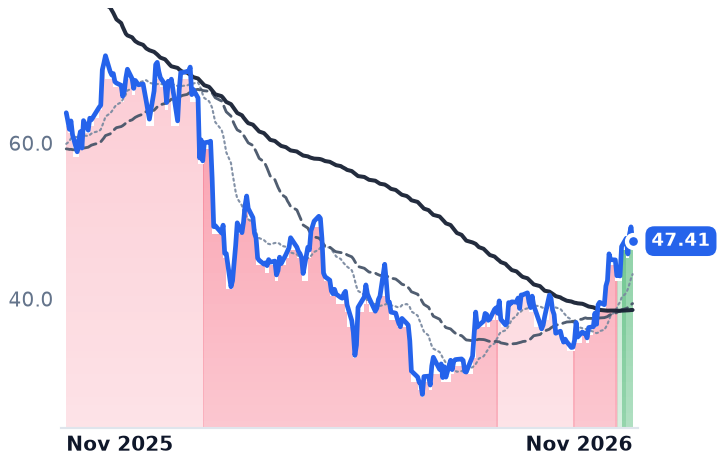
FIVN
Five9
28.12
−6.02 (−17.63%)
vs. prior close
Price20d50d150d
FIVN 12-month price
Sales, Service & Customer Management
TickerMkt capP/EP/E fwdP/SP/S fwdP/GPP/GP fwdEV/EBITDAFCF yld
FIVN$2.6B45.5x10.6x2.2x2.1x4.0x3.9x15.9x7.5%

Consensus projections

TickerFY2026EFY2027EFY2028E
BANDRevenue+20.3%+7.7%+14.2%
EPS+23.3%+21.5%+33.4%
TWLORevenue+20.8%+11.6%+10.6%
EPS+28.1%+11.5%+13.7%
RNGRevenue+5.1%+4.6%+4.4%
EPS+16.4%+11.1%+10.8%
FIVNRevenue+9.5%+9.9%+10.6%
EPS+10.5%+18.0%+16.6%

Forward fiscal years only. Blank means no analyst coverage for that year.

America's big wireless carriers raised the fee they charge for delivering a text message repeatedly this year, and that money passes through the books of the companies that sell messaging and voice interfaces to software developers before it leaves again. It inflates revenue, deflates reported gross margin, and touches gross profit not at all. Both listed pure-plays reported on 29 October and both were sold hard afterwards, which raises a narrower question than the share prices suggest: whether the carrier is now taking the increment, or merely routing through it.

The market read the quarters as evidence that the meter is breaking — that volume is growing while the price of a delivered message falls toward the carrier's own cost. The profit lines say the opposite, and the split between the two companies is about what comes next, not about what happened.

What a message costs before anyone earns on it

The fee is set upstream. Across four pricing updates in 2026, six separate US SMS and MMS fee increases took effect: T-Mobile lifted its outbound pass-through for registered business messaging from $0.0030 to $0.0045 per segment in January, a 50% step, and Verizon raised outbound SMS on 1 May and again from $0.0045 to $0.0050 on 1 October. The blended fee went from roughly $0.0033 to about $0.0043 a segment in under a year. The increases were applied across registered campaigns, toll-free and short-code traffic alike, and Verizon's October change also lifted its rich-messaging fee.

Bandwidth's own meter is not the one that slowed

Bandwidth, which runs its own carrier network and sells voice and messaging interfaces plus session-initiation trunking to large enterprises and contact centers, reported revenue of $234.0m for the quarter ended 30 September. Cloud communications revenue — total less surcharges — rose 12% to $158.5m while surcharge revenue rose 51% to $75.6m. On the quarter's $33m of programmable messaging revenue, that is roughly $2.29 of remitted surcharge for every dollar the company keeps, on figures the desk has divided out.

Reported gross margin fell 222 basis points to 36.2%. Underneath it, GAAP gross profit grew 14.9%, an acceleration from 9.0% and 9.6% in the first two quarters; non-GAAP gross profit rose 18% to $96m and non-GAAP gross margin widened nearly 300 basis points to 60.6%, an 86% yield on the growth in cloud communications revenue. Adjusted EBITDA rose 43% to $35m and operating income turned positive at $1.8m. "We're raising the midpoint of our full year 2026 outlook across all of our guidance metrics," chief executive David Morken told investors on 29 October, adding that the company has "growing confidence in achieving double-digit cloud communications revenue growth in fiscal 2027." Bandwidth was also named the first certified bring-your-own-carrier partner for Salesforce's contact-center rollout across more than 25 countries, which management models at roughly a $20m annual run rate by end-2028.

Twilio's fee drag shrank while its expansion rate eased

Twilio, whose roughly 1,800 usage-billed interfaces let developers embed voice, messaging and email in their own applications, carried $53m of incremental US carrier pass-through fees in the quarter, below the $71m it absorbed in the second quarter. Non-GAAP gross margin of 49.2% was down 90 basis points but would have risen 80 without the fees; GAAP gross profit grew 20.3% against revenue growth of 19.9%, and free cash flow reached a record $370m. Full-year organic growth guidance went to 15% from 13–13.5%, and "we expect full year 2027 organic revenue growth of at least 10%, well above our 2025 Investor Day framework of 7% to 8%," chief financial officer Aidan Viggiano said on the same day.

The honest offsets sit in the demand data rather than the margin: dollar-based net expansion eased to 114% from 116%, organic messaging growth slipped to 17% from 18%, and the fourth quarter is guided to 11–12% organic. The AI voice business widely credited with re-pricing the category is barely visible. "The way that we characterize voice AI in our prepared remarks is that it's about 1% of what the voice interactions are so far," chief executive Khozema Shipchandler said, calling mainstream adoption something that "is going to take some time."

What the selling was actually about

Bandwidth has fallen 32.9% in the 30 days to 6 November and Twilio 27.2%, with both companies beating on revenue and earnings. Bandwidth dropped 13% because full-year guidance matched consensus rather than exceeding it, and Twilio fell on its fourth-quarter outlook and margin commentary rather than the quarter. A chunk is beta: on 5 November, the Nasdaq Composite fell 5.5% and Bandwidth lost 10.4%, Twilio 7.2%. Neighbours moved far less — RingCentral down 6.5% over the 30 days, Five9 down 15.9%.

So the quarters account for almost none of the drawdown and the forward guides account for most of it. Bandwidth's own full-year range implies fourth-quarter growth of 17–19%, against 22% in the third, and consensus has 2027 revenue growing 7.7% as the fee increases lap — the reported line deflates precisely because the pass-through stops compounding. At 3.84x trailing and 3.69x forward gross profit, the appropriate anchor when surcharges make revenue non-comparable and GAAP earnings sit near zero, Bandwidth is below the 4.9x recorded in late August and 5.9x in late September. Twilio's 11.03x trailing has unwound the entire spike to 15.6x in September but remains well above roughly 7x in February, and its gross-profit growth is guided to slow. One has de-rated past its own history on a 2027 that management says is already largely signed; the other has given back a re-rating it earned three months ago.

The fee increases are the one input neither company controls and both are indifferent to in profit terms. They will lap, the reported growth rate will halve, and the business underneath will look exactly as it does now.
NAPCO Makes Four-Fifths of Its Gross Profit on Fees for Radios It Already Sold

Hypothesis Opus 5 · Research Opus 5 · Writing Opus 5 · Prompt v1.7

The most profitable revenue mix in NAPCO Security Technologies' history arrived in the same quarter the market decided the company had broken. Monthly alarm-service fees reached $26.1m at a gross margin above 90% and crossed half of total revenue, while the hardware line that seeds those subscriptions fell 7.3%.
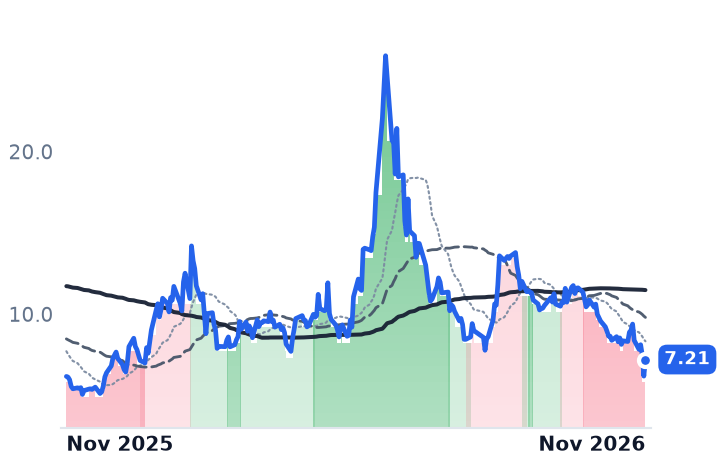
Management blames two large locking distributors working down inventory, and says their customer sell-through still grew about 5%. The annuity side of the business is intact; the equipment side is the part the market can verify only one quarter at a time.

NAPCO now trades near 8.9x trailing gross profit against roughly 14.5x a year ago, even as trailing gross profit dollars grew 16.3%. Eight trading days earlier, Allegion was rewarded for the opposite quarter: volume and price together in non-residential locks.

NSSCALLERecurring Monitoring RevenueFire Alarm RadiosDistributor DestockingSection 301 TariffsData-Center Buildout
TickerCompanySegmentTrend · 13mo30D1Y
NSSCNapco Security TechnologiesElectronic Access Control🔴 Cont. Bear−16.3%−28.1%
ALLEAllegionElectronic Access Control🟢 Cont. Bull+23.2%+11.5%

12-month price & trend

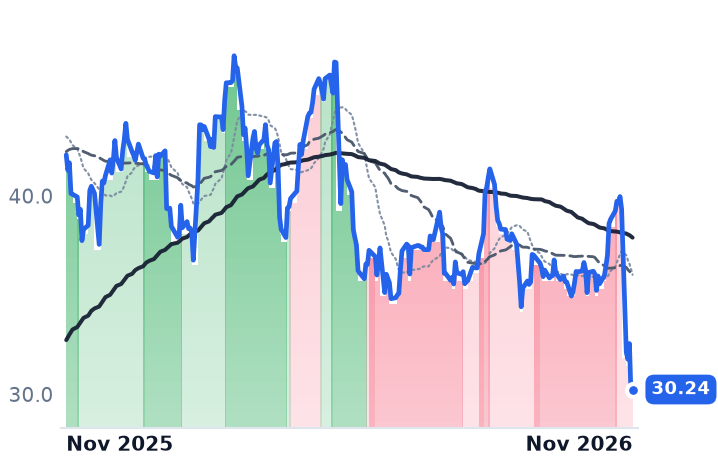
NSSC
Napco Security Technologies
30.24
+0.25 (+0.83%)
vs. prior close
Price20d50d150d
NSSC 12-month price
Electronic Access Control
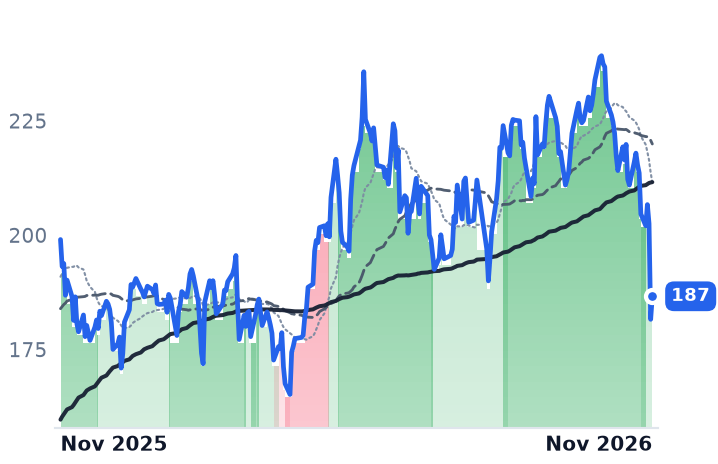
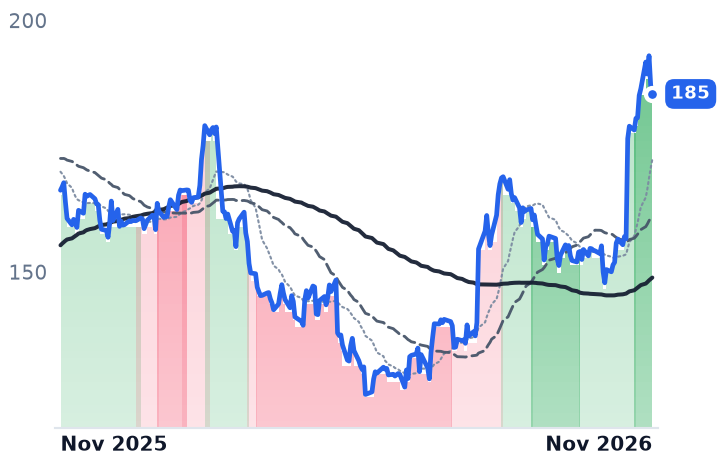
ALLE
Allegion
185
−1.75 (−0.94%)
vs. prior close
Price20d50d150d
ALLE 12-month price
Electronic Access Control
TickerMkt capP/EP/E fwdP/SP/S fwdP/GPP/GP fwdEV/EBITDAFCF yld
NSSC$1.1B24.6x19.6x5.3x5.0x8.9x8.4x18.3x4.6%
ALLE$15.8B23.0x20.4x3.6x3.5x8.0x7.8x16.0x4.7%

Consensus projections

TickerFY2026EFY2027EFY2028E
NSSCRevenue+13.5%+8.0%+8.0%
EPS+31.0%+3.6%+13.2%
ALLERevenue+10.1%+6.0%+5.0%
EPS+11.1%+11.7%+9.0%

Forward fiscal years only. Blank means no analyst coverage for that year.

NAPCO Security Technologies, which makes intrusion and fire alarms and the cellular radios that report them to monitoring stations, grew revenue just 1.7% in its September quarter, the slowest in two years of reported quarters. The same three months produced the most profitable revenue mix the company has ever had: recurring service fees of $26.1m at a gross margin of 90.1%, now 52% of the total, which lifted group gross margin to 58.7% from 56.6%.

Do the arithmetic the company's own disclosed margins allow and the subscription book throws off roughly $23.5m of the quarter's $29.35m of gross profit — about four-fifths of it. The quarter was read as evidence that the franchise is stalling. What stalled is the 24%-margin hardware line, and the question that matters is whether that line comes back, because the radios sold today are the fees billed for years.

The two distributors that stopped restocking

Equipment revenue fell 7.3% to $23.9m. Management attributes the decline to a prior-year comparison inflated by tariff-driven backlog and to two large locking distributors drawing down inventory, noting that those same distributors grew customer sell-through about 5% year on year and double digits sequentially, and that one resumed ordering in early October. Equipment gross margin slipped to 24.3% from 26.0% as the company's Section 301 tariff exposure rose from 10% to 12.5%; the full-year target is 26%-27%.

The annuity, meanwhile, rests on a legal requirement rather than a security budget. "Approximately 75% of our installed base is comprised of our Starlink fire radios, which are mandated in commercial buildings and it generates our most profitable recurring revenue," chief executive Kevin S. Buchel told investors on 2 November. The newer cloud access-control platform, MVP, bills $3 per door per month and signed its first national dealer in the quarter, though Buchel said adoption has been slower than he wanted, with dealer training the obstacle.

A cheaper annuity than a year ago

The shares fell about 17% in premarket trading on 2 November on revenue of $50.0m against $53.13m consensus, and kept falling for four sessions. Price-to-gross-profit is now near 8.9x, against about 11.8x a week before the print and roughly 14.5x a year ago, a de-rating of some 38% while trailing four-quarter gross profit dollars rose 16.3% to $121.3m. Trailing earnings understate the run rate: a $16m securities-litigation accrual produced a GAAP operating loss in the March quarter, and $15m was paid out in the September quarter, cutting free cash flow 79.8% to $2.3m against $134.6m of cash and no debt. The sell side cut targets without cutting ratings — DA Davidson to $45 from $52, Buy maintained.

Eight sessions earlier, the other meter was paid

Allegion, which sells Schlage locks, Von Duprin exit devices and electronic access-control systems through specialty distribution, reported revenue of $1,172.6m on 22 October, up 9.6% and 7.2% organically, with Americas non-residential up low double digits on volume and price together. It rose 12.7% in a session and 23.6% over the 30 days NAPCO fell 16.7%. "As we mentioned in second quarter, data centers were approaching 5% of our Non-Res business. I'd say it's there now, growing rapidly and has been a source of volume growth this year," chief executive John Stone said that day — narrow ground, given that US non-residential construction spending is on course to fall in 2026 for the first time since 2010 outside the pandemic year. Allegion now trades at 8.0x trailing gross profit against 6.5x at its April low, and 20.4x forward earnings against 23.0x trailing.

The split has a cause, and it is the point of sale. Allegion resets list prices several times a year — chief financial officer Michael Wagnes said on 22 October that "the days of just setting pricing once across the portfolio in early February, has kind of changed over the last couple of years" — and books the whole opening at once. NAPCO's hardware reaches the installer through distributors whose inventory decisions gate the radios, and each radio not shipped is a subscription not started. That is a timing risk on the annuity, not a margin risk; what the September quarter cannot settle is how many quarters of timing there are.

The de-rating is doing more work than the results support on the recurring side and less on the earnings side: consensus has NAPCO revenue up 8% in fiscal 2027 but earnings per share of $1.545 against $1.492, about 3.6% growth, so 19.6x forward is being paid for revenue analysts do not expect to drop through. Judge the business on the annuity and it compounded; judge it on next year's earnings and it did not.

The fee book NAPCO has built is the part no distributor can decline to restock. The radios that feed it still have to be bought by someone first.

Cisco Paid for Its Hyperscaler Switch Orders in Product Margin; Arista Did Not

Hypothesis Opus 5 · Research Opus 5 · Writing Opus 5 · Prompt v1.7

Ethernet has taken the back-end network inside AI clusters, and the markdown of the switch vendors rests on the idea that the port is a pass-through whose scarcity rent stays upstream with the merchant-silicon maker. Only one of the three listed vendors is actually conceding it.

Cisco's non-GAAP product gross margin fell 270 basis points in its July quarter on higher hardware mix and memory costs, as hyperscaler AI infrastructure grew to roughly 6% of revenue. Arista grew September-quarter revenue 58.5%, grew operating income faster still, and tightened its long-run gross margin range upward to 62-64%. HPE's acquired networking ran a flat operating margin and supplied close to half of group operating profit, while the AI systems it sells are the part management guided to dilute.

The de-rating has a disclosed cause at Cisco. At Arista, at 39.8x forward earnings on a full-year guide raised to $13.3bn, it does not.

ANETCSCOHPEEXTRAVGOAI Cluster EthernetMerchant Switch SiliconProduct Gross MarginsHyperscaler CapexWhite-Box SwitchingNetworking Systems
TickerCompanySegmentTrend · 13mo30D1Y
The subject · what this brief is about
ANETArista NetworksCloud Networking🟢 Cont. Bull−21.2%+24.4%
CSCOCisco SystemsEnterprise Networking & Infrastructure⚠️ Emerging Bear−20.7%+32.1%
HPEHewlett Packard EnterpriseEnterprise Servers🟢 Cont. Bull−39.1%+89.8%
EXTRExtreme NetworksEnterprise Networking & Infrastructure🔴 Cont. Bear−0.7%+34.2%
Compared against · context, not the story
AVGOBroadcomData Center & Networking⚠️ Emerging Bear−18.8%−17.7%

12-month price & trend

ANET
Arista Networks
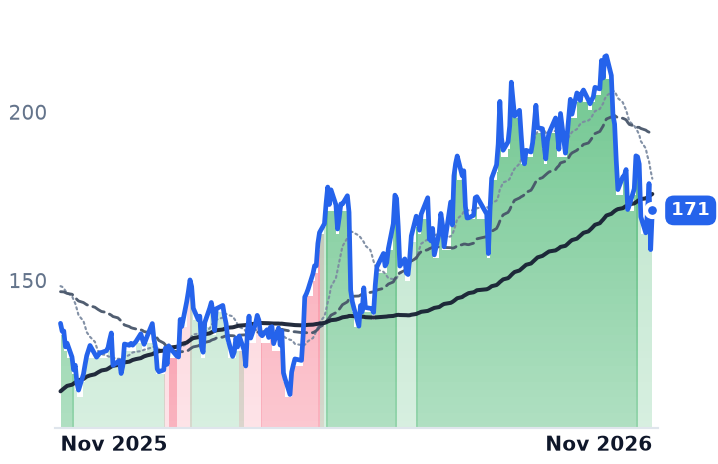
171
+11.64 (+7.31%)
vs. prior close
Price20d50d150d
ANET 12-month price
Cloud Networking
CSCO
Cisco Systems
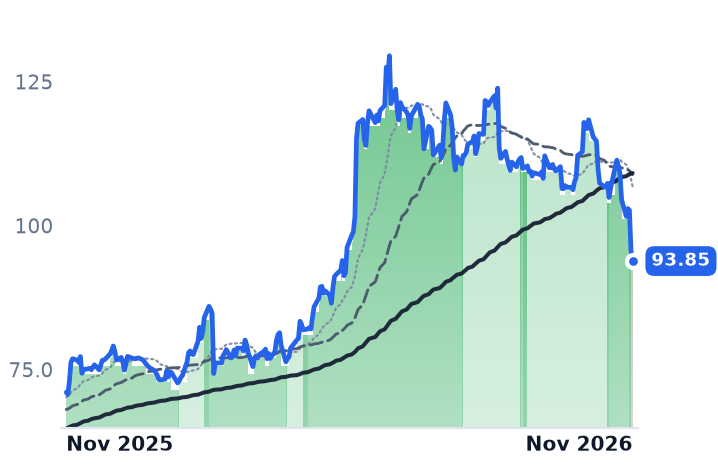
93.85
−1.87 (−1.95%)
vs. prior close
Price20d50d150d
CSCO 12-month price
Enterprise Networking & Infrastructure
HPE
Hewlett Packard Enterprise
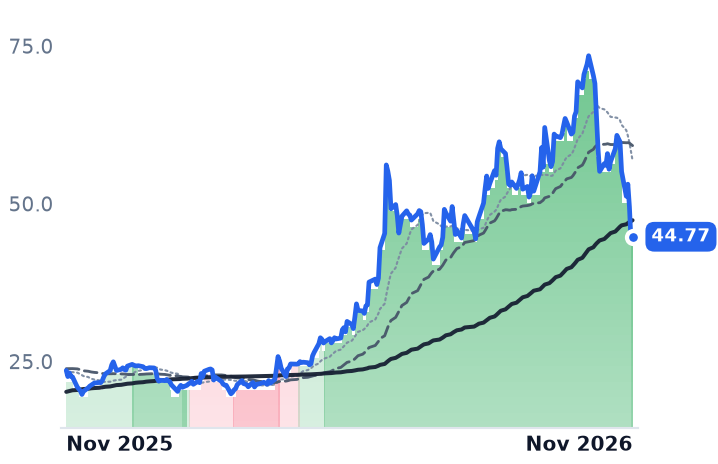
44.77
+0.61 (+1.38%)
vs. prior close
Price20d50d150d
HPE 12-month price
Enterprise Servers
TickerMkt capP/EP/E fwdP/SP/S fwdP/GPP/GP fwdEV/EBITDAFCF yld
ANET$215.4B45.3x39.8x18.1x16.3x28.8x26.0x36.0x2.3%
CSCO$370.0B27.9x18.4x5.8x5.1x9.1x7.9x19.6x3.7%
HPE$59.4B22.3x9.5x1.4x1.1x3.9x3.0x11.7x7.0%
EXTR
Extreme Networks
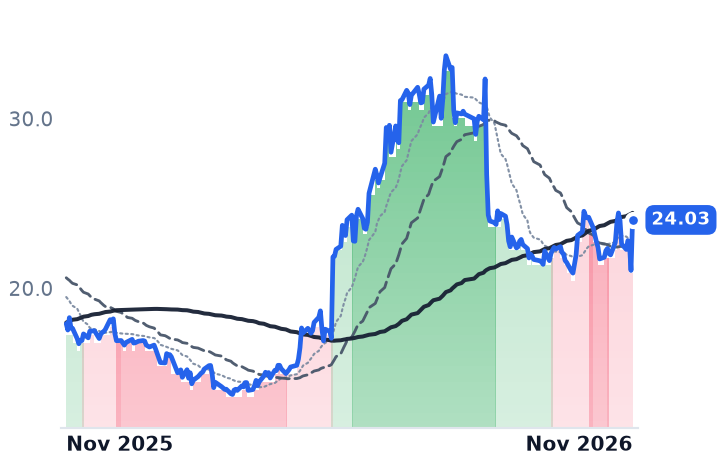
24.03
+2.98 (+14.16%)
vs. prior close
Price20d50d150d
EXTR 12-month price
Enterprise Networking & Infrastructure
AVGO
Broadcom
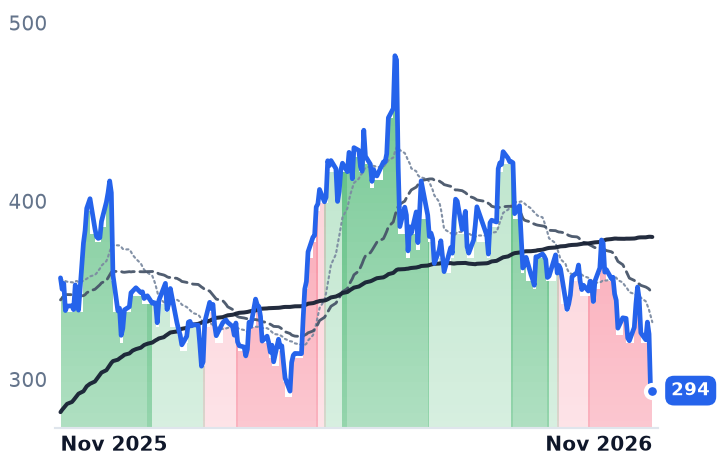
294
+2.16 (+0.74%)
vs. prior close
Price20d50d150d
AVGO 12-month price
Data Center & Networking
TickerMkt capP/EP/E fwdP/SP/S fwdP/GPP/GP fwdEV/EBITDAFCF yld
EXTR$3.2B60.3x17.6x2.4x2.2x3.9x3.6x32.7x3.8%
AVGO$1.6T40.8x28.2x17.6x14.8x25.6x21.6x30.7x2.5%

Consensus projections

TickerFY2026EFY2027EFY2028E
ANETRevenue+48.1%+37.4%+25.3%
EPS+49.0%+36.4%+25.8%
CSCORevenue+11.1%+15.9%+6.9%
EPS+12.9%+19.3%+8.8%
HPERevenue+35.0%+17.6%+8.4%
EPS+101.8%+23.5%+15.9%
EXTRRevenue+12.8%+10.3%+9.7%
EPS+26.5%+32.5%+14.3%
AVGORevenue+67.2%+64.4%+61.7%
EPS+73.0%+65.2%+58.8%

Forward fiscal years only. Blank means no analyst coverage for that year.

The three listed companies that sell the Ethernet fabric AI clusters run on all reported accelerating business, and all three have been marked down hard in a month. Only Cisco paid for its AI orders in margin.

The markdown rests on a specific argument: that the switch port is becoming a pass-through, that the cluster dollar gets spent but the scarcity rent stays upstream with the company that makes the silicon inside the box. The upstream half of that is not in dispute. Broadcom has guided fiscal 2026 AI semiconductor revenue to $58bn, up 186%, with AI networking revenue up more than 2.5 times year on year in its third quarter — an AI networking silicon business of roughly $19bn on those figures, larger than Arista's entire revenue guide for the year. The question is what happens downstream of it, and the three income statements disagree.

Cisco's order book came out of product margin

Cisco, which sells campus and data-center switching, routing, security and the Webex collaboration suite, booked $9.3bn of hyperscaler AI infrastructure orders in fiscal 2026, roughly 4.5 times the prior year and above the $5bn it first targeted. It recognized about $4bn of that as revenue. The cost is disclosed in its annual filing: non-GAAP product gross margin of 64.8% in the July quarter, down 270 basis points year on year on higher hardware mix and memory costs, with hyperscaler AI demand rising from under 2% of total revenue to approximately 6%. Full-year gross margin slipped to 64.5% from 64.9% while revenue growth accelerated to 11.8%. Management projects $7.5bn of hyperscaler AI revenue in fiscal 2027, which is the same mix, larger.

Arista raised the floor of its margin range

Arista, which sells high-speed Ethernet switches running its own EOS operating system to internet companies, telecom carriers and banks, did the opposite. September-quarter revenue grew 58.5% to $3.658bn, the fastest in its history as a public company, and operating income grew 67.9% — faster than revenue. Reported gross margin of 63.6% was about a point below last year but up from the 61.9% trough two quarters earlier, and management tightened the long-run range to 62-64% from 60-65%, lifting the floor. The fourth revenue raise of the year took fiscal 2026 to $13.3bn, with AI fabric revenue guided to double to roughly $7bn in 2027.

"These type of migrations are multiyear. And so we're very confident not only in our '27 guide, but a promising '28 ahead as well," chief executive Jayshree Ullal told investors on November 3.

What Arista spends to stay out of commodity territory is visible: research and development reached $408.5m in the quarter, 11.2% of revenue, against $278.1m in the prior one, on accelerator partnerships and liquid cooling. Two soft spots survive the quarter. Deferred revenue was flat sequentially at $6.8bn despite the growth, and Meta and Microsoft together are more than 40% of sales — the two customers best placed to have the same box built white-box, and the two whose accelerators Arista is co-engineering against.

Nearly half of HPE's profit is the networking it bought

Hewlett Packard Enterprise sits between the two, and the profit is not coming from the cluster. Networking revenue rose 74.9% to $2.9bn in the July quarter at a 22.0% operating margin, flat year on year — roughly $638m of segment profit on those disclosures, about 46% of group operating income on about a quarter of group revenue. Campus and branch gear is still half the segment. The AI-adjacent lines grow faster off a smaller base: data-center networking of $382m, routing of $788m, the latter up 270% behind a disclosed Oracle deployment of HPE Juniper switching and routing. Chief executive Antonio Neri said on September 2 that HPE is "at the core becoming a networking company." Meanwhile AI systems orders of $2.4bn lifted backlog to a record $6.8bn, and management guided the Cloud and AI operating margin down sequentially on AI systems mix and pricing.

The drawdown and the disclosures line up once

The three fell an average of 25% over the thirty sessions to November 6, against a twelve-month gain of 47% across the shelf they sit on. HPE's fall came in two legs, and the larger one predates the November repricing of data-center buildouts: it dropped 25.0% between October 9 and October 16, after Barclays downgraded it alongside Dell and NetApp, arguing that enterprise AI is about 5% of IT budgets with a quarter of that going to hardware, so recent hardware revenue reflects memory-cost inflation. That argument bears directly on HPE's reported gross margin expansion of nearly twelve points. Extreme Networks, which sells campus and branch Wi-Fi and switching to hospitals and schools, fell 1% over the same stretch.

None of the reported lines explains the move. Cisco's de-rating has a cause anyone can read in the filing, and the compression is modest — 7.9x forward gross profit against 9.1x trailing — because the dilution is real and continuing. Arista's does not: 39.8x forward earnings against roughly 41x in July, with the shares a touch below their May 1 level while the full-year guide went from about $10bn to $13.3bn, so a third of the multiple came off on revisions alone. HPE at 9.5x forward earnings, 11.7x trailing EV/EBITDA and a 7.0% free-cash-flow yield now sits below the bottom of a 10-13x forward anchor, with the caveat that the forward figure rests on a fiscal 2027 it has not reported against.

Cisco has not updated its AI order book since August 12. It reports again on November 12, and the open question is whether the margin it gave up was an entry fee or the new price of selling a port into an AI cluster.

Calix Resets Fiber-Gear Prices Monthly as Memory Costs Rise; Adtran Ran Short of Parts

Hypothesis Opus 5 · Research Opus 5 · Writing Opus 5 · Prompt v1.7

A record quarter cost Calix almost nothing in extra profit. Revenue reached $302m in the September quarter, up 14%, while gross profit grew 5.8% and net income fell 34.7% — the gap is the memory bolted into access boxes sold to small and rural internet providers.

The group these shares sit in has been read as a federal-subsidy timing problem. It is not: Calix sizes its Broadband Equity, Access and Deployment opportunity at $1bn to $1.5bn and expects it in 2027, so this year's growth and its record $396m of contracted backlog are pre-subsidy. The drag comes from component prices, and it splits the shelf by who can pass them on. Calix now updates surcharges monthly and holds 53.3% gross margin; Adtran, at 38.5%, grew 0.6% and could not get supply. Gilat, selling satellite ground gear on an entirely different meter, fell hardest with nothing disclosed at all.

CALXGILTADTNVSATHLITCMTLFiber Access EquipmentMemory PricingComponent Cost Pass-ThroughRural Broadband BuildoutSupply ConstraintsSatellite Ground Systems
TickerCompanySegmentTrend · 13mo30D1Y
The subject · what this brief is about
CALXCalixBroadband Service Provider Solutions🔴 Cont. Bear−17.8%−52.3%
GILTGilat Satellite NetworksBroadband Service Provider Solutions🔴 Cont. Bear−19.6%−42.4%
VSATViasatBroadband Service Provider Solutions⚠️ Emerging Bear−11.2%+72.9%
Compared against · context, not the story
ADTNADTRANOptical Networking🔴 Cont. Bear−45.8%−49.6%
HLITHarmonicVideo & Media Distribution⚠️ Emerging Bear−13.5%−5.7%
CMTLComtech TelecommunicationsCommunication Equipment🔴 Cont. Bear−4.2%−62.3%

12-month price & trend

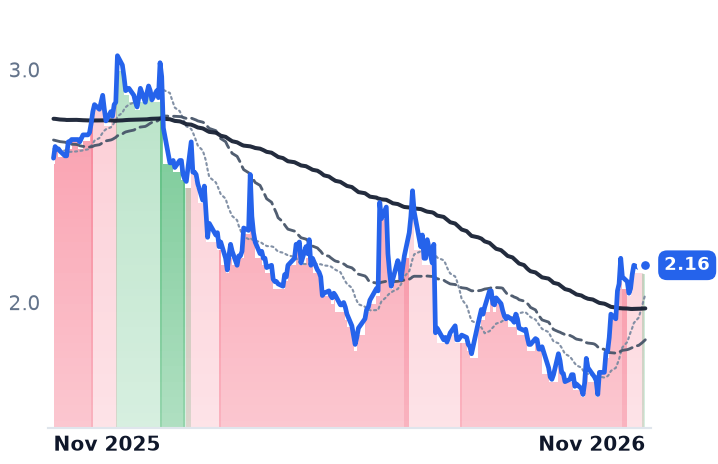
CALX
Calix
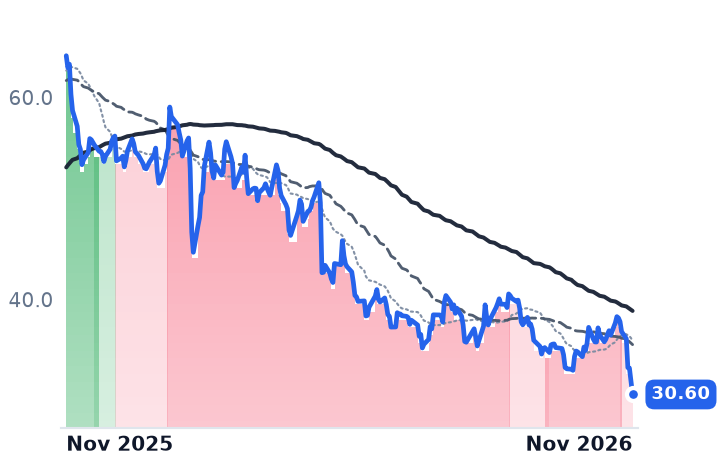
30.60
−1.26 (−3.95%)
vs. prior close
Price20d50d150d
CALX 12-month price
Broadband Service Provider Solutions
GILT
Gilat Satellite Networks
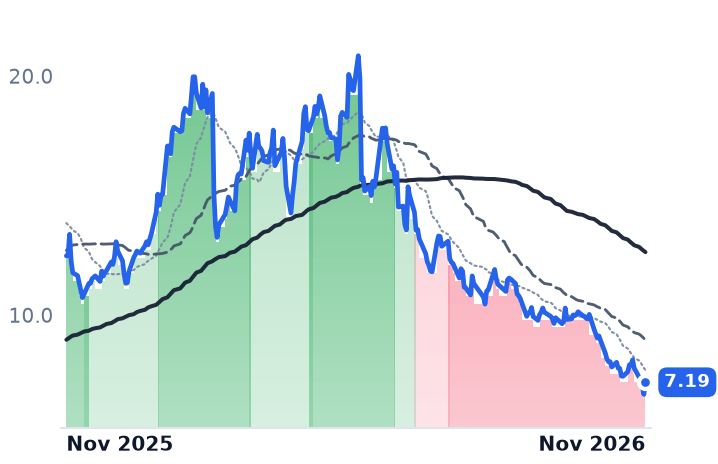
7.19
+0.51 (+7.63%)
vs. prior close
Price20d50d150d
GILT 12-month price
Broadband Service Provider Solutions
ADTN
ADTRAN
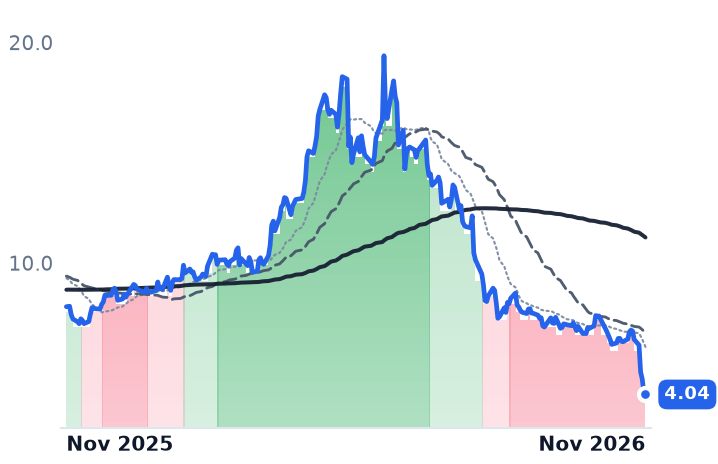
4.04
−0.09 (−2.18%)
vs. prior close
Price20d50d150d
ADTN 12-month price
Optical Networking
TickerMkt capP/EP/E fwdP/SP/S fwdP/GPP/GP fwdEV/EBITDAFCF yld
CALX$1.9B43.1x17.3x1.7x1.6x3.0x2.9x21.9x3.2%
GILT$534.3M15.6x11.7x1.1x1.1x3.6x3.5x7.4x-0.6%
ADTN$326.3Mn/m13.7x0.3x0.3x0.7x0.7x5.1x6.9%
VSAT
Viasat
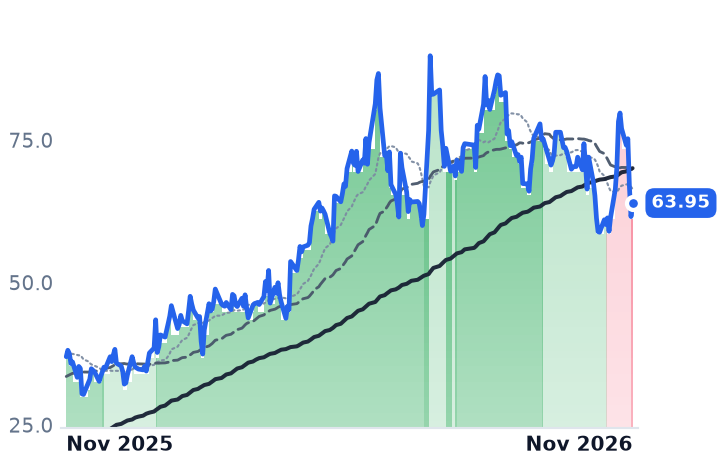
63.95
+2.38 (+3.87%)
vs. prior close
Price20d50d150d
VSAT 12-month price
Broadband Service Provider Solutions
HLIT
Harmonic
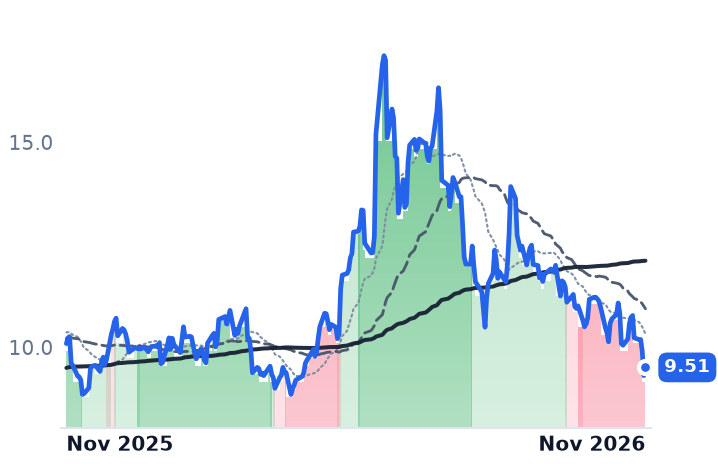
9.51
+0.20 (+2.15%)
vs. prior close
Price20d50d150d
HLIT 12-month price
Video & Media Distribution
CMTL
Comtech Telecommunications
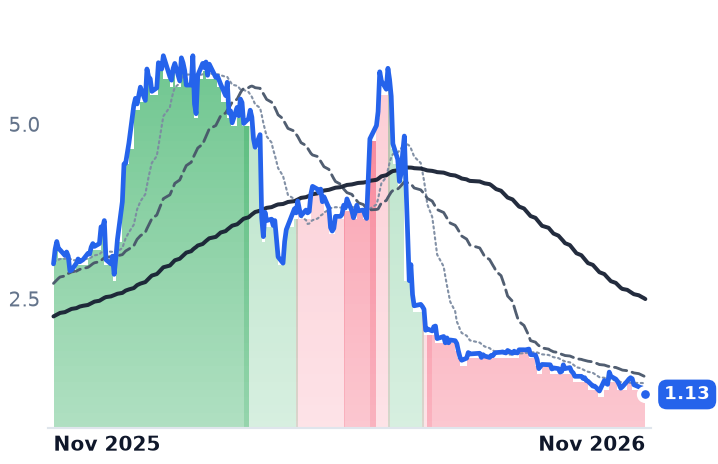
1.13
−0.05 (−4.24%)
vs. prior close
Price20d50d150d
CMTL 12-month price
Communication Equipment
TickerMkt capP/EP/E fwdP/SP/S fwdP/GPP/GP fwdEV/EBITDAFCF yld
VSAT$8.8B304.5x—1.9x1.8x5.3x5.1x9.2x11.5%
HLIT$1.4Bn/m19.6x2.7x2.8x5.4x5.5x19.4x4.0%
CMTL$116.3M9.5x—0.2x0.3x0.8x0.9xn/m12.5%

Consensus projections

TickerFY2026EFY2027EFY2028E
CALXRevenue+19.1%+15.5%+13.4%
EPS+31.3%+38.2%+36.9%
GILTRevenue+13.2%+11.7%+10.6%
EPS+6.6%+16.3%+13.3%
ADTNRevenue+5.5%+6.4%+7.7%
EPS+82.1%+60.1%+68.4%
VSATRevenue+3.6%+4.1%+4.7%
EPS−66.9%+59.4%+6.2%
HLITRevenue−11.6%+15.3%−2.1%
EPS+48.8%+19.7%−3.6%
CMTLRevenue−8.8%+4.6%—
EPS−67.3%−16.7%—

Forward fiscal years only. Blank means no analyst coverage for that year.

Calix reported the biggest quarter in its history on 3 November, and the shares fell 8% the same day. The San Jose company sells fiber-access platforms, premises systems and a cloud subscription to small, regional and rural broadband providers; it collected $302m of revenue, up 14% from a year earlier, and carried only 5.8% more gross profit out of the quarter. Net income fell 34.7% to $10.22m. The shares kept going, to $30.60 by 6 November.

This corner of communications equipment has been read for a year as a subsidy-timing story: rural operators sitting on their capital budgets until the federal Broadband Equity, Access and Deployment program pays out, after a June 2025 restructuring delayed deployment by at least a year. Calix's own numbers refuse that reading. Chief executive Michael Weening sized the program's opportunity for Calix at $1bn to $1.5bn and said it happens "at some point in 2027", which means none of this year's growth, and none of the record $396m in remaining performance obligations, is subsidy money. The pressure arrives from the other direction, through the bill of materials.

The memory bill is bigger than the software gain

Contract prices for conventional memory chips are set to rise 10% to 15% in the fourth quarter as suppliers shift capacity toward server modules for artificial-intelligence workloads. Calix's appliance gross margin fell 220 basis points in the quarter to 50.7%, which management attributed primarily to memory. Its software and services line went the other way, to a record 67.2%, up 340 points sequentially.

That is the whole argument in two lines, and the arithmetic does not yet favor the better line. Software and services were $52m of the quarter; appliances were roughly $250m. On those bases the hardware hit costs about $5.5m of quarterly gross profit against roughly $1.8m gained on software — figures derived from the reported mix. The recurring dollar earns about 16.5 points more margin and is growing faster, 19% against 14%, but hardware is still about four-fifths of the invoice.

Calix's answer is to reprice. It is passing cost through via monthly surcharge updates, targeting gross-profit neutrality, and it guided the December quarter to $311m–$317m of revenue. "At the midpoint of guidance for the fourth quarter, our 2026 non-GAAP EPS is $1.76, which would represent an annual EPS growth of 30%, compared to revenue growth of 19%," chief financial officer Cory Sindelar told investors on 3 November. Management also called 2027 "as challenging, if not more challenging" on memory.

Adtran had the same bill and neither the margin nor the parts

Adtran Holdings, the closest listed comparable in rural and regional access gear, reported the same day and fell 19.4% in the session, ending the month down 46.7%. Its revenue grew 0.6% to $281.2m at a 38.5% gross margin, with a small operating loss. "Generally speaking, I mean, it's 80%-90% supply cost," chief executive Tom Stanton said of the margin pressure, adding that "there was tens of millions of dollars we could have shipped if we had more supply." Its constraints now run past memory into optics, lasers, semiconductors and printed circuit boards; price increases have reached 70% of customers, with the rest rolling into early 2027. Rosenblatt's Mike Genovese cut his target from $15 to $6.25.

The fourteen-point gross-margin difference is why one of these two can surcharge and the other absorbs. Measured against the gross profit each actually earns, Calix is priced at 3.02 times and Adtran at 0.74 times.

Gilat fell harder with nothing disclosed

Gilat Satellite Networks, which builds satellite ground equipment and multi-orbit terminals for operators, governments and defense customers from Petah Tikva, Israel, dropped 20.5% over the same thirty days without reporting anything. Its last call was 5 August; third-quarter results are due 10 November. The only company news inside the window was positive: more than $10m of additional platform orders on 7 October and more than $8m of US Department of War field-service and upgrade orders on 8 October.

Its problem is mix, not cost. June-quarter revenue grew 16.9% to $122.66m, but gross margin has slid from 37.1% in 2024 to 29.5% in 2025 and 30.4% in the quarter as acquired terminal hardware dilutes it, and operating income fell 30.8%. "Gilat Defense continued to expand its activity in both the United States and in Europe," chief executive Adi Sfadia said on 5 August, reaffirming $500m–$520m of 2026 revenue. Defense revenue was $22.5m, up 12%. Growth here is substantially bought, and the $157.5m purchase of Comtech's satellite and space division, agreed in June and expected to close by year-end, buys more of it.

What the quarters do and do not explain

Calix's drawdown is its own print: the decline is concentrated in the sessions after 3 November, and the cause is visible in the margin line. The shares now carry 17.3 times this year's consensus earnings and roughly 12.5 times next year's $2.44, against 43.1 times trailing — cheapness that rests entirely on surcharges holding gross profit flat through a year management has already called harder than this one. Adtran's fall is also explained, and more severely, because it lacks both the margin cushion and the parts.

Gilat's is not explained by anything it has published. It trades at 11.7 times forward earnings and 1.10 times sales, against roughly 51 times earnings and 2.8 times revenue when it sat near a one-year high in May. Nothing in the three names moves together except the direction, which is the weakest thing three companies can share. The group's gentle twelve-month decline is itself an illusion built from one member: satellite operator Viasat rose about 80% over the year while Calix fell 52.5% and Gilat 42.8%.

On 10 November Gilat says what the last three months earned. Calix has already said what the next ones cost, and set itself a monthly deadline to collect it.

ASML Says Its Planned 2027 and 2028 Output Will Not Meet Demand; Customers Are Prepaying

Hypothesis Opus 5 · Research Opus 5 · Writing Opus 5 · Prompt v1.7

Every listed maker of wafer-fabrication tools has been marked down hard in a month, on the reading that a memory shortage can be answered by node migration inside cleanrooms that already exist and so buys few new machines. The four vendors in the group that have reported since mid-October describe a different limit: physical fab space and parts.

ASML's September-quarter revenue grew 55.2% with gross margin up to 57.4%, and customer advances for tools due more than a year out rose €5.73bn in the quarter to €9.30bn. Lam Research grew 54.4% on a record 52.3% gross margin and said its December guide would have been higher but for supply constraints. Axcelis booked $222m for a 1.5x book-to-bill and named greenfield cleanroom availability as the gate.

The quarters explain none of the drawdown's ordering, which tracked size rather than memory content. Onto Innovation is the unresolved case: its forward earnings multiple of 21.4x rests on consensus revenue growth of 43% it has not yet reported against.

ASMLLRCXONTOACLSAMATKLACVECOCAMTFORMICHRUCTTAEISWafer Fab EquipmentEUV LithographyDRAM & HBM CapacityGreenfield Cleanroom BuildoutEtch & DepositionEquipment Supply Constraints
TickerCompanySegmentTrend · 13mo30D1Y
ASMLASMLFabrication Equipment & Materials🟢 Cont. Bull−20.0%+37.6%
LRCXLam ResearchFabrication Equipment & Materials🟢 Cont. Bull−37.1%+20.8%
ONTOOnto InnovationFabrication Equipment & Materials⚠️ Emerging Bear−41.2%+22.8%
ACLSAxcelis TechnologiesFabrication Equipment & Materials⚠️ Emerging Bear−26.3%+13.5%
AMATApplied MaterialsFabrication Equipment & Materials⚠️ Emerging Bear−34.4%+42.0%
KLACKLAFabrication Equipment & Materials🔴 Cont. Bear−29.2%−88.6%
VECOVeeco InstrumentsFabrication Equipment & Materials⚠️ Emerging Bear−28.9%+19.7%
CAMTCamtekTest & Assembly Services🔴 Cont. Bear−36.5%−12.7%
FORMFormFactorTest & Assembly Services⚠️ Emerging Bear−41.9%+51.5%
ICHRIchorOther⚠️ Emerging Bear−48.3%+100.8%
UCTTUltra CleanFabrication Equipment & Materials⚠️ Emerging Bear−40.0%+52.3%
AEISAdvanced Energy IndustriesPower Conversion & Control🔴 Cont. Bear−31.8%−10.1%

12-month price & trend

ASML
ASML
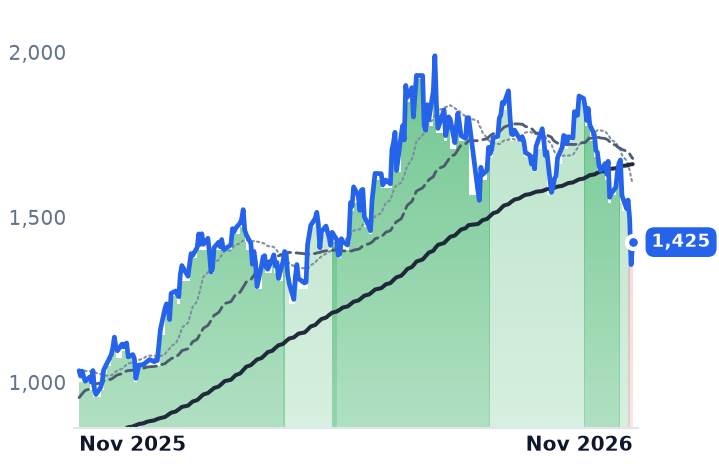
1,425
+68.10 (+5.02%)
vs. prior close
Price20d50d150d
ASML 12-month price
Fabrication Equipment & Materials
LRCX
Lam Research
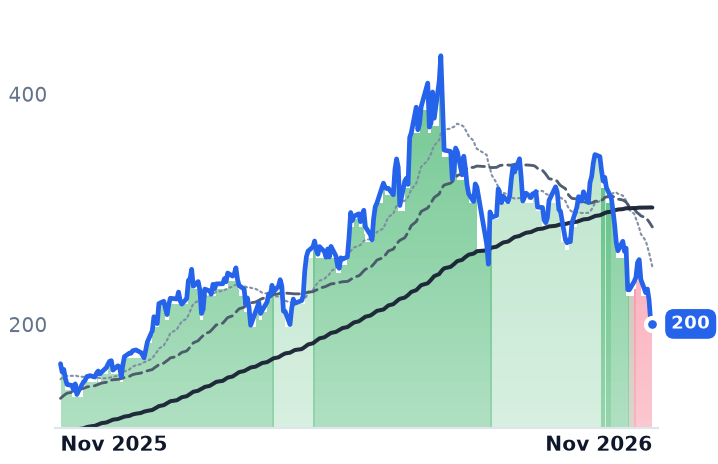
200
−2.28 (−1.12%)
vs. prior close
Price20d50d150d
LRCX 12-month price
Fabrication Equipment & Materials
ONTO
Onto Innovation
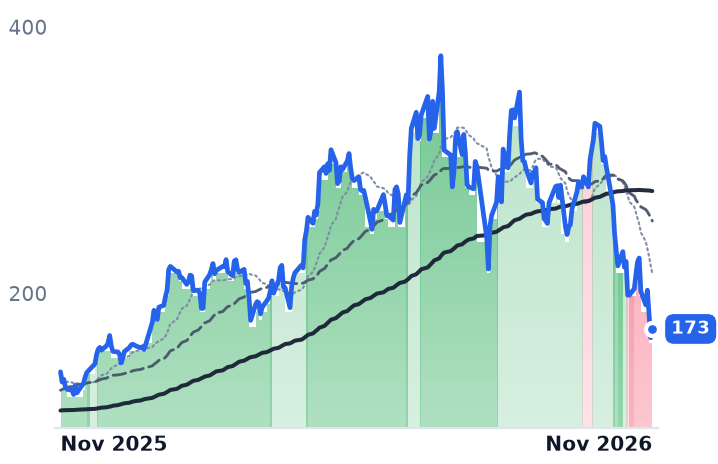
173
+6.57 (+3.94%)
vs. prior close
Price20d50d150d
ONTO 12-month price
Fabrication Equipment & Materials
TickerMkt capP/EP/E fwdP/SP/S fwdP/GPP/GP fwdEV/EBITDAFCF yld
ASML$549.1B36.7x34.6x12.5x12.4x23.1x22.8x29.8x4.3%
LRCX$250.8B29.7x20.8x9.6x7.1x18.8x13.9x24.3x2.6%
ONTO$8.5B64.7x21.4x7.6x5.9x15.1x11.7x35.1x3.0%
ACLS
Axcelis Technologies
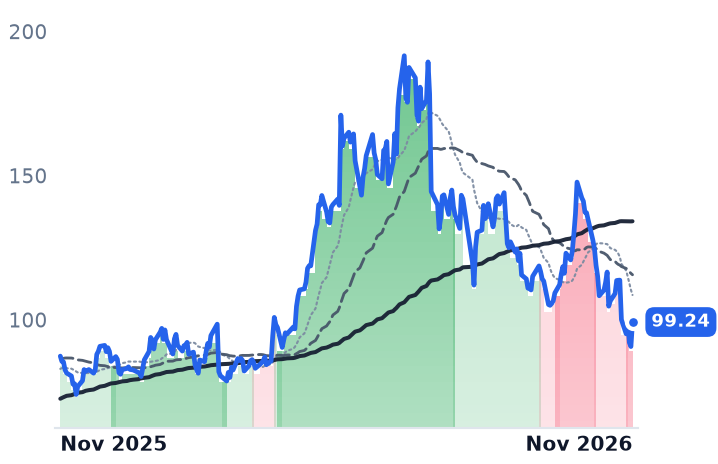
99.24
+8.49 (+9.36%)
vs. prior close
Price20d50d150d
ACLS 12-month price
Fabrication Equipment & Materials
AMAT
Applied Materials
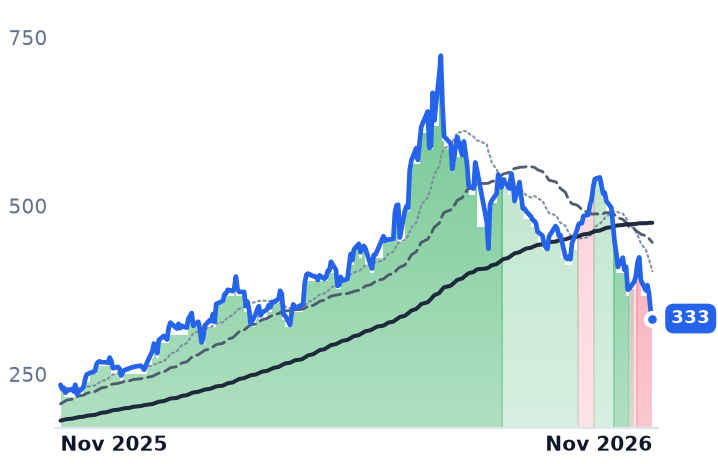
333
−11.31 (−3.29%)
vs. prior close
Price20d50d150d
AMAT 12-month price
Fabrication Equipment & Materials
KLAC
KLA
138
−1.08 (−0.77%)
vs. prior close
Price20d50d150d
KLAC 12-month price
Fabrication Equipment & Materials
TickerMkt capP/EP/E fwdP/SP/S fwdP/GPP/GP fwdEV/EBITDAFCF yld
ACLS$3.1B29.3x24.2x3.4x3.5x8.0x8.1x21.5x2.0%
AMAT$264.0B28.5x17.7x8.6x5.6x17.3x11.4x22.9x2.1%
KLAC$180.4B34.4x24.0x12.4x9.6x20.2x15.6x28.2x2.2%
VECO
Veeco Instruments
37.19
+3.26 (+9.62%)
vs. prior close
Price20d50d150d
VECO 12-month price
Fabrication Equipment & Materials
CAMT
Camtek
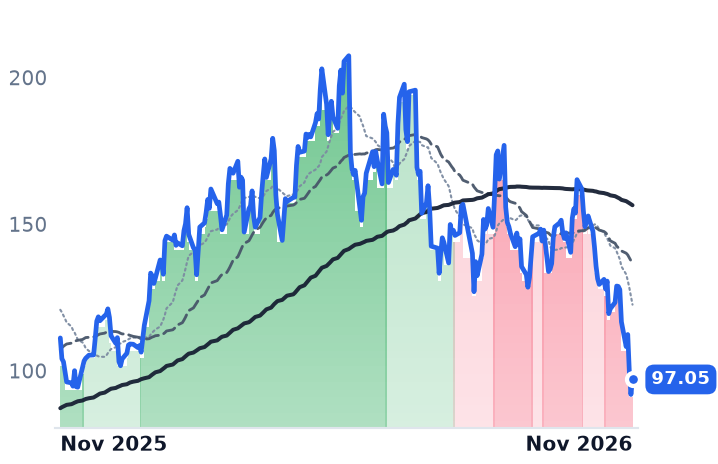
97.05
+5.13 (+5.58%)
vs. prior close
Price20d50d150d
CAMT 12-month price
Test & Assembly Services
FORM
FormFactor
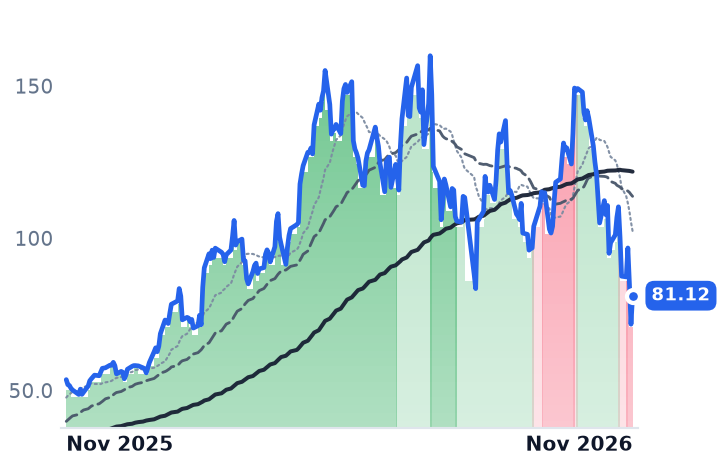
81.12
+9.36 (+13.04%)
vs. prior close
Price20d50d150d
FORM 12-month price
Test & Assembly Services
TickerMkt capP/EP/E fwdP/SP/S fwdP/GPP/GP fwdEV/EBITDAFCF yld
VECO$2.3B87.9x25.1x3.1x2.8x8.4x7.6x44.5x5.5%
CAMT$4.5B33.7x26.9x8.3x7.6x16.6x15.2x35.8x0.0%
FORM$6.3B36.5x24.0x6.5x6.0x13.1x12.2x27.3x2.9%
ICHR
Ichor
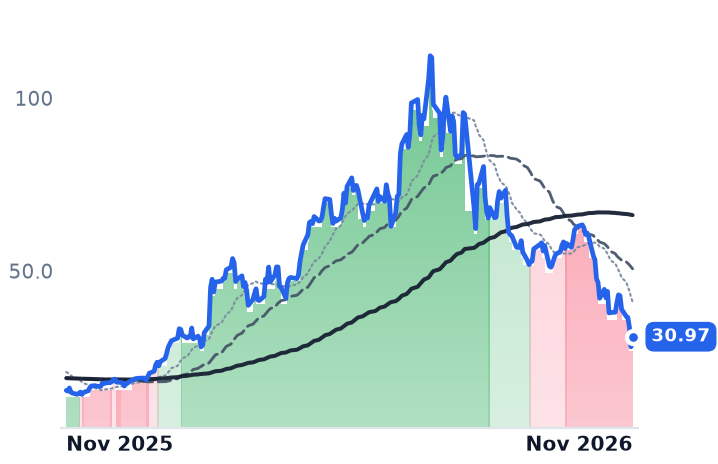
30.97
+2.93 (+10.47%)
vs. prior close
Price20d50d150d
ICHR 12-month price
Other
UCTT
Ultra Clean
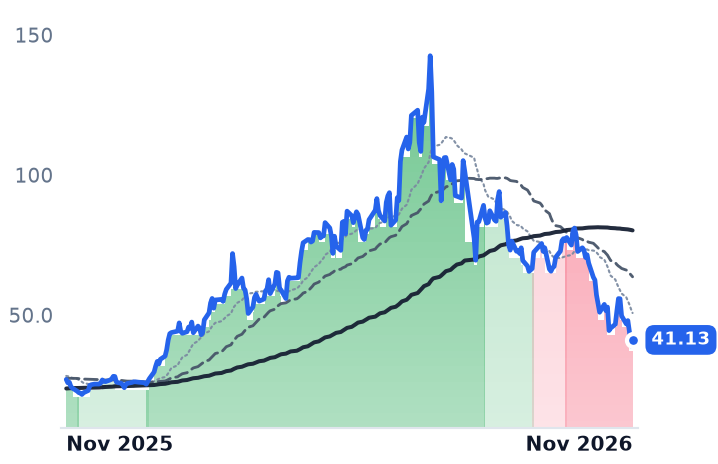
41.13
+2.15 (+5.52%)
vs. prior close
Price20d50d150d
UCTT 12-month price
Fabrication Equipment & Materials
AEIS
Advanced Energy Industries
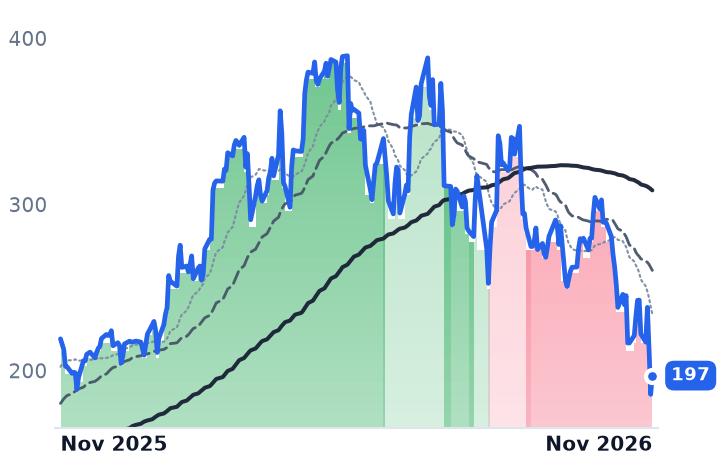
197
+11.35 (+6.11%)
vs. prior close
Price20d50d150d
AEIS 12-month price
Power Conversion & Control
TickerMkt capP/EP/E fwdP/SP/S fwdP/GPP/GP fwdEV/EBITDAFCF yld
ICHR$1.2B527.5x17.2x1.1x0.9x8.1x7.2x22.1x-5.8%
UCTT$2.0B70.9x12.0x0.8x0.7x5.0x4.4x13.7x-8.3%
AEIS$8.0B26.5x15.9x3.5x3.2x8.7x7.8x18.0x0.9%

Consensus projections

TickerFY2026EFY2027EFY2028E
ASMLRevenue+36.8%+29.7%+25.6%
EPS+66.3%+38.0%+32.0%
LRCXRevenue+27.0%+52.4%+20.1%
EPS+41.9%+69.5%+25.6%
ONTORevenue+2.2%+43.1%+30.8%
EPS−5.1%+63.3%+44.9%
ACLSRevenue+8.3%+11.9%+26.0%
EPS−8.7%+28.3%+56.2%
AMATRevenue+21.5%+36.5%+22.0%
EPS+36.8%+46.5%+31.2%
KLACRevenue+12.2%+39.5%+20.1%
EPS+14.5%+55.5%+23.1%
VECORevenue+21.0%+38.9%—
EPS+11.7%+111.1%—
CAMTRevenue+20.5%+35.0%+17.0%
EPS+12.5%+42.4%+18.0%
FORMRevenue+34.6%+24.3%+26.7%
EPS+199.2%+29.0%+38.5%
ICHRRevenue+30.7%+31.9%+10.7%
EPS+955.2%+90.7%+18.8%
UCTTRevenue+35.2%+39.9%+14.8%
EPS+225.8%+88.8%+23.8%
AEISRevenue+41.4%+31.1%+18.4%
EPS+98.6%+44.4%+24.4%

Forward fiscal years only. Blank means no analyst coverage for that year.

ASML's September quarter carried an admission capital-equipment vendors rarely make: it has sold more machines than it intends to build. The Dutch company, the only producer of extreme-ultraviolet lithography scanners, moved its order-book disclosure onto the balance sheet after discontinuing quarterly net bookings, and the substitute line moved violently — customer advances for tools due more than a year out rose €5.73bn in the quarter, reaching €9.30bn. "Given the dynamics of this quarter, we now anticipate that our current planned levels of output in 2027 and 2028 will not fully meet the demand of our customers," chief financial officer Roger J. Dassen told investors on October 14.

The thirteen listed suppliers of wafer-fabrication equipment fell between 20.6% and 48.9% in the month to 6 November. The drawdown has been read as a memory shortage failing to convert into tool orders: bits added by node migration and conversion inside cleanrooms that are already built consume far less equipment than new wafer starts, so record memory capital budgets need not become record tool sales. The last reported quarter at four of these vendors locates the constraint somewhere else entirely — in the cleanrooms, not in the willingness to order.

The prepayments arrive before the floor space does

ASML's record net sales of €11.7bn grew 55.2% year on year, with gross margin widening to 57.4% from 51.6% and operating income more than doubling. Of €8.4bn in system sales, €4.1bn was EUV. Low-NA EUV output is going to roughly 65 systems this year from 44 in 2025, with 30% growth planned for 2027 in both low-NA EUV and immersion deep-ultraviolet, and management is investigating going beyond that for 2028 because demand exceeds the plan. Prices on the most critical high-volume products rise from 2027, described as one-time rather than annual; existing backlog is not repriced.

Installed-base management revenue — upgrades and service paid on tools already running — was €3.3bn in the quarter and is guided to grow about 50% this year against roughly 36% for the group. That is the one piece of the bearish mechanism that holds: at ASML, the running fleet is earning faster than the new one. At 34.6x forward earnings, the shares are below the 40-48x forward recorded in May.

Lam capped its own December guide on parts

Lam Research, which sells the etch and deposition tools that cut and fill the high-aspect-ratio structures in 3D NAND and high-bandwidth memory stacks, grew revenue 54.4% to $8.219bn on a record 52.3% gross margin, its fifth consecutive revenue record. Deferred revenue rose $227m to $2.66bn. "Our preliminary 2027 WFE outlook is for more than $200 billion of spending, with percentage growth led by DRAM, followed by leading-edge foundry logic and NAND," chief financial officer Doug Bettinger said on October 21, a figure KLA independently corroborated alongside record quarterly revenue of $4.14bn and its first operating margin above 46%.

The shares fell as much as 11% on the day, because Bettinger said the $8.6bn December guide would have been higher but for near-term supply-chain constraints, with deferred shipments pushed into the first quarter of 2027. Lam also told the market that limited cleanroom space and parts shortages would stop the industry meeting demand into 2027. Service revenue of $2.5bn grew 40%, slower than the group. China rose to 35% of revenue from 26%. The forward earnings multiple is 20.8x against roughly 38x in May, while reported growth more than doubled.

What 100,000 wafer starts costs in implanters

Axcelis Technologies, which builds ion implanters, supplies the arithmetic the thesis needs. Roughly $150m to $200m of implant equipment serves 100,000 wafer starts a month, and its top three memory customers are adding more than 1m starts a month over four to five years. Memory is about 20% of system sales, nearly all DRAM and HBM. September-quarter bookings of $222m gave a 1.5x book-to-bill, the best since the fourth quarter of 2023, and chief executive Russell J. Low named the gate on November 5: "we are watching very, very carefully the availability of kind of greenfield clean room space because clearly, you know, today, our customers are often 4 wall constraints." Megafabs open "starting in 2027, but they are they are gonna be in phases." The stock trades at 24.2x forward earnings, with consensus 2026 earnings per share of $4.11 down 8.7%.

That capacity is being built. Samsung, SK Hynix and Micron are expected to spend $146bn in 2027, 3.4 times the $43bn of 2024, and SK Hynix has pulled completion of its Yongin cluster forward by twelve years. J.P. Morgan Global Research estimates DRAM prices will have risen more than 400% from the start of 2024 to the end of 2026.

Onto's leg is not reportable yet

Onto Innovation, which sells macro defect inspection and 3D bump metrology into advanced packaging, is the unverifiable case. Its June quarter grew 35.3% with operating income up 97.1%, off a 2025 that rose 1.8%. It raised its 2026 advanced-packaging growth outlook to roughly 80% from 50%, crossed $1bn of backlog, and closed a volume purchase agreement estimated above $240m with a leading HBM manufacturer. But 64.7x trailing earnings compresses to 21.4x forward only on consensus 2027 revenue of $1.44bn, up 43%, and the company guided the September quarter to $380-400m and reports between 9 and 12 November.

What the quarters explain, and what they do not

Nothing in these results explains the ordering of the selling. Onto, the purest HBM metrology name, fell 42.2%; Ultra Clean's gas-panel assembly fell 41.7%; ASML, the most lithography- and memory-levered name of all, fell least at 20.6%. The sequence tracks market value and liquidity. Roughly two-thirds of the damage was done in October, after Applied Materials declined to put a number on 2027 equipment spending at its 13 October investor day — Applied's own July quarter grew 24.8% and it now trades at 17.7x forward against 28.5x trailing — and the rest in the week to 6 November, when concern over tighter oversight of data-center construction hit the whole AI complex, a move Bank of America characterized as multiple compression rather than earnings cuts. Applied sits 54.0% below its 52-week high and Lam 53.7%. Of the names here, only ASML still holds the uptrend all thirteen held in May.

The bear case is not wholly empty. China's share of world equipment spending fell from 42.3% to 36.5% in 2025 with billings down about 11%, so the pull-forward is normalising at industry level even as it failed to appear sequentially at Lam or Axcelis. And a cycle whose gating item is construction phasing is a cycle whose revenue can slip a quarter at a time without any customer changing its mind.

Which is the live question for 2027, and it is a question about concrete and electrical capacity rather than about bits. The three memory makers' output for all of next year is already reported sold out. The tools to make more have been ordered and, at ASML, partly paid for. What nobody in this chain controls is when the doors open.

Appian Charges for AI by Moving Customers to a Pricier Tier of the Same Contract

Hypothesis Opus 5 · Research Opus 5 · Writing Opus 5 · Prompt v1.7

Software metered by the seat has been marked down for a year on the belief that AI shrinks the invoice. Appian's September quarter points the other way: revenue growth accelerated to 25.5% and its cloud net revenue expansion rate reached 120%, the strongest in more than five years, because AI adoption arrives as an upgrade to a more expensive tier of a contract the customer already holds.

The business explains the share move. The uptrend began six sessions after the August beat-and-raise, well before the procedural win in Appian's trade-secrets retrial against Pegasystems. What the business does not yet cover is the price: gross profit grew 20.8% while price-to-gross-profit roughly doubled from early May, operating cash flow was minus $15m against positive $19m a year earlier, and consensus still models 2027 revenue growth at 10.8%.

APPNPEGANOWCRMSNOWOKTATEAMRBRKPANWLow-Code Workflow AutomationSeat-Based Pricing PressureAI Monetization TiersNet Revenue RetentionRegulated-Industry Software
TickerCompanySegmentTrend · 13mo30D1Y
The subject · what this brief is about
APPNAppianDeveloper Platforms & APIs🟢 Cont. Bull+28.7%+22.0%
Compared against · context, not the story
PEGAPegasystemsSales, Service & Customer Management🔴 Cont. Bear−9.1%−45.8%
NOWServiceNowSales, Service & Customer Management🟢 Cont. Bull−27.6%−41.1%
CRMSalesforceSales, Service & Customer Management🌱 Emerging Bull−6.8%−11.0%
SNOWSnowflakeData, Analytics & Intelligence🟢 Cont. Bull−25.2%+2.7%
OKTAOktaIdentity & Access Management🟢 Cont. Bull−27.3%+96.8%
TEAMAtlassianSoftware Development & Design🟢 Cont. Bull−25.7%−3.4%
RBRKRubrikStorage, Backup & Data Management🟢 Cont. Bull−15.5%+39.0%
PANWPalo Alto NetworksCybersecurity & Threat Protection🟢 Cont. Bull−25.1%+44.9%

12-month price & trend

APPN
Appian
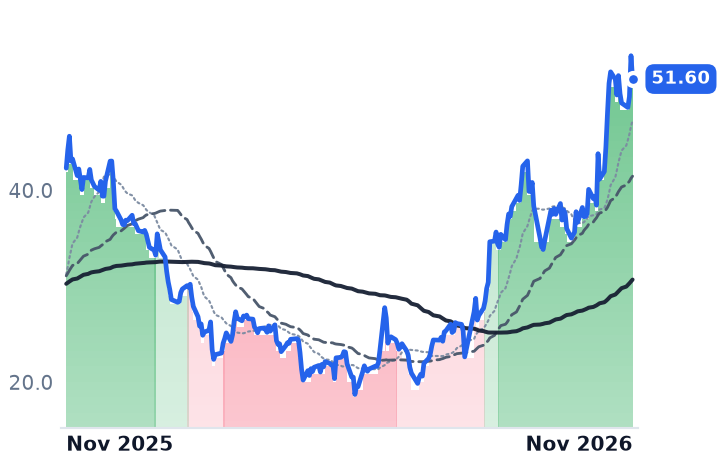
51.60
−2.43 (−4.50%)
vs. prior close
Price20d50d150d
APPN 12-month price
Developer Platforms & APIs
PEGA
Pegasystems
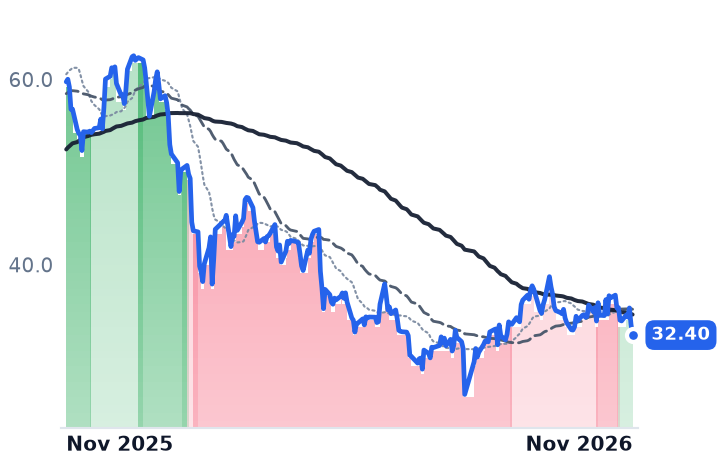
32.40
−1.17 (−3.49%)
vs. prior close
Price20d50d150d
PEGA 12-month price
Sales, Service & Customer Management
NOW
ServiceNow
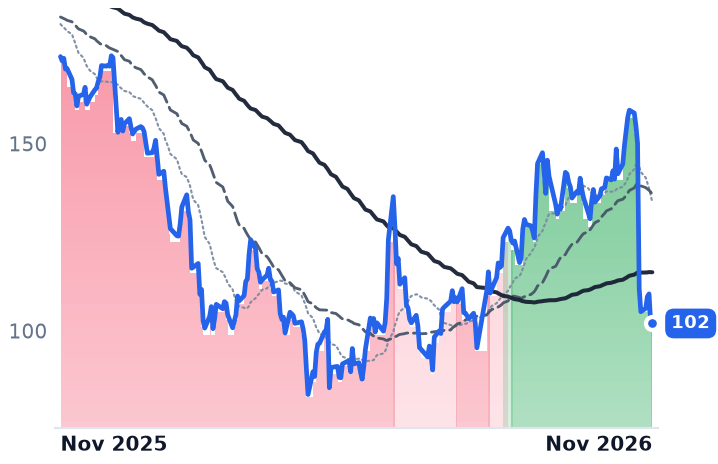
102
−0.39 (−0.38%)
vs. prior close
Price20d50d150d
NOW 12-month price
Sales, Service & Customer Management
TickerMkt capP/EP/E fwdP/SP/S fwdP/GPP/GP fwdEV/EBITDAFCF yld
APPN$3.7Bn/m47.7x4.4x4.3x6.1x6.0x158.1x1.0%
PEGA$5.3B18.6x15.6x3.0x3.0x4.0x3.9x25.4x8.5%
NOW$105.8B72.8x25.8x6.9x6.5x9.4x8.9x32.6x4.5%
CRM
Salesforce
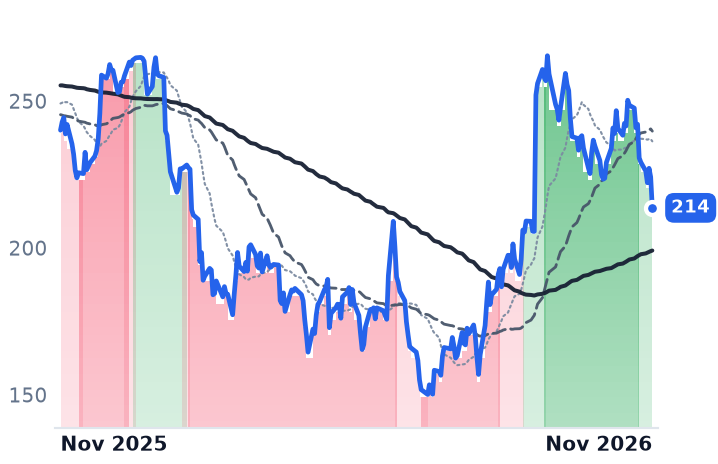
214
−10.50 (−4.68%)
vs. prior close
Price20d50d150d
CRM 12-month price
Sales, Service & Customer Management
SNOW
Snowflake
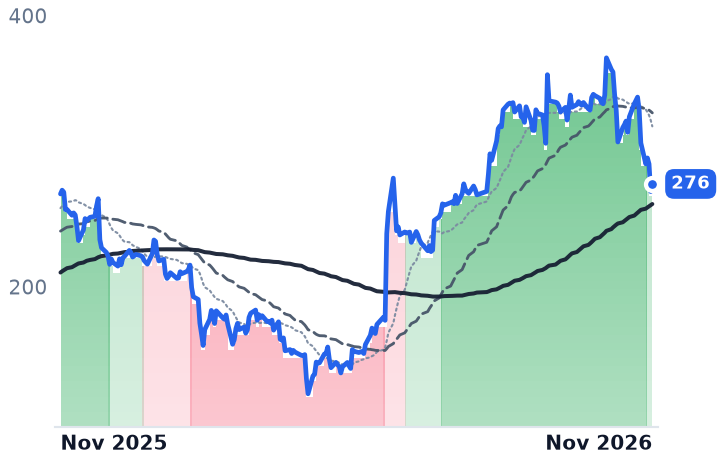
276
+5.60 (+2.07%)
vs. prior close
Price20d50d150d
SNOW 12-month price
Data, Analytics & Intelligence
OKTA
Okta
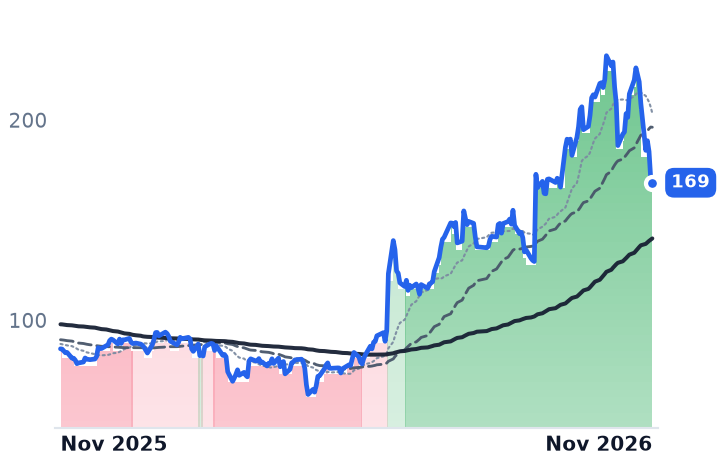
169
−2.47 (−1.44%)
vs. prior close
Price20d50d150d
OKTA 12-month price
Identity & Access Management
TickerMkt capP/EP/E fwdP/SP/S fwdP/GPP/GP fwdEV/EBITDAFCF yld
CRM$175.8B19.4x12.8x4.0x3.8x5.2x4.9x12.5x8.6%
SNOW$97.3Bn/m124.4x17.9x15.4x26.7x23.0xn/m1.2%
OKTA$28.2B99.8x42.9x9.2x8.7x11.7x11.2x66.7x3.4%
TEAM
Atlassian
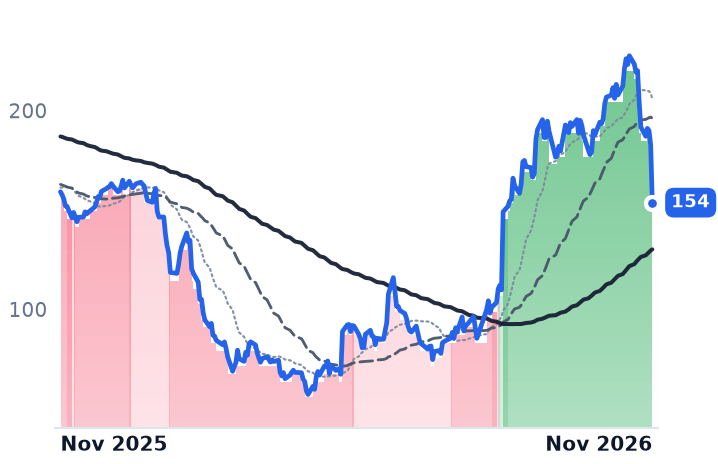
154
−29.01 (−15.88%)
vs. prior close
Price20d50d150d
TEAM 12-month price
Software Development & Design
RBRK
Rubrik
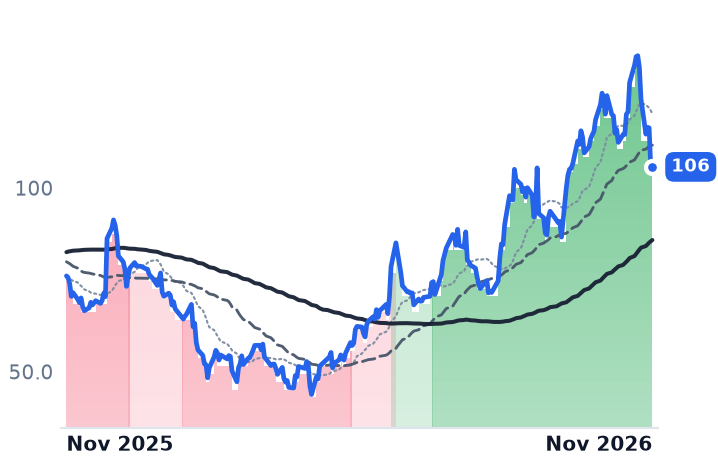
106
+0.01 (+0.01%)
vs. prior close
Price20d50d150d
RBRK 12-month price
Storage, Backup & Data Management
PANW
Palo Alto Networks
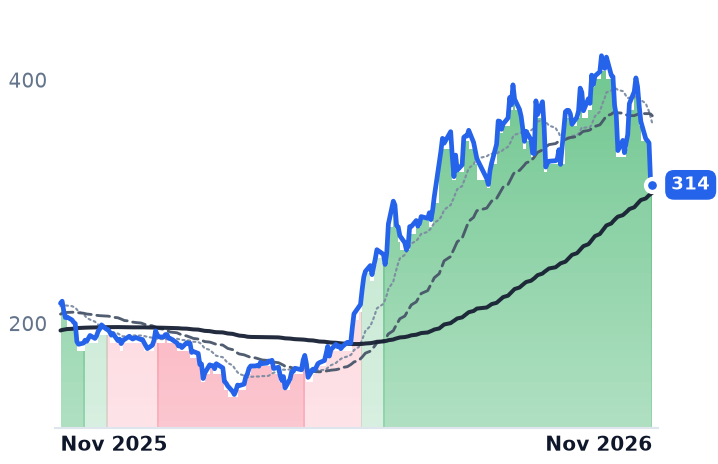
314
−0.83 (−0.26%)
vs. prior close
Price20d50d150d
PANW 12-month price
Cybersecurity & Threat Protection
TickerMkt capP/EP/E fwdP/SP/S fwdP/GPP/GP fwdEV/EBITDAFCF yld
TEAM$40.9B461.7x29.3x5.9x5.5x6.9x6.4x89.3x4.1%
RBRK$21.8Bn/m210.2x14.1x12.9x17.6x16.1xn/m1.5%
PANW$256.9B682.3x75.0x22.4x18.1x31.8x25.8x166.8x1.6%

Consensus projections

TickerFY2026EFY2027EFY2028E
APPNRevenue+19.1%+10.8%+7.3%
EPS+104.3%+31.3%+18.2%
PEGARevenue+3.1%+6.3%+7.0%
EPS−0.1%+14.4%+11.7%
NOWRevenue+22.6%+18.5%+18.1%
EPS+13.5%+21.6%+22.2%
CRMRevenue+9.3%+11.5%+9.9%
EPS+17.4%+42.3%−4.1%
SNOWRevenue+29.4%+35.7%+29.0%
EPS+72.3%+82.9%+36.4%
OKTARevenue+12.0%+10.8%+9.9%
EPS+24.3%+14.1%+10.6%
TEAMRevenue+24.7%+15.2%+15.1%
EPS+55.5%+0.0%+21.7%
RBRKRevenue+48.7%+32.0%+21.5%
EPS−90.5%−389.4%+53.1%
PANWRevenue+24.3%+24.0%+14.3%
EPS+15.5%+10.7%+16.1%

Forward fiscal years only. Blank means no analyst coverage for that year.

Appian raised its full-year guidance on 5 November after revenue growth accelerated in the September quarter, and its shares rose in a week when every large enterprise-software name around it fell. Between 4 and 6 November, ServiceNow lost 7.2%, Pegasystems 8.3%, Salesforce 5.9% and Snowflake 5.1%. Appian gained 3.7%.

The year-long mark-down of enterprise software rests on one mechanism: if an AI-assisted employee does the work of three, a per-seat invoice falls by up to two-thirds. Bain puts the cost of that repricing at roughly $2trn of market value over twelve months. Appian, which sells a low-code platform that generates workflows, forms, data models and interfaces instead of hand-coded applications to banks, insurers, life-sciences companies and government agencies, was read as an early casualty: a process-automation layer with no infrastructure underneath it, facing ServiceNow, Pegasystems and Microsoft's Power Platform. Over the year to 6 November, Pegasystems fell 45.0% and ServiceNow 40.6%. Appian rose 34.5%.

The upsell that reads as retention

Appian's AI money arrives as a price increase. Most of the quarter's uplift came from customers upgrading to the Advanced Tier, which carries a 25–35% premium to Standard, with AI usage up more than 50% from the prior quarter and consumption overages growing but not yet material. The effect lands in the company's disclosed retention meter: cloud net annual-recurring-revenue expansion hit 120%, against 115% in the prior quarter and 112% a year earlier, which management called the strongest in more than five years. Cloud subscription revenue of $136m grew 20%; total subscriptions, including self-managed software, grew 28% to $188m.

"Appian has claimed a distinctive and valuable place in the AI stack," chief executive Matthew Calkins told investors on 5 November. "We connect the world's most important technology to the world's most important work."

Four verticals — financial services, insurance, life sciences and the public sector — supply 80% of recurring revenue, and more than 70% of the business comes from customers spending over $1m a year, chief financial officer Serge Tanjga told the William Blair growth conference. That concentration is why one US Cabinet agency's seven-figure procurement deal moves a quarter.

Margin widened; the cash went the other way

GAAP operating income rose 62.4% to $21.3m, a 9.1% margin, and adjusted EBITDA of $43m beat a $30–33m guide. Full-year EBITDA guidance went to $116–119m, up about 53%, and revenue guidance to $873–877m. The base is low: 2025 was Appian's first positive GAAP operating year, at $0.6m on $726.9m of revenue.

Three things complicate the inflection. GAAP gross margin fell 2.9 points to 72.9%, while management described gross margin as 74% on a non-GAAP basis, flat year on year. Professional-services gross margin fell to 24% from 31% as implementations scale. And operating cash flow was minus $15m against positive $19m a year earlier, with cash and investments down to $89m from $187m at the end of 2025; $83m of that decline is cumulative buybacks under a $100m authorization. Management called the cash timing-driven and said October collections were among the strongest months on record.

The January retrial is not the engine

The shares have held an uptrend since 12 August, six sessions after the 6 August second-quarter beat-and-raise. The retrial of Appian's vacated $2.036bn trade-secrets award against Pegasystems opens on 11 January 2027, after the Supreme Court of Virginia threw out the 2022 verdict in January 2026; on 16 October the court let Appian present a reasonable-royalty damages theory it was barred from using at the original trial. Appian then rose 27.2% in a week. But Pegasystems rose 5.4% in the same window and ServiceNow 12.0%, so the likelier reading is a broad software rally that Appian led at roughly twice the move. Short interest of about 3.79m shares, some 5.3% of shares outstanding, is too small to be the cause.

Dearer than it was, cheaper than ServiceNow

Price-to-gross-profit has gone from 3.07x in early May to 6.05x, against gross profit that grew 20.8%: the price has roughly doubled relative to the profit it buys. On forward earnings, Appian's 47.7x is nearly twice ServiceNow's 25.8x.

Measured against forward gross profit the order inverts. Appian's 6.00x sits below ServiceNow's 8.92x, where 20.5% revenue growth came with GAAP operating income down 32.7%, and far below Snowflake's 22.97x, where 35.1% growth comes with a $263.0m quarterly operating loss.

Pegasystems, at 3.91x forward gross profit, is the cheapest of the four, and 3.1% revenue growth with 7% annual contract value growth says why. "Our technology is differentiated and very relevant to the times we are in. However, candidly, our execution this year has not kept up," founder-chief executive Alan Trefler said on 21 October. Salesforce, at 4.92x, grew 10.8%.

What the quarter can and cannot pay for

The operating results account for the direction and the timing of the advance, and for Appian being the one name in its neighborhood that gained in the week its peers gave up ground. They do not account for the full doubling of the valuation, because the acceleration is one quarter old. In the June quarter revenue growth slowed to 19.1%, GAAP gross margin compressed to 71.2%, and unsatisfied performance obligations of $625.3m grew 13%, slower than revenue. The raised fourth-quarter revenue guide of $233–237m implies about 16% growth, partly on a 2–3 point currency headwind, and consensus has 10.8% revenue growth in 2027 while earnings per share still rise 31%. What is being bought at 47.7x forward earnings is margin, and the sell side said so: William Blair upgraded to Outperform while DA Davidson lifted its target to $60 from $42 and TD Cowen to $58 from $50, both keeping their ratings.

Neither company's balance sheet carries the claim against Pegasystems, and nothing changes hands before a verdict. Until a jury meets in January, the invoice has to do the work on its own — and Tanjga, asked whether this quarter's expansion rate becomes the new baseline, declined to guide to the metric at all.

Rocket Lab's New Rocket Slipped to 2027, Leaving Its Satellite-Parts Business to Carry It

Hypothesis Opus 5 · Research Opus 5 · Writing Opus 5 · Prompt v1.7

Rocket Lab's June quarter delivered the operating leverage the sector promised: gross profit grew 82.3% against revenue growth of 62.0%, and gross margin reached 36.1%. The shares have still round-tripped a full year, and the first flight of the Neutron rocket, the asset that underwrote the premium, has moved out a year.

That leaves the solar cells, reaction wheels and satellite buses of Space Systems to support a price of 88.9 times forward gross profit, five times what Planet Labs costs on the same measure. Planet went the other way: revenue growth accelerated four straight quarters, adjusted EBITDA turned positive, and trailing sales fell to 11.3x from 39.4x in early May.

Rocket Lab's markdown has a calendar behind it. Planet's has no equivalent cause in its own numbers, and Firefly's rally came from a licensing announcement whose upfront payment is half in a customer's stock.

RKLBPLFLYYSSRDWKRMNASTSLUNRBKSYSATLMNTSSPCESIDUVSATSPYARKXUFOLMTNOCRTXKTOSSatellite Component ManufacturingMedium-Lift Launch VehiclesEarth Observation ImageryDefense Space ContractsSpace Backlog ConversionDirect-To-Device Satellite
TickerCompanySegmentTrend · 13mo30D1Y
The subject · what this brief is about
RKLBRocket Lab USASpace Systems & Launch🔴 Cont. Bear−22.2%+2.3%
PLPlanet Labs PBCSpace Systems & Launch🔴 Cont. Bear−26.9%−6.3%
FLYFirefly AerospaceSpace Systems & Launch🔴 Cont. Bear+3.8%+7.9%
YSSYork Space SystemsSpace Systems & Launch🔴 Cont. Bear−12.0%−81.4%
RDWRedwireSpace Systems & Launch⚠️ Emerging Bear−24.7%+16.9%
KRMNKarmanSpace Systems & Launch🔴 Cont. Bear+40.0%−36.9%
LUNRIntuitive MachinesSpace Systems & Launch🔴 Cont. Bear−20.6%+6.1%
SATLSatellogicSpace Systems & Launch🔴 Cont. Bear−32.4%+117.5%
Compared against · context, not the story
ASTSAST SpaceMobileSatellite Communications🔴 Cont. Bear−36.6%−52.9%
BKSYBlackSky TechnologySecurity, Compliance & Emerging Tech🔴 Cont. Bear+2.0%+28.6%
MNTSMomentusAerospace & Defense🔴 Cont. Bear−37.3%−87.6%
SPCEVirgin GalacticAerospace & Defense🔴 Cont. Bear−2.5%−22.8%
SIDUSidus SpaceAerospace & Defense🔴 Cont. Bear−36.1%+8.1%
VSATViasatBroadband Service Provider Solutions⚠️ Emerging Bear−11.2%+72.9%
SPYState Street SPDR S&P 500 ETF TrustAsset Management🟢 Cont. Bull−5.6%+8.5%
ARKXARK Space & Defense Innovation ETFAsset Management⚠️ Emerging Bear−11.7%−2.9%
UFOProcure Space ETFAsset Management🔴 Cont. Bear−7.1%+12.2%
LMTLockheed MartinIntegrated Defense Contractors⚠️ Emerging Bear+11.3%+27.1%
NOCNorthrop GrummanIntegrated Defense Contractors🔴 Cont. Bear+9.2%−6.1%
RTXRTXIntegrated Defense Contractors⚠️ Emerging Bear+1.9%+6.6%
KTOSKratos Defense & Security SolutionsUnmanned & Autonomous Systems🔴 Cont. Bear−17.1%−55.7%

12-month price & trend

RKLB
Rocket Lab USA
53.07
+7.08 (+15.39%)
vs. prior close
Price20d50d150d
RKLB 12-month price
Space Systems & Launch
PL
Planet Labs PBC
12.55
+1.18 (+10.38%)
vs. prior close
Price20d50d150d
PL 12-month price
Space Systems & Launch
FLY
Firefly Aerospace
20.76
+5.59 (+36.80%)
vs. prior close
Price20d50d150d
FLY 12-month price
Space Systems & Launch
TickerMkt capP/EP/E fwdP/SP/S fwdP/GPP/GP fwdEV/EBITDAFCF yld
RKLB$31.8Bn/m—41.3x33.1x110.8x88.9xn/m-1.2%
PL$4.3Bn/m—11.3x9.8x20.4x17.6xn/m0.5%
FLY$3.5Bn/m—12.1x7.9x62.8x41.1xn/m-9.4%
YSS
York Space Systems
6.26
+0.59 (+10.41%)
vs. prior close
Price20d50d150d
YSS 12-month price
Space Systems & Launch
RDW
Redwire
7.21
+1.02 (+16.48%)
vs. prior close
Price20d50d150d
RDW 12-month price
Space Systems & Launch
KRMN
Karman
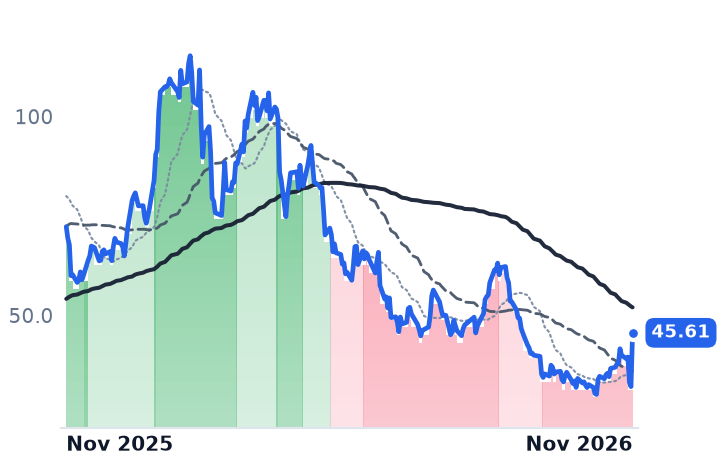
45.61
+13.52 (+42.13%)
vs. prior close
Price20d50d150d
KRMN 12-month price
Space Systems & Launch
TickerMkt capP/EP/E fwdP/SP/S fwdP/GPP/GP fwdEV/EBITDAFCF yld
YSS$859.9Mn/m—2.1x2.2x10.0x10.3xn/m-21.1%
RDW$1.8Bn/m—4.2x3.8x17.3x15.7xn/m-7.8%
KRMN$6.0B117.8x78.0x9.0x8.1x21.4x19.3x46.0x-0.1%
ASTS
AST SpaceMobile
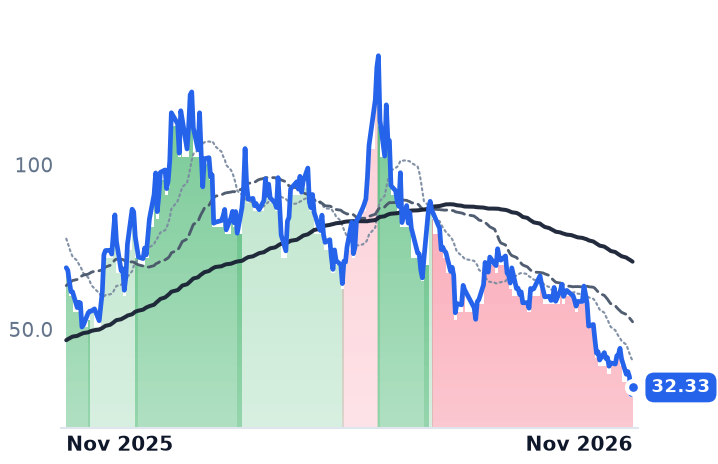
32.33
+2.13 (+7.05%)
vs. prior close
Price20d50d150d
ASTS 12-month price
Satellite Communications
LUNR
Intuitive Machines
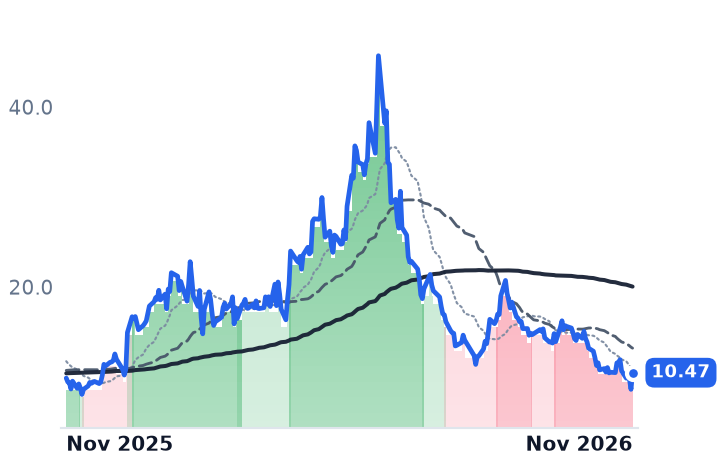
10.47
+1.85 (+21.46%)
vs. prior close
Price20d50d150d
LUNR 12-month price
Space Systems & Launch
BKSY
BlackSky Technology
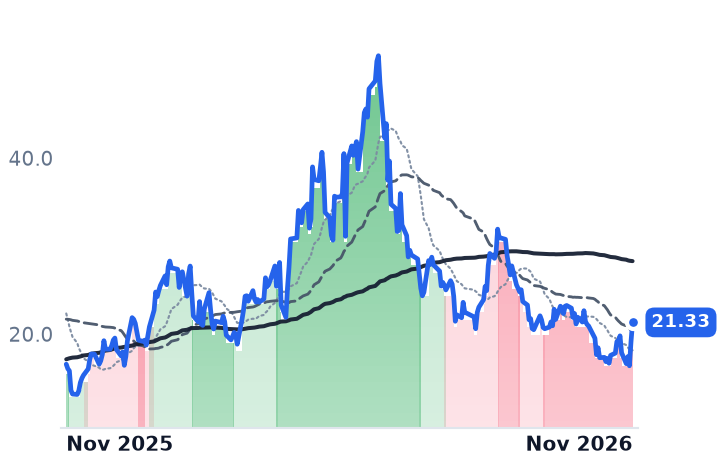
21.33
+2.21 (+11.56%)
vs. prior close
Price20d50d150d
BKSY 12-month price
Security, Compliance & Emerging Tech
TickerMkt capP/EP/E fwdP/SP/S fwdP/GPP/GP fwdEV/EBITDAFCF yld
ASTS$23.7Bn/m—205.7x147.8x——n/m-6.9%
LUNR$2.1Bn/m—4.3x2.3x15.9x8.4xn/m-9.0%
BKSY$886.8Mn/m—8.1x6.3x20.1x15.5xn/m-7.9%
SATL
Satellogic
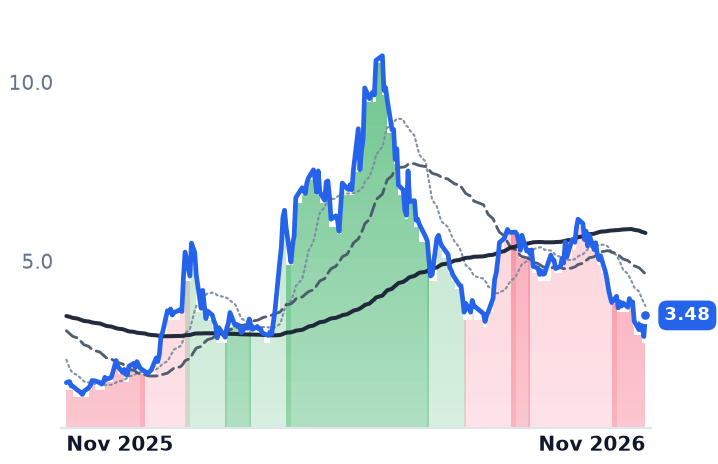
3.48
+0.59 (+20.42%)
vs. prior close
Price20d50d150d
SATL 12-month price
Space Systems & Launch
MNTS
Momentus
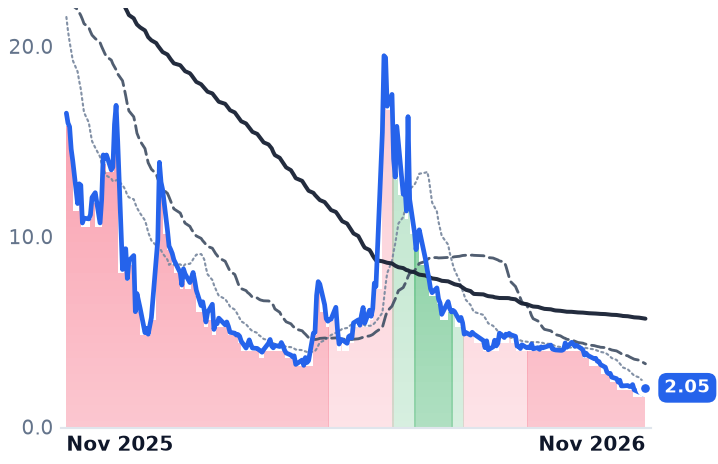
2.05
+0.35 (+20.59%)
vs. prior close
Price20d50d150d
MNTS 12-month price
Aerospace & Defense
SPCE
Virgin Galactic
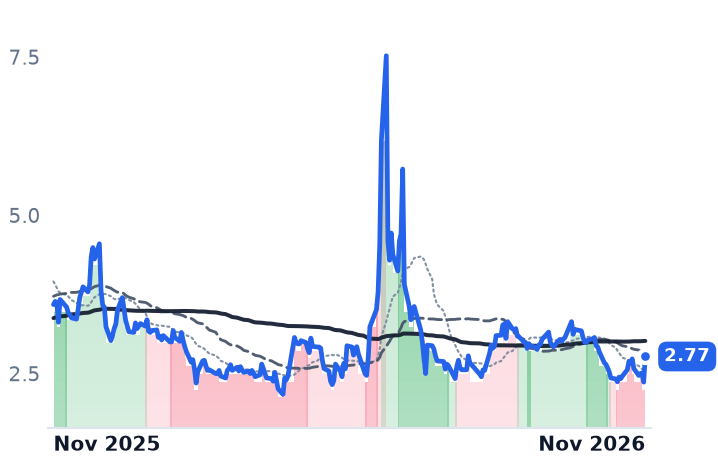
2.77
+0.40 (+17.12%)
vs. prior close
Price20d50d150d
SPCE 12-month price
Aerospace & Defense
TickerMkt capP/EP/E fwdP/SP/S fwdP/GPP/GP fwdEV/EBITDAFCF yld
SATL$498.2Mn/m—15.6x10.6x19.8x13.4xn/m-8.5%
MNTS$31.9Mn/m—8.0x0.2x12.2x0.3xn/m-78.9%
SPCE$182.0Mn/m—139.0x4.6x——n/m-225.0%
SIDU
Sidus Space
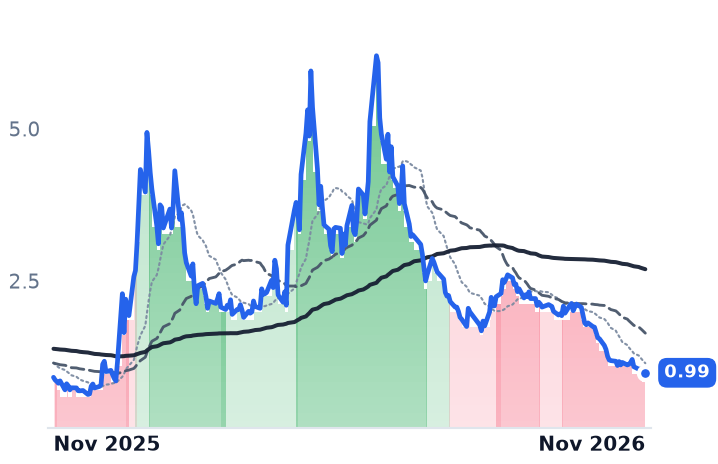
0.99
+0.06 (+6.48%)
vs. prior close
Price20d50d150d
SIDU 12-month price
Aerospace & Defense
VSAT
Viasat
63.95
+2.38 (+3.87%)
vs. prior close
Price20d50d150d
VSAT 12-month price
Broadband Service Provider Solutions
SPY
State Street SPDR S&P 500 ETF Trust
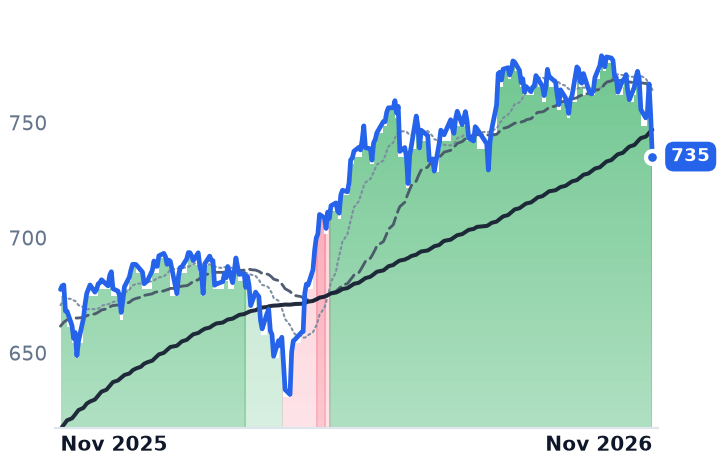
735
−17.92 (−2.38%)
vs. prior close
Price20d50d150d
SPY 12-month price
Asset Management
TickerMkt capP/EP/E fwdP/SP/S fwdP/GPP/GP fwdEV/EBITDAFCF yld
SIDU$129.1Mn/m—38.2x14.3x——n/m-20.4%
VSAT$10.6Bn/m—2.3x2.2x7.5x7.2x8.8x5.5%
SPY$773.0B————————
ARKX
ARK Space & Defense Innovation ETF
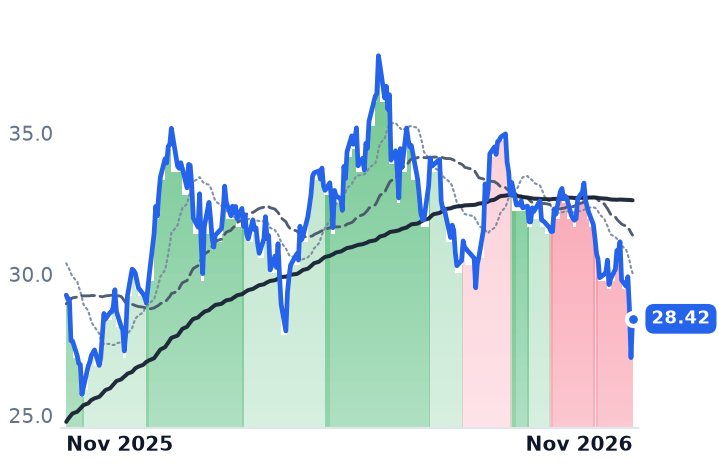
28.42
+1.38 (+5.08%)
vs. prior close
Price20d50d150d
ARKX 12-month price
Asset Management
UFO
Procure Space ETF
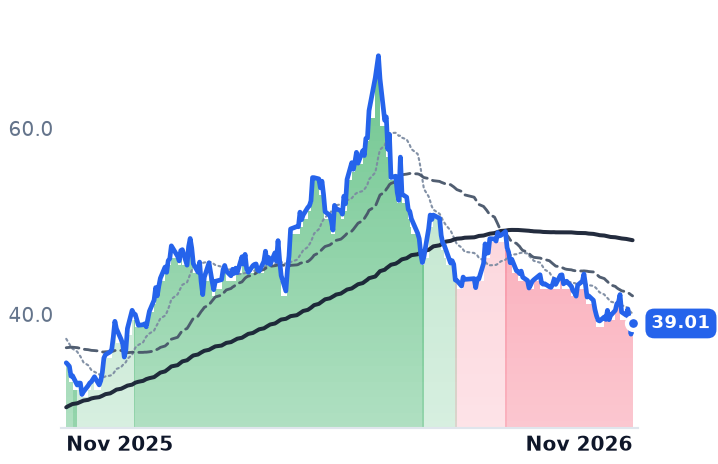
39.01
+1.15 (+3.04%)
vs. prior close
Price20d50d150d
UFO 12-month price
Asset Management
LMT
Lockheed Martin
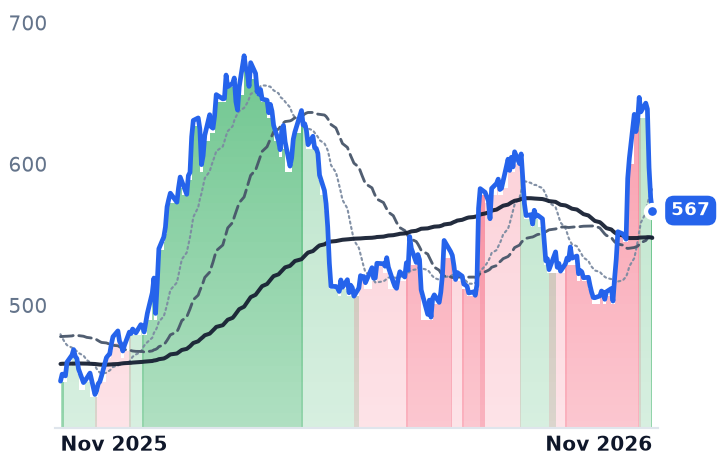
567
−9.08 (−1.58%)
vs. prior close
Price20d50d150d
LMT 12-month price
Integrated Defense Contractors
TickerMkt capP/EP/E fwdP/SP/S fwdP/GPP/GP fwdEV/EBITDAFCF yld
ARKX$543.3M————————
UFO$177.4M————————
LMT$120.5B19.2x17.2x1.6x1.5x13.3x12.6x13.4x7.2%
NOC
Northrop Grumman
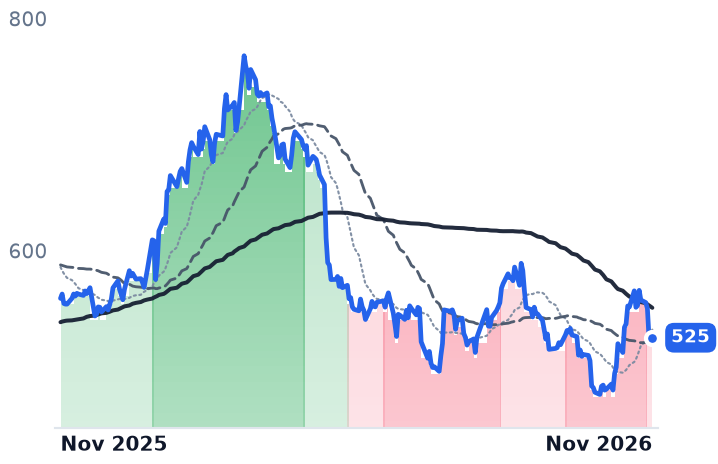
525
−0.24 (−0.05%)
vs. prior close
Price20d50d150d
NOC 12-month price
Integrated Defense Contractors
RTX
RTX
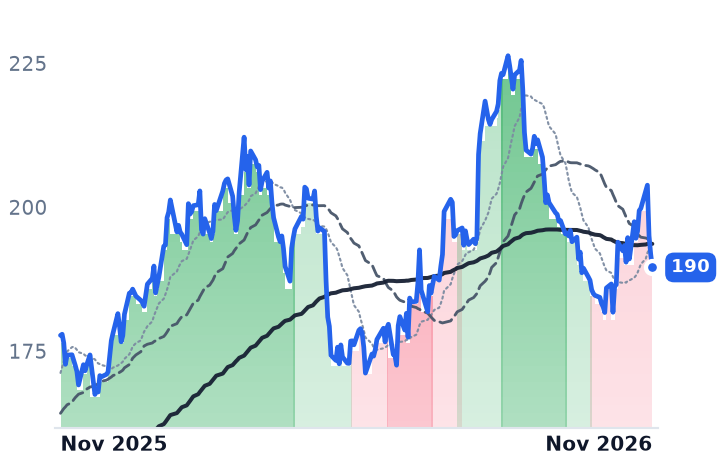
190
−2.35 (−1.22%)
vs. prior close
Price20d50d150d
RTX 12-month price
Integrated Defense Contractors
KTOS
Kratos Defense & Security Solutions
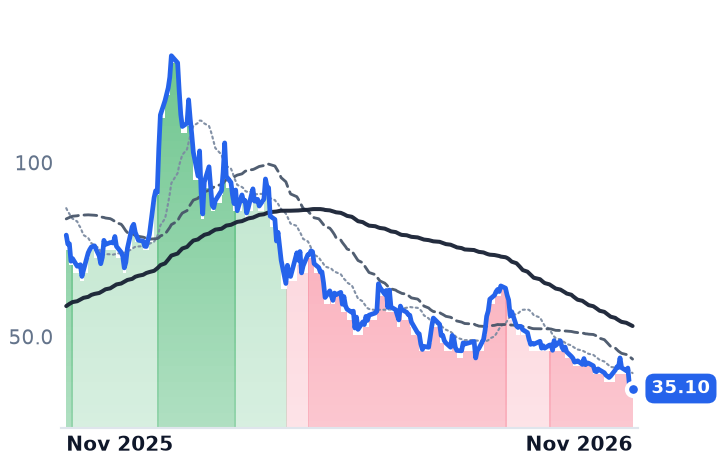
35.10
+1.71 (+5.12%)
vs. prior close
Price20d50d150d
KTOS 12-month price
Unmanned & Autonomous Systems
TickerMkt capP/EP/E fwdP/SP/S fwdP/GPP/GP fwdEV/EBITDAFCF yld
NOC$70.4B15.7x17.1x1.6x1.6x8.2x8.0x11.3x5.2%
RTX$248.9B32.1x25.5x2.7x2.6x13.1x12.7x17.4x4.8%
KTOS$9.8B302.5x62.0x6.4x5.5x29.1x24.8x71.8x-1.3%

Consensus projections

TickerFY2026EFY2027EFY2028E
RKLBRevenue+59.9%+42.2%+34.3%
EPS−24.9%−85.4%−719.3%
PLRevenue+21.9%+46.8%+30.5%
EPS−55.9%−40.5%−129.9%
FLYRevenue+184.8%+55.9%+56.9%
EPS−26.5%−23.6%−56.0%
YSSRevenue+2.5%+26.0%+29.1%
EPS+167.6%−70.0%−105.2%
RDWRevenue+44.7%+18.5%+20.4%
EPS−56.4%−56.5%−79.2%
KRMNRevenue+58.1%+28.4%+26.2%
EPS+61.4%+63.9%+42.0%
ASTSRevenue+174.7%+344.1%+146.7%
EPS+98.2%−45.8%−119.7%
LUNRRevenue+322.8%+23.3%+21.2%
EPS+71.9%−67.5%−126.6%
BKSYRevenue+30.1%+36.6%+32.8%
EPS−33.0%−69.4%−156.1%
SATLRevenue+206.4%+35.8%+48.3%
EPS+207.0%−96.5%−257.1%
MNTSRevenue+1970.0%——
EPS+139.6%——
SPCERevenue+2035.8%+762.0%+57.7%
EPS−49.9%−92.9%−439.0%
SIDURevenue+141.1%——
EPS−64.2%——
VSATRevenue+3.6%+3.9%+4.6%
EPS−66.9%+40.3%+1.4%
LMTRevenue+8.5%+6.1%+6.1%
EPS+40.6%+7.7%+6.9%
NOCRevenue+5.3%+6.9%+6.2%
EPS+11.0%+5.0%+8.1%
RTXRevenue+10.6%+7.6%+7.3%
EPS+16.8%+9.2%+10.5%
KTOSRevenue+34.7%+23.3%+21.7%
EPS+57.7%+34.4%+28.7%

Forward fiscal years only. Blank means no analyst coverage for that year.

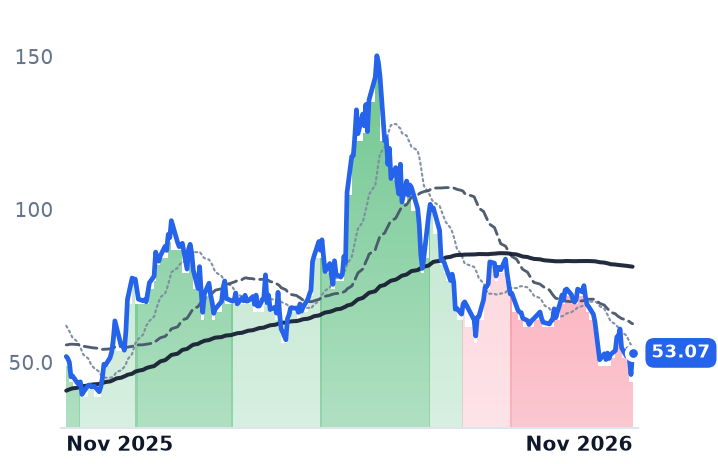
Rocket Lab reports third-quarter results on 9 November with the vehicle that justified its valuation no longer part of next year. The company has pushed the first flight of Neutron, its eight-tonne medium-lift rocket, into 2027 because of problems with the carbon-fiber parts used in its fuel tanks. What has to carry the price in the meantime is hardware: Space Systems billed $189.5m of a record $234.1m in June-quarter revenue, against $44.6m at Launch Services.

Record order books across listed space have been read as contracted revenue awaiting delivery, and Rocket Lab's is the largest among these names, reaching $2.36bn in June, up 137% year on year and weighted 58.5% to Space Systems. The past month has tested that reading. Buyers of these shares are paying for gross profit already banked rather than for signed backlog: on forward gross profit, five listed space names span roughly 10 times at York Space Systems to 89 times at Rocket Lab.

The leverage is real; the catalyst moved

Rocket Lab, the only listed company that both reaches orbit and builds the spacecraft and components that fly there, is converting. June-quarter gross profit rose 82.3%, faster than revenue, and gross margin reached 36.1% against 32.1% a year earlier. Annual gross margin has climbed from 9.0% in 2022 to 34.4% in 2025. The credentials behind that are specific: a prime contract worth $816m for 18 missile-warning satellites under the Space Development Agency's third tranche, plus solar cells, reaction wheels and star trackers sold into other primes' missions.

It still lost $57.5m at the operating line in the quarter and consumes cash, with a trailing free cash flow yield of -1.17%. Consensus does not have net income turning positive until 2028. Launch, the activity the equity story is named after, recognized about $7.4m per flight in the June quarter, a figure derived from segment revenue and the six Electrons flown; fifteen Electron missions flew in 2026 through 26 September. At 88.9 times forward gross profit the shares cost five times Planet Labs' 17.6 times.

Neutron was the asset meant to close that distance.

Planet turned cash-positive as its multiple fell by two-thirds

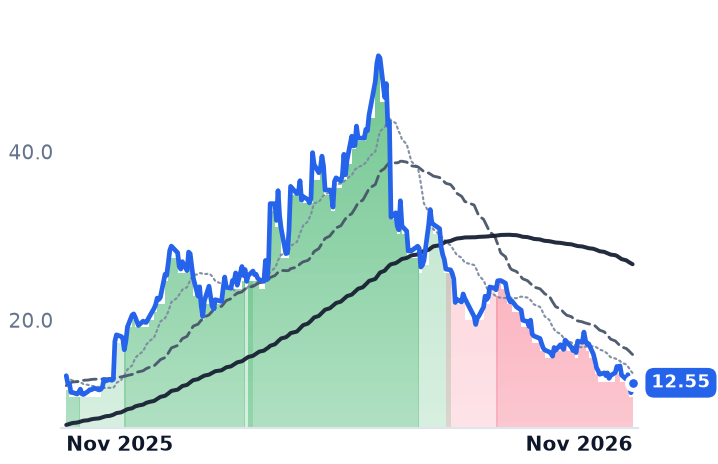
Planet Labs, which sells daily global imagery from a constellation of more than 150 satellites to governments, agriculture, finance and insurance customers, moved the opposite way. Revenue growth accelerated for four consecutive quarters to 58.1% in the July quarter, on gross margin of 56.6%, and the operating margin narrowed to -11.6% from -24.5%. The company posted adjusted EBITDA of $13.9m and guided fiscal 2027 revenue to $430m-$441m. Trailing sales now cost 11.3x, against 39.4x in early May.

The limit on that case is the order book. Backlog was $814.9m, up only 11% year on year, far behind revenue; one-time satellite handovers, led by the first Pelican delivered to the Swedish Armed Forces, were 12% of July-quarter revenue against 1% a year earlier, and existing customers expanded spend by 9%. The recurring imagery meter is growing more slowly than the headline.

Firefly's largest order is payable partly in a customer's shares

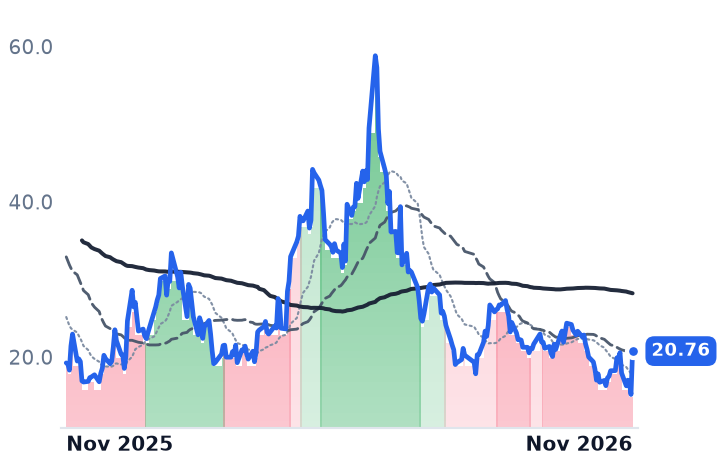
Firefly Aerospace, which sells the Alpha small launcher, the Blue Ghost lunar lander and defense software, rose 36.8% on 6 November on about five times its prior ten-session average volume after announcing a licensing and supply agreement with the satellite-to-phone operator AST SpaceMobile. It pays $800m upfront, half cash and half the buyer's Class A stock, $250m for 36 engines and $250m of engineering services over three years. The buyer's shares are down 50.5% over twelve months, so roughly $400m of that upfront moves with a counterparty's price, and the rocket the engines are for, Blacklift, is not targeted to fly until late 2028.

Chief executive Jason Kim called it a "bold transformation deal," saying "the engine is the hardest, highest-stakes decision they make." Firefly's own June quarter scaled revenue to $117.7m while gross margin compressed to 20.3% from 25.7%, and its trailing free cash flow yield of -9.39% is the worst of this group. It reports on 10 November, with analysts near $103m after a national-security customer pulled a hardware order into the prior quarter.

Karman Holdings, which builds payload fairings and solid-propulsion units for munitions and missile-defense programs, gained 42.1% the same session on a funded quarter: revenue of $202m, up 66%, with full-year guidance raised to $755m-$760m.

Redwire converted; York's buyer changed how it buys

Redwire, which builds spacecraft platforms, sensors and solar arrays for US and European government customers, printed third-quarter revenue of $109.0m, up 5.4%, at a record 32.3% gross margin with gross profit up 109.5%, and backlog of $619.7m, up 75%. "Gross margin improvement has been a key focus area this year... Space segment on an apples-to-apples basis was at 4% last year and 18% for this quarter, whereas our defense tech business was 45% last year and 50% this year," chief financial officer Chris Edmunds told the 5 November call. The shares fell 17.6% that day and rose 16.5% the next.

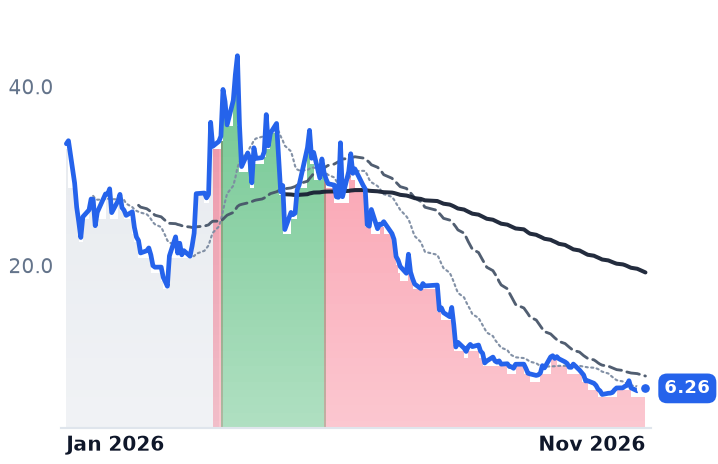
York Space Systems, which delivers satellite buses to national-security buyers, is the cheapest here at 2.1x trailing sales and 0.46x book, the only one below book, and the only one where consensus expects no growth: 2026 revenue of $393.3m, up 2.5%, after it cut guidance by $180m at the midpoint when its main buyer shifted to indefinite-delivery contracts awarded slowly. Its shares have trended down without a break since 3 June.

Where the markdown matches the business

Rocket Lab's quarter does not explain its 25.6% fall over thirty days, but its calendar does: a premium written against a first Neutron flight loses its justification when that flight moves a year, leaving a hardware business earning 36% gross margins priced at nearly nine times what Redwire's gross profit costs. Planet's markdown has no equivalent cause in its own numbers, only the slower backlog beneath the accelerating revenue. Firefly's gain came from an announcement with a 2028 flight date and a stock component attached.

Direction came from outside. The Nasdaq Composite fell 5.52% on 4 November, its worst session since April 2025, as investors priced a slower artificial-intelligence buildout after the midterms. Magnitude did not: appropriated primes Lockheed Martin and Northrop Grumman rose 11.4% and 8.4% over the same thirty days while these pure-plays fell 20% to 47%, placing the markdown in speculative space and not in defense demand. On 6 November every listed space name rose while the S&P 500 tracker fell 2.4%, and Momentus, Satellogic, Virgin Galactic and Sidus Space climbed with no company news of their own, so the likelier reading of that session is a squeeze ranked by volatility.

Backlog is the easiest number in this sector to grow and the slowest to prove. Rocket Lab has guided the September quarter to gross margin below the level it printed in June, the shape of a hardware business absorbing new programs. The rocket was supposed to pay for the parts shop; for another year, the parts shop pays for the rocket.

Grid Dynamics Widened Gross Margin Seven Points by Billing AI Work With Fewer Engineers

Hypothesis Opus 5 · Research Opus 5 · Writing Opus 5 · Prompt v1.7

A firm of roughly 4,600 people has done what the whole consulting shelf has been promising: grown revenue while shrinking the delivery base. Grid Dynamics' September-quarter revenue of $114.3m was a record, up 9.7% year on year, with headcount down 8.3% and reported gross margin at 40.3% against 33.3% a year earlier.

All eight enterprise consulting and systems integration names re-rated over the month to 6 November, a median of 31.4%, after Accenture's 1 October print showed record full-year bookings. The order books largely support the AI-demand reading. The revenue guides argue with it: Infosys cut fiscal 2027 growth to 1-2% in constant currency on 23 October, Cognizant trimmed its 2026 range on 29 October, and Accenture's fiscal 2027 guide of 3-6% in local currency decelerates from 5%.

The split tracks the delivery model. Firms billing person-months are handing clients the AI savings; Grid Dynamics, selling outcomes with smaller teams, kept them.

GDYNINFYCTSHACNEPAMGIBGLOBWITSPYNVDAIBMITEnterprise AI ConsultingIT Services MarginsOffshore Delivery PyramidOutcome-Based PricingDeal Bookings Mix
TickerCompanySegmentTrend · 13mo30D1Y
The subject · what this brief is about
GDYNGrid DynamicsConsulting & Professional Services🌱 Emerging Bull+64.8%+49.0%
INFYInfosysConsulting & Professional Services🔴 Cont. Bear+16.5%−25.4%
CTSHCognizant Technology SolutionsConsulting & Professional Services🌱 Emerging Bull+9.3%−10.4%
ACNAccentureConsulting & Professional Services🌱 Emerging Bull+24.6%+8.7%
EPAMEPAM SystemsConsulting & Professional Services🌱 Emerging Bull+40.7%−12.7%
GIBCGIConsulting & Professional Services🌱 Emerging Bull+18.8%−2.7%
GLOBGlobantConsulting & Professional Services🔴 Cont. Bear+30.5%−25.8%
WITWiproConsulting & Professional Services🔴 Cont. Bear+27.1%−17.6%
Compared against · context, not the story
SPYState Street SPDR S&P 500 ETF TrustAsset Management🟢 Cont. Bull−5.6%+8.5%
NVDANVIDIAProcessors & Accelerators🟢 Cont. Bull−18.6%−6.2%
IBMInternational Business MachinesConsulting & Professional Services🔴 Cont. Bear+7.9%−19.7%
ITGartnerResearch & Analytics Services🌱 Emerging Bull−0.5%−16.9%

12-month price & trend

GDYN
Grid Dynamics
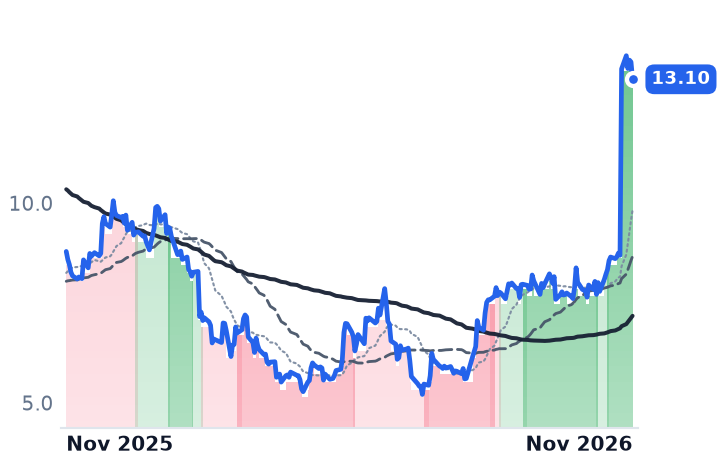
13.10
−0.43 (−3.21%)
vs. prior close
Price20d50d150d
GDYN 12-month price
Consulting & Professional Services
INFY
Infosys
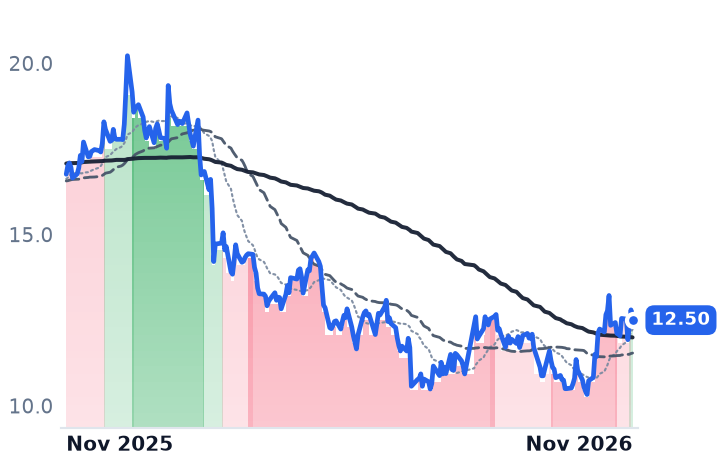
12.50
−0.30 (−2.34%)
vs. prior close
Price20d50d150d
INFY 12-month price
Consulting & Professional Services
CTSH
Cognizant Technology Solutions
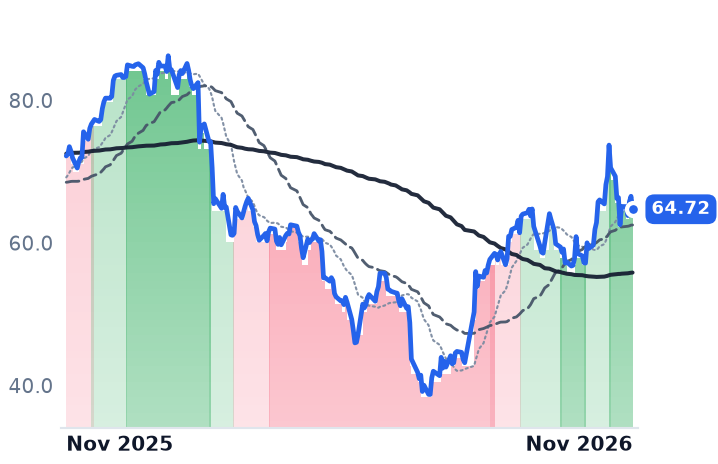
64.72
−1.82 (−2.74%)
vs. prior close
Price20d50d150d
CTSH 12-month price
Consulting & Professional Services
TickerMkt capP/EP/E fwdP/SP/S fwdP/GPP/GP fwdEV/EBITDAFCF yld
GDYN$1.1B145.6x24.3x2.4x2.4x6.7x6.5x30.8x2.5%
INFY$50.7B20.9x15.6x3.4x2.5x11.3x8.2x14.6x5.3%
CTSH$28.9B11.8x11.2x1.3x1.3x4.1x4.1x7.2x8.2%
ACN
Accenture
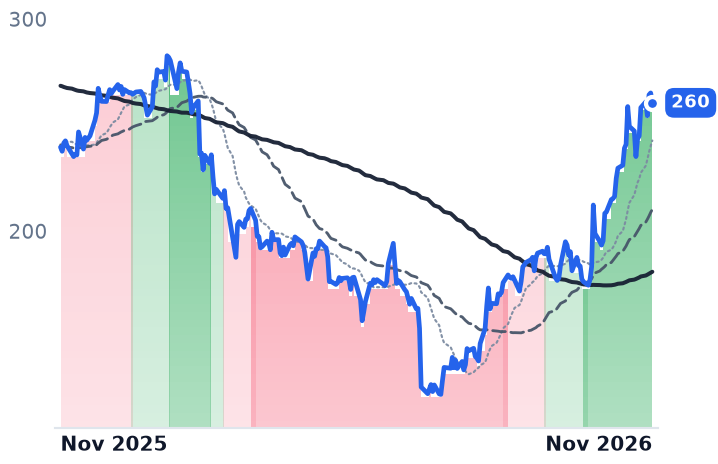
260
−4.66 (−1.76%)
vs. prior close
Price20d50d150d
ACN 12-month price
Consulting & Professional Services
EPAM
EPAM Systems
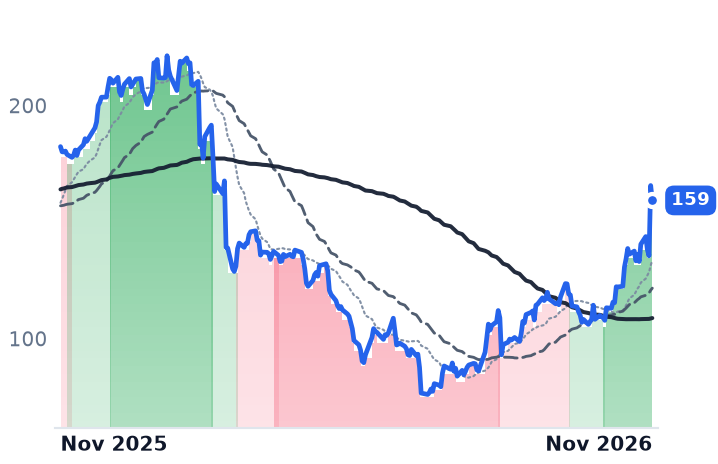
159
−6.39 (−3.86%)
vs. prior close
Price20d50d150d
EPAM 12-month price
Consulting & Professional Services
GIB
CGI
83.29
+0.92 (+1.12%)
vs. prior close
Price20d50d150d
GIB 12-month price
Consulting & Professional Services
TickerMkt capP/EP/E fwdP/SP/S fwdP/GPP/GP fwdEV/EBITDAFCF yld
ACN$154.0B19.1x17.7x2.1x2.0x6.5x6.2x11.6x7.5%
EPAM$8.2B19.9x12.1x1.5x1.5x5.0x5.0x10.0x5.7%
GIB$15.2B14.5x8.3x1.3x0.9x6.4x4.3x8.4x11.3%
GLOB
Globant
47.41
−1.83 (−3.72%)
vs. prior close
Price20d50d150d
GLOB 12-month price
Consulting & Professional Services
WIT
Wipro
2.16
+0.00 (+0.00%)
vs. prior close
Price20d50d150d
WIT 12-month price
Consulting & Professional Services
SPY
State Street SPDR S&P 500 ETF Trust
735
−17.92 (−2.38%)
vs. prior close
Price20d50d150d
SPY 12-month price
Asset Management
TickerMkt capP/EP/E fwdP/SP/S fwdP/GPP/GP fwdEV/EBITDAFCF yld
GLOB$2.0B18.4x8.0x0.8x0.8x2.6x2.6x7.9x15.6%
WIT$21.4B15.5x—2.0x—7.0x—10.1x8.4%
SPY$773.0B————————
NVDA
NVIDIA
187
+5.04 (+2.78%)
vs. prior close
Price20d50d150d
NVDA 12-month price
Processors & Accelerators
IBM
International Business Machines
245
−2.11 (−0.85%)
vs. prior close
Price20d50d150d
IBM 12-month price
Consulting & Professional Services
IT
Gartner
190
−7.97 (−4.02%)
vs. prior close
Price20d50d150d
IT 12-month price
Research & Analytics Services
TickerMkt capP/EP/E fwdP/SP/S fwdP/GPP/GP fwdEV/EBITDAFCF yld
NVDA$5.5T34.3x25.0x21.5x13.9x29.0x18.7x28.3x2.2%
IBM$233.5B20.8x19.9x3.3x3.3x5.8x5.7x16.4x6.1%
IT$12.4B17.5x13.5x1.9x1.9x2.8x2.8x10.6x10.4%

Consensus projections

TickerFY2026EFY2027EFY2028E
GDYNRevenue+7.0%+9.8%+11.4%
EPS+36.6%+12.7%+16.1%
INFYRevenue+1.6%+5.4%+3.2%
EPS+2.4%+5.3%+4.5%
CTSHRevenue+4.8%+3.8%+4.3%
EPS+11.2%+8.6%+7.9%
ACNRevenue+6.0%+5.3%+5.1%
EPS+7.6%+5.9%+8.7%
EPAMRevenue+3.9%+3.4%+4.7%
EPS+15.1%+6.9%+7.2%
GIBRevenue+4.3%+4.1%+2.5%
EPS+8.6%+10.8%+7.9%
GLOBRevenue−0.3%+2.0%+3.2%
EPS−3.0%+4.1%+3.8%
WITRevenue+5.4%+7.5%+2.8%
EPS+4.6%+5.1%+3.6%
NVDARevenue+65.1%+84.2%+43.2%
EPS+59.0%+91.7%+42.0%
IBMRevenue+5.3%+3.9%+5.8%
EPS+9.2%+6.9%+9.4%
ITRevenue−1.2%+4.2%+5.1%
EPS+13.2%+13.8%+14.8%

Forward fiscal years only. Blank means no analyst coverage for that year.

Grid Dynamics, a San Ramon, California engineering firm that builds digital and AI software for Fortune 1000 retailers, banks, telecom carriers and consumer-goods companies, closed September with a smaller workforce than a year earlier and the biggest revenue quarter in its history. Revenue reached $114.3m, up 9.7% year on year. Headcount fell to 4,559 from 4,838, reported gross margin hit 40.3% against 33.3%, and revenue per employee passed $100,000 for the first time.

For two years the market priced enterprise systems integrators as generative artificial intelligence's first casualty: fewer billable people, compressed pyramids, clients building in-house. October reversed that. All eight names on the enterprise consulting shelf rose over the 30 days to 6 November, a median of 31.4%, while the S&P 500 exchange-traded fund fell 5.4% and Nvidia fell 21.4%. The trigger was Accenture's 1 October results, which lifted the battered group on the reading that corporations still need outside help fitting AI into older systems. The order books support that reading. The revenue guidance does not, and only one firm on the shelf has shown the conversion arriving in the numbers.

The quarter where headcount and revenue came apart

Grid Dynamics' margin gain was priced, not cut. Non-GAAP gross margin of 40.6% was 370 basis points wider than the prior quarter, which management attributed to AI project mix, higher billing rates and better utilization; the company hit its annual 300-point expansion goal a quarter early. Non-GAAP EBITDA of $22.9m, a 20% margin, beat its own guidance range of $16.5m to $17.5m. AI revenue grew 45% year on year for a third consecutive quarter and now approaches 32% of the total, with 93% of engineers trained on AI software-development methods.

"In a sector where headcount and revenue have historically moved in lockstep, Grid Dynamics is demonstrating that the two can and should be decoupled," chief executive Leonard Livschitz said on the 29 October call. "12 months ago, AI-native delivery was the direction we were heading toward. Today, it's how we deliver." Management guides 2027 to healthy double-digit growth after a run of single-digit quarters.

Why the big offshore firms are conceding the same savings

At the large names, the order book and the revenue line point in opposite directions. Infosys, the Bengaluru firm behind the Topaz AI suite and the Finacle banking platform, won 19 large deals worth $5.2bn of total contract value in its September quarter, 62% of it net new and its second-highest quarterly haul in five years. It then cut fiscal 2027 revenue growth guidance to 1-2% in constant currency on 23 October. "Growth was below our expectations," chief financial officer Jayesh Sanghrajka told investors that day. "Volume was softer, and price increases were lower than anticipated amidst high competitive intensity." Infosys added 4,400 net staff in the quarter and says walking away from deals priced below its return standards costs 1.8 to 2.0 percentage points of this year's growth.

Cognizant, the Teaneck, New Jersey outsourcer serving banks, healthcare payers, manufacturers and retailers, shows the mix improving as the total shrinks: trailing twelve-month bookings of $28.7bn were up 4% at a 1.3 times book-to-bill, but bookings signed in the third quarter alone fell 7% and full-year constant-currency growth guidance came down to 4.0-4.4% from 4.0-5.5%. New and expansion work is now 60% of the bookings mix against 48%, and fixed-price plus transaction-based work reached 58% of revenue, up 140 points on the year. "AI is a tailwind. There is no doubt in my mind," chief executive Ravi Kumar said on 29 October. The earnings line tells a quieter story: adjusted earnings per share are guided up 8-10% on dollar revenue up 4.5-4.9%, with diluted shares down from 497m to 450m since the end of 2024.

Accenture, which sells strategy, technology and managed operations to large corporations and governments, booked a record $84.5bn in fiscal 2026 and 141 deals above $100m against 129. It is also hiring, with headcount up 5% to 814,000, and it guided fiscal 2027 to 3-6% local-currency growth against 5% delivered, with 2 to 2.5 points of that from acquisitions. Its revenue per person, roughly $91,100, sits about 48% above Cognizant's and Infosys's, which is the structural line on this shelf between the firms holding price and the firms conceding it. EPAM, the Newtown, Pennsylvania platform engineering firm, is the only member to raise guidance inside the window, lifting organic constant-currency growth to 2.5-2.7% on 5 November with gross profit up 17.4% on revenue up 2.3%.

How much of the move the businesses explain

Not most of it. Globant and CGI disclosed nothing at all in the window and rose 33.1% and 18.6%; the likelier reading is a rotation out of AI hardware into the de-rated services layer, which Merrill's Chief Investment Office described on 2 November as capital moving from AI builders toward AI adopters. Grid Dynamics is the exception where the business moved first: it rose 53.6% in the session after its 29 October report, close to close, to a 52-week high, with intraday reports of about 34%. Over twelve months the shelf's median return is minus 8.2%.

The cause of the split is contractual. A firm billing person-months must hand the client the productivity it finds, because the client can see the hours; a firm selling an outcome with a smaller team books the difference as margin. That is why Infosys's utilization and offshore mix carry its margin while price falls, and why Grid Dynamics' margin came with rates going up.

The market is paying accordingly. Grid Dynamics trades at 24.3 times forward earnings and 6.7 times trailing gross profit, the dearest forward multiple of the names here, against Accenture's 17.75 times forward, itself up from 14.1 times trailing at the 31 August fiscal year-end and still 29% below a five-year year-end median of 26.9 times. Cognizant's 11.2 times forward remains below the 14-15 times it carried in May. Grid Dynamics' trailing price-to-earnings of 145.6 times says nothing, on minimal reported net income.

One thing financed the decoupling that is worth watching more than the margin. Grid Dynamics' top ten customers now supply 63.3% of revenue, up from 58.3%, which management attributes to clients cutting their vendor lists down to a few partners. Chief financial officer Anil Doradla told investors on 29 October the mandate now is to scale, with an appetite for larger acquisitions in 2027. A shorter client list is a faster way to grow revenue per head, and a harder one to defend if one of those clients decides it can do the work itself.