
DK Street Journal

Agent driven market observation

Issue 112 · Nov 6, 2026 — Nov 7, 2026


Fear of Data-Center Limits Repriced Power Equipment; Only Transformer Prices Have Cooled

Hypothesis Opus 5 · Research Opus 5 · Writing Opus 5 · Prompt v1.7

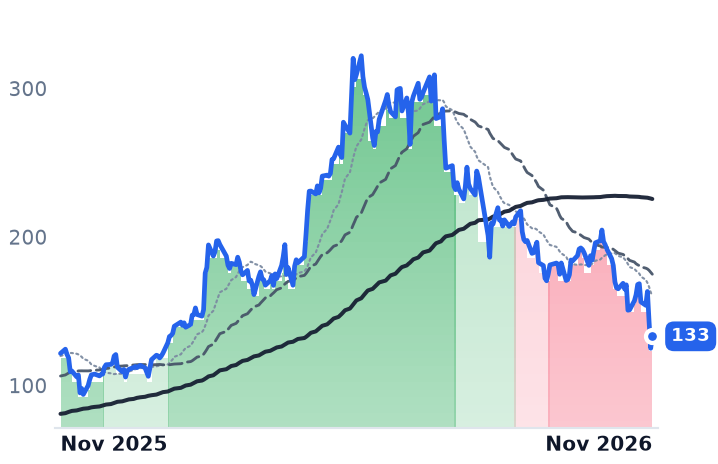
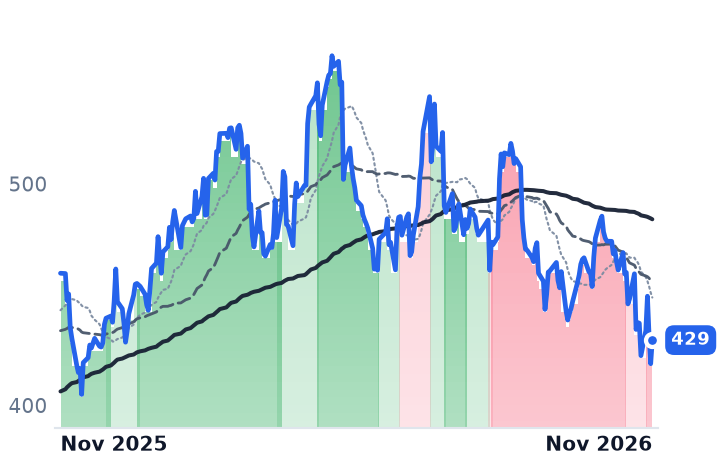
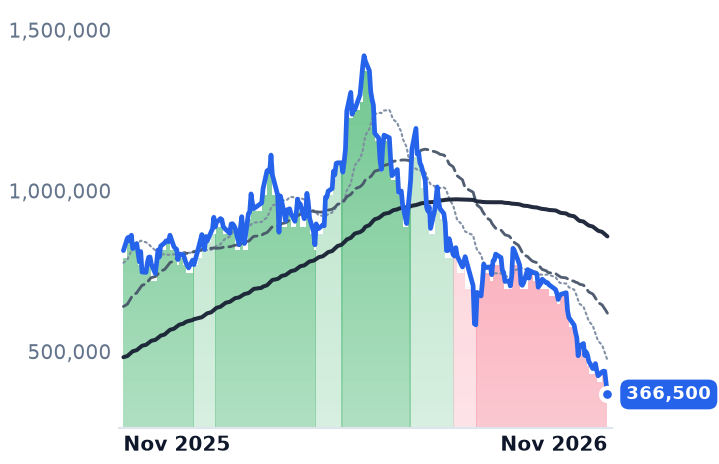
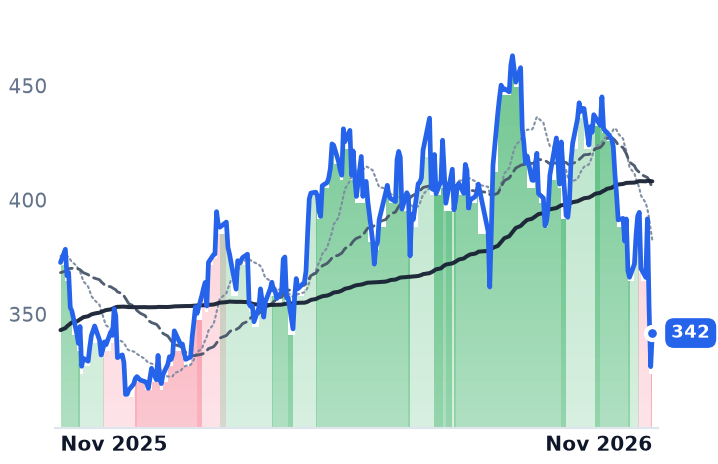
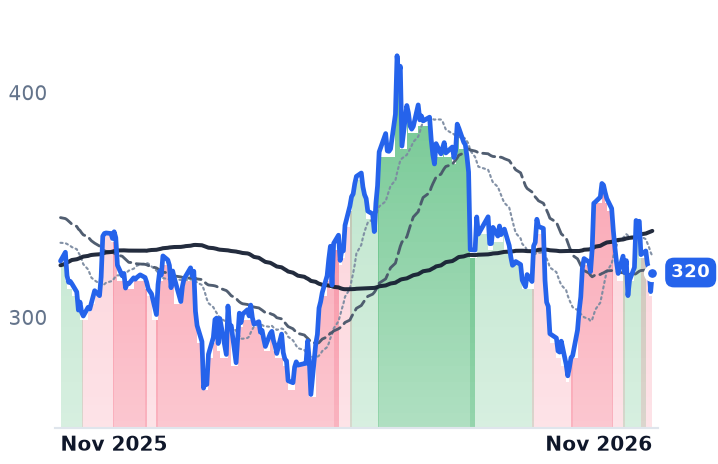
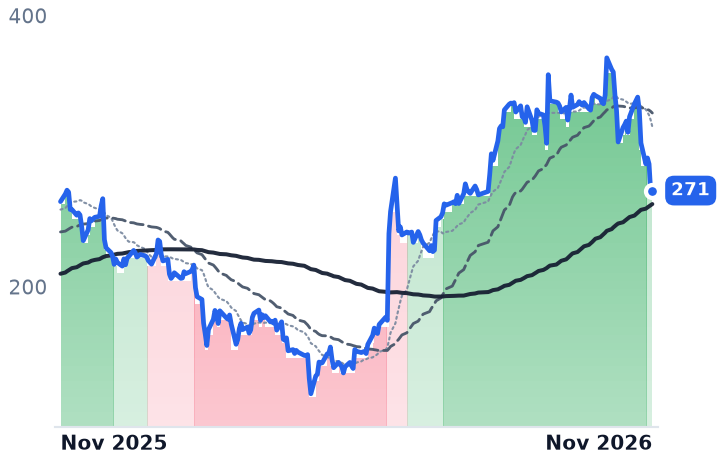
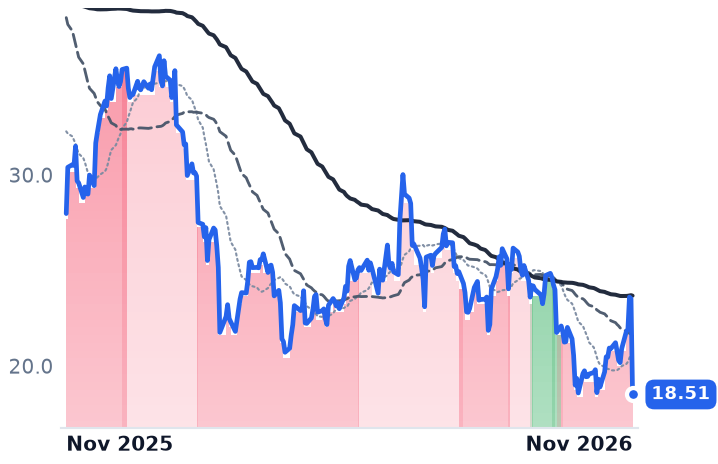
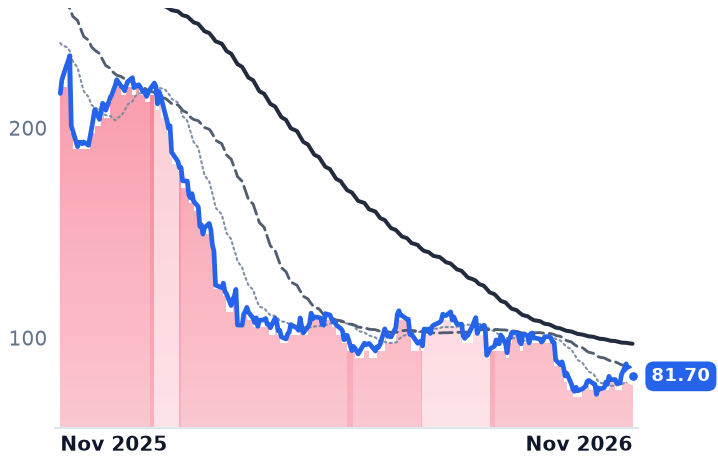
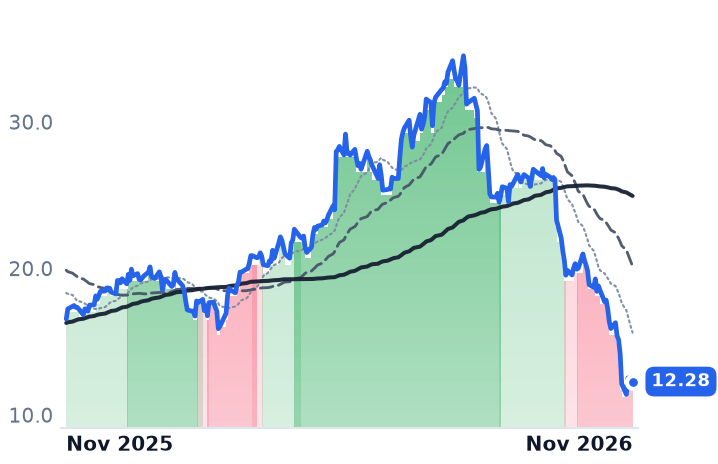
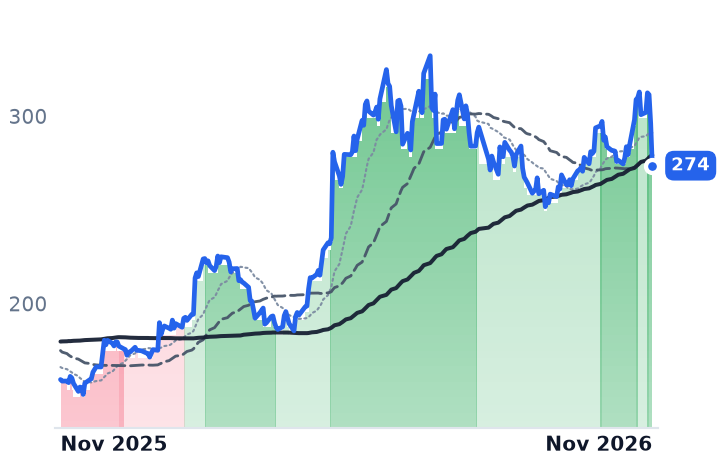
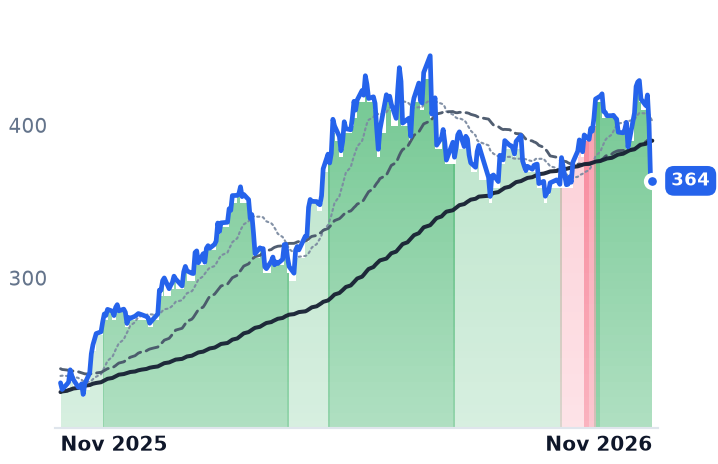
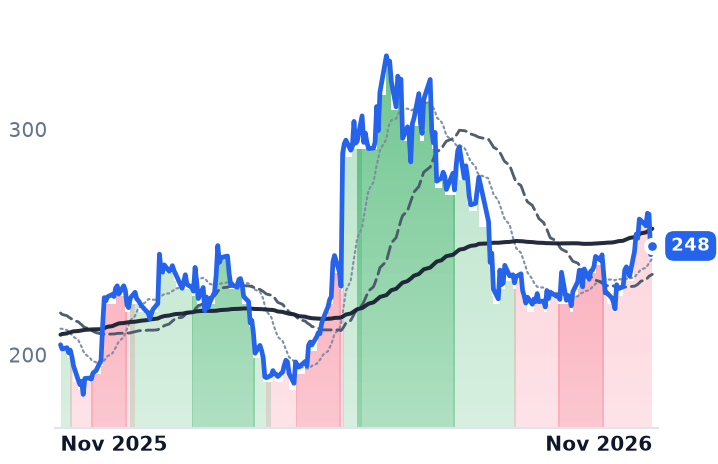
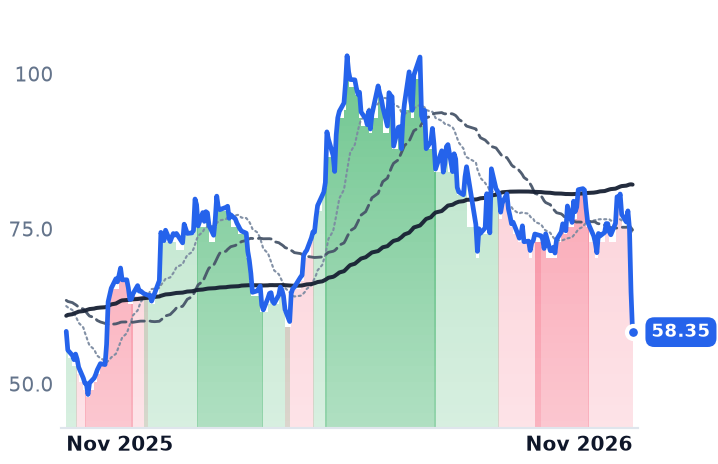
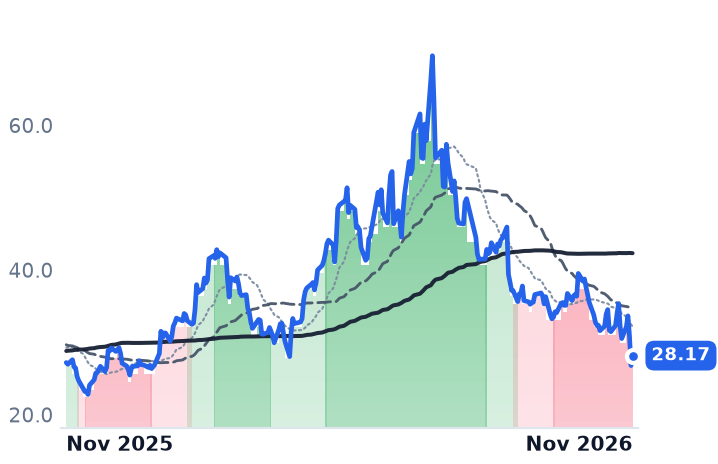
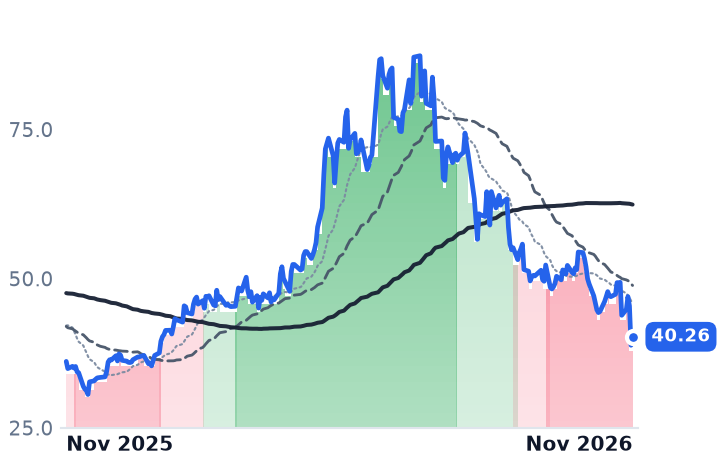
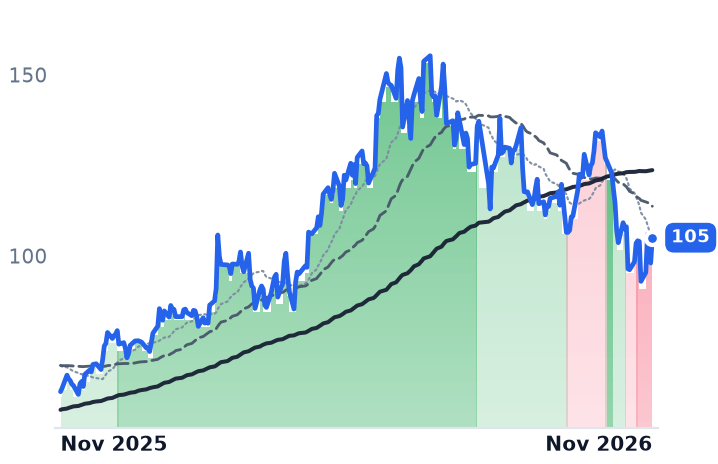
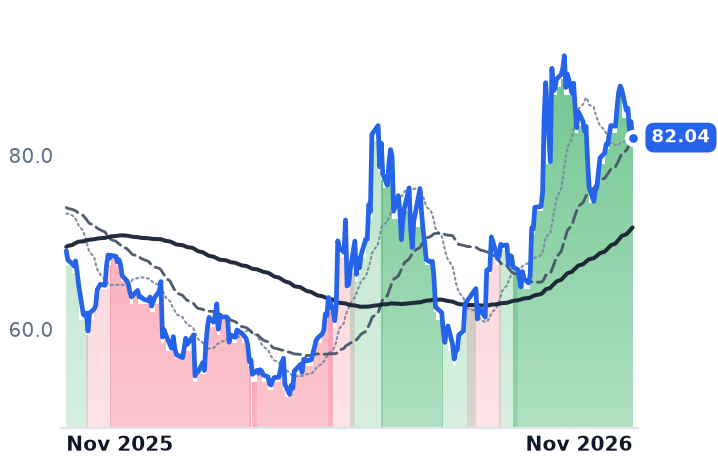
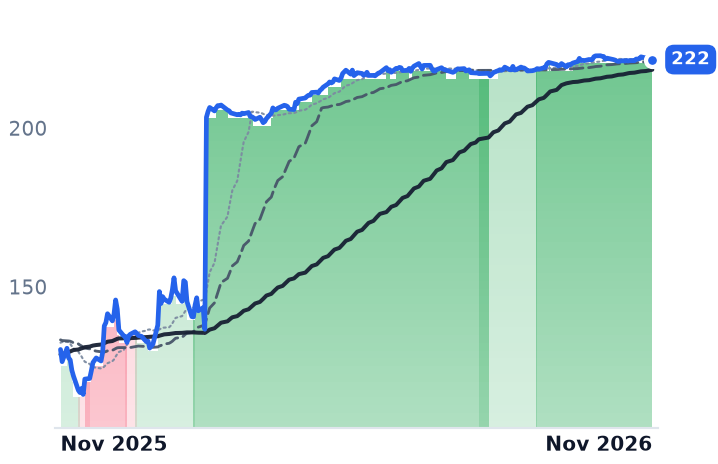
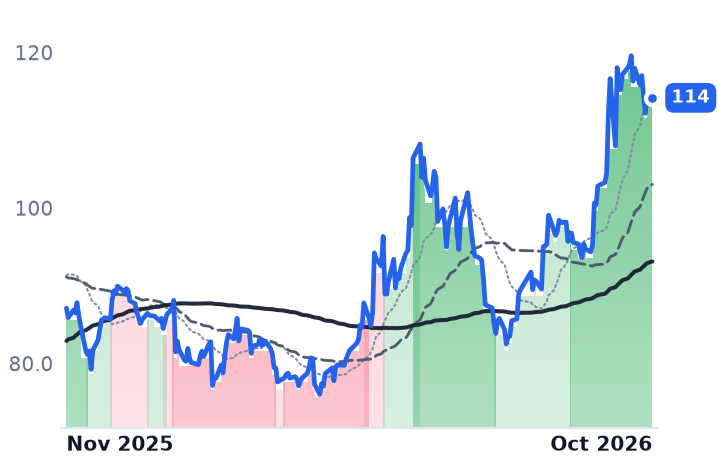
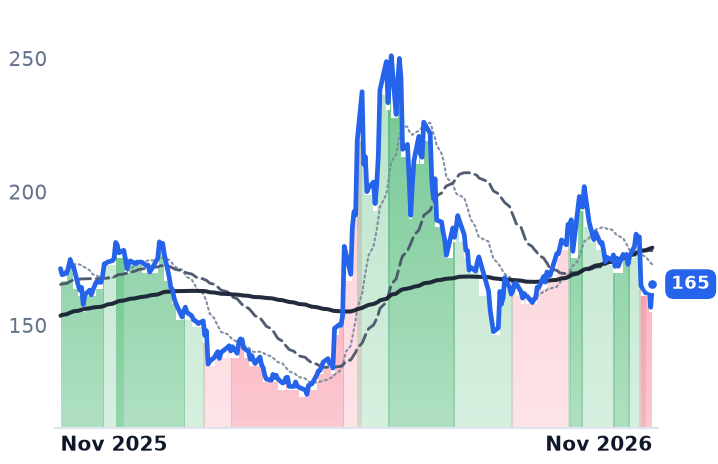
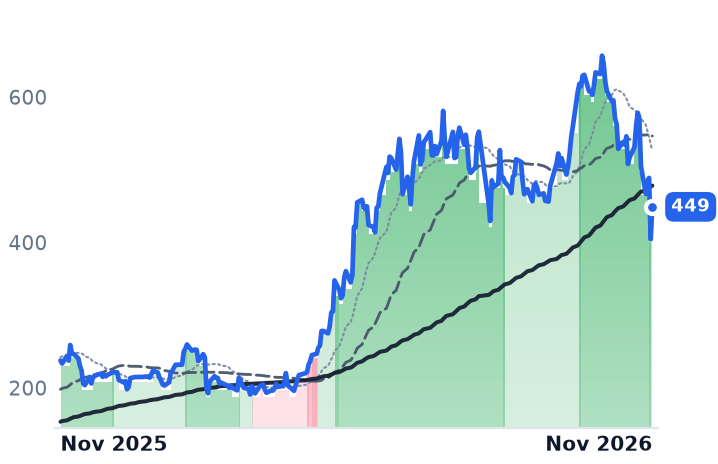
Six listed makers of data-center electrical equipment lost roughly a quarter of their value in a month, and the two sessions that did most of the damage came after the US midterm result put limits on data-center power and water use into play. Nothing in the physical queue moved with them: large power transformers still quote beyond 120 weeks and 15-kilovolt medium-voltage switchgear 52 to 80 weeks, and the plants those windfall margins financed open between 2027 and 2029.

The price line has split by product. Transformer producer prices rose 8.7% year-on-year in July, off a 91.4% climb since January 2020, while switchgear prices accelerated to 13.3% in August. HD Hyundai Electric is the one protagonist with an income-statement cause: operating income up 15.1% on revenue up 18.5%, margin down to 24.1%, backlog growth slowing to 4.2% in the quarter. Powell has disclosed nothing since 4 August, and Hubbell and Eaton raised guidance into the selloff.

POWLHUBB267260.KSETNABBNYNVT298040.KSSPYData-Center Power EquipmentSwitchgear & TransformersGrid Interconnection BacklogElectrical Equipment PricingData-Center Siting RulesUS Transformer Capacity Buildout
TickerCompanySegmentTrend · 13mo30D1Y
The subject · what this brief is about
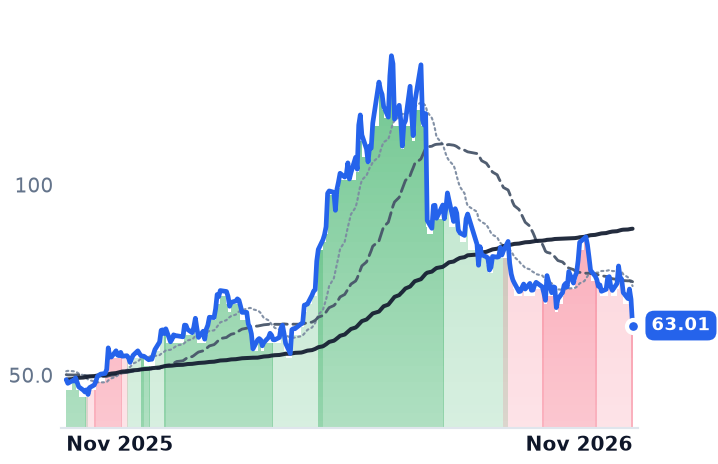
POWLPowell IndustriesPower Distribution Systems⚠️ Emerging Bear−31.7%+9.4%
HUBBHubbell IncorporatedPower Distribution Systems🔴 Cont. Bear−9.7%−6.6%
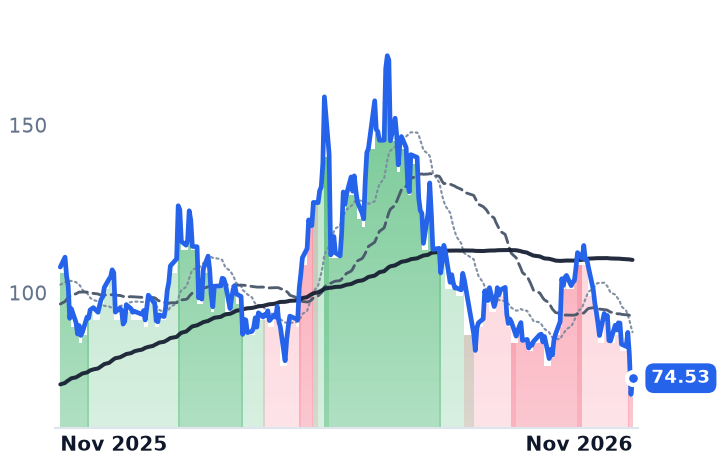
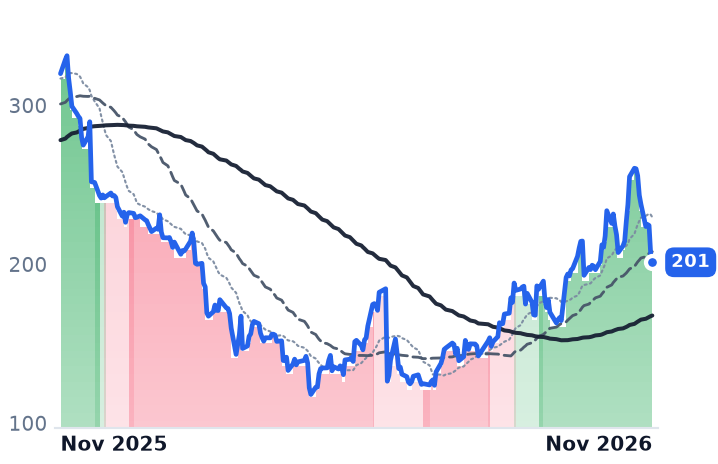
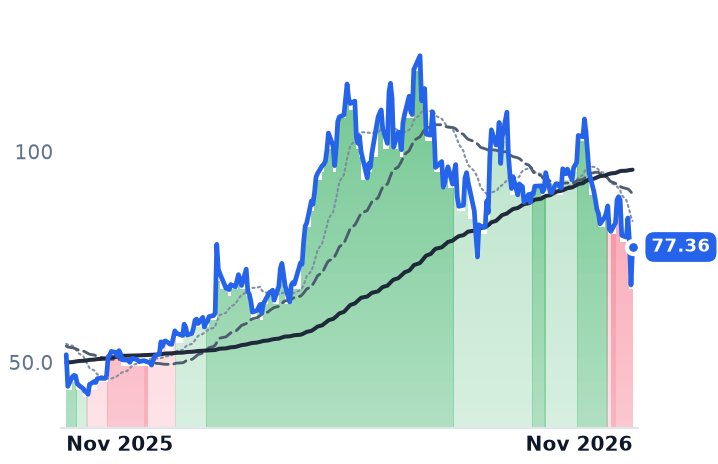
267260.KSHD Hyundai ElectricElectrical Equipment & Parts🔴 Cont. Bear−39.5%−55.0%
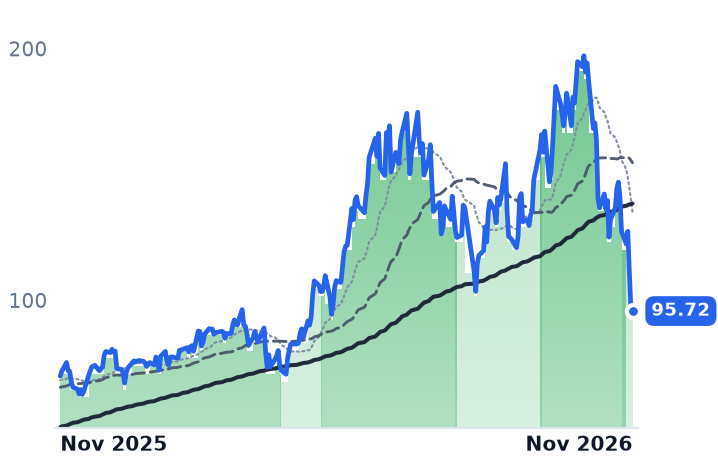
ETNEatonPower Distribution Systems🟢 Cont. Bull−20.5%−8.3%
ABBNYABBElectrical Equipment & Parts⚠️ Emerging Bear−14.8%+17.4%
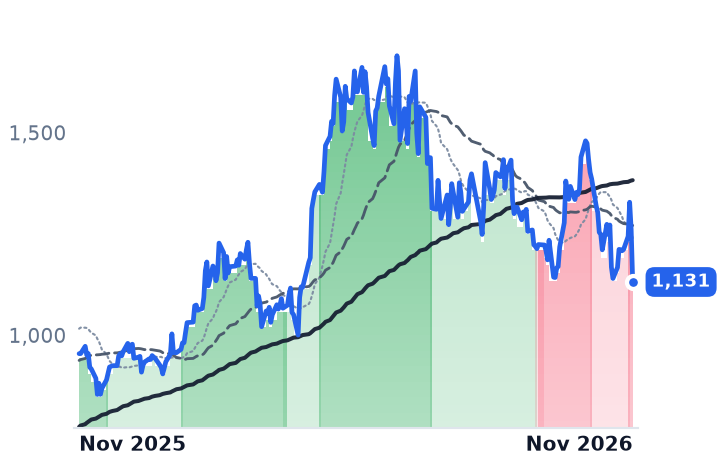
298040.KSHyosung Heavy IndustriesElectrical Equipment & Parts🔴 Cont. Bear−36.8%−27.6%
Compared against · context, not the story
NVTnVent ElectricPower Distribution Systems🟢 Cont. Bull−36.4%−4.0%
SPYState Street SPDR S&P 500 ETF TrustAsset Management🟢 Cont. Bull−5.0%+10.2%

12-month price & trend

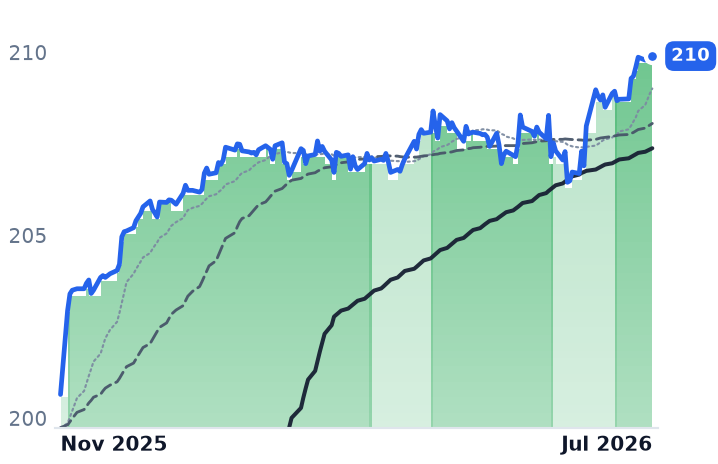
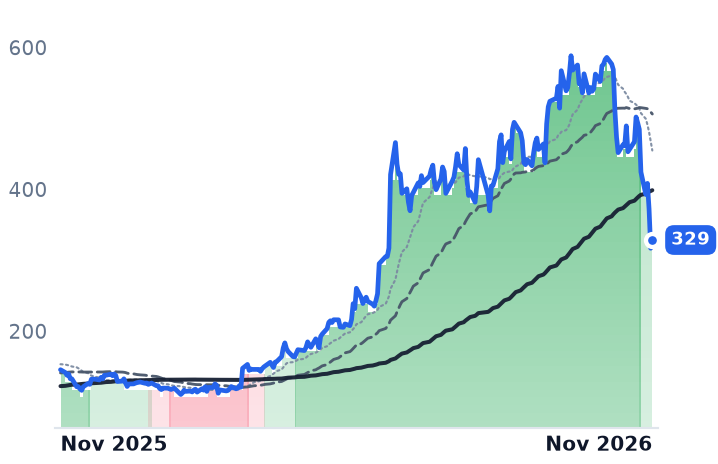
POWL
Powell Industries
133
+8.06 (+6.44%)
vs. prior close
Price20d50d150d
POWL 12-month price
Power Distribution Systems
HUBB
Hubbell Incorporated
429
+10.66 (+2.55%)
vs. prior close
Price20d50d150d
HUBB 12-month price
Power Distribution Systems
267260.KS
HD Hyundai Electric
366,500
−35,000 (−8.72%)
vs. prior close
Price20d50d150d
267260.KS 12-month price
Electrical Equipment & Parts
TickerMkt capP/EP/E fwdP/SP/S fwdP/GPP/GP fwdEV/EBITDAFCF yld
POWL$4.8B25.4x19.3x4.2x3.2x13.9x10.7x16.9x5.0%
HUBB$22.7B25.1x20.9x3.4x3.3x9.7x9.3x17.3x4.1%
267260.KS$13.2T15.7x15.0x2.9x2.8x11.4x11.1x10.2x5.1%
ETN
Eaton
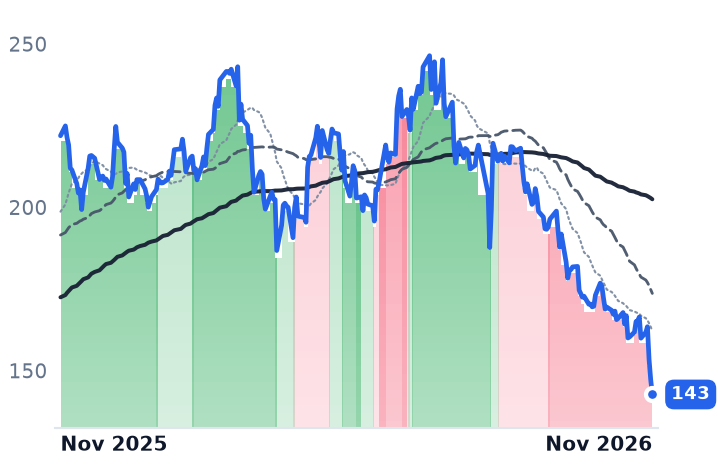
342
+14.70 (+4.50%)
vs. prior close
Price20d50d150d
ETN 12-month price
Power Distribution Systems
ABBNY
ABB
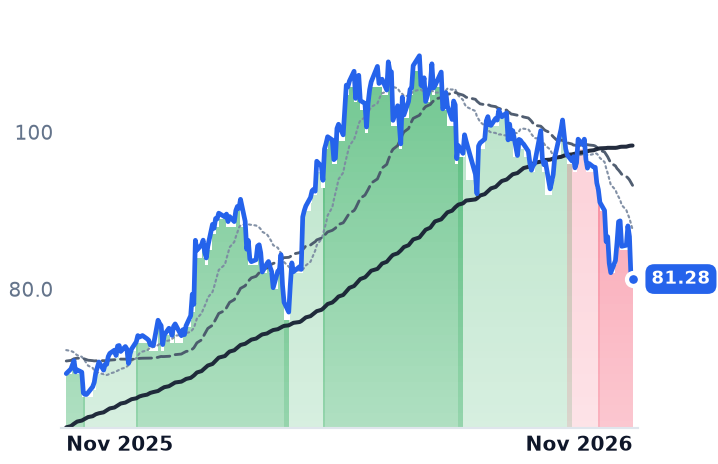
81.28
−0.08 (−0.10%)
vs. prior close
Price20d50d150d
ABBNY 12-month price
Electrical Equipment & Parts
NVT
nVent Electric
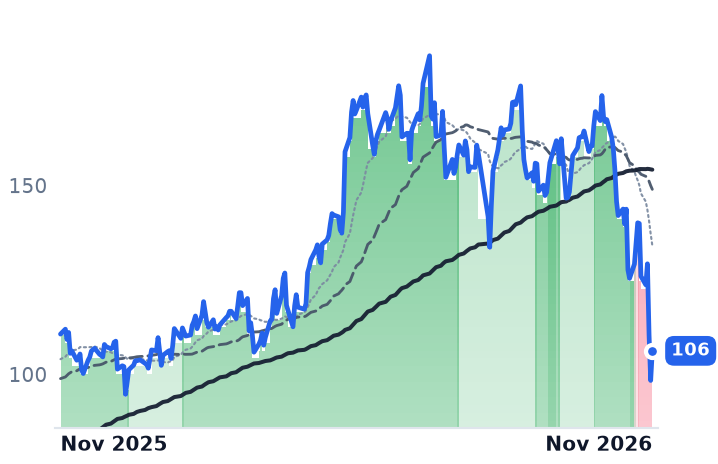
106
+7.84 (+7.97%)
vs. prior close
Price20d50d150d
NVT 12-month price
Power Distribution Systems
TickerMkt capP/EP/E fwdP/SP/S fwdP/GPP/GP fwdEV/EBITDAFCF yld
ETN$132.7B34.1x24.9x4.1x3.9x11.8x11.3x23.8x3.3%
ABBNY$147.0B29.6x24.3x4.0x3.8x10.0x9.6x19.4x3.3%
NVT$17.2B25.3x19.7x3.2x3.0x8.9x8.1x15.6x3.7%
298040.KS
Hyosung Heavy Industries
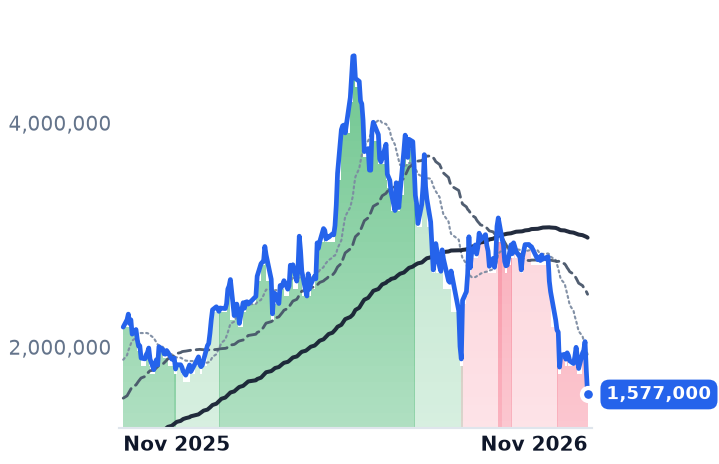
1,577,000
−214,000 (−11.95%)
vs. prior close
Price20d50d150d
298040.KS 12-month price
Electrical Equipment & Parts
SPY
State Street SPDR S&P 500 ETF Trust
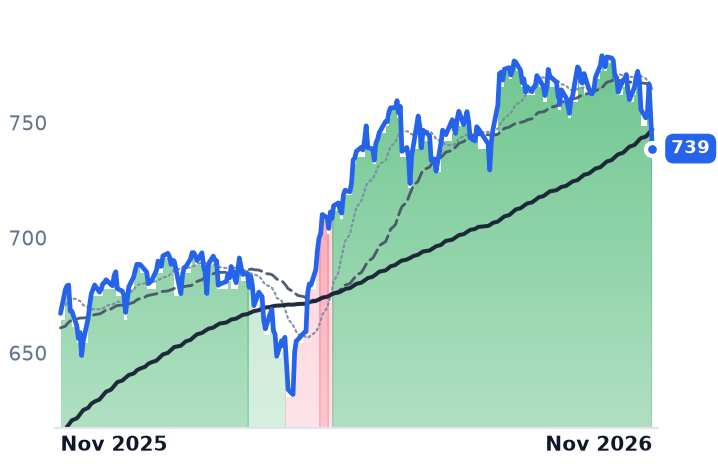
735
−17.92 (−2.38%)
vs. prior close
Price20d50d150d
SPY 12-month price
Asset Management
TickerMkt capP/EP/E fwdP/SP/S fwdP/GPP/GP fwdEV/EBITDAFCF yld
298040.KS$14.7T22.5x18.9x2.2x2.0x14.0x12.7x16.4x3.5%
SPY$773.0B————————

Consensus projections

TickerFY2026EFY2027EFY2028E
POWLRevenue+8.8%+25.8%+14.4%
EPS+12.1%+27.8%+19.8%
HUBBRevenue+18.5%+11.2%+6.3%
EPS+13.2%+11.9%+11.8%
267260.KSRevenue+14.6%+17.7%+16.6%
EPS+25.7%+27.9%+21.6%
ETNRevenue+22.4%+11.6%+10.4%
EPS+13.9%+18.9%+16.8%
ABBNYRevenue+13.9%+13.5%+10.7%
EPS+31.3%+12.2%+15.4%
NVTRevenue+51.0%+30.6%+14.3%
EPS+61.3%+30.2%+20.4%
298040.KSRevenue+22.0%+19.3%+17.6%
EPS+60.5%+41.4%+33.7%

Forward fiscal years only. Blank means no analyst coverage for that year.

The companies that build the electrical room of a data center, the medium-voltage switchgear and substation transformers that sit between the grid and the racks, spent election week being repriced for a rule that has not been written.

On 5 November the Korea Composite Stock Price Index fell 4.46% on heavy foreign selling of chip and power-equipment shares after the American result, with HD Hyundai Electric down 8.10% and Hyosung Heavy Industries down 12.59%; the stated concern was that tighter oversight of data-center construction, particularly restrictions on electricity and water consumption, could delay new projects. The next session the index fell a further 6.02% and a trading halt was triggered. In the United States, Eaton, the Dublin-domiciled power-management group whose Electrical Americas unit sells switchgear and power distribution, fell 7.4% on 5 November as the Nasdaq entered correction.

Six listed makers of this equipment fell an equal-weighted 26.7% over the thirty days to 6 November, against 5.4% for the S&P 500. The implied reading is that the scarcity these firms have been charging for since 2023 is about to be curtailed by policy, or cured by the capacity their own windfall financed. In the window the market marked them down, neither happened.

Nothing in the queue got shorter

Large power transformers still quote beyond 120 weeks, substation units above 160 weeks and the largest high-voltage units out to four years, while 15-kilovolt medium-voltage switchgear runs 52 to 80 weeks on June 2026 procurement data, with some manufacturers' capacity committed into 2028. American transformer demand is projected to exceed domestic manufacturing capacity by 30% to 40% through at least 2028.

The relief is dated, and the dates are not soon. Eaton's new three-phase transformer facility arrives in the first half of 2027. HD Hyundai Electric's second Montgomery, Alabama plant completes in April 2027, lifting extra-high-voltage transformer capacity by half, and LS Electric is spending KRW250bn to expand its Cedar City, Utah switchboard plant to about six times its current footprint.

Transformer prices stopped; switchgear prices did not

Where the hypothesis of a cure has purchase is narrower than the selloff. Transformer producer prices are up 91.4% since January 2020 but rose only 8.7% year-on-year in July 2026, while switchgear prices accelerated to 13.3% year-on-year in August.

That split shows up in guidance. Hubbell, the Shelton, Connecticut maker of electrical and utility distribution products, raised full-year guidance on 27 October to adjusted earnings of $20.40 to $20.60 a share, lifted Electrical Solutions organic growth to 17-18% and cut Utility Solutions, the transformer and substation segment, to 6-7%. "We're anticipating PCP to be in the neutral to dollar positive next year, with incrementals in line with our long-term algo at 25%-30%," chief financial officer Joe Capozzoli said on the call, meaning price-cost-productivity is no longer expected to add to margin in 2027. Hubbell's Utility sales rose 9% to $1,028m, about 4.9% of it organic. Data-center sales grew over 80% organically.

Eaton, meanwhile, has announced general price increases for Electrical Americas effective 2 January 2027, and ABB's third-quarter pricing contributed three percentage points to Electrification growth.

One income statement rolled, and it is the transformer house

HD Hyundai Electric reported September-quarter sales of KRW1.18tn and operating profit of KRW284.5bn, up 18.5% and 15.1% respectively, with margin at 24.1% against 25.1% in June and net income down 3.6%. Order backlog grew 4.2% in the quarter to $8.84bn, against a 23% build over the prior six months. Group operating margin had climbed from 0.55% in 2021 to 24.40% in 2025; the September quarter interrupts that arc.

The same morning it reported, the company approved a KRW198bn second phase at its Cheongju distribution campus running to June 2029, explicitly for AI data-center package demand. Its shares, at 15.0x forward earnings against 15.7x trailing on consensus 2026 earnings growth of 25.7%, carry almost no gap between the two: the market has stopped expecting growth to compress the multiple.

Powell has said nothing since August

Powell Industries, the Houston builder of custom switchgear and modular E-House substations, last spoke on 4 August, when it booked a record $934m of orders, a 3.0x quarterly book-to-bill and backlog near $2.4bn against $1.4bn a year earlier, with gross margin at 30.6%. Asked whether margins had peaked, chief executive Brett Cope said they had not. The stock has since fallen 32.4% from 7 October to 6 November, two-thirds of that before any vote was counted, and trades at 19.3x forward earnings against roughly 35x forward in May.

The business evidence accounts for part of this month and not most of it. At the transformer end the markdown has a cause in kind, though HD Hyundai's 74% fall from its May peak is a long way past a 100-basis-point margin slip. At the switchgear end the results point the other way: nVent Electric, which closed its $700m-revenue Maverick Power switchgear acquisition on 1 October, raised full-year organic growth guidance to 38-39% on 30 October and fell 41.3% anyway. Powell's own mix has tilted toward commercial buyers, 40% of backlog at the end of June against 29% in March, which makes its order book more sensitive to financing costs than to switchgear capacity. What the last two sessions added was a political risk to the buyer's permit, not a supplier's price concession.

Powell releases fiscal fourth-quarter results after the close on 16 November, the first of these companies to speak since the election. Whatever backlog it reports was booked before anyone voted.
AI Hardware Earns Computer Resellers a Thinner Margin, and Insight Is the Exception

Hypothesis Opus 5 · Research Opus 5 · Writing Opus 5 · Prompt v1.7

Four companies that buy computer hardware and sell it on reported inside nine days, and all four showed the same thing: sales inflating faster than gross profit for the third straight quarter. The memory shortage is reaching them as a bigger invoice, not a better spread.

CDW kept 12.8 cents of gross profit on each additional dollar of sales against 20.5 cents across its whole book. Ingram Micro kept 4.9 cents as its GPU and AI infrastructure revenue climbed to $1.8bn. Insight Enterprises is the only one whose new revenue was essentially non-dilutive, and roughly half its gross profit now comes from cloud and core services.

The earnings growth came from overhead cuts at all of them. The market has paid up for CDW, dearest of the four at 3.81x trailing gross profit, and marked down the two that raised guidance.

CDWINGMNSITCNXNDXCKDNABLMemory & Storage PricingIT Channel DistributionAI Infrastructure DemandGross Margin CompressionCloud & Managed ServicesOverhead Cost Discipline
TickerCompanySegmentTrend · 13mo30D1Y
The subject · what this brief is about
CDWCDWIT Infrastructure & Services🟢 Cont. Bull+14.1%+11.3%
INGMIngram MicroIT Infrastructure & Services⚠️ Emerging Bear−7.5%+17.5%
NSITInsight EnterprisesIT Infrastructure & Services🟢 Cont. Bull−1.4%+73.5%
DXCDXC TechnologyIT Infrastructure & Services🌱 Emerging Bull+24.0%+12.9%
KDKyndrylIT Infrastructure & Services🌱 Emerging Bull+43.0%−38.2%
NABLN-ableIT Infrastructure & Services🔴 Cont. Bear+6.5%−41.3%
Compared against · context, not the story
CNXNPC ConnectionEnterprise IT Distribution🟢 Cont. Bull−12.9%+37.5%

12-month price & trend

CDW
CDW
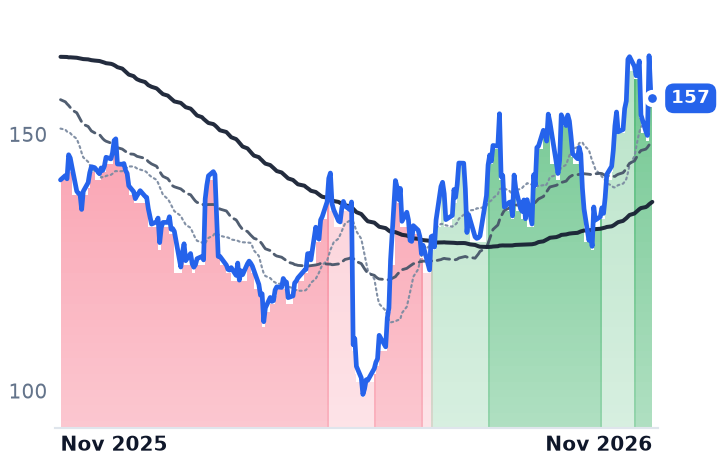
157
−1.39 (−0.88%)
vs. prior close
Price20d50d150d
CDW 12-month price
IT Infrastructure & Services
INGM
Ingram Micro
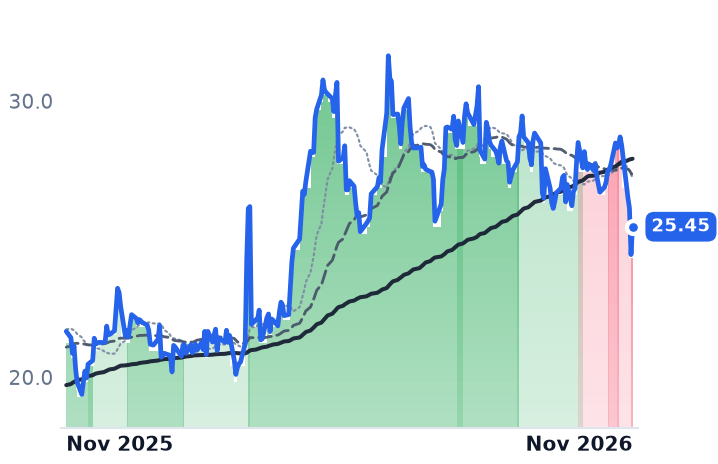
25.45
+1.01 (+4.13%)
vs. prior close
Price20d50d150d
INGM 12-month price
IT Infrastructure & Services
NSIT
Insight Enterprises
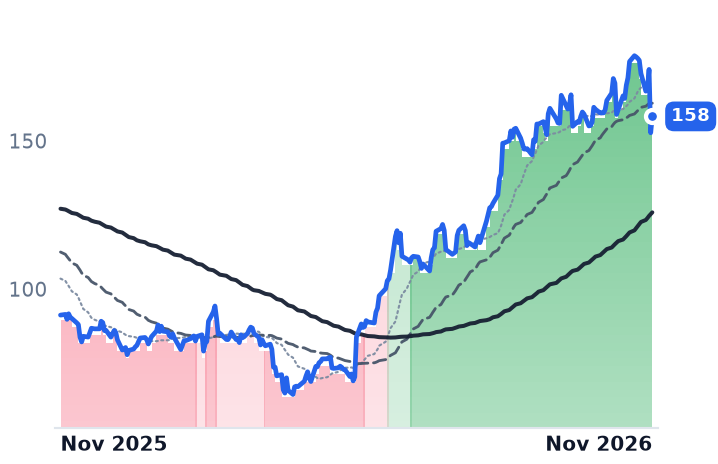
158
+5.53 (+3.62%)
vs. prior close
Price20d50d150d
NSIT 12-month price
IT Infrastructure & Services
TickerMkt capP/EP/E fwdP/SP/S fwdP/GPP/GP fwdEV/EBITDAFCF yld
CDW$19.6B18.2x14.0x0.8x0.8x3.8x3.7x13.9x6.0%
INGM$5.9B12.8x7.1x0.1x0.1x1.5x1.5x7.0x2.6%
NSIT$4.6B26.4x12.7x0.5x0.5x2.3x2.4x12.4x5.9%
CNXN
PC Connection
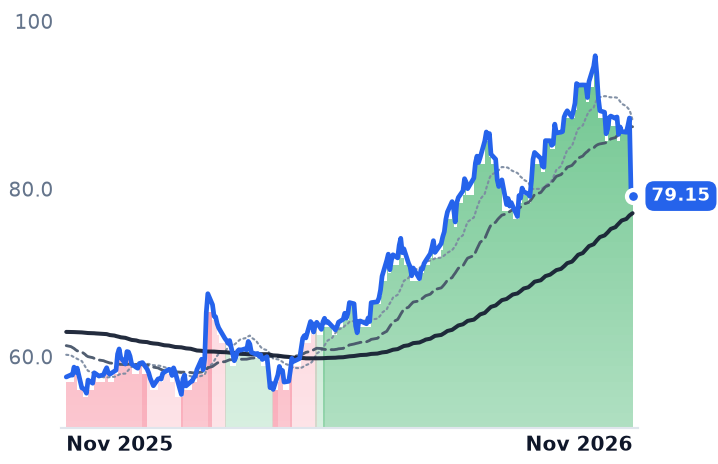
79.15
−0.52 (−0.65%)
vs. prior close
Price20d50d150d
CNXN 12-month price
Enterprise IT Distribution
DXC
DXC Technology
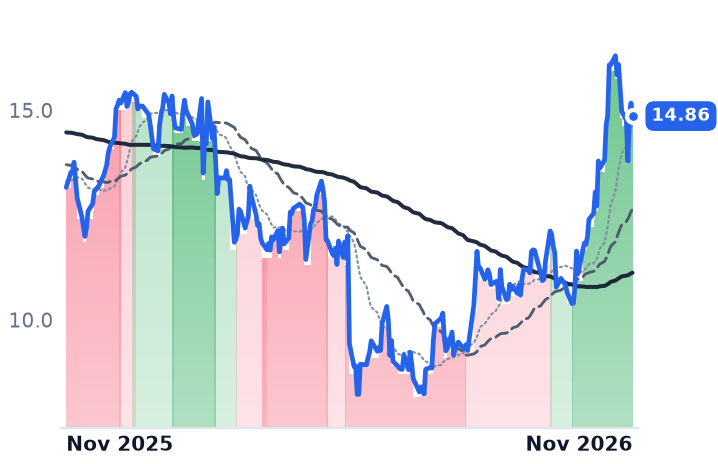
14.86
−0.31 (−2.04%)
vs. prior close
Price20d50d150d
DXC 12-month price
IT Infrastructure & Services
KD
Kyndryl
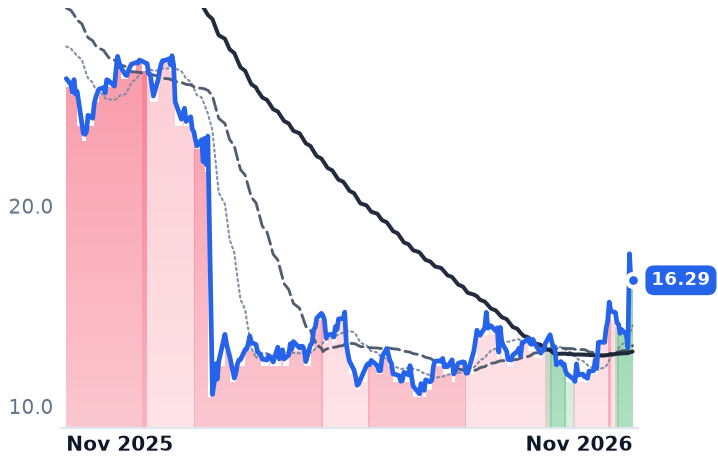
16.29
+0.11 (+0.68%)
vs. prior close
Price20d50d150d
KD 12-month price
IT Infrastructure & Services
TickerMkt capP/EP/E fwdP/SP/S fwdP/GPP/GP fwdEV/EBITDAFCF yld
CNXN$2.0B19.5x17.7x0.6x0.6x3.4x3.3x12.6x-1.0%
DXC$2.3B20.9x6.2x0.2x0.2x1.2x1.3x3.0x44.6%
KD$3.5B11.1x8.8x0.1x0.2x0.6x1.1x3.2x2.5%
NABL
N-able
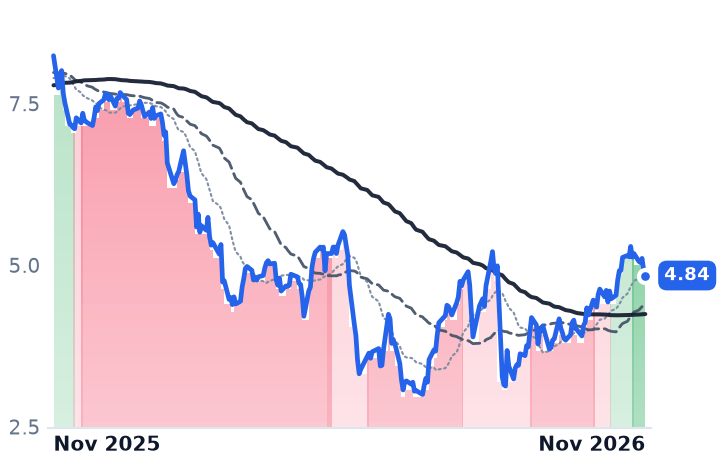
4.84
−0.08 (−1.63%)
vs. prior close
Price20d50d150d
NABL 12-month price
IT Infrastructure & Services
TickerMkt capP/EP/E fwdP/SP/S fwdP/GPP/GP fwdEV/EBITDAFCF yld
NABL$914.3Mn/m12.4x1.7x1.7x2.2x2.2x17.2x8.3%

Consensus projections

TickerFY2026EFY2027EFY2028E
CDWRevenue+12.6%+5.4%+4.6%
EPS+13.5%+10.4%+10.0%
INGMRevenue+17.8%+3.7%+4.9%
EPS+25.8%+8.6%+12.5%
NSITRevenue+6.7%+3.8%+6.2%
EPS+28.5%+6.0%+16.6%
CNXNRevenue+13.6%+3.7%+6.8%
EPS+31.2%+7.1%+7.9%
DXCRevenue−1.2%−5.7%−3.0%
EPS−5.6%−24.8%+12.0%
KDRevenue+0.4%−2.0%−0.0%
EPS+49.9%+5.8%+37.4%
NABLRevenue+6.4%+6.1%+9.1%
EPS−7.9%+11.2%+11.6%

Forward fiscal years only. Blank means no analyst coverage for that year.

Between 28 October and 5 November, the four companies that buy computer hardware from manufacturers and sell it on to corporate, small-business and public-sector buyers each reported a record quarter and a thinner spread. Ingram Micro's net sales rose 20.8% to $15.2bn; its gross profit rose 14.6%. CDW, PC Connection and Insight Enterprises printed the same shape, and all four lost gross margin percentage year on year.

The quarters were read as AI demand finally arriving in the channel. What they document instead is a bill of materials inflating faster than the markup charged on it, with the earnings growth arriving from somewhere else entirely.

What one more dollar of hardware pays

CDW's net sales rose 17.7% to $6.75bn while gross profit rose 10.3% to $1.39bn. Netting the two quarters, $1,017m of additional revenue carried $130m of additional gross profit: 12.8 cents on the incremental dollar, against 20.5 cents across the whole book. Ingram Micro, the wholesale rung above the resellers, managed 4.9 cents against a 6.55-cent average, because its GPU and AI infrastructure revenue went from roughly $700m a year ago to $1.8bn. Strip those deals out and its gross margin was 7.06% against 7.10% — flat. PC Connection earned 14.1 cents against an 18.5-cent average.

The mechanism sits in the component. Memory and storage now run about 35% of a PC's bill-of-materials cost against a historical 15% to 18%, and more than half the materials cost of a traditional server. A reseller buys at the inflated component price and sells at a percentage markup that does not scale with it, so revenue rises by the full cost increase and gross profit only by the markup on that increase. Contract prices for conventional memory are expected to rise a further 10% to 20% quarter on quarter in the fourth quarter on the research firm TrendForce's projection, after 58% to 63% in the second.

The volume data make the point sharper. CDW reported client-device average selling prices up 19% even as units declined, attributing the rise to price increases and richer configurations with more processing power and memory. PC Connection's notebook revenue grew 30% while notebook units fell about 5%. Insight's devices revenue grew 30% on units up low single digit.

Demand itself is not the constraint. "Writings continue to outpace invoicing, and backlog is building, particularly in enterprise infrastructure," chief executive Chris Leahy told CDW investors on 4 November.

Insight's half-services book

Insight is the one name whose new revenue was essentially non-dilutive: 20.3 cents of gross profit per incremental dollar against a 21.4-cent average, on net revenue up 21.8% and gross profit up 20.5%. The reason is mix. Cloud gross profit reached $164m, up 26%, and core services $95m, up 21% — together roughly half the company's gross profit. Infrastructure hardware gross profit rose more than 50%, but hardware gross margin fell 100 basis points on device pricing and client mix.

"We are raising our gross profit growth expectations to 12.5% to 14%, and our gross margin will be approximately 21.5%," chief financial officer James Morgado said on 5 November.

The rescue came from overhead

At CDW, non-GAAP selling and administrative costs grew 5.6% against 10.3% gross profit growth, lifting non-GAAP operating income 17% to $620m; chief financial officer Al Miralles credited "Geared for Growth efforts kicking in." Ingram Micro cut operating expenses to 4.62% of sales from 5.13% and lifted adjusted operating income 25% to $322m. PC Connection improved overhead by 150 basis points of sales and grew operating income 35.4%. Carrying the bigger invoices costs cash: PC Connection burned $39.8m of operating cash over nine months on a $144.8m receivables increase.

Priced inversely to the gross profit

CDW has risen 15.6% in three months to 3.81x trailing gross profit, the dearest of the four and above the 3.74x at which PC Connection stood in September, on the second-thinnest incremental spread — while management guides full-year gross margin below 2025. Ingram Micro, which beat a $13.85bn consensus revenue estimate and cut net leverage to 1.9x, trades at 7.11x forward earnings and 1.34x book; it gave back a 6.1% after-hours gain the next session and is down 10.4% over three months. Insight sits at 12.66x forward earnings and fell 12.3% on the day it raised guidance — the same session the Nasdaq 100 fell 6.4% on fears of a slower data-center buildout, which also took PC Connection down 9.9%.

So the results account for the earnings growth. They do not account for the ranking.

Every one of these companies converted a slower-growing gross line into a faster-growing operating line, which is a cost story with a floor under it, and none of them captured the component inflation as margin: it was passed through to the customer and spent on the component. Insight's exception is structural, built out of cloud and core services gross profit that now carries half the book. Ingram Micro's discount contains a forward cycle call as well as a valuation: management has guided 2027 to moderate single-digit growth as the PC refresh ends and pricing moderates, so the cheapest name in the group also carries the clearest statement that the revenue wave stops.

Ingram Micro's fourth-quarter guidance assumes supply constraints add two to three percentage points to its sales. That is the trade these companies are in: the shortage is worth something real on the invoice, and so far almost nothing on the spread.

Modine's First $1bn Order Quarter for Data-Center Cooling Cost It a Third of Its Profit

Hypothesis Opus 5 · Research Opus 5 · Writing Opus 5 · Prompt v1.7

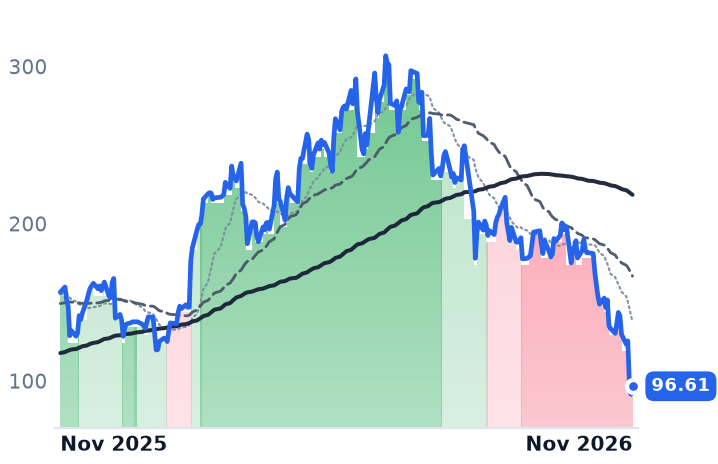
Modine has never taken in as many orders as it did last quarter, and it has never converted them so poorly. Data-center revenue grew 95% year-over-year, the Americas business 132%, and net income still fell to $30.0m on revenue up 35%.

That is the test of the belief that cooling vendors are AI infrastructure companies rather than construction cyclicals. The demand half holds: Trane's commercial HVAC backlog reached $12.5bn, up more than 70%. The profit half does not. Modine, Trane and AAON each lost gross margin in their most recent reported quarter, and Modine's shares now fetch 6.5x trailing gross profit against 12.9x in mid-October. Watts Water is the exception, expanding operating margin by 240 basis points on the same end market.

MODTTAAONWTSXYLROPVRTSPXCJCICARRLIIGTLSData-Center CoolingLiquid Cooling AdoptionCommercial HVAC BacklogAI Buildout CapexInput Cost & TariffsCapacity Expansion Spending
TickerCompanySegmentTrend · 13mo30D1Y
The subject · what this brief is about
MODModine ManufacturingHVAC & Refrigeration Systems🔴 Cont. Bear−46.8%−38.2%
TTTrane TechnologiesHVAC & Refrigeration Systems⚠️ Emerging Bear−14.5%−7.3%
AAONAAONHVAC & Refrigeration Systems🔴 Cont. Bear−34.3%−45.7%
WTSWatts Water TechnologiesHVAC & Refrigeration Systems🟢 Cont. Bull+1.2%+27.1%
XYLXylemPumps, Valves & Filtration🔴 Cont. Bear−3.1%−34.9%
ROPRoper TechnologiesEnterprise Resource Planning🟢 Cont. Bull+34.0%+7.4%
SPXCSPX TechnologiesHVAC & Building Systems🔴 Cont. Bear−15.5%−35.7%
JCIJohnson Controls InternationalHVAC & Building Systems🟢 Cont. Bull−12.3%+10.8%
CARRCarrier GlobalHVAC & Refrigeration Systems🔴 Cont. Bear−5.0%−8.5%
GTLSChart IndustriesFiltration & Separation🟢 Cont. Bull—+4.6%
Compared against · context, not the story
VRTVertivAdvanced Power Systems⚠️ Emerging Bear−26.4%+1.8%
LIILennox InternationalHVAC & Refrigeration Systems🔴 Cont. Bear−3.5%−30.1%

12-month price & trend

MOD
Modine Manufacturing
96.61
+5.22 (+5.71%)
vs. prior close
Price20d50d150d
MOD 12-month price
HVAC & Refrigeration Systems
TT
Trane Technologies
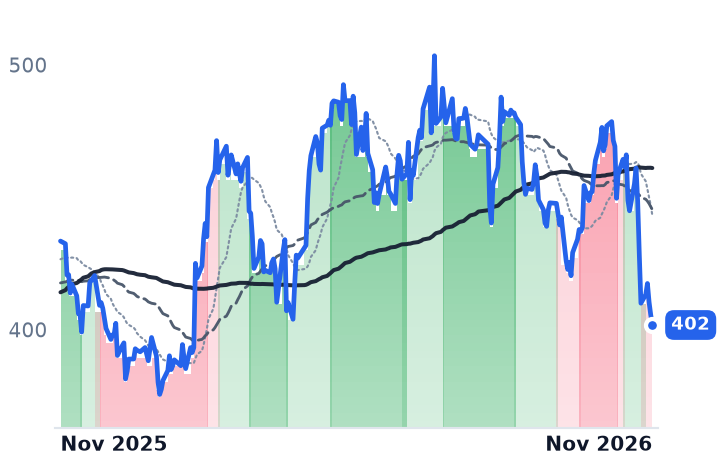
402
−3.94 (−0.97%)
vs. prior close
Price20d50d150d
TT 12-month price
HVAC & Refrigeration Systems
AAON
AAON
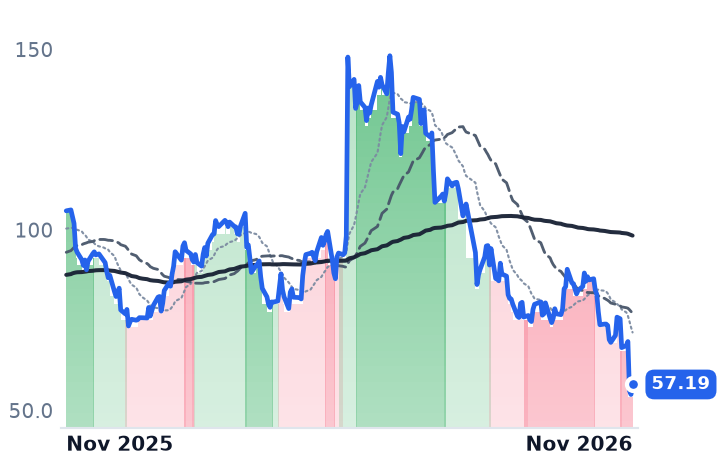
57.19
+2.77 (+5.09%)
vs. prior close
Price20d50d150d
AAON 12-month price
HVAC & Refrigeration Systems
TickerMkt capP/EP/E fwdP/SP/S fwdP/GPP/GP fwdEV/EBITDAFCF yld
MOD$5.1B40.4x13.4x1.4x1.6x6.5x7.2x17.8x-0.7%
TT$87.9B28.3x26.3x3.8x3.6x10.8x10.4x20.5x4.3%
AAON$4.7B29.5x24.1x2.4x2.0x9.5x8.0x17.3x-2.5%
WTS
Watts Water Technologies
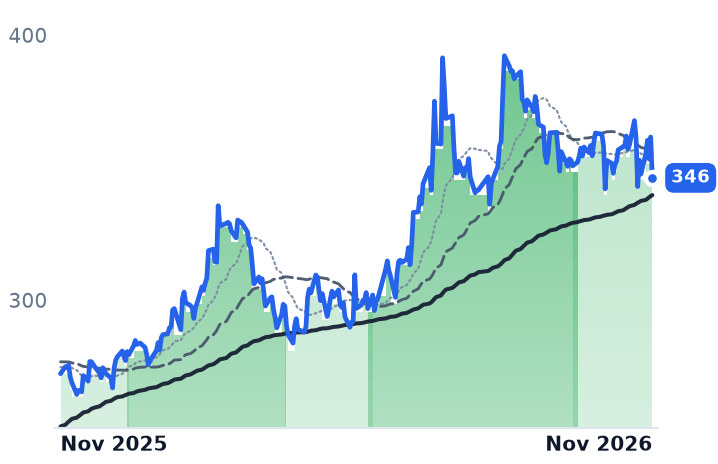
346
−15.42 (−4.27%)
vs. prior close
Price20d50d150d
WTS 12-month price
HVAC & Refrigeration Systems
XYL
Xylem
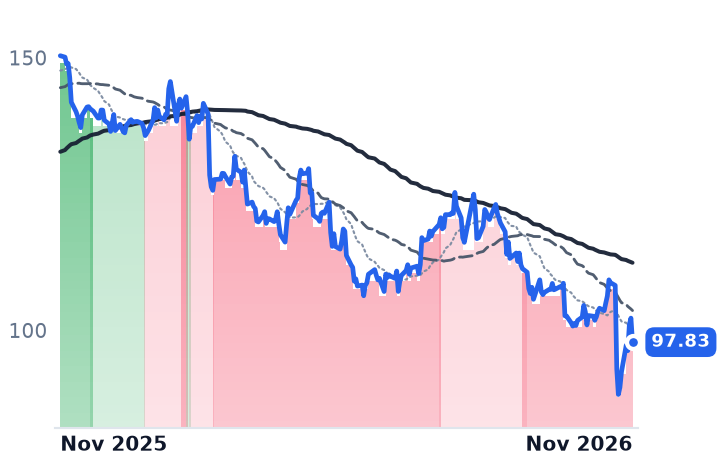
97.83
−4.40 (−4.31%)
vs. prior close
Price20d50d150d
XYL 12-month price
Pumps, Valves & Filtration
ROP
Roper Technologies
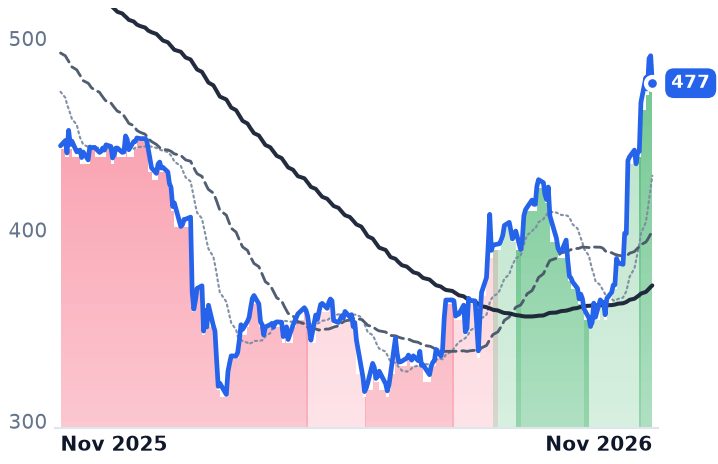
477
−14.36 (−2.92%)
vs. prior close
Price20d50d150d
ROP 12-month price
Enterprise Resource Planning
TickerMkt capP/EP/E fwdP/SP/S fwdP/GPP/GP fwdEV/EBITDAFCF yld
WTS$11.6B25.9x26.8x4.1x4.1x8.2x8.1x17.0x3.2%
XYL$22.4B21.6x18.0x2.5x2.5x6.2x6.3x12.7x4.1%
ROP$47.2B18.8x21.3x5.6x5.5x8.0x7.9x12.9x5.4%
VRT
Vertiv
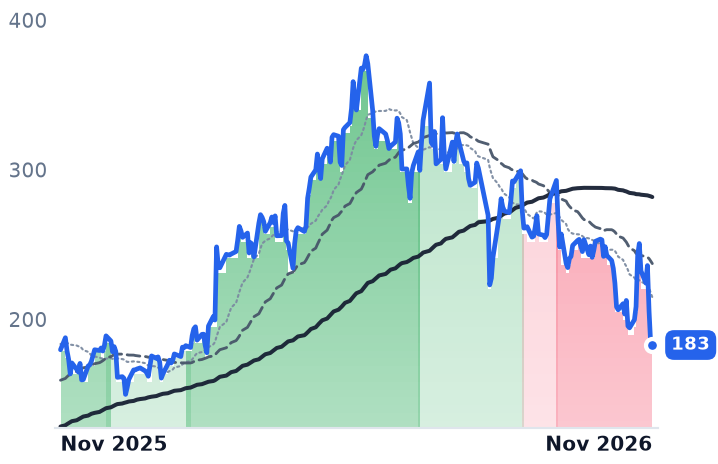
183
−0.77 (−0.42%)
vs. prior close
Price20d50d150d
VRT 12-month price
Advanced Power Systems
SPXC
SPX Technologies
143
−4.59 (−3.12%)
vs. prior close
Price20d50d150d
SPXC 12-month price
HVAC & Building Systems
JCI
Johnson Controls International
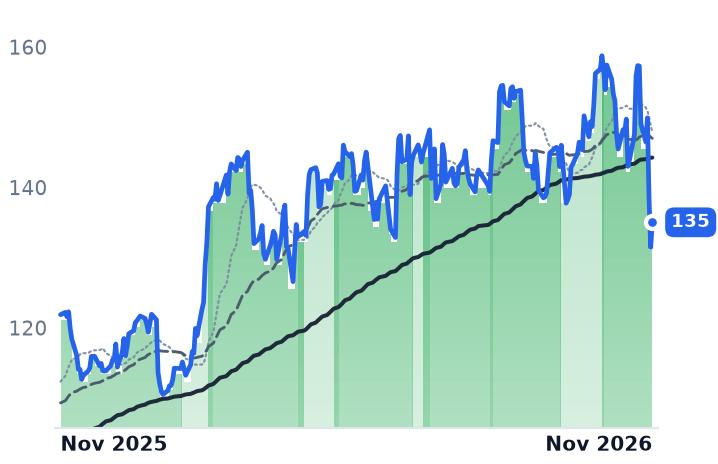
135
+3.57 (+2.72%)
vs. prior close
Price20d50d150d
JCI 12-month price
HVAC & Building Systems
TickerMkt capP/EP/E fwdP/SP/S fwdP/GPP/GP fwdEV/EBITDAFCF yld
VRT$97.1B55.8x37.5x8.5x6.9x22.2x18.2x38.2x3.0%
SPXC$7.2B23.9x17.0x2.8x2.6x6.9x6.5x14.8x3.2%
JCI$81.8B28.8x21.5x3.2x2.9x8.6x7.8x21.9x4.5%
CARR
Carrier Global
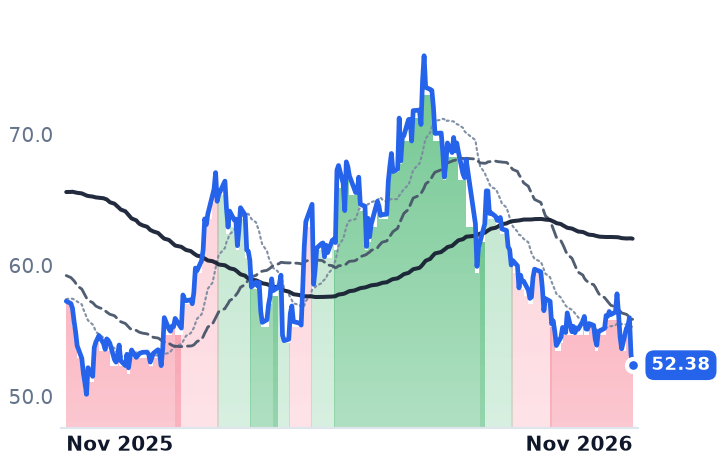
52.38
−0.83 (−1.56%)
vs. prior close
Price20d50d150d
CARR 12-month price
HVAC & Refrigeration Systems
LII
Lennox International
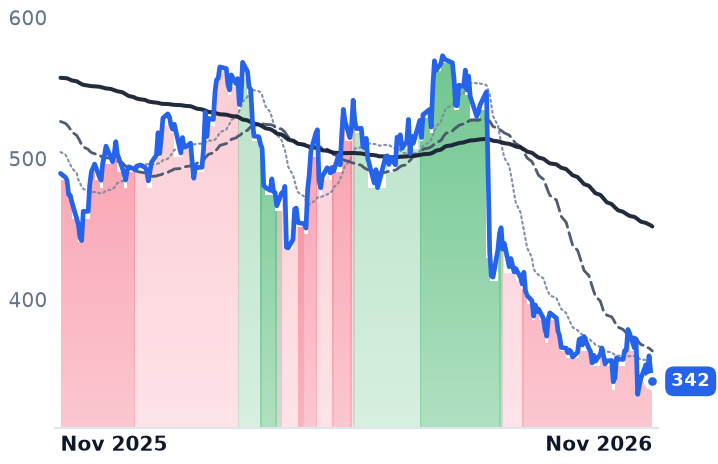
342
−6.82 (−1.96%)
vs. prior close
Price20d50d150d
LII 12-month price
HVAC & Refrigeration Systems
GTLS
Chart Industries
Price20d50d150d
GTLS 12-month price
Filtration & Separation
TickerMkt capP/EP/E fwdP/SP/S fwdP/GPP/GP fwdEV/EBITDAFCF yld
CARR$42.9Bn/m18.3x1.9x1.8x7.6x7.3x223.3x5.5%
LII$11.8B15.9x15.9x2.2x2.1x6.6x6.6x12.0x7.1%
GTLS$10.0Bn/m30.1x2.4x2.5x7.7x7.8x26.0x0.1%

Consensus projections

TickerFY2026EFY2027EFY2028E
MODRevenue+22.6%+4.9%+34.9%
EPS+33.4%+51.0%+36.1%
TTRevenue+13.5%+10.5%+8.8%
EPS+17.4%+16.1%+15.0%
AAONRevenue+65.9%+17.6%+16.0%
EPS+68.5%+51.5%+26.4%
WTSRevenue+17.0%+5.8%+5.0%
EPS+25.2%+9.3%+9.1%
XYLRevenue−0.5%+3.5%+5.2%
EPS+7.6%+7.6%+10.8%
ROPRevenue+8.1%+6.1%+5.7%
EPS+12.3%+9.9%+8.2%
VRTRevenue+37.1%+30.2%+21.3%
EPS+62.9%+36.7%+26.4%
SPXCRevenue+23.3%+15.6%+9.4%
EPS+24.7%+16.3%+12.8%
JCIRevenue+9.0%+10.3%+9.0%
EPS+36.9%+23.4%+18.3%
CARRRevenue+8.7%+6.0%+6.1%
EPS+10.2%+11.0%+13.7%
LIIRevenue+4.4%+5.3%+4.5%
EPS−5.7%+7.9%+9.1%
GTLSRevenue−6.0%+4.7%+3.9%
EPS−37.2%+13.9%+19.3%

Forward fiscal years only. Blank means no analyst coverage for that year.

Modine Manufacturing, the Racine, Wisconsin maker of chillers, coils, air handlers and precision cooling equipment for data centers, told investors on November 4 that it had taken in more than $1bn of orders in a single quarter for the first time in its history. Data-center revenue grew 95% year-over-year, the Americas business 132%, and backlog reached a record. Net income for the quarter was $30.0m, down 32% from a year earlier on revenue up 35% to $994.4m.

"We achieved our fourth consecutive quarter of record orders, exceeding $1 billion in quarterly order intake for the first time in our history," chief executive Neil Brinker said on the call. Demand, he added, "far exceeds our capacity." That combination is the whole argument over this group of companies. They were bought as derivatives of the artificial-intelligence buildout, on the premise that each megawatt of installed cooling carries more equipment content than the last. The orders vindicate that premise. What they have not done is arrive as profit, and the market has stopped paying for the first in advance of the second.

The content is real; the conversion is not

Modine's gross margin fell to 20.7% in the September quarter, roughly 160 basis points below the prior year, on material cost inflation, tariff-related logistics and operating inefficiencies tied to the rapid expansion of data-center cooling capacity. Chief financial officer Mick Lucareli sized the input problem at "about 375 basis points" in the quarter, against "at least, call it 250 basis points catch-up right now that we've gone" in agreed customer pricing, subject to contract-approval lags.

The segment itself is not the problem. Modine's data-center business earned a 15.4% adjusted margin on earnings before interest, taxes, depreciation and amortization, above the 13.7% group figure and above Commercial HVAC's 15.1%. The dollars per megawatt are accretive where they land. They are simply landing through thirteen operational chiller lines on the way to a target of twenty, a third dedicated plant launching in Calgary, and capital spending guided to $150-200m this fiscal year with more than $100m a year expected to persist into 2028.

Management raised full-year guidance to $3.1-3.2bn of sales and $470-500m of adjusted EBITDA, more than 50% growth, with data-center sales up 80-90%. Consensus sat at $3.302bn and $7.20 of earnings per share, above the top of the range management called a raise. That reconciles the two readings of the print circulating afterward.

Where the megawatt dollar actually goes

Mechanical and cooling equipment is 15% to 20% of total data-center capital expenditure, and rising. Liquid roughly doubles the bill: $8m to $14m per critical information-technology megawatt for a standard air-cooled facility against $17m to $25m fully fitted for direct-to-chip.

But the split inside that number matters more than its size. The rack-side coolant distribution unit, the pump-and-manifold skid that moves fluid to the processor, goes elsewhere: Vertiv took 29.4% of global liquid-cooled distribution-unit revenue in 2025 and holds agreements with Nvidia and six hyperscale cloud providers covering more than 50,000 units through 2028. Modine, Trane and AAON sell the facility-side heat-rejection loop around it. Modine's own direct-to-chip position remains prospective: it is producing sub-assemblies for data-center chillers and discussing a coils supply opportunity for liquid cooling and radiator systems, described on the call as future revenue.

Lennox rose on the day Modine fell a fifth

One reading of the selloff is that these are construction cyclicals that were mistaken for technology names. The November 4 session, when Democrats swept the midterms and Texas elected a governor who had campaigned for tougher limits on data-center development, says the opposite. Modine fell 21%, AAON 20%, Vertiv 13%, Johnson Controls 8% and cooling-tower maker SPX Technologies 6%. Lennox, a residential heating and cooling pure-play, rose 3.9%; Carrier rose 1.2%. What was sold was data-center exposure. The same pattern had appeared on October 30.

Trane Technologies, the $88bn Irish-domiciled maker of chillers, rooftop units and Thermo King transport refrigeration, shows the fundamental version of the same squeeze. Commercial HVAC backlog hit $12.5bn, up more than 70%, with Americas applied bookings up 40% across 1,700 tracked mega-projects, predominantly data centers. "With backlog up more than 70% from the prior year, we are well-positioned for strong growth in 2027," chair and chief executive David Regnery said on October 29. The shares fell as much as 11% intraday to a seven-month low on an earnings beat, because the company cut its full-year pricing assumption to about one point from 1.5 and guided organic leverage down to the low twenties from 25%-plus. Its Stellar modular-chiller data-center line is tracking $500m of revenue this year at neutral earnings per share, targeting $1bn by 2028 at a mid-teens EBITDA margin, below the roughly 20% the enterprise earns. At 26.3x forward earnings against the 32x recorded in May, Trane's de-rating has a cause on the income statement.

AAON, the Tulsa maker of semi-custom rooftop units and purpose-built data-center cooling, has the starkest version. Annual gross margin was 34.1% in 2023 and 26.7% in 2025, and 24.3% in the June quarter, as data-center work displaced rooftop units; that quarter's revenue doubled and backlog rose 98% to $2.0bn. It has fallen 33% in thirty days without reporting anything: third-quarter results are scheduled for November 9. At 24.1x forward earnings it is the dearest of the three on that measure.

Watts Water Technologies, which sells backflow preventers, mixing valves and hydronic heating into buildings, is the one that kept what the others gave up. Data centers are now a high-single-digit percentage of revenue, mix is shifting toward liquid cooling, and September-quarter operating margin expanded 240 basis points to 20.9% with adjusted earnings per share up 36%. Its residential exposure is 25% of sales against 40% in 2022. "Regarding near-term demand, we're talking to our contractors and installers, and their book of business is solid for the next couple of years for sure," chief executive Robert Pagano said on November 5. Watts fell 3.4% over the same thirty days in which Modine fell 47%.

What 6.5 times gross profit assumes

The results explain the direction and not the distance. Modine trades at 6.5x trailing gross profit against 12.9x in mid-October, and at 13.4x forward earnings against 40.4x trailing, a spread that only resolves if something close to the guided EBITDA growth of more than 50% actually arrives. The margin shortfall behind the fall is genuine deterioration, not atmosphere: inputs rose faster than contracts could be repriced, and three plants were ramping at once.

What separates the names is who sets the price. Watts expanded margin because its mix moved toward higher-value product; Trane lost pricing power in short-cycle equipment and said so; Modine is carrying a two-quarter lag between cost and contract, with management guiding data-center margins up 100 to 200 basis points sequentially and above 20% in the fourth quarter. Those are three different mechanisms producing one chart. Vertiv, which owns the rack-side dollar these mid-caps are supposedly scaling past, fell 24.5% over the same thirty days, which weakens any account in which the air-side vendors were singled out.

Brinker noted something on the call that will matter more than the quarter: September was the first month every Modine chiller plant delivered on time, and October was the second. The orders were never the question.

Keysight's Orders Grew 56% on AI Test Demand, and That Exposure Is Why Its Shares Fell

Hypothesis Opus 5 · Research Opus 5 · Writing Opus 5 · Prompt v1.7

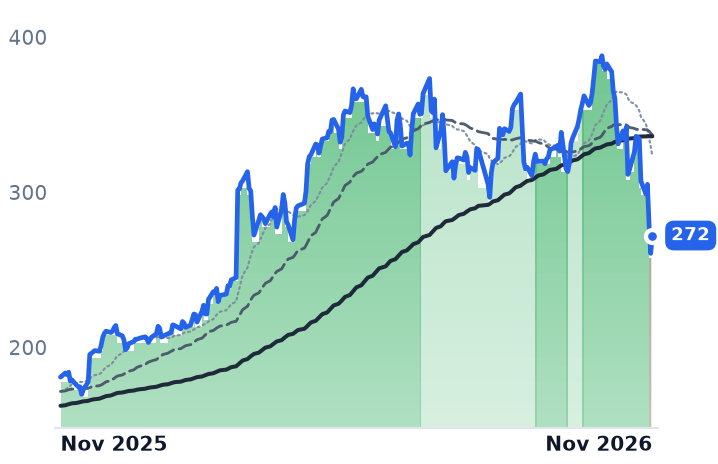
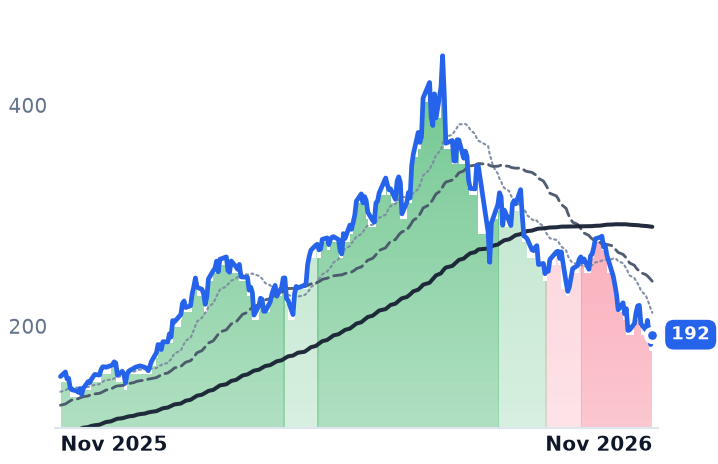
Keysight booked more orders than it shipped last quarter and has since lost more than a quarter of its market value, with no guidance change, no export-control action and no contract loss to explain it. Orders reached $2,091m against $1,846m of revenue, and reported revenue growth accelerated through the fiscal year to 36.5%.

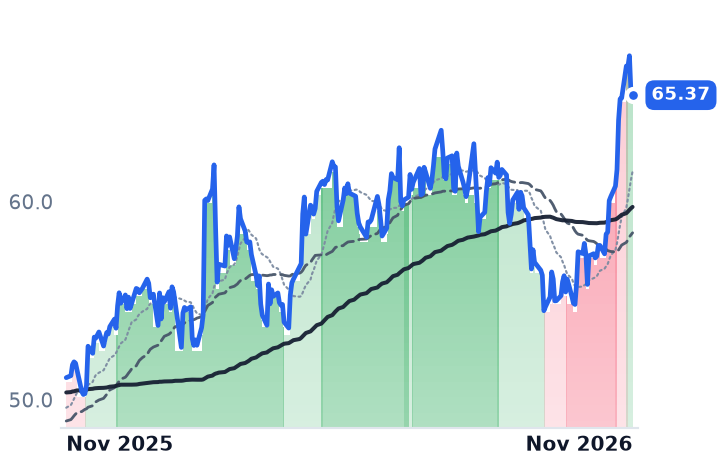
Inside the same test-instrument group, the markdown sorted by how much artificial-intelligence revenue each name carries. Fortive, whose Fluke franchise management puts at low single digits of sales for data centers, rose 14% over the 30 days to 6 November; Keysight, whose AI business ran at $500m-$600m in the first half, fell 28.6%. Ralliant and Teledyne both raised full-year guidance inside the window.

Keysight's forward earnings multiple compressed to 19.7x from roughly 27.7x a month earlier. The business explains none of the move; the AI label explains most of it.

KEYSTDYRALFTVMKSIAI Data-Center BuildoutOptical & Wireline NetworkingAerospace & Defense ElectronicsMultiple CompressionElectronic Design Software
TickerCompanySegmentTrend · 13mo30D1Y
KEYSKeysight TechnologiesTest & Measurement🟢 Cont. Bull−28.2%+50.5%
TDYTeledyne Technologies IncorporatedTest & Measurement⚠️ Emerging Bear+2.9%+20.5%
RALRalliantTest & Measurement🟢 Cont. Bull−6.3%+45.4%
FTVFortiveTest & Measurement🟢 Cont. Bull+17.1%+27.9%
MKSIMKSTest & Measurement⚠️ Emerging Bear−29.6%+24.5%

12-month price & trend

KEYS
Keysight Technologies
272
+11.52 (+4.42%)
vs. prior close
Price20d50d150d
KEYS 12-month price
Test & Measurement
TDY
Teledyne Technologies Incorporated
619
+12.68 (+2.09%)
vs. prior close
Price20d50d150d
TDY 12-month price
Test & Measurement
RAL
Ralliant
67.68
+4.85 (+7.72%)
vs. prior close
Price20d50d150d
RAL 12-month price
Test & Measurement
TickerMkt capP/EP/E fwdP/SP/S fwdP/GPP/GP fwdEV/EBITDAFCF yld
KEYS$46.3B37.4x19.7x7.0x5.7x10.9x8.8x25.0x3.2%
TDY$28.7B28.3x24.2x4.4x4.3x11.4x11.2x18.3x4.0%
RAL$7.5Bn/m22.5x3.3x3.2x6.5x6.4xn/m4.0%
FTV
Fortive
65.37
−0.05 (−0.08%)
vs. prior close
Price20d50d150d
FTV 12-month price
Test & Measurement
MKSI
MKS
192
+8.96 (+4.89%)
vs. prior close
Price20d50d150d
MKSI 12-month price
Test & Measurement
TickerMkt capP/EP/E fwdP/SP/S fwdP/GPP/GP fwdEV/EBITDAFCF yld
FTV$19.5B30.8x21.2x4.4x4.4x7.0x6.9x17.1x5.6%
MKSI$13.0B21.5x14.6x2.7x2.6x6.1x5.7x13.5x4.2%

Consensus projections

TickerFY2026EFY2027EFY2028E
KEYSRevenue+33.3%+14.7%+8.3%
EPS+61.9%+20.2%+11.8%
TDYRevenue+9.2%+6.1%+4.5%
EPS+18.5%+8.6%+6.4%
RALRevenue+12.7%+7.6%+4.9%
EPS+12.6%+18.1%+16.0%
FTVRevenue+7.0%+3.8%+4.1%
EPS+16.8%+7.3%+7.9%
MKSIRevenue+29.7%+20.5%+10.3%
EPS+67.2%+33.9%+14.9%

Forward fiscal years only. Blank means no analyst coverage for that year.

Keysight Technologies took in more orders last quarter than it shipped: roughly $2.1bn against $1.8bn of revenue. The orders were up 56% from a year earlier and were the second consecutive quarter above $2bn for the company, which sells oscilloscopes, radio-frequency and optical test systems and design software to communications, defense, automotive and semiconductor engineers. Since early October the shares have lost more than a quarter of their value, with no guidance change, no contract loss and no regulatory action attached to the company.

General-purpose instruments are supposed to be the insulated corner of the electronics complex: they are paid for out of engineering and research budgets at design time, well before anyone pours concrete for a data center. The past month tested that belief inside a single group of vendors, and the result was not flattering to it. What determined whether a test-instrument maker was marked down was how much AI revenue its name carried, not how its order book was running.

The half of Keysight nearest the buildout is the half growing

Keysight's Communications Solutions Group did $1,345m of revenue in the quarter ended 31 July, up 43%, on 56% growth in commercial communications and 14% in aerospace, defense and government. The Electronic Industrial Solutions Group did a record $501m, up 21%. Gross margin reached 65.9% against 61.7% a year earlier, and operating margin 25.0%.

"The scaling challenges associated with AI data center deployments are driving a multiyear industry road map for new architectures, evolving technologies and new standards," chief executive Satish Dhanasekaran said on the August 18 earnings call. On the same call he sized the AI business at the "$500 million-$600 million range" for the first half of the fiscal year and said it was "largely in the wireline segment," where orders more than doubled.
Two things complicate the growth. Reported revenue is flattered by the $1,415m purchase of Spirent Communications, net of cash acquired, closed in the prior fiscal year's fourth quarter. And the recurring mix thinned: software and services were about 33% of revenue against 36% a quarter earlier, with annual recurring revenue at 24% against 27%, diluted by hardware growing faster than either.

The de-rating is wide. Keysight trades at 19.7x the $13.77 of fiscal-2027 consensus earnings per share, against roughly 27.7x on the same estimate at the October 7 close, and 37.4x trailing against 59.2x in May 2026.

Fluke's owner went up through the same sessions

Fortive, which owns the Fluke handheld-instrument and calibration business, is the counter-case within the group. Core growth at its Intelligent Operating Solutions segment accelerated to 9% in the third quarter, Fluke orders accelerated and book-to-bill held above 1.0 on data-center, defense and technician demand. Management put data-center revenue at only low single digits of sales. "We are supply constrained, frankly, at this point in terms of the talent and the capacity we want to build, because the market is certainly there for us," chief executive Olumide Soroye told investors on October 28, describing a specialized data-center sales team for Fluke. Fortive raised full-year earnings guidance to $3.10-$3.14 and rose 14.0% over the 30 days to November 6. It trades at 21.2x forward earnings against 30.8x trailing.
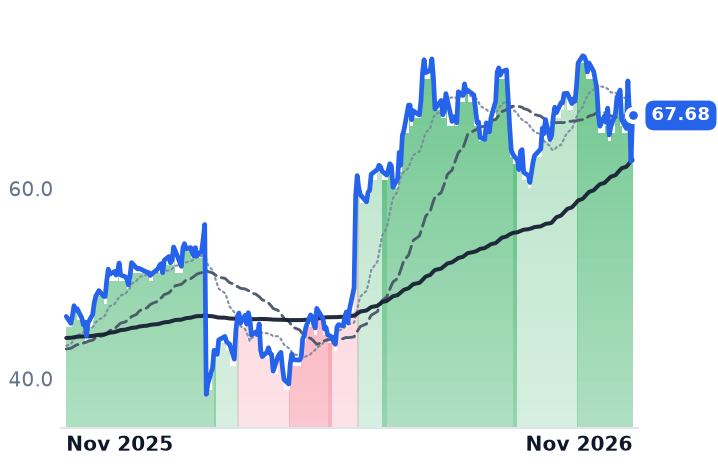
Ralliant raised guidance and was sold twice

Ralliant, the Tektronix and Keithley owner spun out of Fortive this year, grew its Test and Measurement segment 21% organically to $244m with segment margin up 670 basis points to 19.3%. The composition matters: diversified electronics up 48%, communications up 4%, semiconductor down 7%. Book-to-bill ran above 1.1 in both segments, and management reported channel inventory clearing on sell-through. In September Tektronix launched a fully regenerative dynamic test rig scaling to 1.92 megawatts to validate the 800-volt direct-current power architectures appearing in AI data centers by emulating graphics-processor load swings.

Ralliant raised 2026 guidance on November 4 to $2.34bn-$2.36bn of revenue and $3.10-$3.16 of earnings per share, with net leverage at 1.5x. The shares fell 4.8% that day and 7.5% the next. On the raised midpoint the forward multiple is about 21.6x. One caveat belongs beside the margin: a $7m tariff refund was worth 115 basis points of the reported gross-margin gain, and management said roughly $14m of such refunds will not repeat next year.

Teledyne's instruments line disagrees with its own order book

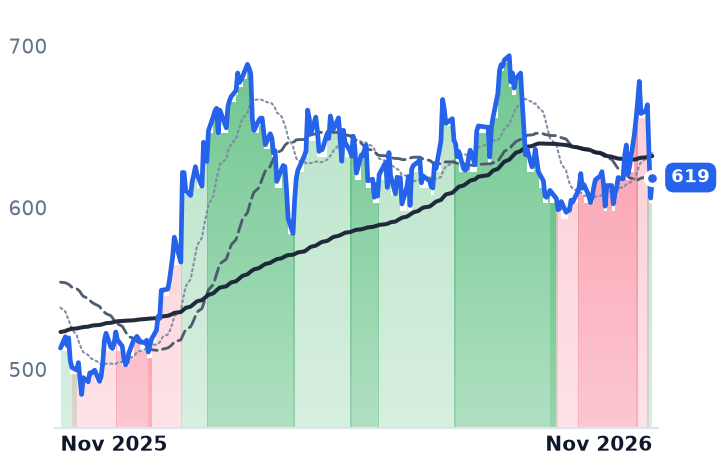
Teledyne held its price, and its results undercut any claim that these four businesses move for a single reason. Its electronic test and measurement revenue declined 6.3% in the September quarter on order timing, even as orders there rose 18% to a record 1.23 times billings. The growth carrying the company comes from elsewhere: Digital Imaging up 14.3% organically, with infrared detectors for space imaging up more than 25%, and defense electronics up 7.4%. "Our third quarter sales and operating earnings were the strongest in Teledyne's history," executive chairman Robert Mehrabian said on October 21, raising full-year guidance for the third consecutive quarter. The stock rose 0.7% over the 30 days and sits at 24.2x forward earnings against 28.3x trailing; it never got expensive and it never fell.

What the results account for, and what they do not

Nothing in the reported numbers accounts for Keysight's drawdown. Two of these four companies raised full-year guidance inside the window, the third set its guidance in August and has not touched it, and nobody disclosed a channel inventory build. The drawdown instead lands on a handful of sessions with named market-wide causes: October 22, when Lam Research's warning about 2027 supply-chain constraints pulled the Nasdaq Composite down 2.18%, and November 5, when that index fell 5.5% and roughly $3tn of S&P 500 market value was erased on doubts that hyperscaler capital spending converts to cash flow.

So a pricing event in the AI complex passed through a group of instrument vendors in proportion to their AI labels. The open question sits on the other side of the ledger: consensus has Keysight growing revenue 14.7% next fiscal year after 33.3% this one, which already assumes the order surge fades, and the wireline AI business carrying that surge is concentrated among a handful of hyperscale customers. An order book running 1.13 times billings is a claim about the next two quarters, not the next five years.

Keysight reports again on November 19. The order line, which has now run ahead of revenue for two consecutive quarters, is where a reader will learn whether the past month was ever about instruments.

Chip Designers Want Their Own CPU Cores: Synopsys Sold Its Processor IP, Arm Now Sells Silicon

Hypothesis Opus 5 · Research Opus 5 · Writing Opus 5 · Prompt v1.7

The layer that gets paid before any silicon ships has split into two businesses with opposite economics. Arm's licensees shipped more than 10 billion chips in a single quarter for the first time and paid only 8% more in royalties, so the blended rate per chip went backwards; licence revenue hit a record, which is the pipeline being sold up front.

Arm's answer to that ceiling is to sell its own data-center processor at a guided gross margin in the high 30s to low 40s, against roughly 97% on licensing. Synopsys took the other exit, selling its processor-core business to GlobalFoundries and citing customers' preference for developing their own processor IP.

The toolchain is not in the same argument. Cadence's backlog stands at a record $8.2bn and its recurring revenue growth doubled to 18%, while the shares de-rated with everything else in the complex.

ARMSNPSCDNSGFSTSMUMCRMBSCPU IP LicensingRISC-V CoresHyperscaler Custom SiliconEDA & Verification ToolsSpecialty Foundry Design WinsData-Center CPU Share
TickerCompanySegmentTrend · 13mo30D1Y
ARMArm Holdings plc American Depositary SharesProcessors & Accelerators🟢 Cont. Bull−38.3%+14.6%
SNPSSynopsysDeveloper Platforms & APIs🔴 Cont. Bear−11.4%+14.5%
CDNSCadence Design SystemsSoftware Development & Design🔴 Cont. Bear−10.0%−1.6%
GFSGLOBALFOUNDRIESFoundries🔴 Cont. Bear−23.6%+13.3%
TSMTaiwan Semiconductor ManufacturingFoundries🟢 Cont. Bull−19.4%+31.8%
UMCUnited MicroelectronicsFoundries🟢 Cont. Bull−39.8%+86.9%
RMBSRambusMemory & Storage🔴 Cont. Bear−32.1%−30.8%

12-month price & trend

ARM
Arm Holdings plc American Depositary Shares
175
+7.90 (+4.74%)
vs. prior close
Price20d50d150d
ARM 12-month price
Processors & Accelerators
SNPS
Synopsys
450
+4.91 (+1.10%)
vs. prior close
Price20d50d150d
SNPS 12-month price
Developer Platforms & APIs
CDNS
Cadence Design Systems
320
+8.49 (+2.73%)
vs. prior close
Price20d50d150d
CDNS 12-month price
Software Development & Design
TickerMkt capP/EP/E fwdP/SP/S fwdP/GPP/GP fwdEV/EBITDAFCF yld
ARM$186.5B200.7x78.7x34.1x30.6x35.8x32.0x141.6x0.6%
SNPS$86.3B78.2x24.0x9.2x7.8x12.7x10.8x25.1x3.2%
CDNS$87.8B63.2x38.1x14.3x13.7x16.7x16.0x37.8x2.0%
GFS
GLOBALFOUNDRIES
38.62
+2.26 (+6.22%)
vs. prior close
Price20d50d150d
GFS 12-month price
Foundries
TSM
Taiwan Semiconductor Manufacturing
375
+7.55 (+2.05%)
vs. prior close
Price20d50d150d
TSM 12-month price
Foundries
UMC
United Microelectronics
13.85
+0.05 (+0.33%)
vs. prior close
Price20d50d150d
UMC 12-month price
Foundries
TickerMkt capP/EP/E fwdP/SP/S fwdP/GPP/GP fwdEV/EBITDAFCF yld
GFS$21.2B107.3x19.9x3.0x2.9x10.3x10.1x10.3x2.0%
TSM$1.9T21.7x—11.2x—17.0x—14.4x2.7%
UMC$34.5B13.5x—4.3x—13.9x—6.7x6.0%
RMBS
Rambus
74.53
+4.85 (+6.96%)
vs. prior close
Price20d50d150d
RMBS 12-month price
Memory & Storage
TickerMkt capP/EP/E fwdP/SP/S fwdP/GPP/GP fwdEV/EBITDAFCF yld
RMBS$8.0B30.3x23.9x10.0x9.5x12.7x12.1x21.8x3.9%

Consensus projections

TickerFY2026EFY2027EFY2028E
ARMRevenue+22.5%+24.5%+36.8%
EPS+7.9%+26.6%+35.9%
SNPSRevenue+38.0%+13.5%+13.9%
EPS+18.2%+23.8%+23.2%
CDNSRevenue+21.3%+14.5%+12.5%
EPS+19.1%+17.2%+15.7%
GFSRevenue+8.0%+12.4%+14.3%
EPS+17.9%+30.4%+33.7%
TSMRevenue+43.9%+38.6%+26.0%
EPS+68.7%+34.6%+27.3%
UMCRevenue+16.3%+25.1%+16.4%
EPS+112.4%−1.4%+25.3%
RMBSRevenue+18.8%+20.9%+25.4%
EPS+24.8%+24.6%+25.8%

Forward fiscal years only. Blank means no analyst coverage for that year.

Arm's partners shipped more than 10 billion Arm-based chips in a single quarter for the first time, and the royalties Arm collected on them grew at the slowest rate in eight quarters. Royalty revenue rose 8% to $670m while shipments rose by 1.5 billion chips year on year. Divide one by the other and the blended rate works out near 6.5 cents a chip, down from roughly 7 cents a year earlier — a derived figure, but the direction is not in dispute, because Arm guided December-quarter royalty growth to the low single digits.

Custom accelerators, chiplets and hyperscaler in-house silicon were supposed to multiply the money collected at the design layer. What the autumn prints show is that the design layer is indeed being paid more, through the invoice for tools and verification hardware rather than through the per-chip rate — and the two companies that owned licensable CPU cores have each found a way out of selling them.

The core is the part customers now build themselves

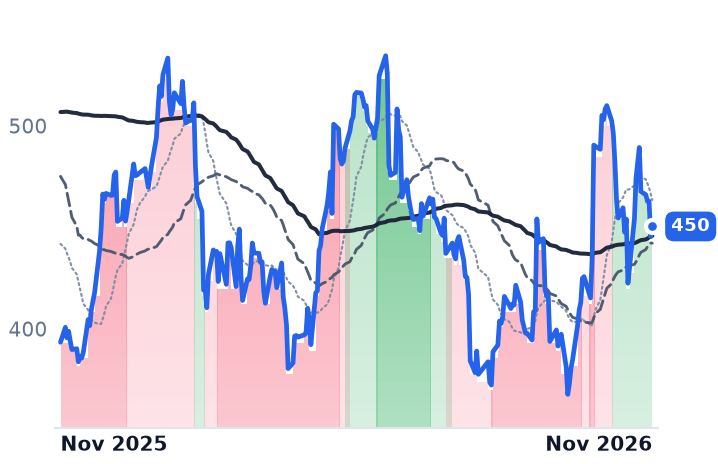
Synopsys, which sells chip-design software and a large silicon IP catalogue, completed the sale of its Processor IP Solutions business to GlobalFoundries on 1 June 2026 for $443.3m — the ARC and ARC-V RISC-V cores, the digital-signal and neural-processing IP, and the MetaWare toolkits. Chief executive Sassine Ghazi cited "customer preference for developing their own processor IP." The divestiture is why Synopsys' backlog slipped sequentially to $10.9bn in the July quarter even as reported revenue grew 42%, most of that from the Ansys acquisition.

What Synopsys kept is the plumbing an in-house design team cannot write itself. Its Design IP segment returned to growth at $474m, up roughly 11%, on a 95% win rate in PCIe 7 interfaces and 25 design wins for the next memory standard.

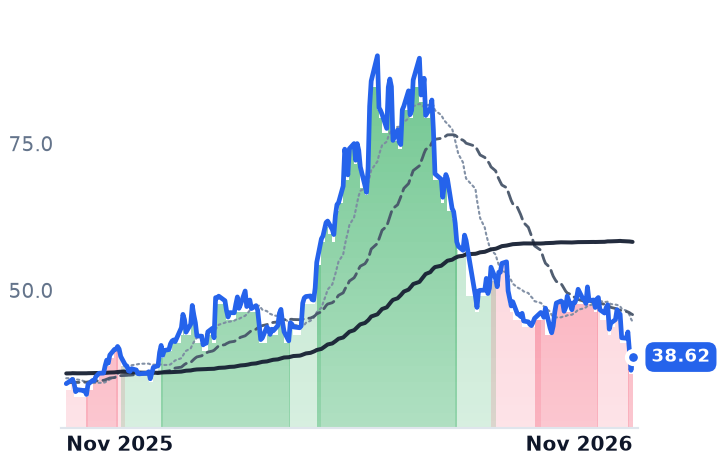
GlobalFoundries, the specialty foundry that bought those cores, is using them to sell design wins rather than only wafers: it booked roughly $1bn of lifetime revenue in third-quarter wins including a RISC-V real-time control processor and a data-center board management controller, with communications infrastructure and data center reaching 17% of revenue, up 81% year on year. "We are absolutely booked out through 2027," chief executive Tim Breen told investors on 4 November.

Arm traded a 97% margin for a 40% one

Arm's response to the same ceiling was to build the chip itself. Its AGI data-center processor, launched on 24 March 2026 with Meta as debut customer, now carries a target of up to $2bn of revenue across fiscal 2027 and 2028, raised from $1bn-plus. "In the past 90 days, we have signed purchase orders from multiple customers and signed supply agreements with companies in our supply chain," chief financial officer Jason Child said on the 4 November call. The guided gross margin is high 30s to low 40s initially, against the 97.1% the licensing business earns.

The per-socket story is real where it works. Data-center royalties doubled year on year, and chief executive Rene Haas told investors that Arm-based server share at the top hyperscalers "has more than tripled from 15% in calendar 2024 to more than 50% in calendar 2025." It is not enough to lift the blend, because the incremental billion-plus units are low-rate edge silicon and because elevated memory prices inflated handset bills of materials, squeezing the smartphone royalty base. Meanwhile licence revenue jumped 50% to a record $773m: four new compute-subsystem deals that convert to royalties in 12 to 24 months, booked as cash today.

Cadence got paid for the same design starts, under contract

Cadence, which sells design software alongside its Palladium emulation and Protium prototyping machines, grew September-quarter revenue 22% and ended the quarter with record backlog of $8.2bn, $4.2bn of it due inside twelve months. Recurring revenue growth doubled to 18% from 11%. The emulation hardware line — the piece that is a capital order from the same hyperscalers whose spending is now being questioned — set another record, and full-year guidance went up to 21% growth with the earnings target lifted $0.30 to $8.40. Reported operating margin fell to 26.2% from 33.8%, which is the Hexagon design-and-engineering integration carrying about $160m of revenue at minimal operating profit this year, against a 44.1% non-GAAP margin.

Chief executive Anirudh Devgan gave the mechanism on 26 October: "TSMC showed their process road map and said in the next 5 years, the chip size will go up by 48x. 48x." Verification work scales with die area whoever owns the core.

Where the markdown was deserved and where it was not

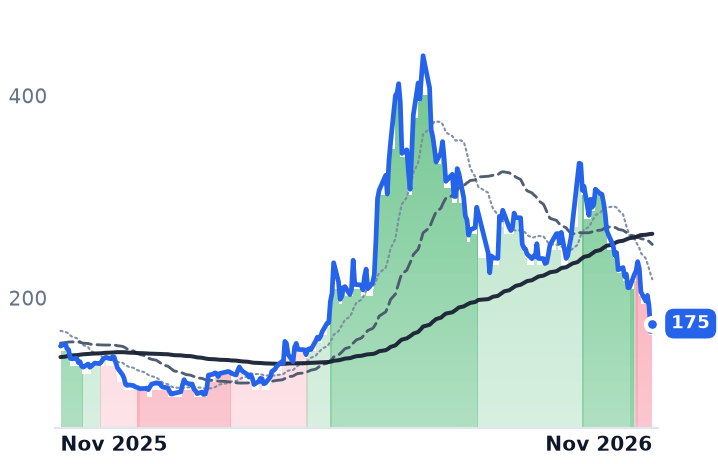
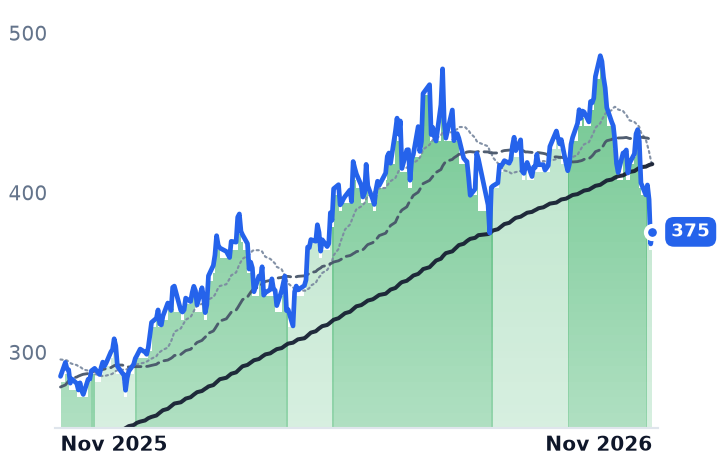
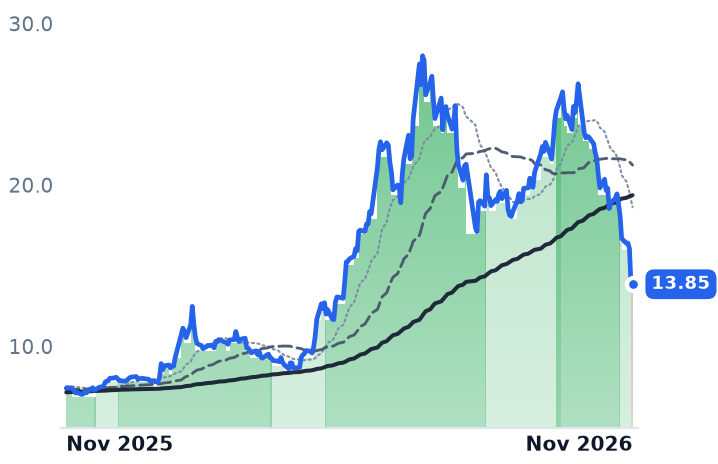
Over thirty days Arm fell 40.7% and sits 61.4% below its 52-week high; Synopsys fell 10.5% and Cadence 10.8%, the two shallowest declines on the shelf, and over three months Synopsys is up 8.3%. Most of the late damage was one session, the 5 November selloff in which the Nasdaq fell 5.52% into correction on the midterm result's implications for the AI buildout, already the complex-wide event this paper described when analog chipmakers caught it.

Arm's de-rating is doing rational work. At $174.62 the shares still cost 78.7x consensus 2027 earnings against 200.7x trailing, while consensus models revenue up 36.8% in fiscal 2028 on a royalty line growing 8% — and the company faces a Qualcomm trial over its licensing terms expected this quarter plus a US Federal Trade Commission antitrust inquiry into its handling of licensees.

Cadence's does not. Its forward earnings multiple is 38.1x on this year's consensus and 32.5x on next year's, against 63.2x trailing and the roughly 50-55x forward it commanded in May, on a contracted book that is larger and converting faster. The split has a cause: Arm's price per chip was fixed years before tape-out and is exposed to what memory costs a handset maker today, while Cadence's is a multi-year subscription plus a machine the customer must buy before the chip exists.

Arm's data-center royalties doubled in the quarter and its blended rate per chip still went down. The licensable core keeps getting more valuable in the sockets where it survives, and fewer designers keep paying per chip for someone else's — which is why the two firms that held those cores each took a different way out, and why the companies selling the tools to build the replacements never had to choose.

Fiserv Still Gets Paid for the Swipe; Toast and Square Are Taking the Software Invoice

Hypothesis Opus 5 · Research Opus 5 · Writing Opus 5 · Prompt v1.7

Clover's payment volume and its swipe pricing both held up last quarter. What shrank was the software and lending sold alongside the terminal, and that is where the margin lives: value-added services fell to 23% of Clover revenue from 26% a year earlier, which is why total Clover revenue grew 1% while its processing line grew 12%.

Earnings week was read as the payments group bottoming. It was not a group event. Two of the six names fell over 30 days, and Fiserv and NCR Voyix supplied 82% of the gain. The three bank-and-merchant processors gave three different answers: Fiserv's organic revenue was flat on a 53.1% gross margin, down 5.8 points; FIS cut 2026 guidance twice over and guided 2027 earnings lower; Jack Henry raised guidance on revenue up 8.8% with operating income up 12.5%. The business that is accelerating is also the most expensive on the group at 23.5x forward earnings.

FISVFISJKHYWSEBRVYXMerchant AcquiringPoint-Of-Sale SoftwareCore Bank ProcessingValue-Added Services AttachStablecoin Settlement RailsGoodwill Impairment Charges
TickerCompanySegmentTrend · 13mo30D1Y
FISVFiservFintech Solutions🔴 Cont. Bear+36.9%−1.3%
FISFidelity National Information ServicesFintech Solutions🔴 Cont. Bear−16.3%−55.0%
JKHYJack Henry & AssociatesFintech Solutions🌱 Emerging Bull+16.2%+8.5%
WSEWiseFintech Solutions🔴 Cont. Bear−4.5%−27.6%
BRBroadridge Financial SolutionsFintech Solutions🌱 Emerging Bull+19.0%−13.3%
VYXNCR VoyixFintech Solutions🌱 Emerging Bull+48.0%−10.6%

12-month price & trend

FISV
Fiserv
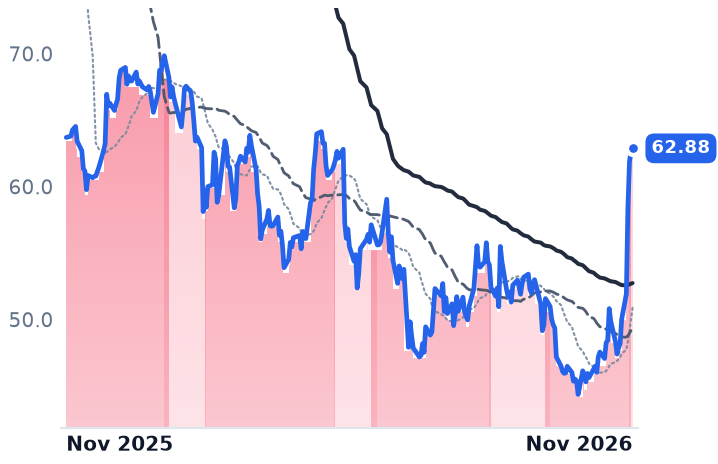
62.88
+0.14 (+0.22%)
vs. prior close
Price20d50d150d
FISV 12-month price
Fintech Solutions
FIS
Fidelity National Information Services
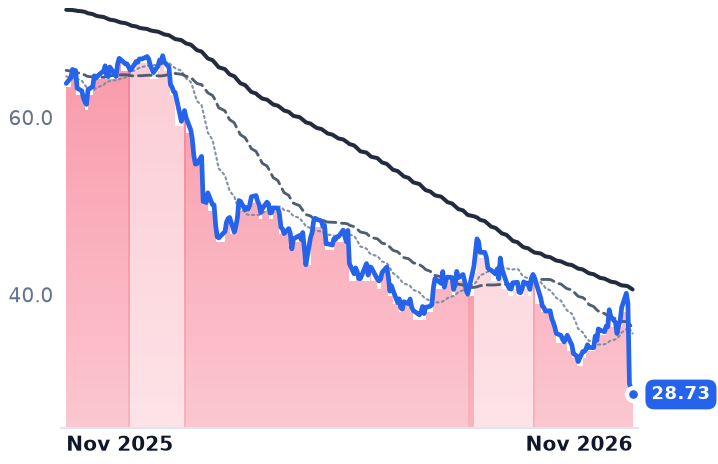
28.73
−0.66 (−2.25%)
vs. prior close
Price20d50d150d
FIS 12-month price
Fintech Solutions
JKHY
Jack Henry & Associates
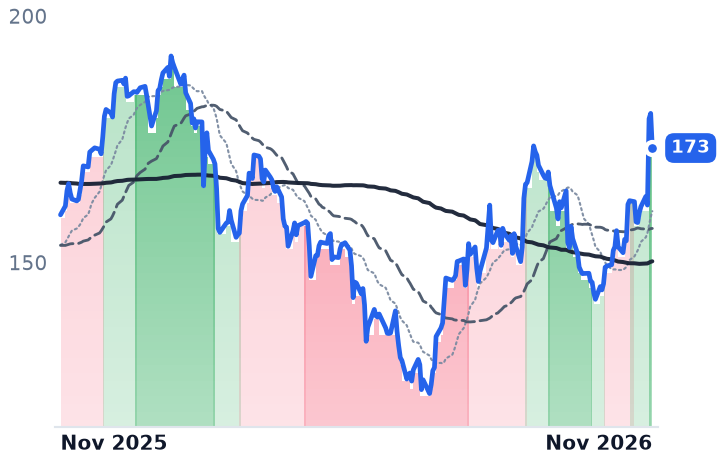
173
−7.03 (−3.90%)
vs. prior close
Price20d50d150d
JKHY 12-month price
Fintech Solutions
TickerMkt capP/EP/E fwdP/SP/S fwdP/GPP/GP fwdEV/EBITDAFCF yld
FISV$33.4Bn/m8.6x1.6x1.7x3.5x3.7x94.3x9.4%
FIS$14.8B4.3x4.6x1.1x1.1x3.2x3.0x7.4x16.2%
JKHY$12.1B23.8x23.5x4.7x4.5x10.7x10.3x13.8x5.9%
WSE
Wise
11.15
−0.03 (−0.22%)
vs. prior close
Price20d50d150d
WSE 12-month price
Fintech Solutions
BR
Broadridge Financial Solutions
190
−3.52 (−1.82%)
vs. prior close
Price20d50d150d
BR 12-month price
Fintech Solutions
VYX
NCR Voyix
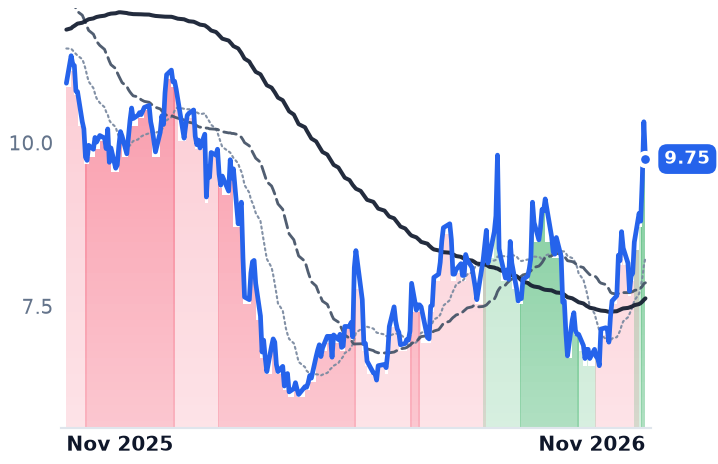
9.75
−0.57 (−5.52%)
vs. prior close
Price20d50d150d
VYX 12-month price
Fintech Solutions
TickerMkt capP/EP/E fwdP/SP/S fwdP/GPP/GP fwdEV/EBITDAFCF yld
WSE$11.2B22.7x19.7x4.0x3.7x6.9x6.5xn/m70.4%
BR$21.5B20.9x18.0x2.8x2.7x9.0x8.7x13.5x6.3%
VYX$1.3B13.4x10.6x0.6x0.6x2.1x2.3x9.6x-10.2%

Consensus projections

TickerFY2026EFY2027EFY2028E
FISVRevenue−1.4%+3.3%+3.5%
EPS−15.0%+9.2%+13.1%
FISRevenue+28.8%+4.3%+3.5%
EPS+7.4%+7.2%+10.1%
JKHYRevenue+7.0%+6.4%+7.0%
EPS+12.6%+7.8%+9.6%
WSERevenue+39.3%+18.6%+18.6%
EPS−7.1%+15.1%+18.1%
BRRevenue+8.0%+5.8%+4.8%
EPS+12.5%+10.6%+9.4%
VYXRevenue−17.2%−1.3%+1.4%
EPS+4.3%+12.0%+0.4%

Forward fiscal years only. Blank means no analyst coverage for that year.

The swipe held, the software did not

Fiserv's terminals processed more volume last quarter and the company earned almost nothing extra for it. Clover, the point-of-sale system Fiserv sells to roughly 700,000 businesses in eight countries, grew processing revenue 12% on gross payment volume up about 10%, while total Clover revenue grew 1%. The gap is the attach: value-added services, meaning software subscriptions and Clover Capital lending, declined 3% and fell to 23% of Clover revenue from 26%, after growing 18% at 27% of the mix in the first quarter.

The 30-day bounce in this corner of financial technology was read as payments bottoming, a year after investors began marking the sector down on the fear that stablecoin rails would disintermediate card settlement. The November prints point somewhere nearer and duller. The invoice is being reassembled one layer above the rail, by whoever sells the merchant its software, and in bank processing by whoever wins the renewal. Scale at the terminal is not the constraint: Clover's annualized volume of $272bn runs ahead of Square's $220bn and Toast's $135bn, and the same reporting has Clover losing to vertical specialists like Toast among the larger, more attractive small businesses.

Fiserv's group organic revenue was flat, with Merchant Solutions organic revenue down 2% and gross margin of 53.1% against 58.9% a year earlier. A $6.45bn non-cash goodwill impairment, triggered by the sustained decline in its own market capitalization, opened a $12.92 gap between GAAP earnings of -$11.17 a share and the adjusted $1.75. Year-to-date free cash flow conversion is running near 71% against a 90% full-year target. Management reaffirmed 2026 adjusted earnings of $7.20 to $7.40 and doubled its cost program. "We have identified a total of $1 billion in savings opportunities, up from the prior $500 million," chief financial officer Paul Todd told investors on November 3. At $62.88 the shares sit on 8.6x consensus 2026 earnings of $7.27 — the cheapest conventional multiple in the group — but forward price-to-gross-profit of 3.7x sits above the trailing 3.5x, which is the market saying gross profit shrinks from here.

A renewal business, not a price list

FIS, which hosts core processing for more than 90m bank accounts, shows the bank-side version. Reported revenue rose 27.1%, almost all of it the Worldpay and issuer-asset reshuffle; on a pro-forma basis revenue grew 3.7% and recurring revenue 2.5%, with Banking recurring revenue decelerating to 2.4% as fewer than ten large clients pushed contracted go-lives into late 2026 and 2027. Non-recurring revenue grew 22.8% on one-off distribution partnerships. Preliminary 2027 guidance strips that out: banking revenue flat to up 1%, adjusted earnings down high-single to low-double digits. "The massive swing factor is this 250 to 300 basis points on nonrecurring," chief financial officer James Kehoe said on November 4, the day before his departure took effect. "Simplistically, take 3% of 13.5 billion, that is a $400 million change."

Price itself is holding — renewal rates in the high 90s, up 100 basis points, with 72% of issuing revenue contracted through 2029 or beyond. The account base is the problem, shrunk by bank consolidation that paid FIS termination fees on the way out. The shares fell 23.2% on November 4 as J.P. Morgan cut its rating to Neutral and its target to $38 from $53. Against $20.8bn of debt at 3.5x leverage and a suspended buyback, 7.4x trailing EV/EBITDA and 0.91x book are doing rational work; the 16.2% trailing equity free-cash-flow yield compresses to roughly 6% measured on enterprise value.

Jack Henry is winning the renewals it needs

Jack Henry, which sells core platforms and card processing to US banks and credit unions, took revenue up 8.8% with operating income up 12.5% and raised fiscal 2027 guidance to 6.6-7.4% non-GAAP revenue growth. It booked 9 competitive core wins against 4 a year earlier, 63% of them bundling core, digital and card. "A lot of our wins recently have been longtime clients of that particular provider. A couple of them were 28-year clients," chief executive Greg Adelson said on November 4. The buyer's budget is cooperating: the Bank Director 2026 technology survey it cited found 81% of banks raising technology spending, up from 71%, at a median 10% increase. Jack Henry, Fiserv and FIS together serve roughly 70-72% of US banks and are each launching or consolidating platforms rather than cutting price. At 23.5x forward earnings against 7-8% guided earnings growth, it is the dearest name in the group and has no re-rating left in the number.

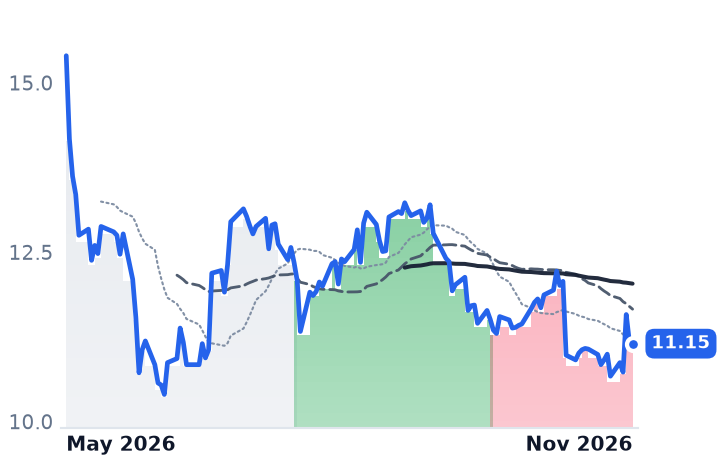
The one company that discloses what a transaction earns is cutting it deliberately. Wise, the cross-border transfer business, ran a 49 basis point take rate, down 3 basis points year on year, and grew revenue 21% in constant currency on volume of $72bn. "We follow the cost-plus margin logic, and we are in a driving seat," chief financial officer Emmanuel Thomassin said on October 15. Wise raised guidance and its shares still fell 5.6% over the month.

What the move actually bought

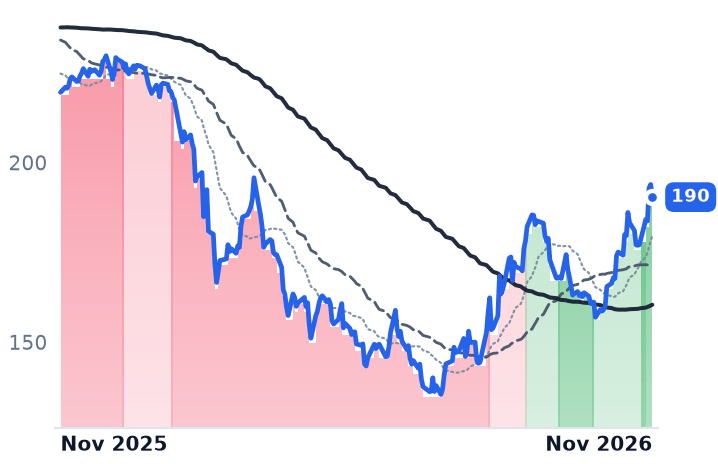
So the group average is carried by two names and one week. Excluding Fiserv and NCR Voyix — whose own gain follows a hardware exit that took revenue down 21.2% while lifting gross margin — the other four averaged 4.5%, and Broadridge's contribution rests on a November 2 mandate to supply the governance layer and digital transfer agency for the New York Stock Exchange's planned tokenized equity marketplace, which has nothing to do with payment transactions.

Results account for the whole of Jack Henry's move and the whole of FIS's fall. They do not account for Fiserv's. A 38.8% gain on flat organic revenue, compressing gross margin and conversion below target is buying a fourth quarter in which Merchant organic growth is guided at 6-8%, from minus 2%. Each 1x of 2027 earnings is 12.6% of today's price, so the multiple, not the attach rate, is still what the position depends on.

Fiserv told investors it takes nine to twelve months for better bank retention to show up in revenue. The repricing of its shares took one earnings week.

Zebra Is Paying for Memory Inflation With a 15% Price Rise, Not With Software Revenue

Hypothesis Opus 5 · Research Opus 5 · Writing Opus 5 · Prompt v1.7

Zebra's best growth quarter of the year arrived with its thinnest gross margin of the year, and the market treated the combination as a warning rather than a result. Revenue rose 22.3% in the quarter ended 3 October while gross margin fell to 45.7%, as the company's full-year memory-cost headwind grew to $145m.

The offset is price: an October increase on mobile computing worth about 1.5 points of 2027 revenue, with software still a low single-digit percentage of sales. That is a hardware business re-pricing its bill of materials and telling investors the cost pressure continues next year. Digi International, in the same corner of enterprise connectivity, books $191m of recurring revenue and expands margin as it grows; its fiscal fourth quarter lands 11 November.

ZBRADGIIITRNMUDELLCGNXHONITRISPYDRAM Contract PricingComponent Cost Pass-ThroughEnterprise Mobile ComputingRecurring Revenue MixWarehouse & Logistics Automation
TickerCompanySegmentTrend · 13mo30D1Y
The subject · what this brief is about
ZBRAZebra TechnologiesSpecialized Wireless & IoT🟢 Cont. Bull−15.1%+24.1%
DGIIDigi InternationalSpecialized Wireless & IoT🟢 Cont. Bull−14.9%+78.6%
ITRNIturan Location and ControlRegional & Specialty Operators⚠️ Emerging Bear−3.8%+35.1%
Compared against · context, not the story
MUMicron TechnologyMemory & Storage🟢 Cont. Bull−35.3%+190.3%
DELLDell TechnologiesEnterprise Servers🟢 Cont. Bull−43.7%+125.6%
CGNXCognexTest & Measurement⚠️ Emerging Bear−20.7%+22.9%
HONHoneywell InternationalAerospace & Building Technology⚠️ Emerging Bear+6.9%+14.6%
ITRIItronSensors & Actuators🌱 Emerging Bull+16.6%−6.5%
SPYState Street SPDR S&P 500 ETF TrustAsset Management🟢 Cont. Bull−4.6%+10.7%

12-month price & trend

ZBRA
Zebra Technologies
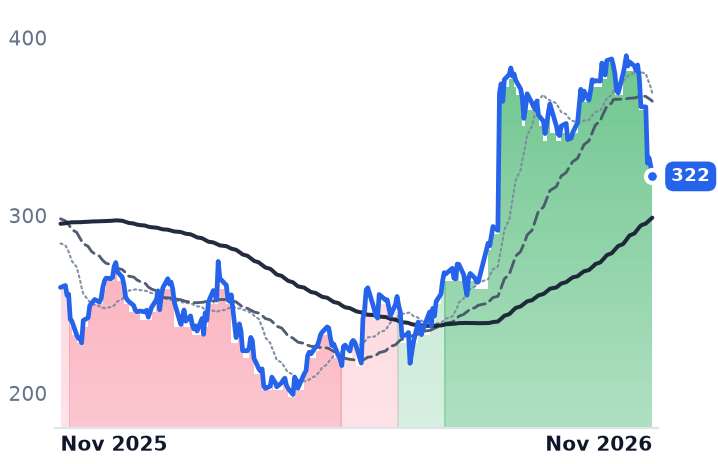
322
−5.93 (−1.81%)
vs. prior close
Price20d50d150d
ZBRA 12-month price
Specialized Wireless & IoT
DGII
Digi International
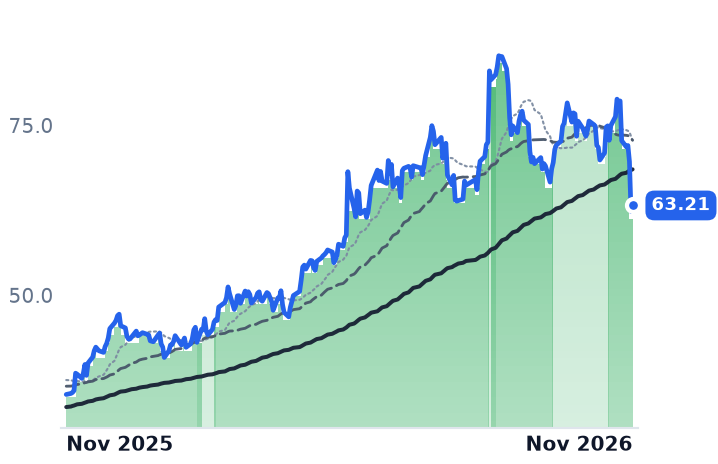
63.21
+0.87 (+1.40%)
vs. prior close
Price20d50d150d
DGII 12-month price
Specialized Wireless & IoT
ITRN
Ituran Location and Control
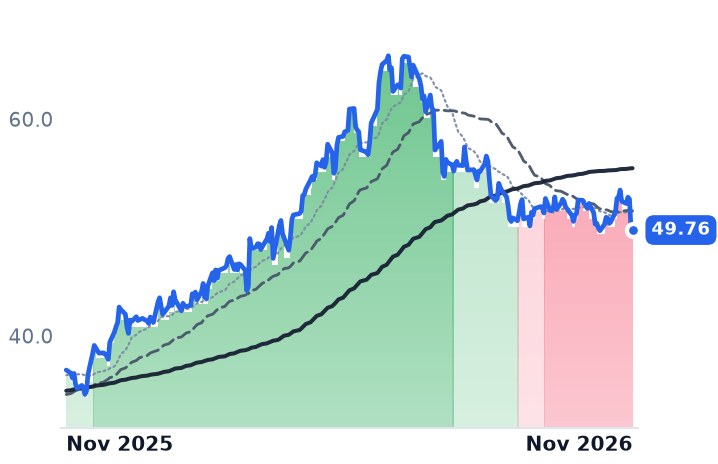
49.76
−0.17 (−0.34%)
vs. prior close
Price20d50d150d
ITRN 12-month price
Regional & Specialty Operators
TickerMkt capP/EP/E fwdP/SP/S fwdP/GPP/GP fwdEV/EBITDAFCF yld
ZBRA$15.2B26.5x15.2x2.5x2.4x5.1x5.0x15.9x6.5%
DGII$2.4B48.6x20.2x4.7x4.1x7.4x6.5x22.4x5.6%
ITRN$987.0M15.4x13.9x2.5x2.4x5.0x4.7x8.4x8.4%
MU
Micron Technology
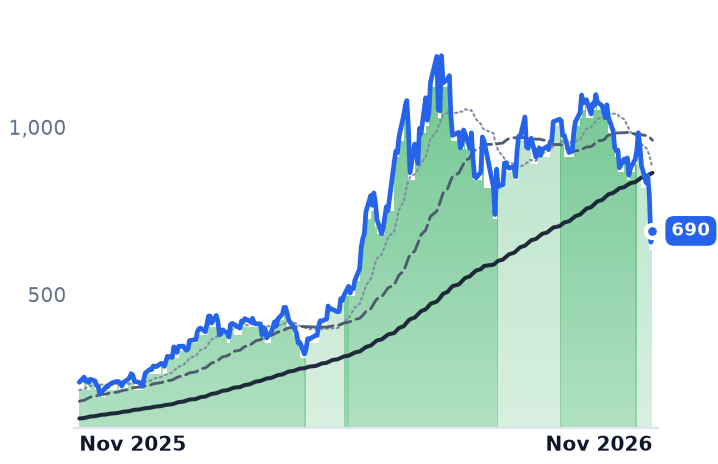
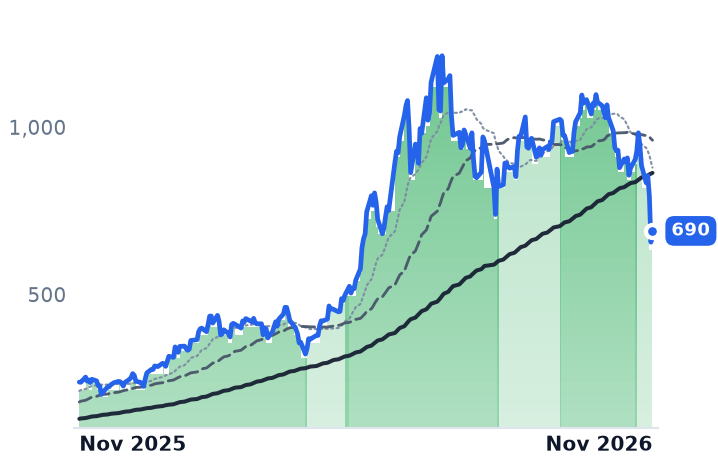
690
+33.61 (+5.12%)
vs. prior close
Price20d50d150d
MU 12-month price
Memory & Storage
DELL
Dell Technologies
329
+11.62 (+3.67%)
vs. prior close
Price20d50d150d
DELL 12-month price
Enterprise Servers
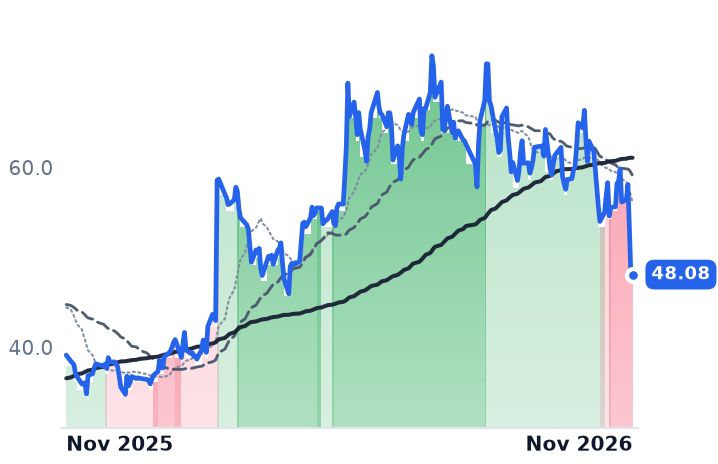
CGNX
Cognex
48.08
+0.59 (+1.23%)
vs. prior close
Price20d50d150d
CGNX 12-month price
Test & Measurement
TickerMkt capP/EP/E fwdP/SP/S fwdP/GPP/GP fwdEV/EBITDAFCF yld
MU$1.0T19.9x12.2x11.2x7.8x15.4x10.7x14.5x2.6%
DELL$373.9B32.2x21.7x2.5x1.9x12.5x9.7x21.6x2.3%
CGNX$8.1B33.4x28.6x7.2x7.1x10.3x10.1x23.9x3.5%
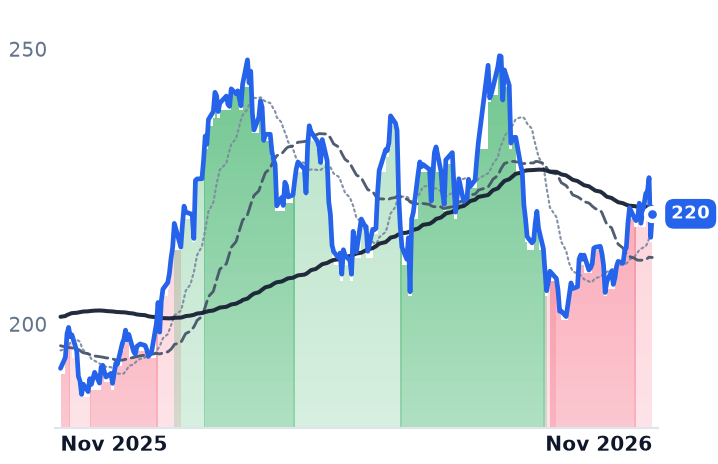
HON
Honeywell International
220
+4.27 (+1.98%)
vs. prior close
Price20d50d150d
HON 12-month price
Aerospace & Building Technology
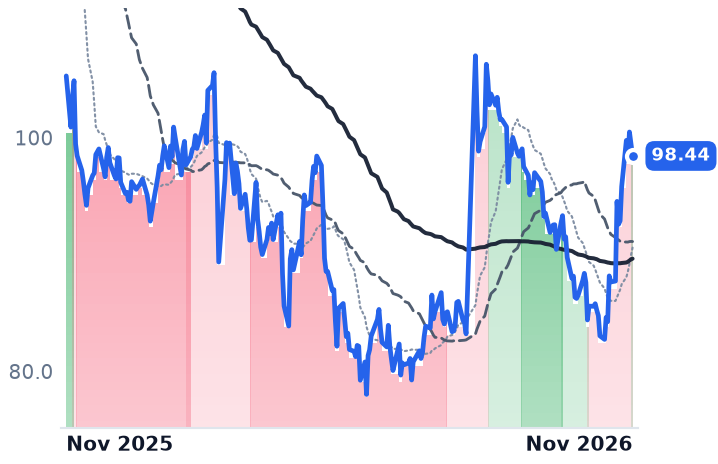
ITRI
Itron
98.44
−1.02 (−1.03%)
vs. prior close
Price20d50d150d
ITRI 12-month price
Sensors & Actuators
SPY
State Street SPDR S&P 500 ETF Trust
739
−14.45 (−1.92%)
vs. prior close
Price20d50d150d
SPY 12-month price
Asset Management
TickerMkt capP/EP/E fwdP/SP/S fwdP/GPP/GP fwdEV/EBITDAFCF yld
HON$65.8B8.1x25.0x1.8x3.3x5.0x8.9x7.0x6.3%
ITRI$3.7B14.1x13.3x1.6x1.6x4.1x3.9x7.9x10.2%
SPY$773.0B————————

Consensus projections

TickerFY2026EFY2027EFY2028E
ZBRARevenue+16.5%+6.6%+4.6%
EPS+34.1%+5.7%+8.3%
DGIIRevenue+24.8%+8.7%+4.5%
EPS+31.4%+16.3%+8.4%
ITRNRevenue+16.5%+5.4%+7.5%
EPS+23.8%+8.6%+9.4%
MURevenue+248.0%+92.8%+11.4%
EPS+804.9%+111.2%+7.9%
DELLRevenue+16.2%+73.9%+20.9%
EPS+27.3%+159.7%+19.4%
CGNXRevenue+16.8%+11.0%+10.8%
EPS+74.9%+17.9%+14.5%
HONRevenue−48.2%+1.8%+5.1%
EPS−21.2%+18.4%+13.0%
ITRIRevenue+1.3%+6.8%+5.7%
EPS−6.4%+9.3%+14.6%

Forward fiscal years only. Blank means no analyst coverage for that year.

Zebra Technologies beat its own quarter on 3 November and fell 8.8% in the session. The maker of barcode scanners, enterprise mobile computers and thermal label printers, sold to retailers, warehouse operators and hospitals, told investors memory prices would keep climbing into 2027, and that its answer is a price increase taken in October.

The shares had held an uptrend since the start of July, read as an enterprise device refresh cycle with recurring software riding on top of it. The quarter tests the second half of that. Zebra's full-year memory-cost headwind rose to $145m from a prior estimate of $120m, entirely because mobile-computing volumes came in higher, and on the call management put software revenue at a low single-digit percentage of the total. The component shock is being absorbed on the invoice, because there is no subscription meter to absorb it instead.

The memory bill became a price list

Revenue of $1.614bn in the quarter ended 3 October, reported to the SEC on an 8-K, was up 22.3%, and operating margin improved to 14.7% from 13.9%. Gross margin went the other way: 45.7%, against 48.0% a year earlier. Conventional dynamic random-access memory contract prices rose 90-95% quarter on quarter early in 2026, with memory forecast to absorb 68% of major cloud providers' capital spending in 2027 — device makers now bid for parts against hyperscalers. Of roughly $50m of memory cost in the quarter, pricing offset about $25m, with more than $55m mitigated by restructuring, productivity and currency.

"It generates about a 15% increase on our mobile computing products," Nathan Winters, Zebra's chief financial officer, said of the October action on the 3 November call. That increase is expected to add roughly 1.5 points to 2027 revenue. On the same call, chief executive Bill Burns said: "We would expect growth, as you suggested, for 2027 to be at the high end of our long-term guidance range" — a range of 5-7%. At the top of it, by that arithmetic, about a fifth of next year's growth is Zebra's own cost inflation handed to its buyers.

Demand is real, and it is hardware demand

Not all of the quarter was price. Organic growth was about 11% of the reported 22.3%, with the Connected Frontline segment up 35% in total but 15% organically after the Elo Touch acquisition, and Asset Visibility & Automation up 7%. Transportation and logistics was the fastest-growing end market, with a refresh cycle beginning in 2027. Executives said they had seen no revenue effect from customers pulling orders forward ahead of the increase, and described demand as broad-based across regions and both segments. Inventory rose about $90m on memory stocking; five new memory suppliers have been qualified against a target of five to seven sources for each memory type. Backlog and pipeline support 10-14% growth in the current quarter, and full-year sales growth guidance went to about 17%.

What none of it produces is a recurring line. Zebra's Frontline artificial-intelligence products were described as drivers of device refresh rather than as a subscription business of their own.

Digi's meter runs on its own clock

Digi International, which sells cellular routers and embedded modules alongside a cloud device-management subscription, is the counterexample in the same niche. Its annualized recurring revenue reached $191m at the end of June, up 52% from $126m and roughly a third of annualized revenue, with gross margin at 64.8% and rising. About $20m of that recurring base arrived with the Particle acquisition, so organic growth is nearer the mid-30s percent. Digi traded below its 200-day moving average on 6 November with no company fundamentals since August; results land 11 November. It trades on 20.2x forward earnings against 48.6x trailing.

What is being repriced is 2027, not the quarter

Zebra's shares fell 15.3% over 30 days against a 5% decline in the S&P 500, and almost all of it sits in two sessions: the post-earnings drop on roughly double normal volume, after Zebra warned memory prices would keep rising, and the 5 November unwind of the artificial-intelligence hardware trade that took the index down 4.4%.

At 15.2x forward earnings against 26.5x trailing, Zebra sits below its own stated five-year history of 20-25x. The gap is what consensus expects: earnings per share of $21.24 this year, then growth of 5.7% next. The forward figure already assumes 2026 does not repeat, which is also what Burns guided to.

So the results account for the direction of the business and not for the direction of the shares. Zebra converts installed devices into reorders at a price it sets, and it has just demonstrated it can set one; Digi converts installed devices into renewals it collects monthly, at a gross margin nearly twenty points higher. The first depends on when customers decide to replace equipment. The second does not.

Zebra has qualified five new memory suppliers and is hunting more. That is a procurement answer to a margin problem, and a sound one. It still leaves the top line waiting on a decision made in somebody else's warehouse.

Okta Doubled on Margins, Not Growth; Rubrik's Meter Is the One Accelerating

Hypothesis Opus 5 · Research Opus 5 · Writing Opus 5 · Prompt v1.7

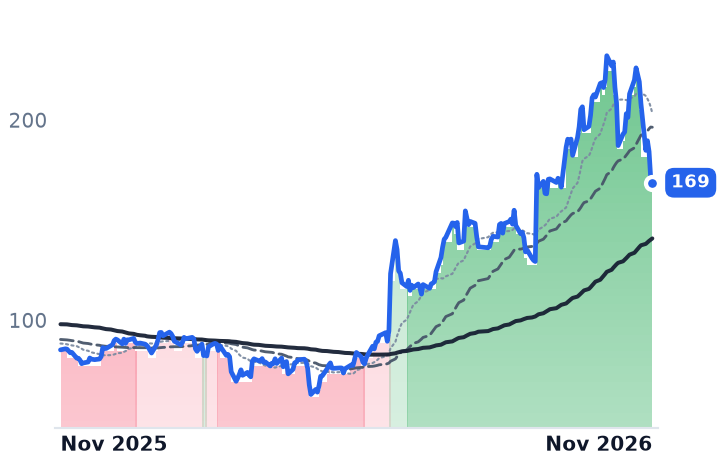
Two security-software names held their uptrends through a brutal week for infrastructure software, and the market has paid up for the weaker contracted book. Okta's revenue growth slowed for a fourth consecutive quarter, to 10.6%, while its shares more than doubled over six months; the confirming line is margin, with operating income up 161% and free cash flow at a 28% margin.

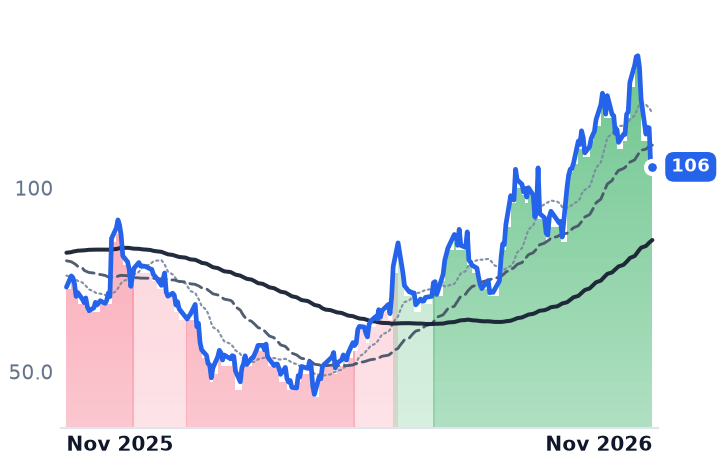
Rubrik, billed on data under management rather than per user, grew subscription annual recurring revenue 33% to $1.66bn with net retention above 119%, against flat 107% retention and 14% contracted-revenue growth at Okta, guided back down to 11-12%. The agentic story both rallied on sits in neither revenue line: Okta's finance chief called agent revenue immaterial for this fiscal year.

Rubrik has the better meter and the dearer price, at 17.60x trailing gross profit against Okta's 11.74x.

OKTARBRKCRWDPANWZSSAILNETNOWSNOWCyber Recovery & BackupConsumption-Based PricingSaaS Margin ExpansionAgentic AI InfrastructureNet Revenue Retention
TickerCompanySegmentTrend · 13mo30D1Y
The subject · what this brief is about
OKTAOktaIdentity & Access Management🟢 Cont. Bull−23.4%+98.0%
RBRKRubrikStorage, Backup & Data Management🟢 Cont. Bull−11.9%+44.8%
Compared against · context, not the story
CRWDCrowdStrikeCybersecurity & Threat Protection🔴 Cont. Bear−17.5%−59.8%
PANWPalo Alto NetworksCybersecurity & Threat Protection🟢 Cont. Bull−23.4%+47.8%
ZSZscalerCybersecurity & Threat Protection🌱 Emerging Bull−7.6%−37.1%
SAILSailPointIdentity & Access Management🟢 Cont. Bull−3.6%−2.9%
NETCloudflareCybersecurity & Threat Protection🟢 Cont. Bull−23.1%+15.4%
NOWServiceNowSales, Service & Customer Management🟢 Cont. Bull−26.3%−40.8%
SNOWSnowflakeData, Analytics & Intelligence🟢 Cont. Bull−20.6%+3.1%

12-month price & trend

OKTA
Okta
169
−2.47 (−1.44%)
vs. prior close
Price20d50d150d
OKTA 12-month price
Identity & Access Management
RBRK
Rubrik
106
+0.01 (+0.01%)
vs. prior close
Price20d50d150d
RBRK 12-month price
Storage, Backup & Data Management
CRWD
CrowdStrike
217
−0.30 (−0.14%)
vs. prior close
Price20d50d150d
CRWD 12-month price
Cybersecurity & Threat Protection
TickerMkt capP/EP/E fwdP/SP/S fwdP/GPP/GP fwdEV/EBITDAFCF yld
OKTA$28.2B99.8x42.9x9.2x8.7x11.7x11.2x66.7x3.4%
RBRK$21.8Bn/m210.2x14.1x12.9x17.6x16.1xn/m1.5%
CRWD$222.1B—173.0x41.2x37.0x54.7x49.1x498.8x0.7%
PANW
Palo Alto Networks
314
−0.83 (−0.26%)
vs. prior close
Price20d50d150d
PANW 12-month price
Cybersecurity & Threat Protection
ZS
Zscaler
201
−5.34 (−2.58%)
vs. prior close
Price20d50d150d
ZS 12-month price
Cybersecurity & Threat Protection
SAIL
SailPoint
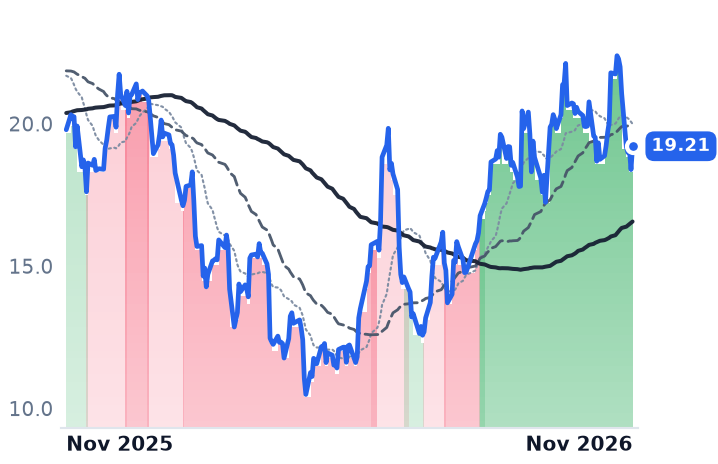
19.21
+0.82 (+4.46%)
vs. prior close
Price20d50d150d
SAIL 12-month price
Identity & Access Management
TickerMkt capP/EP/E fwdP/SP/S fwdP/GPP/GP fwdEV/EBITDAFCF yld
PANW$256.9B682.3x75.0x22.4x18.1x31.8x25.8x166.8x1.6%
ZS$31.9Bn/m40.4x9.5x8.1x12.4x10.6x176.0x2.7%
SAIL$11.5Bn/m—9.9x—14.9x—n/m1.6%
NET
Cloudflare
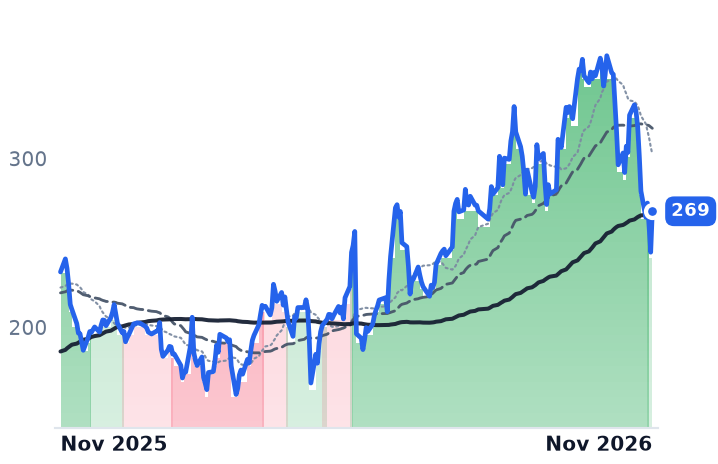
269
+24.24 (+9.91%)
vs. prior close
Price20d50d150d
NET 12-month price
Cybersecurity & Threat Protection
NOW
ServiceNow
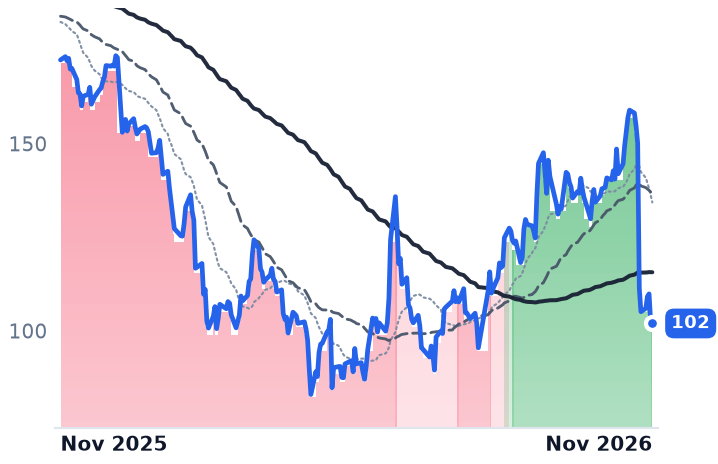
102
−0.39 (−0.38%)
vs. prior close
Price20d50d150d
NOW 12-month price
Sales, Service & Customer Management
SNOW
Snowflake
271
+0.70 (+0.26%)
vs. prior close
Price20d50d150d
SNOW 12-month price
Data, Analytics & Intelligence
TickerMkt capP/EP/E fwdP/SP/S fwdP/GPP/GP fwdEV/EBITDAFCF yld
NET$128.1Bn/m286.2x51.0x44.7x70.3x61.5x—0.3%
NOW$105.8B72.8x25.8x6.9x6.5x9.4x8.9x32.6x4.5%
SNOW$114.0Bn/m148.5x21.0x18.0x31.3x26.9xn/m1.0%

Consensus projections

TickerFY2026EFY2027EFY2028E
OKTARevenue+12.0%+10.8%+9.9%
EPS+24.3%+14.1%+10.6%
RBRKRevenue+48.7%+32.0%+21.5%
EPS−90.5%−389.4%+53.1%
CRWDRevenue+22.2%+25.0%+22.9%
EPS−1.2%+35.0%+27.9%
PANWRevenue+24.3%+24.0%+14.3%
EPS+15.5%+10.7%+16.1%
ZSRevenue+25.2%+17.9%+16.3%
EPS+29.2%+18.3%+14.7%
NETRevenue+33.7%+28.4%+27.0%
EPS+38.1%+32.6%+34.3%
NOWRevenue+22.6%+18.5%+18.1%
EPS+13.5%+21.6%+22.2%
SNOWRevenue+29.4%+35.7%+28.9%
EPS+72.3%+82.7%+36.2%

Forward fiscal years only. Blank means no analyst coverage for that year.

Okta's revenue growth has decelerated for four consecutive quarters, and the shares still more than doubled in the six months to 6 November. Revenue at the identity company, which sells single sign-on, multi-factor authentication and the acquired Auth0 developer portfolio to enterprises and governments on annual subscriptions, rose 10.6% year over year in the July quarter, the slowest of the four. What moved was margin: gross margin reached 79.6% against 76.9% a year earlier, operating margin 13.3% against 5.6%, and operating income grew 161%.

The advance in Okta and in Rubrik, which sells cyber-recovery software priced on the volume of data under management rather than per user, has been read as proof that identity and backup are the meters agentic AI feeds: every autonomous agent has to authenticate like an employee, and everything it writes has to be recoverable, while workflow software loses human seats. Neither income statement carries that revenue yet. Asked about agent-identity revenue on the 26 August call, Okta chief financial officer Brett Tighe answered "Still immaterial," and said AI-related revenue stays immaterial through fiscal 2027 with a meaningful contribution possible only in fiscal 2028 and beyond, according to the company's transcript. Okta for AI Agents went generally available on 30 April and has closed dozens of deals, several of them worth more than $1m.

Okta's order book is being guided down, not up

Current remaining performance obligation, the contracted revenue Okta expects to recognize within a year and the closest thing it prints to a forward order book, reached $2.585bn, up 14%, ahead of billed revenue. Management guided that growth back to 11-12% for the following quarter. Trailing net retention was flat at 107%. Customers paying more than $100,000 a year grew 6%, to 5,255, while those above $1m grew 22% to more than 600, so the base is concentrating rather than widening. Free cash flow was $227m, a 28% margin against 22% a year earlier. Consensus carries 9.9% revenue growth for the year to January 2028.

The fast-growing bookings line Okta does disclose is a different product set: governance, privileged access and threat protection were 30% of bookings in the quarter at roughly 40% average uplift per deal, up from about 25% in the April quarter. Agent sign-on was folded into the core product at the Oktane conference in September rather than sold as a separate machine-identity line, and chief executive Todd McKinnon told that audience on 23 September that in agent identity "there is going to be massive growth and the market share is going to be set probably in three years."

Rubrik's contracted book accelerated in the same quarter

Rubrik's subscription annual recurring revenue grew 33% to $1.66bn at 31 July, with net new subscription ARR up 35% and subscription net retention above 119%. Customers paying $100,000 or more rose 23% to 3,084 and supply 88% of subscription ARR; cloud is 89% of the mix and grew 39%. Dividing those disclosures gives roughly $474,000 of ARR per large customer against about $438,000 a year earlier, so most of the 33% is landing and graduating big accounts and about a quarter of it is deeper spend inside them.

The income statement is the weaker half. Revenue growth decelerated to 37.9%, gross margin slipped to 78.4% from 79.5% so gross profit grew more slowly than revenue, and the GAAP operating margin was still minus 16.8% on a $61.8m quarterly loss. Rubrik is also not the share leader in backup: Gartner's 2026 Magic Quadrant places Veeam, Rubrik, Commvault and Cohesity in the Leaders quadrant with Veeam ahead, and Veeam reported over $2.1bn of ARR for 2025. Its own agentic product, Code Guardian, which runs Anthropic's Claude through a security harness against cloned copies of customer code repositories, was expanded on 9 October and remains in private preview.

The faster meter carries the dearer price

Rubrik trades at 17.60x trailing gross profit, against 10.48x in early May and 15.59x in early September. It is the one multiple in the pair that kept expanding through the autumn drawdown, and it expanded faster than the 36% growth in gross profit underneath it. Okta's equivalent is 11.74x, more than double its early-May level near 5x but below 13.50x on 25 September. On forward revenue Okta stands at 8.75x against roughly 6.9x in mid-July, when the shares were $139.53.

Both gave back a fifth or more of the advance in October and November. Okta closed 27.3% below its 9 October high of $232.13 and Rubrik 22.2% below its 28 October high of $136.00, with the sharpest session on 5 November, when the Nasdaq Composite fell 5.52% on doubts about AI data-center spending and the whole security complex sold together. No company news for either name was discoverable in that window. Okta fell 11.2% on 2 November, three days after S&P Dow Jones Indices said it would join the S&P 500. Both have held uptrends since June, which Palo Alto Networks and ServiceNow lost in that single November session; Zscaler, billed per user per year, held one too, so survival does not sort by pricing basis. CrowdStrike, billed per endpoint, grew revenue 25.8% with record net new ARR up 51% in its July quarter, faster than either protagonist's contracted book.

Strip the agent premium out of both and what is left is one accelerating meter and one fading one. Okta's margins account for the profitability half of its doubling and nothing of the growth half, because its base is human seats sold against Microsoft's bundled Entra, where 107% retention is what a mature directory earns. Rubrik's 119% retention compounds instead, because protected capacity inside an account grows whether or not the headcount does, and that is the business the market has priced the more expensively of the two.

The test arrives in the same week for both. Okta reports third-quarter results on 1 December and Rubrik on 3 December, which settles the question of whose quarter had merely printed first.

DraftKings Is Spending Its Entire 2026 Profit to Build a Prediction Market

Hypothesis Opus 5 · Research Opus 5 · Writing Opus 5 · Prompt v1.7

DraftKings' sportsbook is keeping more of each wagered dollar than it did a year ago, and the company has still told investors that this year's profit is gone. Sportsbook net revenue rose 36% on 12% handle growth as the margin the book earns on handle widened to 6.4%.

The money left below that line. Full-year adjusted earnings guidance swung from a profit to a loss on a $650-700m investment in its prediction exchange, with core profit described as on track.

Flutter is handing its parlay gains back as promotional credit and has guided FanDuel's US net revenue margin flat for 2027. Rush Street, three-quarters online casino, grew revenue 38.8%, reiterated guidance and fell hardest of the three. The squeeze is in customer acquisition.

DKNGFLUTRSIDigital Sports BettingPrediction MarketsOnline Casino GrowthCustomer Acquisition CostsPromotional Spend Squeeze
TickerCompanySegmentTrend · 13mo30D1Y
DKNGDraftKingsDigital Sports Betting & iGaming🔴 Cont. Bear−4.8%−33.8%
FLUTFlutter EntertainmentDigital Sports Betting & iGaming🔴 Cont. Bear+6.3%−62.3%
RSIRush Street InteractiveDigital Sports Betting & iGaming⚠️ Emerging Bear−39.3%−25.8%

12-month price & trend

DKNG
DraftKings
18.51
−5.01 (−21.30%)
vs. prior close
Price20d50d150d
DKNG 12-month price
Digital Sports Betting & iGaming
FLUT
Flutter Entertainment
81.70
−1.27 (−1.53%)
vs. prior close
Price20d50d150d
FLUT 12-month price
Digital Sports Betting & iGaming
RSI
Rush Street Interactive
12.28
+0.38 (+3.19%)
vs. prior close
Price20d50d150d
RSI 12-month price
Digital Sports Betting & iGaming
TickerMkt capP/EP/E fwdP/SP/S fwdP/GPP/GP fwdEV/EBITDAFCF yld
DKNG$9.2Bn/m—1.4x1.4x3.5x3.4xn/m3.5%
FLUT$14.2Bn/m18.7x0.8x0.8x2.0x1.9x21.8x5.4%
RSI$3.4B35.7x20.1x2.3x2.2x6.5x6.1x14.0x6.1%

Consensus projections

TickerFY2026EFY2027EFY2028E
DKNGRevenue+10.5%+14.2%+11.3%
EPS+23.9%−543.6%+78.2%
FLUTRevenue+6.7%+7.2%+8.6%
EPS−42.5%+48.7%+40.0%
RSIRevenue+41.0%+14.0%+14.5%
EPS+51.7%+34.7%+26.1%

Forward fiscal years only. Blank means no analyst coverage for that year.

DraftKings' sportsbook kept more of every dollar wagered last quarter than it did a year earlier, and the company still told investors on 6 November that this year's profit has been spent. Sportsbook net revenue at the Boston operator, which takes mobile and retail wagers in 18 states and runs online casino under the DraftKings and Golden Nugget Online brands, rose 36% on handle growth of 12%, because the margin the book earns on handle widened by about 1.2 percentage points to 6.4%, with parlay mix up three points.

For a year this corner of the market has been marked down on a belief about that number: that state taxes, promotional credits and untaxed prediction markets were stripping the revenue out of a wagered dollar. DraftKings is down 33.8% over twelve months and Flutter, owner of FanDuel, 62.3%. The third-quarter prints say the erosion is not in the hold; it sits in what it now costs to put a customer in front of the book.

The line where the profit left

DraftKings cut full-year revenue guidance to $6.35-6.55bn from $6.5-6.9bn and swung adjusted EBITDA guidance from a $700-900m profit to a loss of $175-275m, attributing the move to an increased predictions investment of $650-700m. Core-business EBITDA of $875-925m, management said, remains on track. The quarter itself missed on both lines: an adjusted loss of 53 cents against a 39-cent consensus, on revenue of $1.329bn against $1.398bn. The shares closed 21.3% lower.

The spending has a visible mechanism. New-customer promotional credits offset roughly 90% of the prediction exchange's gross gaming revenue, which is why that revenue is immaterial this year at an 11.1% take rate. Credits that large are the price of attention, and attention has repriced: betting-category media spending rose more than 60% year-on-year in September and more than 50% in October, driven mainly by prediction-market operators' advertising.

"In just a few months, we have become the clear number 3 predictions exchange by total volume. In October, annualized consumer volume reached $10.1 billion up nearly 3x from July," chief executive Jason Robins told investors on 6 November.

Total exchange volume annualised at $56.8bn, about 5.6 times that consumer figure, the gap between contracts re-traded and money a customer brought in.

Flutter gives the parlay gain back

Flutter's quarter is the cleaner confirmation. Revenue grew 2.1% to $3.874bn while gross profit fell 6.6% and gross margin went from 42.9% to 39.2%. FanDuel's US net revenue margin was 6.8% and its adjusted EBITDA fell 94% to $3m. The company guided 2027 US net revenue margin flat because promotional spend annualises at this year's elevated level.

"We are very confident that we can still grow the overall structural margins," chief financial officer Robert Coldrake said on 4 November, calling the pressure "more kind of temporary to medium term." The $300m revenue and $160m EBITDA guidance cuts were attributed to adverse sports results, the Brazil closure and UK gaming tax. The buyback is paused and net leverage is 4.6x against a 2-2.5x target. The shares sit on 18.7x forward earnings, against roughly 49.6x on that same estimate a year ago, and the estimate has itself been cut 42.5%.

Rush Street cut nothing and fell 39%

Rush Street Interactive, the Chicago operator of BetRivers and RushBet and three-quarters online casino by revenue, grew revenue 38.8% to $385.9m, lifted gross margin 2.4 points to 36.4%, nearly doubled operating income and reiterated full-year guidance of $1.56-1.6bn revenue and $245-265m adjusted EBITDA, placing October revenue at the low end. It is debt-free with $382m of cash.

It also fell 39.3% in a month.

Two items in its own disclosure explain part of that: revenue per active user down 15% to $309 on market maturation, which management ties to market-wide North American online-casino moderation while saying it is still gaining share year-on-year against listed peers everywhere but Michigan, and a Colombian bill proposing a 19% value-added tax on online wagering deposits. Forward earnings compressed from about 33x a month ago to 20.1x with no company number changed.

How much of the markdown the prints explain

Flutter's de-rating is earned by its own statements: consensus EBITDA for this year is down 24.7% and the gross-profit line is falling outright. DraftKings' is not a verdict on the business it has, where core profit is intact and it says it tied FanDuel for top US share, but on a discretionary bet whose return arrives in 2027 guidance of $800m to $1.0bn of adjusted EBITDA that consensus, at $770m, has not underwritten. Consensus revenue of $6.66bn still sits above the newly lowered guide. Rush Street's fall is the one with no operating cause attached to it, which leaves the cooling growth rate of regulated online casino as the likelier thing being repriced.

Robins gave the downside arithmetic himself: even if sports event contracts were ended in July 2028, he said, the customers DraftKings acquired this year would be fully paid back by that date, with a Supreme Court ruling in mid-2028 his base case. The money is being spent now against a judgment nobody has written yet.

Data Centers Are Analog Chipmakers' Fastest-Growing Market, and the AI Selloff Found Them

Hypothesis Opus 5 · Research Opus 5 · Writing Opus 5 · Prompt v1.7

Analog chips were supposed to be the part of semiconductors insulated from the AI trade. They are not anymore: the fastest-growing end market at Texas Instruments, Analog Devices and NXP is now the data center, which is precisely what repriced on 5 November when a Qualcomm guidance miss and US election results raised the odds of tighter scrutiny of data-center construction.

None of the three cut guidance. Texas Instruments raised on 21 October and NXP on 27 October; Analog Devices guided its fiscal fourth quarter to about 74% gross margin, up roughly 150 basis points sequentially. Texas Instruments' gross margin has climbed from 55.9% to 64.2% in four quarters as internally built 300mm capacity absorbs volume.

The business explains almost none of the two-day fall. It does explain the split in what the three cost: Texas Instruments carries the strongest operating momentum and the dearest price at 18.8x forward gross profit, against NXP's 7.8x.

TXNADINXPIMCHPONMPWRSMTCDIODALGMPOWILSCCSWKSSLABQRVOQCOMAMDMUData-Center Capex300mm Wafer CapacityGross Margin ExpansionIndustrial & Auto RecoveryAI Infrastructure Scrutiny
TickerCompanySegmentTrend · 13mo30D1Y
The subject · what this brief is about
TXNTexas Instruments IncorporatedAnalog & Power Management🟢 Cont. Bull−4.7%+71.5%
ADIAnalog DevicesAnalog & Power Management🟢 Cont. Bull−11.1%+57.2%
NXPINXP SemiconductorsProcessors & Accelerators⚠️ Emerging Bear+5.3%+21.4%
MCHPMicrochip Technology IncorporatedProcessors & Accelerators⚠️ Emerging Bear−25.6%−0.2%
ONON SemiconductorAnalog & Power Management⚠️ Emerging Bear−24.8%+29.7%
MPWRMonolithic Power SystemsAnalog & Power Management⚠️ Emerging Bear−17.0%+24.7%
DIODDiodes IncorporatedAnalog & Power Management🟢 Cont. Bull−26.0%+49.3%
POWIPower IntegrationsAnalog & Power Management⚠️ Emerging Bear−22.5%+11.4%
SWKSSkyworks SolutionsAnalog & Power Management🌱 Emerging Bull−1.6%+18.9%
SLABSilicon LaboratoriesAnalog & Power Management🟢 Cont. Bull−0.4%+70.1%
QRVOQorvoAnalog & Mixed-Signal🟢 Cont. Bull—+31.0%
Compared against · context, not the story
SMTCSemtechAnalog & Power Management🟢 Cont. Bull−49.8%+37.0%
ALGMAllegro MicroSystemsAnalog & Power Management⚠️ Emerging Bear−25.2%+3.5%
LSCCLattice SemiconductorProcessors & Accelerators⚠️ Emerging Bear−19.7%+68.0%
QCOMQUALCOMM IncorporatedProcessors & Accelerators⚠️ Emerging Bear−7.0%−3.4%
AMDAdvanced Micro DevicesProcessors & Accelerators🟢 Cont. Bull−30.5%+88.9%
MUMicron TechnologyMemory & Storage🟢 Cont. Bull−32.9%+189.8%

12-month price & trend

TXN
Texas Instruments Incorporated
274
−22.58 (−7.62%)
vs. prior close
Price20d50d150d
TXN 12-month price
Analog & Power Management
ADI
Analog Devices
364
+2.55 (+0.71%)
vs. prior close
Price20d50d150d
ADI 12-month price
Analog & Power Management
NXPI
NXP Semiconductors
248
+3.86 (+1.58%)
vs. prior close
Price20d50d150d
NXPI 12-month price
Processors & Accelerators
TickerMkt capP/EP/E fwdP/SP/S fwdP/GPP/GP fwdEV/EBITDAFCF yld
TXN$253.4B35.9x30.7x12.2x11.3x20.3x18.8x24.0x2.9%
ADI$176.2B42.9x21.6x12.7x9.5x19.3x14.4x26.1x2.8%
NXPI$62.6B19.4x16.3x4.5x4.4x8.1x7.8x13.4x5.8%
MCHP
Microchip Technology Incorporated
58.35
−6.50 (−10.02%)
vs. prior close
Price20d50d150d
MCHP 12-month price
Processors & Accelerators
ON
ON Semiconductor
63.31
+0.30 (+0.48%)
vs. prior close
Price20d50d150d
ON 12-month price
Analog & Power Management
MPWR
Monolithic Power Systems
1,190
+59.01 (+5.22%)
vs. prior close
Price20d50d150d
MPWR 12-month price
Analog & Power Management
TickerMkt capP/EP/E fwdP/SP/S fwdP/GPP/GP fwdEV/EBITDAFCF yld
MCHP$31.7B43.7x16.0x5.7x4.9x9.0x7.9x18.0x4.6%
ON$24.6B36.0x19.3x3.9x3.7x10.1x9.7x15.2x6.6%
MPWR$58.1B65.4x40.9x15.5x13.4x28.1x24.3x48.3x1.0%
SMTC
Semtech
95.72
−0.88 (−0.91%)
vs. prior close
Price20d50d150d
SMTC 12-month price
Analog & Power Management
DIOD
Diodes Incorporated
77.36
+9.00 (+13.17%)
vs. prior close
Price20d50d150d
DIOD 12-month price
Analog & Power Management
ALGM
Allegro MicroSystems
28.17
+1.37 (+5.11%)
vs. prior close
Price20d50d150d
ALGM 12-month price
Analog & Power Management
TickerMkt capP/EP/E fwdP/SP/S fwdP/GPP/GP fwdEV/EBITDAFCF yld
SMTC$11.9B76.9x34.9x10.1x7.9x19.5x15.2x92.4x1.5%
DIOD$3.6B30.7x23.8x2.0x1.9x6.0x5.7x13.6x3.5%
ALGM$5.3B169.9x—5.2x—10.9x—40.0x2.0%
POWI
Power Integrations
40.26
+1.42 (+3.66%)
vs. prior close
Price20d50d150d
POWI 12-month price
Analog & Power Management
LSCC
Lattice Semiconductor
105
+6.99 (+7.13%)
vs. prior close
Price20d50d150d
LSCC 12-month price
Processors & Accelerators
SWKS
Skyworks Solutions
82.04
−1.84 (−2.19%)
vs. prior close
Price20d50d150d
SWKS 12-month price
Analog & Power Management
TickerMkt capP/EP/E fwdP/SP/S fwdP/GPP/GP fwdEV/EBITDAFCF yld
POWI$2.2B49.7x28.2x4.9x4.7x9.1x8.7x31.3x4.1%
LSCC$17.5B484.1x60.1x26.9x19.1x39.8x28.2x200.9x1.2%
SWKS$12.4B71.5x14.6x3.1x1.7x7.7x4.1x17.6x-0.1%
SLAB
Silicon Laboratories
222
−0.41 (−0.18%)
vs. prior close
Price20d50d150d
SLAB 12-month price
Analog & Power Management
QRVO
Qorvo
Price20d50d150d
QRVO 12-month price
Analog & Mixed-Signal
QCOM
QUALCOMM Incorporated
165
+8.66 (+5.52%)
vs. prior close
Price20d50d150d
QCOM 12-month price
Processors & Accelerators
TickerMkt capP/EP/E fwdP/SP/S fwdP/GPP/GP fwdEV/EBITDAFCF yld
SLAB$7.4Bn/m76.2x8.6x8.0x14.4x13.3x—-0.1%
QRVO$10.1B26.2x14.9x2.8x2.9x5.7x5.9x13.2x6.4%
QCOM$176.0B18.8x16.3x4.0x3.9x7.4x7.2x13.9x5.9%
AMD
Advanced Micro Devices
449
+44.64 (+11.04%)
vs. prior close
Price20d50d150d
AMD 12-month price
Processors & Accelerators
MU
Micron Technology
690
+33.61 (+5.12%)
vs. prior close
Price20d50d150d
MU 12-month price
Memory & Storage
TickerMkt capP/EP/E fwdP/SP/S fwdP/GPP/GP fwdEV/EBITDAFCF yld
AMD$1.0T156.2x80.7x24.3x19.7x45.7x37.0x93.6x0.8%
MU$1.0T19.9x12.2x11.2x7.8x15.4x10.7x14.5x2.6%

Consensus projections

TickerFY2026EFY2027EFY2028E
TXNRevenue+26.4%+17.7%+11.3%
EPS+65.2%+28.4%+16.3%
ADIRevenue+38.1%+22.9%+12.0%
EPS+65.9%+30.6%+18.5%
NXPIRevenue+17.0%+12.3%+9.3%
EPS+29.2%+20.5%+17.3%
MCHPRevenue+6.2%+37.3%+16.6%
EPS+20.7%+132.9%+25.7%
ONRevenue+10.1%+14.9%+12.4%
EPS+40.9%+44.3%+27.1%
MPWRRevenue+55.8%+51.2%+24.7%
EPS+64.5%+58.9%+25.5%
SMTCRevenue+15.6%+43.4%+35.9%
EPS+119.3%+115.4%+82.8%
DIODRevenue+27.3%+19.9%+17.1%
EPS+178.4%+71.8%+61.7%
ALGMRevenue+23.0%+26.1%+17.6%
EPS+131.1%+96.7%+48.1%
POWIRevenue+7.7%+12.3%+25.3%
EPS+18.1%+30.1%+54.3%
LSCCRevenue+2.3%+76.6%+45.1%
EPS+11.9%+103.0%+50.7%
SWKSRevenue−1.9%+87.9%+6.4%
EPS−11.1%+11.6%+34.7%
SLABRevenue+34.2%+18.1%+16.8%
EPS−153.0%+220.4%+55.0%
QRVORevenue−0.8%−3.9%+4.2%
EPS+21.6%+17.4%+5.0%
QCOMRevenue−1.5%+4.6%+16.0%
EPS−11.5%−4.0%+28.2%
AMDRevenue+49.4%+75.5%+37.7%
EPS+92.6%+108.1%+44.1%
MURevenue+248.0%+92.8%+11.4%
EPS+804.9%+111.2%+7.9%

Forward fiscal years only. Blank means no analyst coverage for that year.

Texas Instruments told investors in October that its data center business had nearly doubled from a year earlier and now runs at about 13% of revenue. Three weeks later that was the part of the company the market wanted least.

The analog chipmakers spent two years being traded as a bet on industrial and automotive restocking, a cycle with its own clock and no particular relationship to artificial-intelligence capital spending. That belief went into November intact and came out of 5 November damaged. The Philadelphia Semiconductor Index fell roughly 9% that session, with the Nasdaq Composite down 5.5%, after Qualcomm guided current-quarter revenue below consensus and Democratic election victories raised investor expectations of tighter congressional scrutiny of data-center construction, power permitting and AI-infrastructure spending. Analog's newest socket is the one Washington was suddenly discussing.

The category's markdown was mostly the smaller companies

Over the 30 trading days to 6 November the analog shelf came apart by size rather than by fundamentals. Semtech fell 49.8%, Diodes 26.0%, Microchip 25.6%, ON Semiconductor 24.8% and Monolithic Power 17.0%. Texas Instruments lost 4.7% and NXP actually gained 5.3%. What hit the three big names was two sessions: between 4 and 6 November Texas Instruments fell 12.2%, Analog Devices 9.2% and NXP 5.4%, with Analog Devices trading 13.1m shares on 5 November against a typical two to four million. Analog Devices' highest close of the past 120 days was $429.25, set on 29 October.

What a 300mm wafer saves Texas Instruments

The fixed cost of the fabs built for this cycle is converting into margin right now. Texas Instruments, which sells power-management and signal-chain analog parts and embedded processors into industrial, automotive and electronics customers, has lifted gross margin from 55.9% to 64.2% across four quarters while revenue growth accelerated from 10.4% to 27.7% year on year. The company puts the cost advantage of its 300mm wafer manufacturing at roughly 40% against 200mm alternatives. Industrial revenue grew 40% in the September quarter, reaching its 2022 peak for the first time in four years.

"I do believe that systems that are being designed by our customers 4 years later than the COVID peak are much more rich with content," chief executive Haviv Ilan told investors on 21 October, the day the company guided fourth-quarter revenue to $5.8bn to $6.3bn.

The depreciation on that capacity is landing — $2.2bn to $2.4bn projected for 2026 after rising 23% in the first half, against capex cut to $2bn to $3bn — which is why trailing free cash flow inflected to $8.4bn from $2.4bn a year earlier, $1.6bn of it CHIPS Act incentives. It is also the most expensive stock of the three at 35.9x trailing earnings and 18.8x forward gross profit, so the strongest operating momentum has the least room in its price.

Analog Devices' channel is running below its own target

Analog Devices, whose data converters, amplifiers and isolators go to industrial, instrumentation and automotive customers, is accelerating too: revenue growth of 30.4%, 37.2% and 39.6% year on year across its last three quarters, GAAP gross margin up from 64.7% to 67.3%. Non-GAAP gross margin of 72.5% in the August quarter was 330 basis points higher than a year before, "driven by higher revenue, utilization, and favorable mix", and the company guided its fiscal fourth quarter to $4.3bn plus or minus $100m at about 74% gross margin and 52% operating margin.

Distributor channel inventory sits below its six-to-seven-week target and is expected to stay there. Management described book-to-bill as above one but "not in an unusually high space from a book-to-bill perspective" on its 19 August call, with no current signs of restocking. The trailing multiple has compressed from 57.9x in August to 42.9x; on consensus fiscal 2027 earnings, 30.6% above this year's, it is 21.6x.

NXP got the margin from utilization, not price

NXP's 58.6% non-GAAP gross margin in the September quarter was 160 basis points better year on year, and management attributed it to factories running in the mid-80s rather than to price increases. Pricing for 2026 was revised from a low-single-digit decline to neutral. Automotive revenue crossed $2bn for the first time, up 17% excluding sensors, on content per vehicle in a flattish production environment. "The book to bill remains well above 1 across all end markets and regions," chief financial officer William Betts said on 27 October. "Our backlog continues to grow in dollars and extend further into 2027."

Two things sit against that. NXP guided 2027 capex to 5% of revenue from roughly 2%, so its depreciation headwind is ahead of it while Texas Instruments' peaks. And 17% to 18% of revenue is China-for-China, about a third of it manufactured locally, with a local foundry partnership under way against Beijing's push for domestic automotive chips. At 13.5x consensus 2027 earnings and 7.8x forward gross profit, it is the cheapest of the three by a wide margin, and the only one up over three months.

What the quarters explain and what they do not

The results account for essentially none of the two-day fall. All three guided higher inside the markdown window, utilization is rising, channel inventory is thin and lead times at NXP have stretched so that 80% now exceed 16 weeks against 25% a year ago. What the results do explain is the gap between what the three cost. Texas Instruments is priced for the fall-through its own model promises on incremental revenue; NXP is discounted for automotive cyclicality, a capex step-up and China; Analog Devices sits between them, having given back a third of its trailing multiple since August with nothing visible broken.

The transmission mechanism is the thing to keep. Data center is the fastest-growing line at each of the three, and that leg is now valued the way AI infrastructure is valued rather than the way analog is. Analog Devices' fiscal fourth-quarter numbers are still to come, and they will be the first read on whether an election result changed any analog order at all.