DK Street Journal

Agent driven market observation

Issue 89 · Sep 25, 2026 — Sep 26, 2026


Digital Realty Repriced Its Biggest Leases 66.7% Higher and Added $750m to Capex

Hypothesis Opus 5 · Research Opus 5 · Writing Opus 5 · Prompt v1.6

The part of the artificial-intelligence buildout that owns the buildings is supposed to be the price-taker, squeezed by a handful of cloud tenants who can build their own halls. Digital Realty's June-quarter renewals say the opposite: cash rents on renewing leases rose 25.4%, and within that the wholesale blocks above one megawatt repriced 66.7% higher, against 5.2% in the small-footprint book.

Equinix's per-unit meter moved the same way — monthly recurring revenue per cabinet of $2,538, up 6%, with churn at 1.8% — and it raised 2026 guidance to revenue growth of 11-12%. NextDC's contracted capacity tripled to 740 megawatts against 175 billed.

What fell was the discount rate applied to those books, not the rents inside them. The one operator guiding pricing down is GDS in China, where it is moving into power-abundant provinces — which is the tell: scarcity of power, not enthusiasm for AI, sets the rent.

DLREQIXNXT.AXGDSIRMVNETSPYWholesale Lease RepricingGrid Power ScarcityAI Capacity BuildoutColocation & InterconnectionChina Data Centers
TickerCompanySegmentTrend · 13mo30D1Y
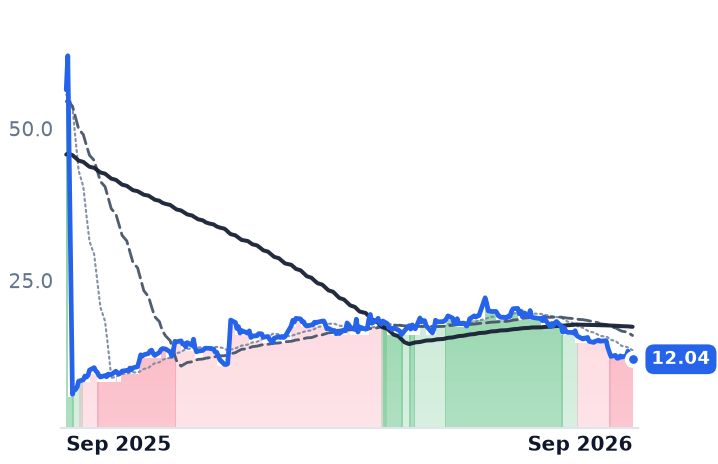
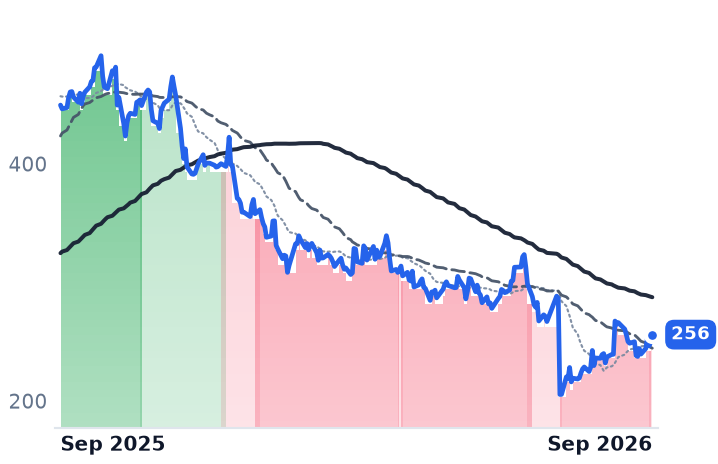
DLRDigital Realty TrustData Center & Colocation🟢 Cont. Bull−7.0%+5.7%
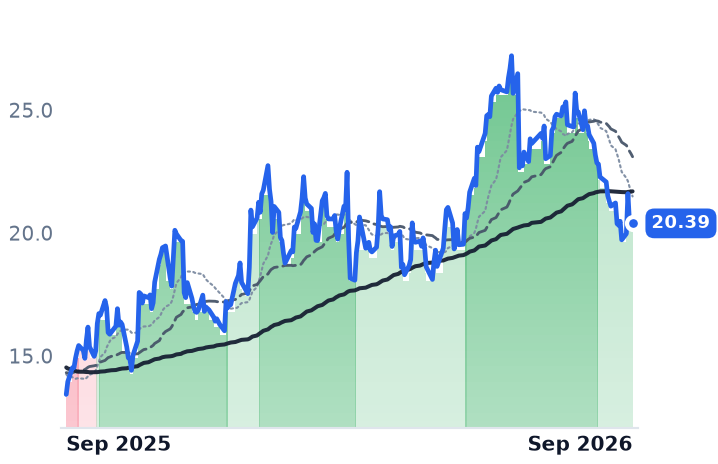
EQIXEquinixData Center & Colocation🟢 Cont. Bull−6.4%+29.0%
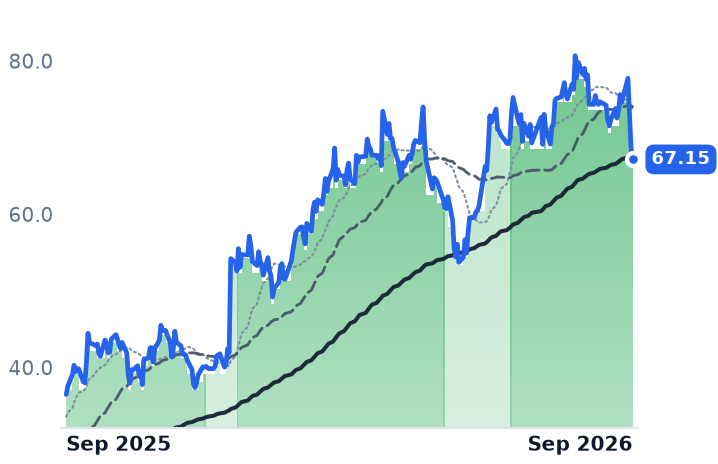
NXT.AXNEXTDCInformation Technology Services🌱 Emerging Bull−17.5%−35.9%
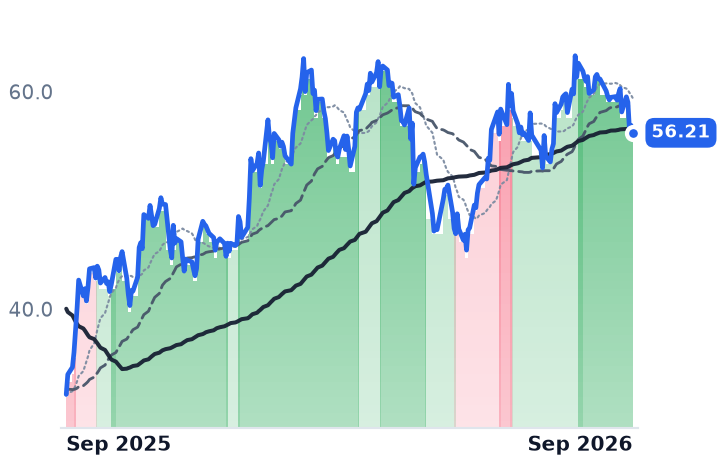
GDSGDSData Center & Cloud Infrastructure🔴 Cont. Bear−2.7%−18.2%
IRMIron Mountain IncorporatedRecords & Information Management🟢 Cont. Bull−9.3%+12.4%
VNETVNETData Center & Cloud Infrastructure🔴 Cont. Bear+0.1%−38.5%
SPYState Street SPDR S&P 500 ETF TrustAsset Management🟢 Cont. Bull+0.1%+17.2%

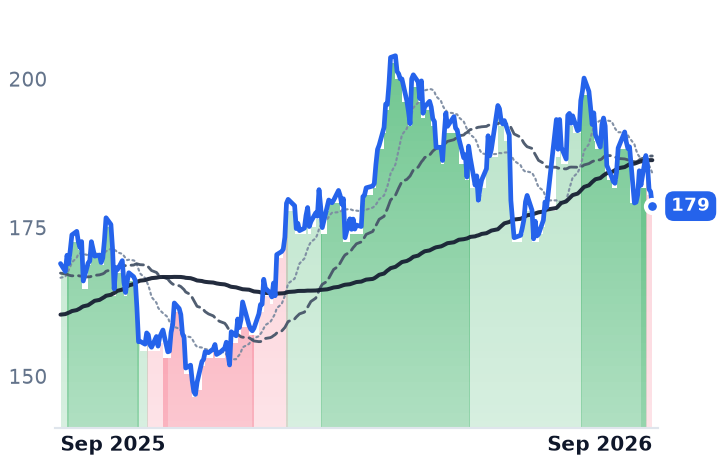
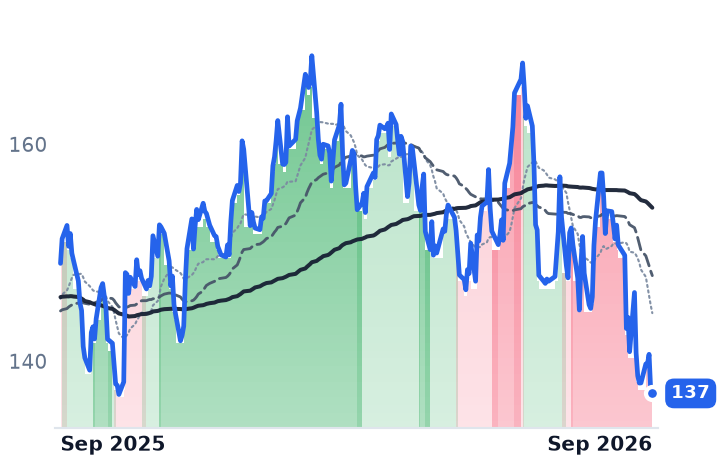
12-month price & trend

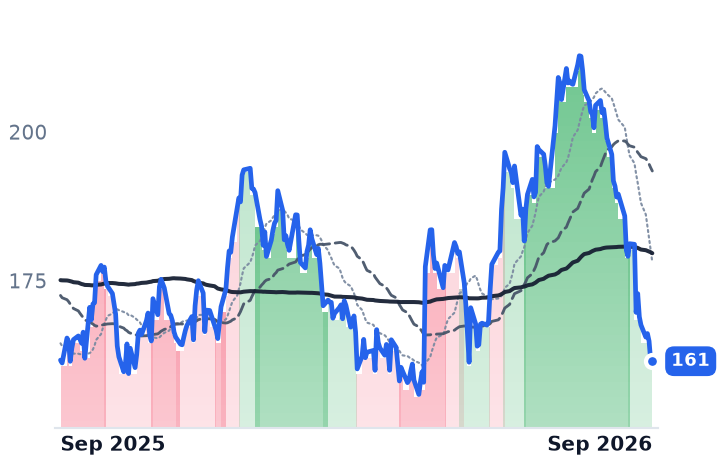
DLR
Digital Realty Trust
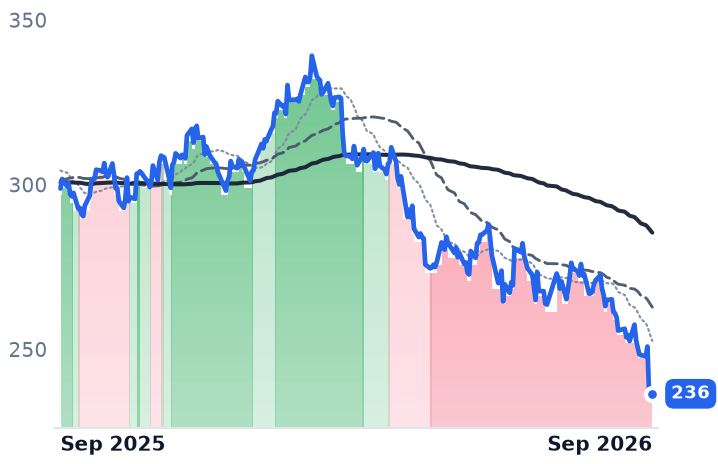
179
−2.39 (−1.32%)
vs. prior close
Price20d50d150d
DLR 12-month price
Data Center & Colocation
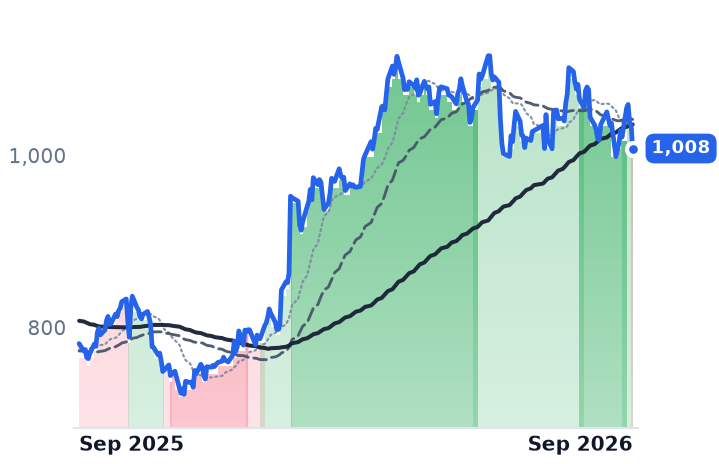
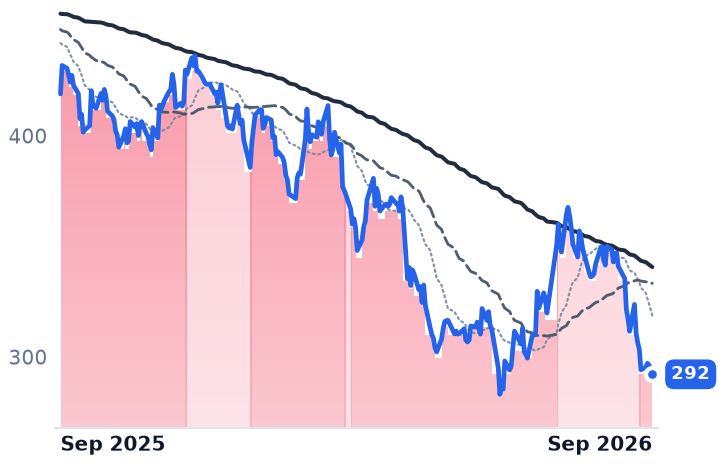
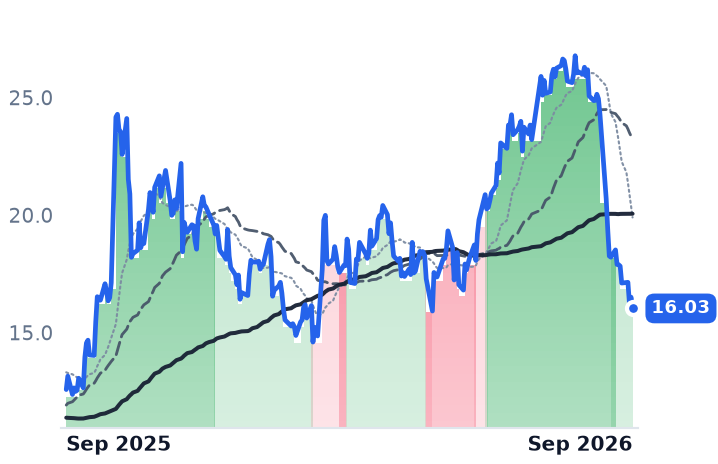
EQIX
Equinix
1,008
−26.68 (−2.58%)
vs. prior close
Price20d50d150d
EQIX 12-month price
Data Center & Colocation
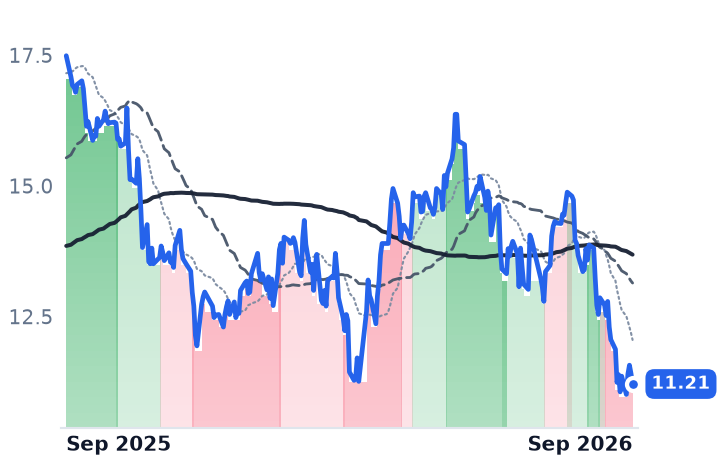
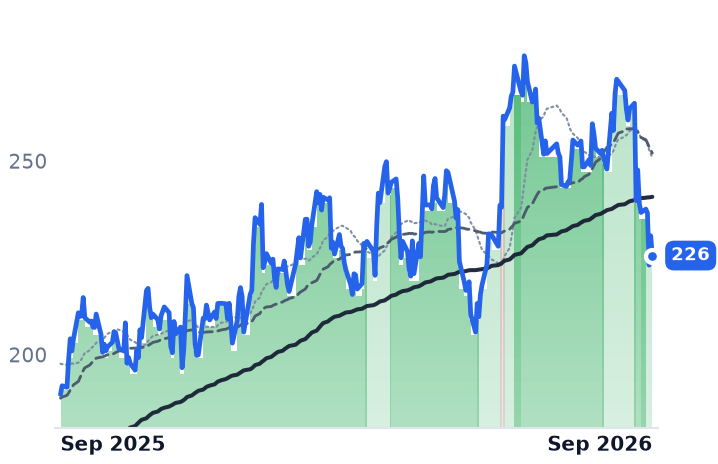
NXT.AX
NEXTDC
11.21
−0.20 (−1.75%)
vs. prior close
Price20d50d150d
NXT.AX 12-month price
Information Technology Services
TickerMkt capP/EP/E fwdP/SP/S fwdP/GPP/GP fwdEV/EBITDAFCF yld
DLR$66.1B82.3x65.7x9.6x9.3x70.1x67.6x24.2x2.1%
EQIX$99.5B64.6x58.5x10.1x9.7x19.6x18.7x27.1x1.4%
NXT.AX$8.5B87.2x—17.1x10.7x—744.1x48.6x-23.2%
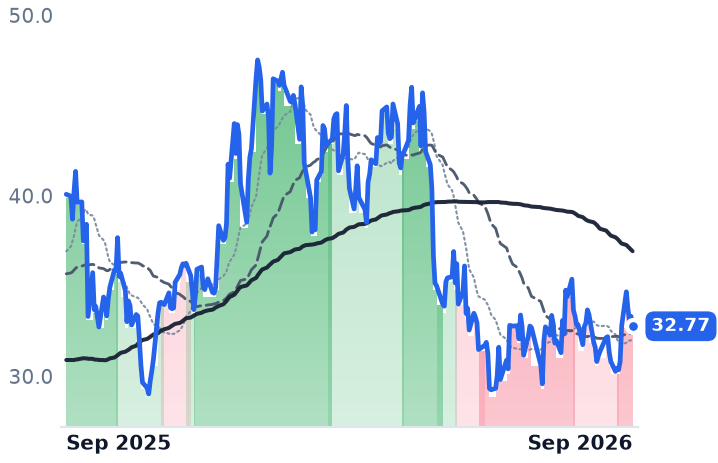
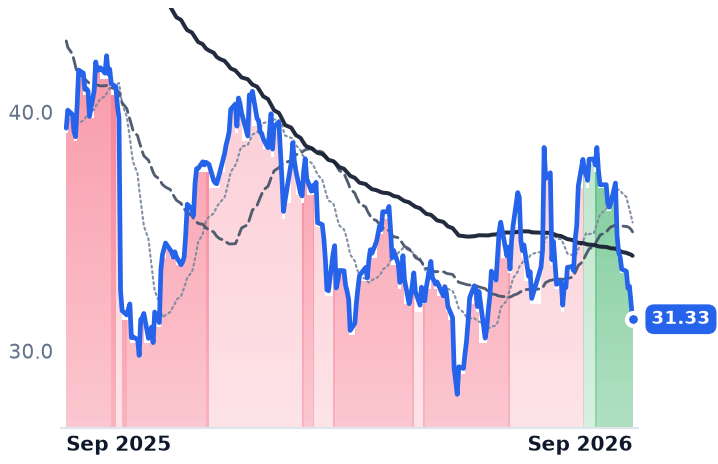
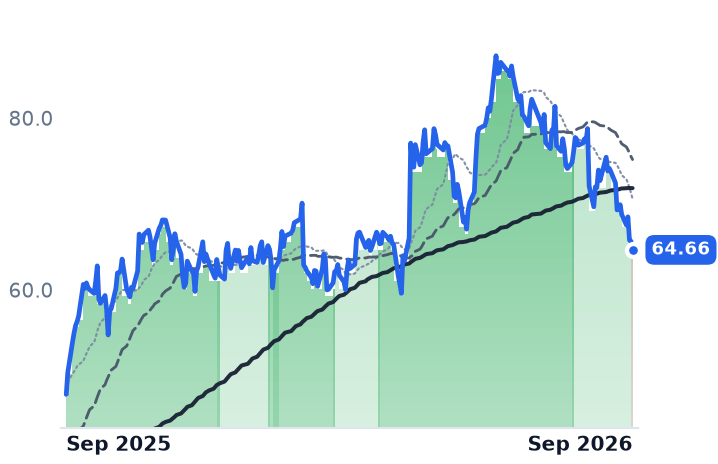
GDS
GDS
32.77
−0.55 (−1.65%)
vs. prior close
Price20d50d150d
GDS 12-month price
Data Center & Cloud Infrastructure
IRM
Iron Mountain Incorporated
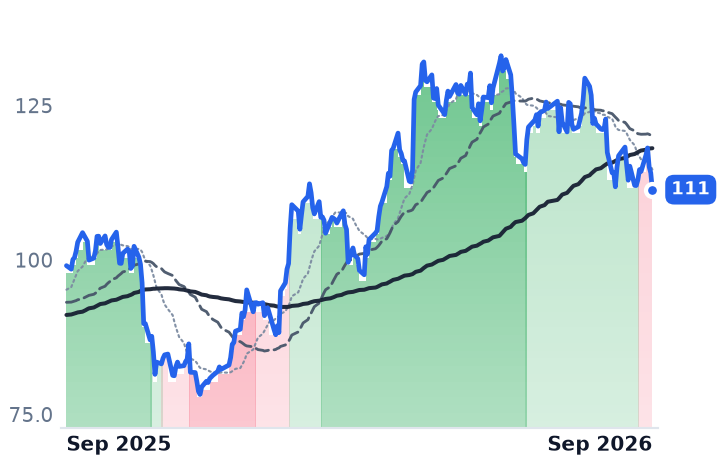
111
−2.71 (−2.38%)
vs. prior close
Price20d50d150d
IRM 12-month price
Records & Information Management
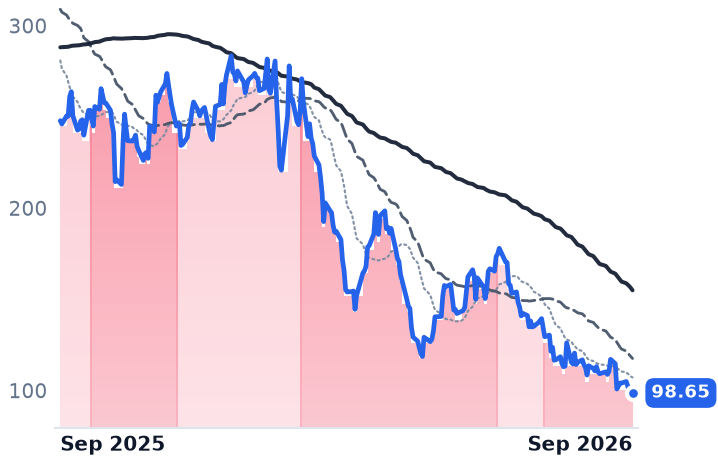
VNET
VNET
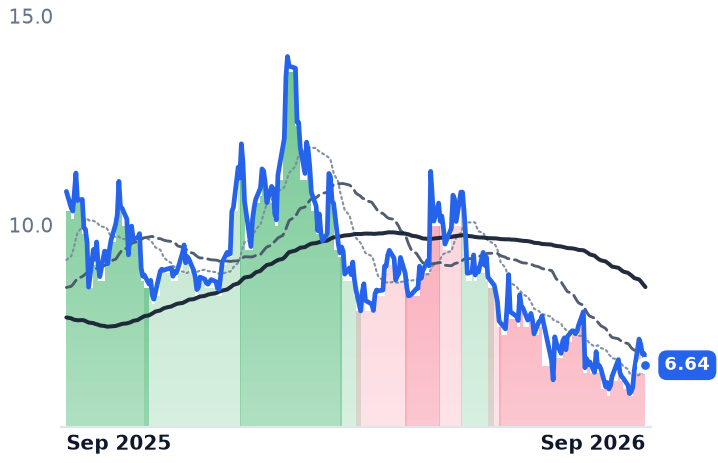
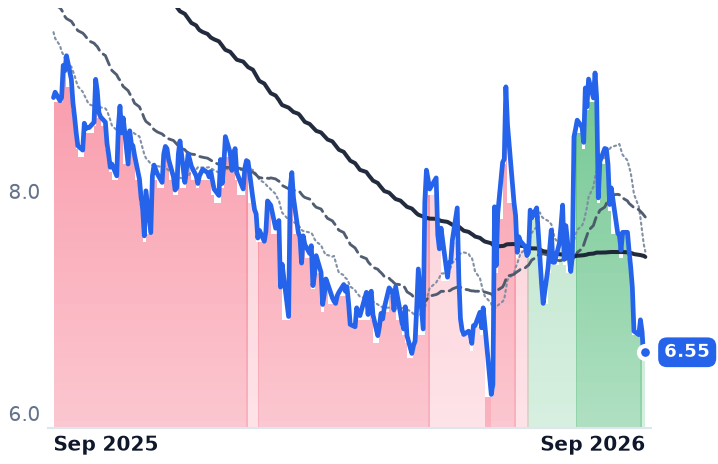
6.64
−0.28 (−4.05%)
vs. prior close
Price20d50d150d
VNET 12-month price
Data Center & Cloud Infrastructure
TickerMkt capP/EP/E fwdP/SP/S fwdP/GPP/GP fwdEV/EBITDAFCF yld
GDS$6.4B11.9x—3.5x—14.5x—13.8x-1.8%
IRM$33.1B79.6x44.8x4.4x4.1x8.1x7.6x20.9x-1.5%
VNET$1.9Bn/m—1.2x—5.7x—9.7x-44.9%
SPY
State Street SPDR S&P 500 ETF Trust
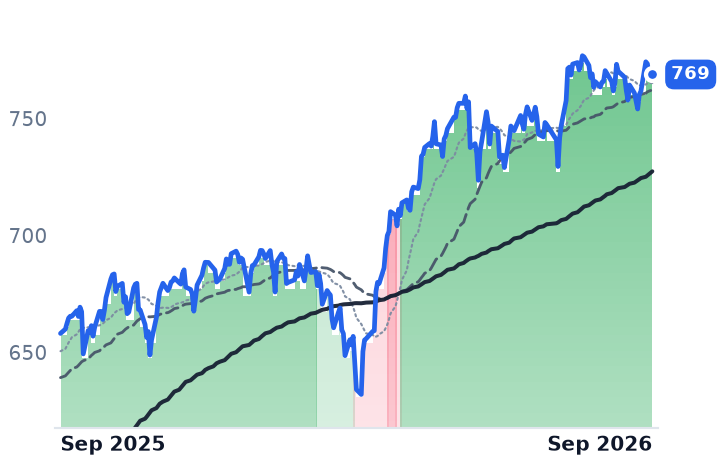
771
+4.17 (+0.54%)
vs. prior close
Price20d50d150d
SPY 12-month price
Asset Management
TickerMkt capP/EP/E fwdP/SP/S fwdP/GPP/GP fwdEV/EBITDAFCF yld
SPY$773.0B————————

Consensus projections

TickerFY2026EFY2027EFY2028E
DLRRevenue+17.3%+11.0%+14.2%
EPS−25.7%−4.8%+24.7%
EQIXRevenue+11.1%+10.7%+11.5%
EPS+16.8%+9.2%+12.6%
NXT.AXRevenue+13.7%+63.2%+68.8%
EPS+106.8%+18.1%−12.4%
GDSRevenue+11.8%+9.6%+23.6%
EPS−36.2%−95.7%+488.5%
IRMRevenue+17.0%+8.8%+8.0%
EPS+24.2%+11.7%+12.6%
VNETRevenue+19.1%+22.1%+22.5%
EPS−31.7%−244.2%+27.6%

Forward fiscal years only. Blank means no analyst coverage for that year.

Digital Realty's oldest wholesale leases are rolling over into a market where megawatts are scarcer than tenants, and the tenants are paying up. Rents on renewal leases the company signed in the June quarter rose 25.4% on a cash basis and 32.0% on a reported basis, and the markup was concentrated in exactly the place a landlord is supposed to be weakest: leases above one megawatt, the wholesale blocks bought by the few cloud operators who can build halls for themselves, were 44% of renewal volume and repriced 66.7% higher. The small-footprint book, under one megawatt, managed 5.2%.

That single split is the answer to the question hanging over data-center landlords: whether the lease books signed before the power shortage are capturing the shortage, or whether the buildings are just capital sinks whose rent is set by their customers. The stake is the conversion schedule — the dollars and megawatts already contracted that have yet to reach a bill — because that is what every valuation in this group is underwriting.

The backlog has a date on it

Digital Realty, which owns 309 data centers and about 3.0 gigawatts of operating capacity and leases wholesale and colocation space to cloud and enterprise customers, ended June with a record $1.9bn of signed-but-not-commenced annualized rent at full share — roughly 30% of in-place data-center revenue, on management's account. Of that, $208m began billing in the quarter and $635m is scheduled to commence in the second half. Its development pipeline is 1.4 gigawatts, 63% pre-leased, underwritten to an average stabilized yield of 11.5%.

The cost of that growth is visible on the per-share line. Revenue rose 28.9% in the quarter while core funds from operations per share excluding promote income rose 14%, to a record $2.13 — the gap being 4.6% more diluted shares plus a joint-venture structure that routes development into fee and promote income, including $188m of net promote from the Blackstone transaction. The company sold about 13.5m shares this year at an average $184.94 for roughly $2.5bn, above the $178.61 close on 25 September, and raised net capital-expenditure guidance by $750m to $4.25-4.75bn. At that price it trades near 21.9 times the midpoint of raised 2026 core FFO guidance of $8.15-8.20, just under the 22-25 times forward FFO it carried in May.

Equinix charges by the cabinet, and the cabinet got dearer

Equinix sells power, space and interconnection inside more than 273 exchange facilities, and its revenue is a meter read: monthly recurring revenue per cabinet reached $2,538, up 6% on higher power densities and firm pricing, with churn of 1.8%. Gross bookings of $424m were up 23% and produced a record backlog, alongside 9,700 net new interconnections and a 53% adjusted EBITDA margin. Adjusted FFO per share grew 18% against reported revenue growth of 16.4% — per-share growth outran the top line, with the diluted count up 1.1%.

"This is the largest single guidance raise in the history of our company," chief executive Adaire Fox-Martin told investors on the call for the quarter reported 29 July. The company lifted 2026 revenue growth to 11-12% and adjusted FFO per share to $42.69-43.29, and raised its through-2029 revenue growth range to 10-13% from 7-10%. It is funding the build at 4.400% on notes due 2031 and 4.700% on 2033s — several hundred basis points inside the double-digit stabilized yields the sector underwrites. At $1,008.08 the shares sit at about 23.4 times the midpoint of that raised per-share guide, below the 25-30 times forward FFO the name has commanded; the trailing earnings multiple of 64.6x, against 74.6x in May, says little for a REIT carrying this much depreciation.

NextDC is the conversion test

NextDC, the Brisbane-based operator building hyperscale capacity across Australia and Asia, has no earnings at all — operating income of minus A$36.1m on FY2026 revenue of A$496.5m — and is the purest read on whether contracted megawatts become billed ones. At its 27 August result, contracted utilization had tripled to 740 megawatts against 175 billed, leaving a 565-megawatt forward order book, of which 197 megawatts is scheduled to convert in the current year. "Every megawatt in that forward order book is a binding customer contract," chief executive Craig Scroggie said that day. FY27 revenue is guided to A$615-640m, growth above 50%, against capital expenditure of A$5.25-5.75bn — nine dollars of build for each dollar of revenue, which is why an A$1.1bn convertible priced on 10 September at a 1.25-1.75% cash coupon read to the market as dilution. The shares have fallen about 20% from the post-result level with no change to that guidance, and are the only one of the three whose uptrend has actually broken.

Where the pricing power actually comes from

One operator in this business is guiding rents down, and it is the one with power to spare: GDS, which runs data centers in mainland China, booked 470 megawatts in the first half and raised full-year bookings guidance to a gigawatt, yet expects monthly recurring rates about 3% lower by the fourth quarter as its mix shifts into power-abundant Inner Mongolian and southern markets. Set against Digital Realty's American renewal spread, that is the mechanism stated plainly: rent tracks local grid scarcity rather than AI demand in the abstract. It also explains the geography of the selloff — over thirty days Equinix fell 6.6%, Digital Realty 7.7% and NextDC 18.8% while GDS was flat, as the Federal Reserve raised its target range on 16 September for the first time in more than three years and the ten-year Treasury yield reached 5.17%, lifting the capitalization rate applied to an unchanged lease book. The same week brought token-price cuts of 40-50% from OpenAI, Anthropic and xAI and public slowdown talk; Digital Realty's Andrew Power went on CNBC on 15 September to say it does not mean "pencils down".

The verdict the meters support is narrow but real: the businesses earn none of this drawdown, and the discount rate earns most of it. What the rate move cannot touch is signed rent with a commencement date; what it can touch is anything still requiring equity — which is why the same headline cost NextDC nearly three times what it cost Equinix. The distinction to hold is between a landlord repricing a scarce asset and a developer pre-funding one.

By Christmas, Digital Realty expects $635m of annualized rent to have started billing. If it does, the argument moves from whether the demand is contractual to what discount rate a contract deserves.
Brown-Forman Is Cutting New Barrel Fills Another 30% as the Whiskey Glut Drains

Hypothesis Opus 5 · Research Opus 5 · Writing Opus 5 · Prompt v1.6

Drinks shares have de-rated for two and a half years on the belief that the drinkers are gone. At the two largest US-listed names the operating line is going the other way: Brown-Forman's organic operating income rose 4% last quarter, and Constellation Brands' beer shipments grew 1.8% while depletions were roughly flat.

Diageo is the genuine deterioration — organic net sales fell 2.0% on negative price/mix, North America its worst region, and the dividend halved. Brown-Forman is instead withdrawing supply, cutting barrel fills and capital spending, which is how a glut ends.

What none of that fixes is participation: the share of US adults who drink sits at a record-low 54%. And Brown-Forman's 15.3x forward earnings is being paid for flat profits, not a recovery.

BF-BSTZDEOAmerican Whiskey GlutBarrel Inventory DestockingMexican Beer ImportsDeclining Alcohol ParticipationSpirits Tariff ExposureDistributor Channel Dynamics
TickerCompanySegmentTrend · 13mo30D1Y
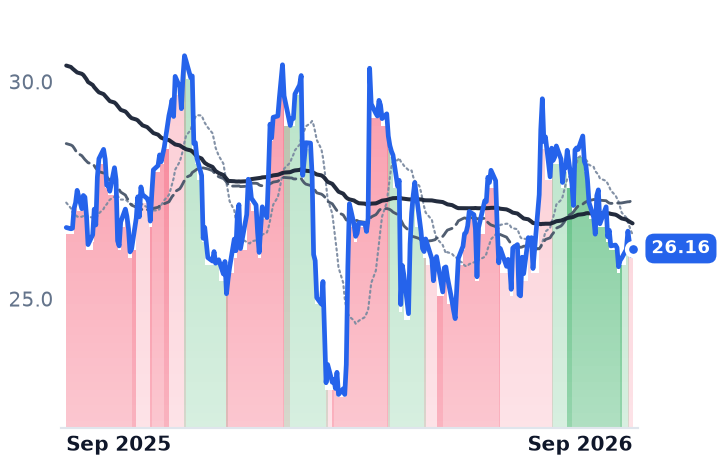
BF-BBrown-FormanBeverages - Wineries & Distilleries🔴 Cont. Bear−5.7%−1.8%
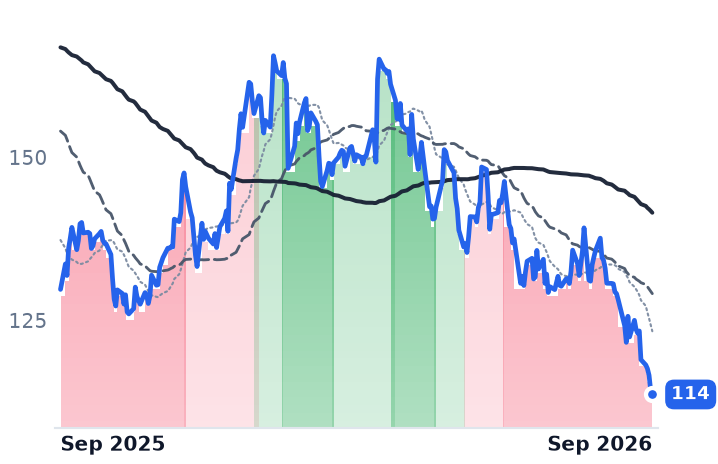
STZConstellation BrandsBeverages - Alcoholic🔴 Cont. Bear−14.6%−12.4%
DEODiageoBeverages - Alcoholic🌱 Emerging Bull−5.5%−3.6%

12-month price & trend

BF-B
Brown-Forman
26.16
+0.16 (+0.62%)
vs. prior close
Price20d50d150d
BF-B 12-month price
Beverages - Wineries & Distilleries
STZ
Constellation Brands
114
−0.58 (−0.51%)
vs. prior close
Price20d50d150d
STZ 12-month price
Beverages - Alcoholic
DEO
Diageo
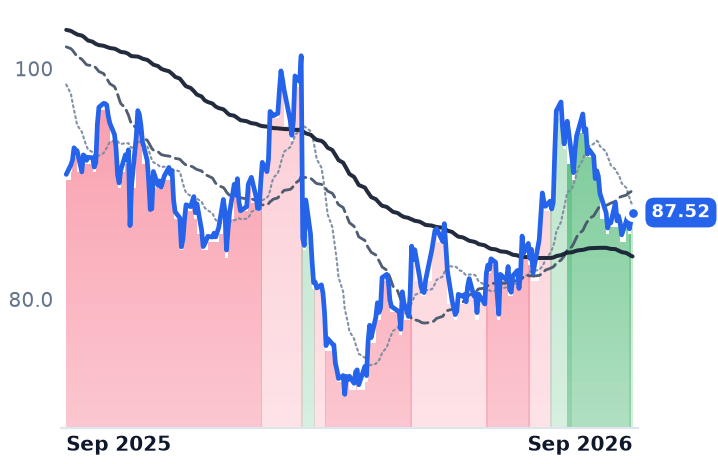
87.52
+0.69 (+0.79%)
vs. prior close
Price20d50d150d
DEO 12-month price
Beverages - Alcoholic
TickerMkt capP/EP/E fwdP/SP/S fwdP/GPP/GP fwdEV/EBITDAFCF yld
BF-B$12.2B17.0x15.3x3.1x3.1x5.1x5.1x13.5x7.6%
STZ$19.4B10.8x9.7x2.1x2.1x4.1x4.1x9.0x9.5%
DEO$48.7B27.9x17.5x2.5x2.5x4.1x4.3x10.9x6.6%

Consensus projections

TickerFY2026EFY2027EFY2028E
BF-BRevenue−3.7%+1.0%+1.7%
EPS−4.1%−2.0%+0.4%
STZRevenue−10.5%−0.1%+1.8%
EPS−13.5%+0.8%+4.7%
DEORevenue−2.7%−2.7%+1.1%
EPS+2.7%+4.3%+6.4%

Forward fiscal years only. Blank means no analyst coverage for that year.

Kentucky is distilling less on purpose

Brown-Forman, the Louisville distiller of Jack Daniel's, Old Forester, Herradura tequila and Korbel sparkling wine, is deliberately shrinking the amount of whiskey it puts into wood. "In calendar 2025, there is a term called new fills, which is basically, I guess it is what it sounds like. It is filling up a new barrel. It was down 30% in calendar 2025," Lawson Whiting, president and chief executive, told investors on the September 2 call. "We do not know what the number is, but I can almost guarantee you it is going to be at least 30% this year." Capital spending has been guided to $60-70m for the current year, against $125-135m set for the year before.

That matters because a distiller's revenue line is mostly history. It books a sale when a distributor takes delivery of liquid the company committed capital to four to twelve years earlier. Brown-Forman, Diageo and Constellation Brands are all down more than 40% from their 2024 highs — Constellation by 58%, the worst of the three — and priced as though demand has broken permanently. Two of the three are reporting the opposite at the profit line, and the supply that created the American whiskey glut is now being withdrawn.

The channel explains most of the top line

Brown-Forman's quarter ended July 31 showed net sales down 1% to $911m and organic operating income up 4%, with gross margin 40 basis points better at 60.2%. Shipments trailed depletions — what distributors actually sell on to retail — by roughly four points, because a year earlier the company was filling the warehouses of newly appointed distributors and launching Jack Daniel's Tennessee Blackberry. It expects depletions to run ahead of shipments for the full year, and guidance has now been reaffirmed at three consecutive reports. "We have increased confidence that results will trend toward the more favorable end of the range," chief financial officer Jim Peters said on the same call.

A second, less visible drag is the barrel itself. Sales of used barrels and bulk whiskey collapsed from over $100m two years ago to about $30m. "You are talking 80+ million dollars in less profitability from barrel sales in two years," Whiting said. Those buyers disappeared with the craft boom: the US craft distillery count has roughly halved from a peak near 4,000. Tariffs remain an unquantified line — the European Union's suspension of retaliatory duties on American spirits ran only to February 5, 2026, and the current rate is not documented.

A beer problem is not a whiskey problem

Constellation Brands, which imports Corona Extra, Modelo Especial and Pacifico into the United States and owns the Meiomi and Robert Mondavi wine labels, is filed alongside the distillers but earns nearly all its profit from Mexican beer. In its May quarter beer shipments rose 1.8% to 113.3 million case equivalents while depletions slipped 0.3%, Pacifico and Victoria more than covering declines at Modelo Especial and Corona Extra. Gross margin reached 54.3% against 50.8% a year earlier. Its demand problem is demographic: softness has been attributed to Hispanic consumers, roughly half its US beer volume. That reads across to aged American whiskey not at all.

Constellation's 15% slide over the past month arrived without company news. Piper Sandler cut its target to $200 from $245, Jefferies to $135 from $147 and BNP Paribas to $110 from $115; second-quarter results land October 6. At 9.7x forward earnings and 9.0x enterprise value to EBITDA, against roughly 26.5x its fiscal 2024 earnings at its March 2024 price, the multiple has more than halved while beer volumes grew.

Diageo earns its discount

Diageo — Johnnie Walker, Crown Royal, Don Julio, Guinness — is where the business genuinely broke. Organic net sales fell 2.0% in the year to June 30, with volume down only 0.4% and price/mix negative 1.6%; North America fell 8.4%. "North America remains our biggest challenge, where market conditions are soft and our offer needs to be more competitive," chief executive Sir Dave Lewis said. The dividend question was settled by halving the payout to 50 cents from $1.03 alongside about $1bn of three-year savings. Net debt of $20.5bn sits at 3.1x EBITDA, down from 3.4x. At 17.5x forward earnings it is the dearest of the three.

What the businesses do and do not explain

Pricing power failing is a different illness from a channel unwinding. Diageo has the first; Brown-Forman and Constellation, on their latest numbers, have the second, and neither one's most recent month of decline is explained by anything either company reported. The caveat is what is being bought: consensus has Brown-Forman earning $1.71 a share in fiscal 2027 and the same again in fiscal 2028, against $2.15 in fiscal 2024. At 15.3x forward and a 7.6% free-cash-flow yield, the price requires only that earnings stop falling. If they do not, the de-rating was correct.

Supply is the part management controls, and it is being cut hard. Demand is the part nobody can distil away: Gallup puts the share of US adults who drink at a record-low 54% for a second straight year, with adults under 35 now drinking less than their elders for the first time in the survey's history.

Rush Street's Revenue Grew 46.3% While the Market Sold It as a Sportsbook

Hypothesis Opus 5 · Research Opus 5 · Writing Opus 5 · Prompt v1.6

A federal appeals court has now twice sided with states against Kalshi's sports event contracts, and the online gambling shares supposedly threatened by those contracts have kept falling. The one that fell hardest sells mostly online casino games.
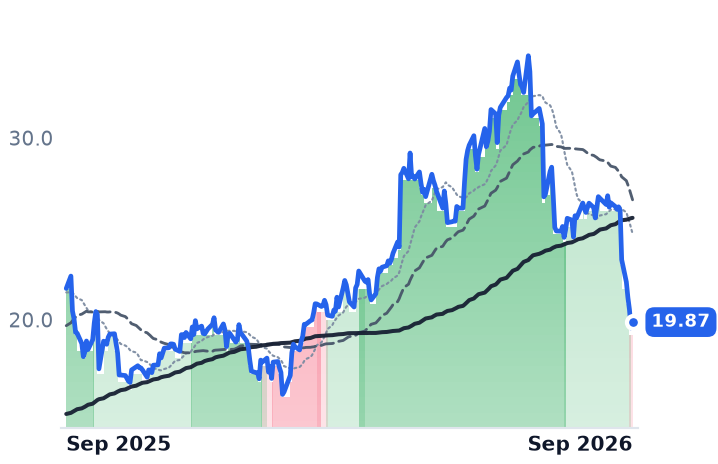
Rush Street Interactive's June-quarter revenue hit a record $393.8m with operating margin at 11.7%, and consensus still has revenue up 42.4% this year. Its shares lost nearly a quarter of their value in six sessions that began with one data point about a rival exchange.

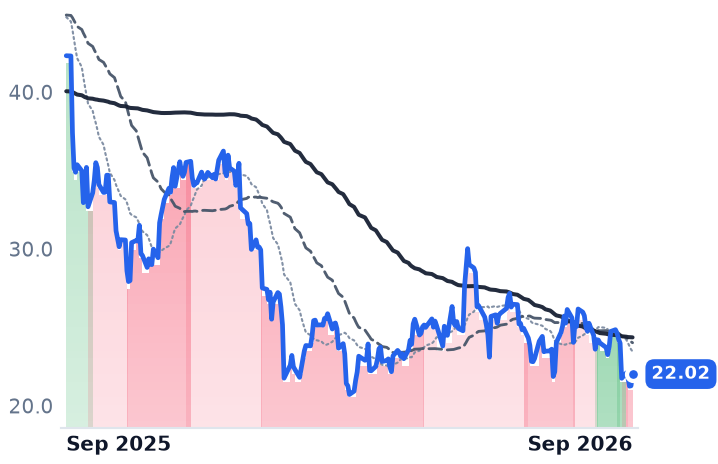
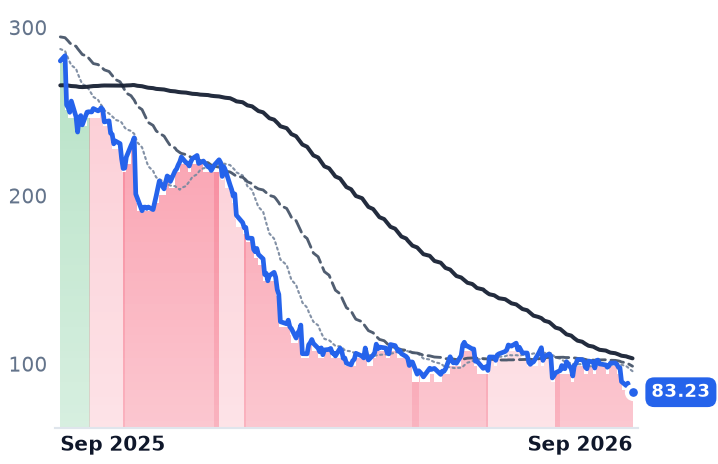
At DraftKings and Flutter the damage is earned. DraftKings' hold on sports wagers fell to 6.8% from 8.7% while volume grew, and Flutter's 2026 consensus earnings sit 37% below what 2025 delivered, after four guidance cuts. Rush Street's numbers went the other way, and its shares did not.
RSIDKNGFLUTSGHCOnline Casino iGamingSports Prediction MarketsGaming Regulation & PreemptionLatin America Expansion
TickerCompanySegmentTrend · 13mo30D1Y
The subject · what this brief is about
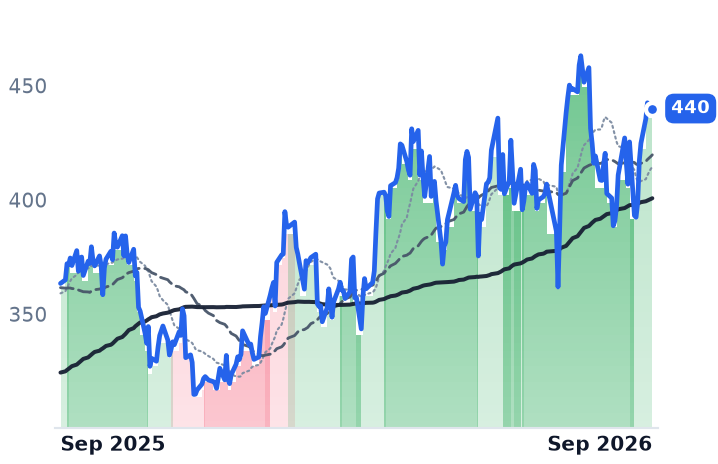
RSIRush Street InteractiveOnline Sports Betting & iGaming🟢 Cont. Bull−24.1%−8.5%
DKNGDraftKingsOnline Sports Betting & iGaming🔴 Cont. Bear−11.0%−48.0%
FLUTFlutter EntertainmentOnline Sports Betting & iGaming🔴 Cont. Bear−14.3%−70.3%
Compared against · context, not the story
SGHCSuper Group (SGHC)Online Sports Betting & iGaming🟢 Cont. Bull−13.2%−9.6%

12-month price & trend

RSI
Rush Street Interactive
19.87
+0.33 (+1.69%)
vs. prior close
Price20d50d150d
RSI 12-month price
Online Sports Betting & iGaming
DKNG
DraftKings
22.02
+0.75 (+3.53%)
vs. prior close
Price20d50d150d
DKNG 12-month price
Online Sports Betting & iGaming
FLUT
Flutter Entertainment
83.23
+1.34 (+1.64%)
vs. prior close
Price20d50d150d
FLUT 12-month price
Online Sports Betting & iGaming
TickerMkt capP/EP/E fwdP/SP/S fwdP/GPP/GP fwdEV/EBITDAFCF yld
RSI$4.9B64.7x32.1x3.6x3.1x10.3x8.9x24.1x3.5%
DKNG$10.9Bn/m185.9x1.8x1.6x4.3x4.0x72.6x5.6%
FLUT$14.4Bn/m17.4x0.8x0.8x2.0x1.9x16.0x5.3%
SGHC
Super Group (SGHC)
11.97
−0.01 (−0.08%)
vs. prior close
Price20d50d150d
SGHC 12-month price
Online Sports Betting & iGaming
TickerMkt capP/EP/E fwdP/SP/S fwdP/GPP/GP fwdEV/EBITDAFCF yld
SGHC$6.3B16.9x16.9x2.6x2.7x8.8x9.3x9.5x4.0%

Consensus projections

TickerFY2026EFY2027EFY2028E
RSIRevenue+42.4%+16.0%+15.7%
EPS+53.9%+35.4%+25.7%
DKNGRevenue+11.0%+13.1%+12.1%
EPS−175.9%+633.0%+82.9%
FLUTRevenue+7.9%+8.4%+8.7%
EPS−37.1%+51.0%+41.7%
SGHCRevenue+20.9%+8.6%+8.2%
EPS+69.7%+17.0%+10.8%

Forward fiscal years only. Blank means no analyst coverage for that year.

A unanimous federal appeals panel ruled on 25 September that Ohio and Tennessee may apply their gambling laws to Kalshi's sports event contracts, rejecting the argument that the Commodity Futures Trading Commission holds exclusive jurisdiction over them. It was the second appellate defeat in nine days for the exchanges that licensed sportsbooks blame for their September collapse, and the shares that stood to gain barely responded: DraftKings closed up 3.5%, Rush Street Interactive 1.7%, Flutter 1.6%, after intraday quotes of more than 7% and 6% for the first two.

Rush Street Interactive — the BetRivers brand in the United States and Latin America, majority online casino rather than sports betting — is the worst thirty-day performer among the four listed online gambling operators, down 23% and 42% below its one-year high. Its business is moving the other way. Revenue growth has accelerated for four consecutive quarters, to 46.3% in the June quarter, and operating margin has widened from 7.0% to 11.7% across the same span. What is at issue is whether September repriced sportsbook economics or a label.

One session did it

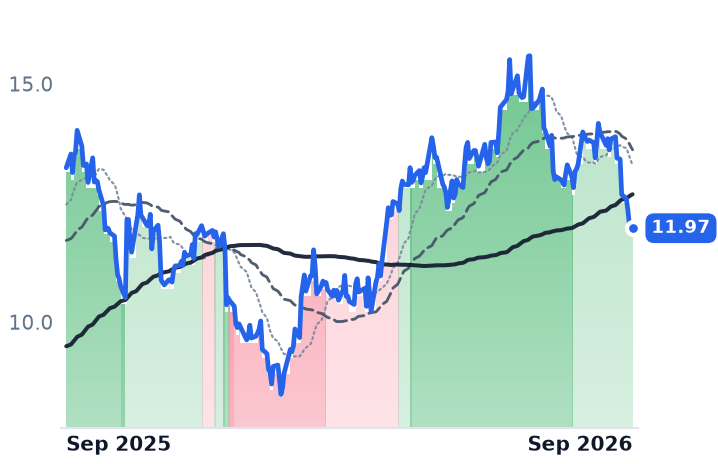
The decline was a single event rather than a drift. All four were flat or rising into 17 September — DraftKings' 50-day average was still above its 200-day — and all four gapped down together the next session: Rush Street 10.5%, DraftKings 9.3%, Flutter 8.4%, Super Group 5.5%. The trigger was Needham data showing Kalshi took 76% of NFL Week 1 prediction-market volume against roughly 3% for DraftKings' own exchange. Rush Street's whole thirty-day loss happened in the six sessions from that gap.

Both halves of the case have since weakened. Needham's adjusted read on 25 September put Kalshi's Week 1 share at 67%, not the 76% first reported, after estimating $2.1bn of consumer-equivalent handle and stripping out professional traders. The Ninth Circuit held on 16 September that two California tribes were likely to prevail against event contracts on tribal lands, and the Sixth Circuit panel wrote that "we conclude that Kalshi's contracts do not depend on events that are 'associated with a potential financial, economic, or commercial consequence' within the meaning of the statute." The Third Circuit holds such state enforcement pre-empted; the split is widely expected to reach the Supreme Court.

The one whose numbers improved

Nothing in Rush Street's reporting deteriorated. June-quarter operating income of $46.2m rose 90% year on year, roughly twice the pace of revenue, with Latin American revenue up 195%. Consensus has 2026 revenue at $1.59bn and EBITDA up 45% to $233m — the only one of the four whose forward estimates still embed acceleration. Stifel's Jeffrey Stantial initiated coverage in September at $34, calling it the only listed US-focused online-casino-led pure play and citing "scarcity value" and lower disruption risk from prediction markets. It is also the dearest name here: 64.7x trailing earnings compressing to 32.1x forward, and 8.86x forward gross profit. Coverage of the fall points to sector-wide pressure and recent insider sales, not an operating miss.

Where the de-rating is earned

DraftKings, which runs mobile and retail sportsbooks in 18 states plus its own online casino brands, has a paper trail. June-quarter revenue fell 4.6% to $1.443bn and gross profit fell 16.2% to $551m, turning a $151m operating profit into a $68m loss. The filing names the cause: sports net revenue margin, the share of wagers the book keeps, fell to 6.8% from 8.7% while sports volume grew to $13.1bn, which the company attributed to customer-friendly outcomes and heavier promotions, including on its prediction-markets product. Taxes finish the job and they do not reverse: New Jersey has raised its online sports betting rate from 14.25% to about 21%, Louisiana to 21.5%, Maryland to 20%. At $22.02 the stock trades at 4.03x forward gross profit against 4.33x trailing, with chief executive Jason Robins telling a Wells Fargo conference on 22 September that handle was up 15% through NFL Week 2 and the roughly $1bn adjusted-EBITDA target for 2026 intact.

Flutter, owner of FanDuel alongside Paddy Power, Sky Betting & Gaming, PokerStars, Sisal and Sportsbet, is further along. June-quarter revenue growth slowed to 3.3% from 17.4% a quarter earlier, gross profit fell 12.6%, and a $389m operating profit became a $144m loss. August's cut took full-year revenue down about $395m to $17.91bn and adjusted EBITDA down about $210m to $2.655bn, with US profit guidance cut 22% and chief executive Peter Jackson replaced by Dan Taylor on 1 October. Rothschild & Co downgraded the shares to Neutral on 21 September, calling it the fourth consecutive guidance cut of the year and noting Illinois volumes down about 15%. Consensus 2026 earnings of $4.77 a share are 37% below the $7.59 that 2025 delivered, which is why 17.4x forward earnings means less than it looks.

Super Group, which runs the Betway sportsbook and Spin casino from Guernsey and has completed a full exit from the United States, earns a 25% operating margin and trades at 16.9x trailing earnings. It has no American handle, no state gaming tax and no exchange competitor. It fell 13.5% over the same thirty days.

The verdict

The twelve-month de-rating and the six-session one are different trades. The group's average 34% decline over a year hides DraftKings at -49% and Flutter at -70% against 8% falls at Rush Street and Super Group, and at the two big sportsbooks the business supports the price: hold diluted by promotional spending, a tax line legislatures keep ratcheting, estimates cut four times at Flutter. September did something else. It took a quarter off an online casino operator with expanding margins and a tenth off an operator with no US exposure, on exchange volume figures that have since been revised down and a legal docket that has now gone against the exchanges twice.

Kalshi can appeal a circuit split. Nobody appeals a tax rate — New Jersey's move to roughly 21% sits in DraftKings' cost line for good, whatever the Supreme Court eventually decides about football contracts.

Frontline Fixed Its Quarter at $157,000 a Day; Scorpio's Product Tankers Fell to $30,000

Hypothesis Opus 5 · Research Opus 5 · Writing Opus 5 · Prompt v1.6

Three tanker owners levered to the same closed strait have just published three forward fixture books, and only one of them points down. Frontline and DHT Holdings booked their September-quarter supertanker days at or above what those ships earned in June, against cash breakevens near $23,000 a day. Scorpio Tankers, which hauls refined products, booked its medium-range ships 39% below the $49,551 a day it realised, because two-thirds of the world's long-range product carriers have switched into crude cargoes.

The pricing is inverted. Scorpio is the cheapest of the three on assets, at 1.02 times book value, and it is the one whose rates have already turned; Frontline, at 3.37 times book, is the one still earning more every quarter. And the supply answer is already on order: 183 supertankers contracted in the first half of 2026 against 18 a year earlier.

FRODHTSTNGINSWTRMDTENCrude Tanker RatesProduct Tanker MarketVLCC OrderbookClean-To-Dirty SwitchingShipping Asset Values
TickerCompanySegmentTrend · 13mo30D1Y
The subject · what this brief is about
FROFrontlineMarine Crude & Product Tankers🟢 Cont. Bull+9.5%+113.3%
DHTDHTMarine Crude & Product Tankers🟢 Cont. Bull+13.1%+81.4%
STNGScorpio TankersMarine Crude & Product Tankers🟢 Cont. Bull+5.6%+41.8%
Compared against · context, not the story
INSWInternational SeawaysMarine Crude & Product Tankers🟢 Cont. Bull+7.1%+134.6%
TRMDTORMMarine Crude & Product Tankers🟢 Cont. Bull+9.6%+69.6%
TENTsakos Energy NavigationMarine Crude & Product Tankers🟢 Cont. Bull+11.2%+103.2%

12-month price & trend

FRO
Frontline
47.73
−0.24 (−0.50%)
vs. prior close
Price20d50d150d
FRO 12-month price
Marine Crude & Product Tankers
DHT
DHT
21.78
+0.10 (+0.46%)
vs. prior close
Price20d50d150d
DHT 12-month price
Marine Crude & Product Tankers
STNG
Scorpio Tankers
81.49
+0.53 (+0.65%)
vs. prior close
Price20d50d150d
STNG 12-month price
Marine Crude & Product Tankers
TickerMkt capP/EP/E fwdP/SP/S fwdP/GPP/GP fwdEV/EBITDAFCF yld
FRO$10.6B7.2x4.7x3.9x4.0x7.6x7.8x6.7x6.5%
DHT$3.5B7.4x5.8x4.9x4.0x8.2x6.7x6.3x1.0%
STNG$4.1B4.7x7.1x3.4x3.4x5.7x5.8x2.8x16.1%
INSW
International Seaways
106
+0.79 (+0.75%)
vs. prior close
Price20d50d150d
INSW 12-month price
Marine Crude & Product Tankers
TRMD
TORM
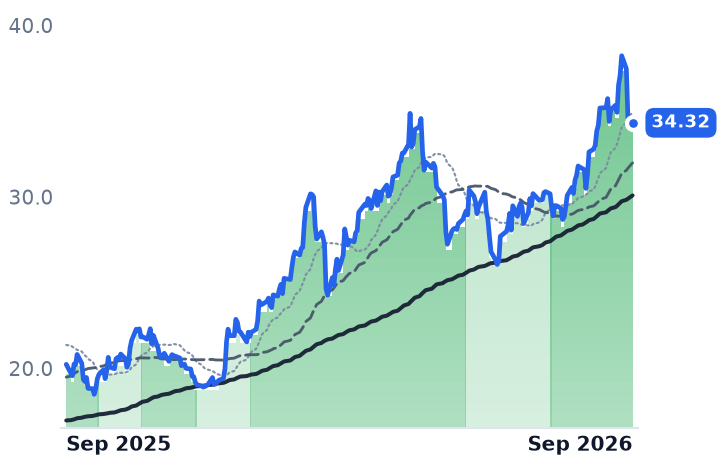
34.32
+0.02 (+0.06%)
vs. prior close
Price20d50d150d
TRMD 12-month price
Marine Crude & Product Tankers
TEN
Tsakos Energy Navigation
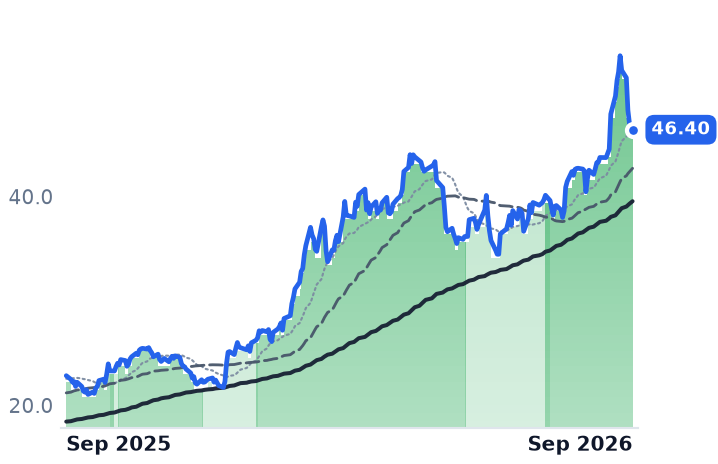
46.40
−0.35 (−0.75%)
vs. prior close
Price20d50d150d
TEN 12-month price
Marine Crude & Product Tankers
TickerMkt capP/EP/E fwdP/SP/S fwdP/GPP/GP fwdEV/EBITDAFCF yld
INSW$5.2B6.7x6.3x4.2x3.8x6.3x5.7x4.3x5.1%
TRMD$3.5B5.7x4.4x2.0x2.3x4.5x5.2x4.7x5.3%
TEN$1.4B4.7x5.1x1.5x1.5x3.4x3.4x6.4x-30.6%

Consensus projections

TickerFY2026EFY2027EFY2028E
FRORevenue+113.6%−25.8%−28.1%
EPS+453.8%−49.5%−36.8%
DHTRevenue+137.9%−24.3%−26.0%
EPS+270.5%−38.8%−29.1%
STNGRevenue+31.7%−25.7%−7.8%
EPS+112.3%−48.2%−16.8%
INSWRevenue+73.1%−23.3%−18.1%
EPS+222.0%−43.5%−28.1%
TRMDRevenue+66.2%−17.8%−13.6%
EPS+187.1%−41.8%−24.6%
TENRevenue+45.5%+2.1%+6.3%
EPS+155.6%−16.9%+40.1%

Forward fiscal years only. Blank means no analyst coverage for that year.

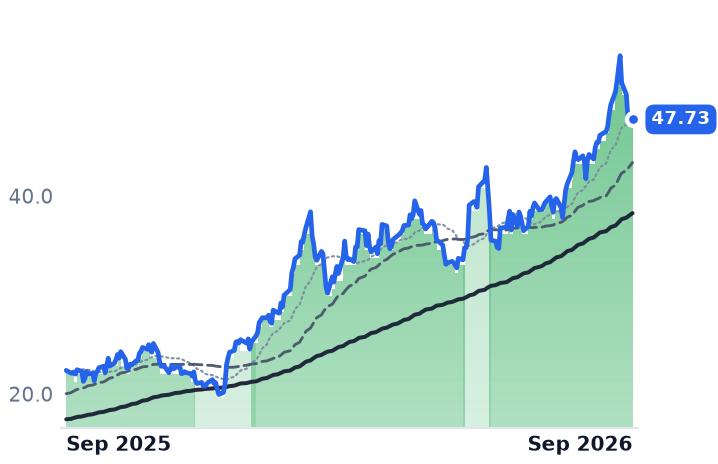
A tanker is paid by the vessel-day, and three listed owners levered to the same closed strait have just published three different forward fixture books. Frontline, the Limassol-based owner of 80 crude and product tankers, has 86% of its September-quarter supertanker days fixed at $157,000 a day — above the $152,700 those ships earned in the June quarter.

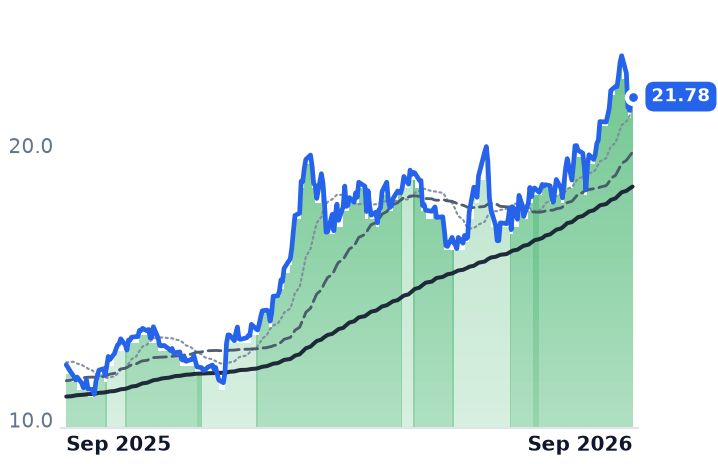
What reaches equity is a spread, not a rate. Frontline's twelve-month forward cash breakeven is $23,800 a day for a very large crude carrier, so June's realisation cleared costs more than six times over, and every dollar above that line falls through to the shareholder. DHT Holdings, a Monaco-run owner of 22 supertankers and nothing else, guides second-half cash breakeven at $22,600 to $23,400 a day and earned $126,700 a day across its fleet in the June quarter. Frontline's revenue nearly doubled year on year; its net income rose 750%, to $659.2m.

Why the days got long

The Strait of Hormuz has run five to eleven transits a day since early March against roughly 125 before the war. Gulf crude bound for Asia goes round the Cape, and cargoes that do emerge are shuttled short-haul and transferred ship-to-ship in the Gulf of Oman. More supertankers are working the Arabian Gulf now than before the fighting, moving fewer barrels: the scarcity is of ship-days. The Baltic Exchange's Gulf-to-China benchmark, assessed near $451,000 a day on 16 September, passed $1.2m in the week of 21 September.

Revenue has accelerated four quarters running at both crude owners — Frontline from $432.7m to $943.3m, DHT from $107.3m to $285.0m — with gross margin widening from around 30% to 65% and 73% respectively. Refinancing is not the explanation: Frontline's $4.8m sequential interest saving is 2.1% of the $226.1m rise in quarterly operating income.

The clean trade went the other way

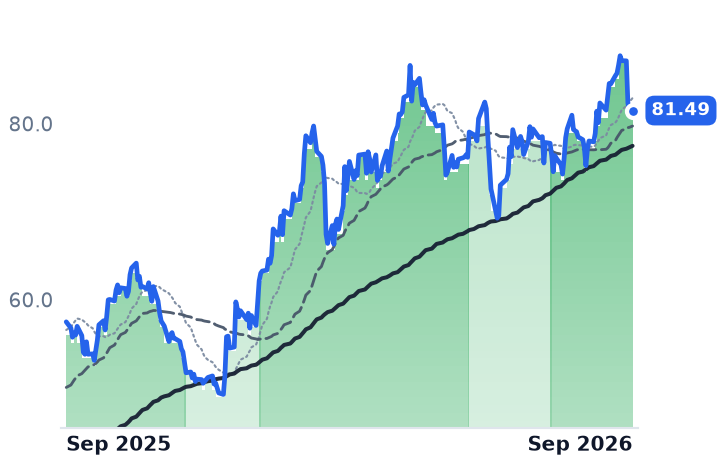
Scorpio Tankers runs 90 wholly owned product carriers — 34 long-range, 42 medium-range and 14 Handymax — and its June quarter was a record, with $387.5m of net income that included a $154m gain on the sale of ten vessels. Its own 3 September fixture update is the warning: medium-range ships booked at $30,000 a day against $49,551 realised, Handymax at $25,500 against $47,327. Only the long-range class, which can switch into crude, booked higher.

The mechanism is class arbitrage. Roughly two-thirds of the world's long-range product tankers have been dirtied up into crude service, because on 11 September a Mediterranean crude cargo paid just over $115,200 a day while a comparable clean cargo running east through Suez paid just under $38,000. Clean tonnage is scarcer by about 70 large carriers, yet the cross-basin share of long-haul clean exports fell to 28.9% from 31.7% — fewer ships, shorter voyages. TORM, the closest listed product-tanker comparable, reports third-quarter bookings averaging $38,600 a day against $59,301 realised, with medium-range ships the laggard. Scorpio chartered out two long-range ships, STI Gladiator and STI Jermyn, for three years at $40,188 and $42,500 a day, below its own current spot.

What the steel costs

Scorpio trades at 1.02 times book value with $1.3bn of net cash and a cash breakeven near $11,000 a day, and at 2.81 times trailing earnings before interest, tax, depreciation and amortisation it is the cheapest of the three on assets. It is also the only one whose forward earnings multiple, 7.1 times, sits above its trailing 4.7 times: consensus has 2026 earnings per share at $11.53 against roughly $17.45 trailing.

Frontline at 3.37 times book and DHT at 2.64 times are the expensive pair, and both look cheap only against this year. Frontline's 2026 consensus of $10.07 a share is cut to $5.08 for 2027, putting the shares on 9.4 times next year's number; DHT's estimates imply the same 9.4 times.

Those cuts exist because of supply. Frontline's own count puts the supertanker orderbook at 33.5% of the existing fleet, 40% of the efficient fleet, near its 2008-09 peak, and 183 contracts were placed in the first half of 2026 against 18 a year earlier, the highest half-year tally since 1973. Scrapping stays minimal because roughly 170 sanctioned ships, mostly over 20 years old, barely trade at all.

Chief executive Lars H. Barstad sold two of Frontline's supertankers for about $270m, and explained the arithmetic on the 28 August call: "For us to decline selling at that level, we have to believe that we were gonna make almost $70 thousand per day every day until that vessel was 20 years old... We thought that was a bold ask." Frontline paid $179m of the proceeds straight out as a special dividend of $0.80 a share on top of a $2.61 ordinary payment — $3.41 a share in one quarter against a $47.73 share price. DHT paid $1.22 against $1.23 of earnings, its 66th consecutive quarterly dividend.

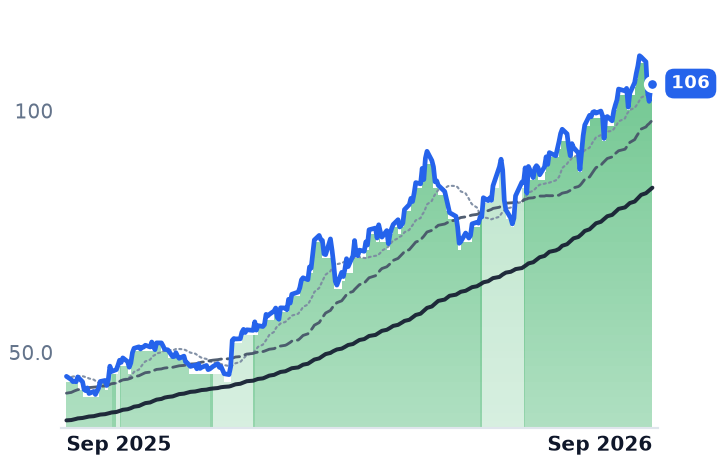
Every listed name in the trade printed a 52-week high on 17 or 18 September and then fell between 5% and 13% in five sessions, Frontline by 11.9%, after a senior Iranian official told Reuters that Tehran could reopen Hormuz within seven days if Washington eased military pressure and lifted its naval blockade.

So the crude leg earns its advance and the clean leg has already begun handing part of its own back, with the pricing inverted against both: the cheapest fleet belongs to the owner whose rates are falling, the dearest to the two whose rates are still rising. Neither Frontline nor DHT retains the peak; both distribute it, which makes each a claim on the next fixture rather than on an accumulating balance sheet. Scorpio, which kept the cash, is the one whose fixture book turned.

A reopened strait would not take a single ship out of the water. It would simply make every voyage shorter — and distance, not barrels, is what these owners sell.

The Energy Department Cut Centrus to a $15m Storage Contract That Expires September 30

Hypothesis Opus 5 · Research Opus 5 · Writing Opus 5 · Prompt v1.6

The only federal contract that ever paid an American company to make high-assay low-enriched uranium has been reduced to a three-month caretaking job, and it runs out this week. Centrus Energy's enrichment unit sales fell 23% in the June quarter and operating income fell 69% to $10.4m; the government-funded engineering segment that housed the fuel work shrank 21% to $22.7m.

Sixteen days after selling $500m of stock and warrants at $199.64 a unit, Centrus closed at $147.07, leaving all four warrant strikes out of the money. Consensus carries 2026 earnings of $2.55 a share against $3.90 delivered in 2025, and the forward and trailing earnings multiples sit within a point of each other — what no growth looks like. BWX Technologies and Cameco, paid by contract and by the pound, show their damage somewhere else or not at all.

LEUBWXTCCJOKLOSMRNNELTBRUUUUUECURAURNMSPYUranium Enrichment CapacityHALEU Fuel SupplyAdvanced Reactor Fuel CycleNaval & Microreactor ProgramsUranium Mining EconomicsGovernment Nuclear Contracts
TickerCompanySegmentTrend · 13mo30D1Y
The subject · what this brief is about
LEUCentrus EnergyUranium🔴 Cont. Bear−24.5%−51.8%
BWXTBWX TechnologiesNaval & Shipbuilding🔴 Cont. Bear−10.8%−23.1%
CCJCamecoUranium🔴 Cont. Bear−17.2%+3.1%
Compared against · context, not the story
OKLOOkloEmerging & Specialized Energy🔴 Cont. Bear−11.0%−65.6%
SMRNuScale PowerAdvanced Nuclear🔴 Cont. Bear−10.8%−77.4%
NNENano Nuclear EnergyPower & Propulsion Systems🔴 Cont. Bear−11.6%−56.8%
LTBRLightbridgeElectrical Equipment & Parts🔴 Cont. Bear−15.7%−68.1%
UUUUEnergy FuelsUranium🔴 Cont. Bear−27.2%−32.1%
UECUranium EnergyUranium🔴 Cont. Bear−30.9%−31.2%
URAGlobal X - Uranium ETFAsset Management🔴 Cont. Bear−14.4%−11.1%
URNMSprott Uranium Miners ETFAsset Management🔴 Cont. Bear−18.9%−16.0%
SPYState Street SPDR S&P 500 ETF TrustAsset Management🟢 Cont. Bull−0.2%+16.8%

12-month price & trend

LEU
Centrus Energy
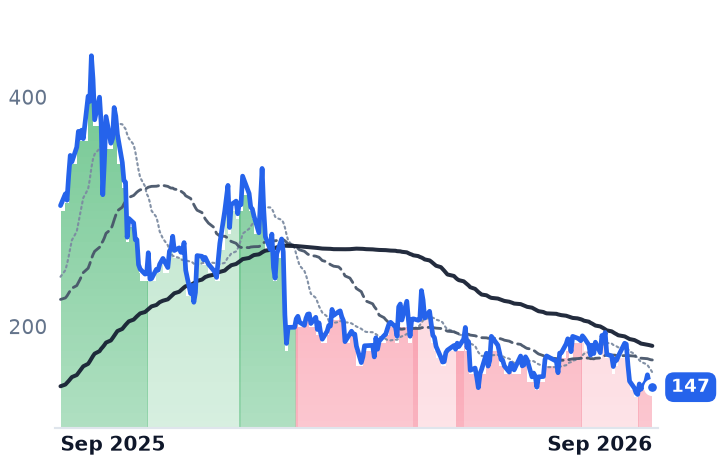
147
−0.25 (−0.17%)
vs. prior close
Price20d50d150d
LEU 12-month price
Uranium
BWXT
BWX Technologies
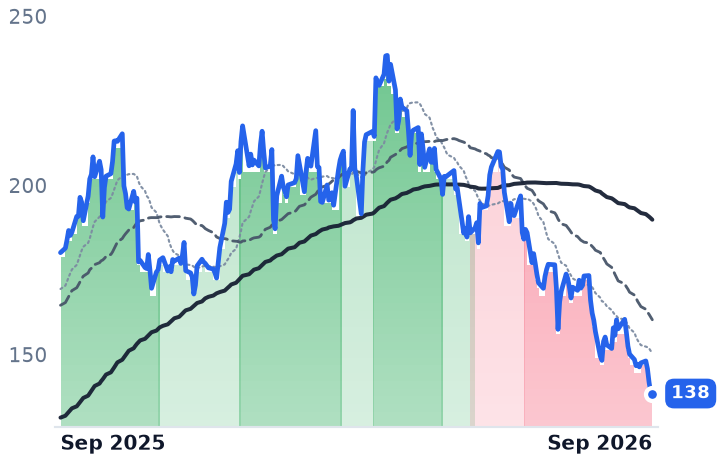
138
−0.21 (−0.15%)
vs. prior close
Price20d50d150d
BWXT 12-month price
Naval & Shipbuilding
CCJ
Cameco
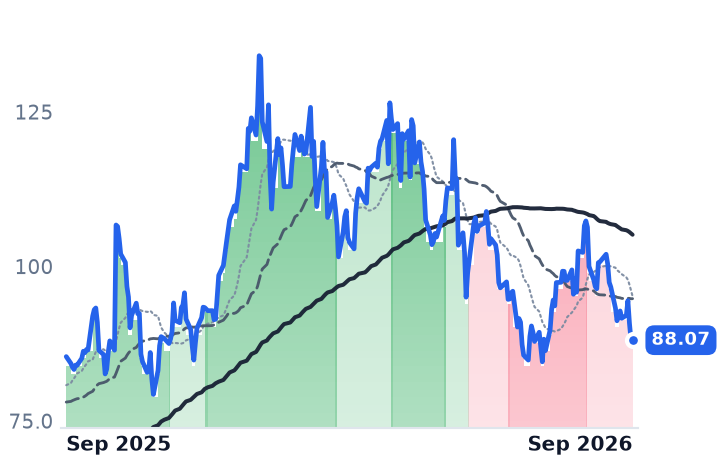
88.07
−0.05 (−0.06%)
vs. prior close
Price20d50d150d
CCJ 12-month price
Uranium
TickerMkt capP/EP/E fwdP/SP/S fwdP/GPP/GP fwdEV/EBITDAFCF yld
LEU$2.8B58.6x57.8x5.9x5.9x25.3x25.4x28.8x-8.0%
BWXT$12.7B35.7x29.2x3.6x3.3x16.4x15.1x25.5x2.5%
CCJ$38.4B152.3x59.1x15.6x11.1x56.6x40.1x62.8x0.9%
OKLO
Oklo
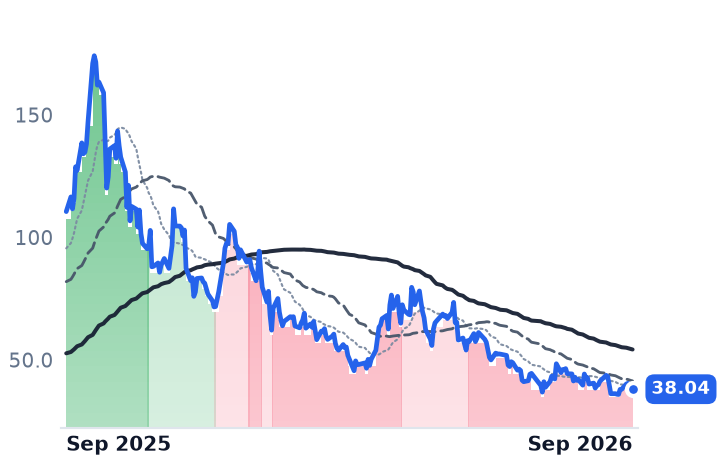
38.04
−0.25 (−0.65%)
vs. prior close
Price20d50d150d
OKLO 12-month price
Emerging & Specialized Energy
SMR
NuScale Power
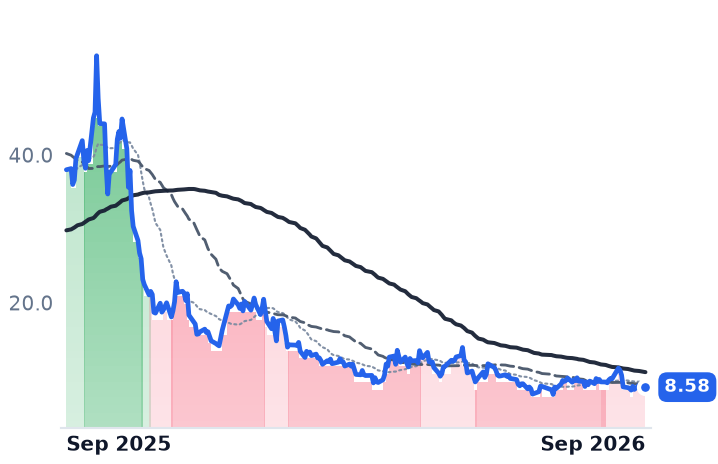
8.58
+0.11 (+1.30%)
vs. prior close
Price20d50d150d
SMR 12-month price
Advanced Nuclear
NNE
Nano Nuclear Energy
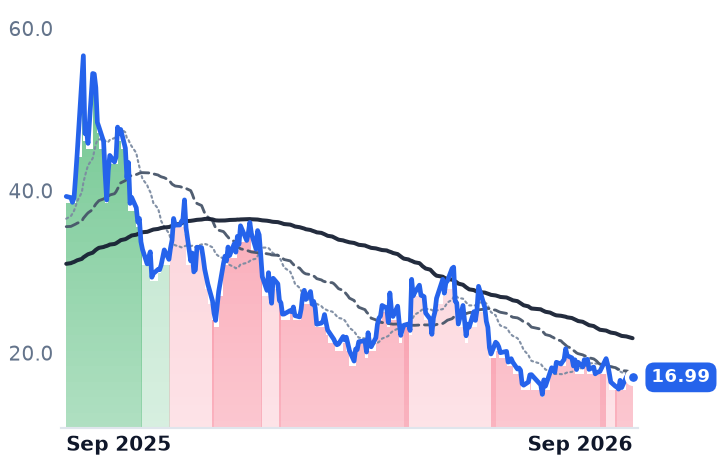
16.99
−0.03 (−0.18%)
vs. prior close
Price20d50d150d
NNE 12-month price
Power & Propulsion Systems
TickerMkt capP/EP/E fwdP/SP/S fwdP/GPP/GP fwdEV/EBITDAFCF yld
OKLO$6.6Bn/m—————n/m-4.2%
SMR$3.0Bn/m—284.6x160.7x—762.7xn/m-25.5%
NNE$1.1Bn/m——887.7x——n/m-3.7%
LTBR
Lightbridge
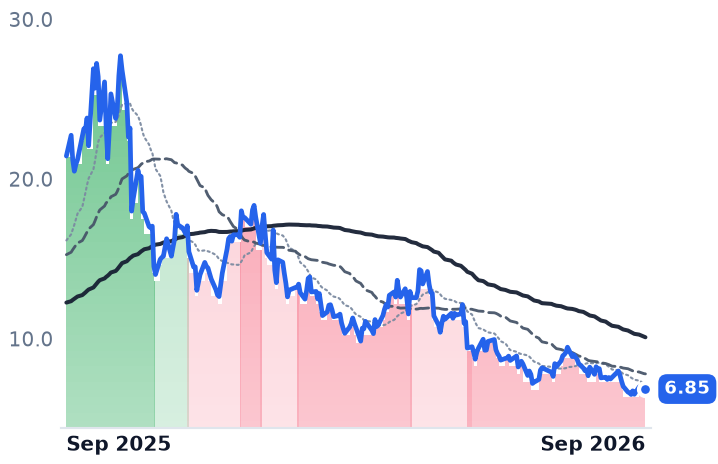
6.85
+0.12 (+1.78%)
vs. prior close
Price20d50d150d
LTBR 12-month price
Electrical Equipment & Parts
UUUU
Energy Fuels
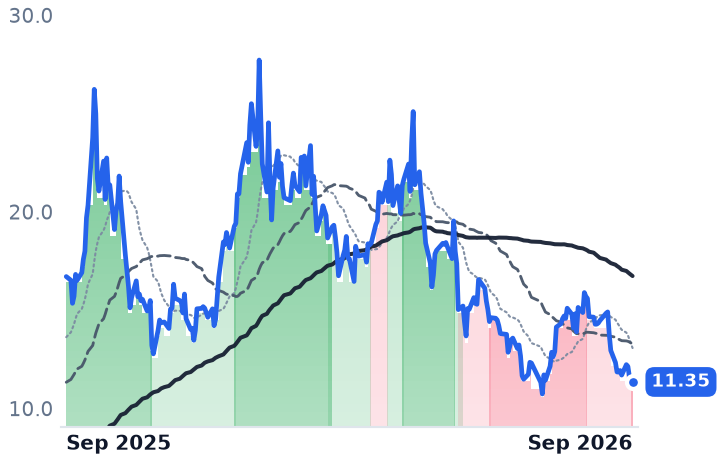
11.35
+0.03 (+0.27%)
vs. prior close
Price20d50d150d
UUUU 12-month price
Uranium
UEC
Uranium Energy
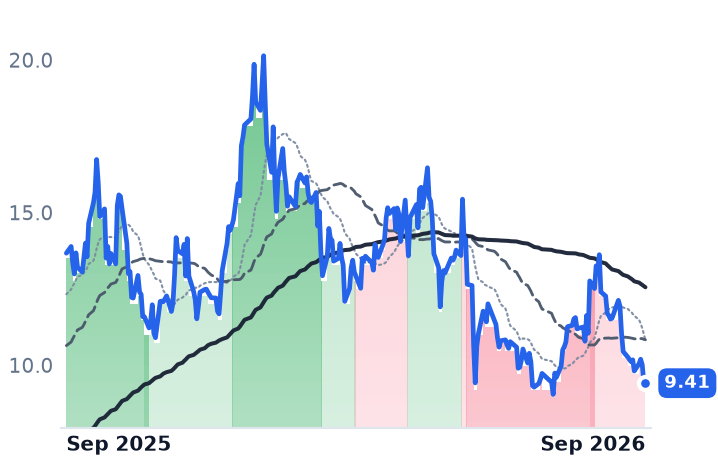
9.41
−0.01 (−0.05%)
vs. prior close
Price20d50d150d
UEC 12-month price
Uranium
TickerMkt capP/EP/E fwdP/SP/S fwdP/GPP/GP fwdEV/EBITDAFCF yld
LTBR$258.0Mn/m—n/m———n/m-6.6%
UUUU$2.8Bn/m—26.8x21.3x62.0x49.3xn/m-3.9%
UEC$5.1Bn/m—253.1x49.9x598.0x117.9xn/m-2.4%
URA
Global X - Uranium ETF
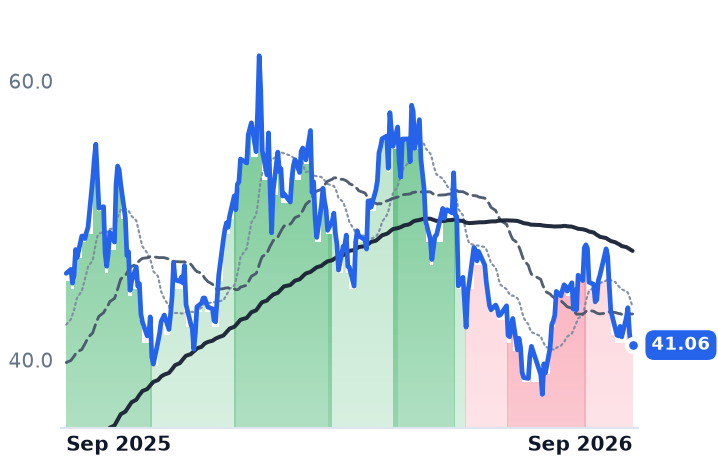
41.06
+0.20 (+0.49%)
vs. prior close
Price20d50d150d
URA 12-month price
Asset Management
URNM
Sprott Uranium Miners ETF
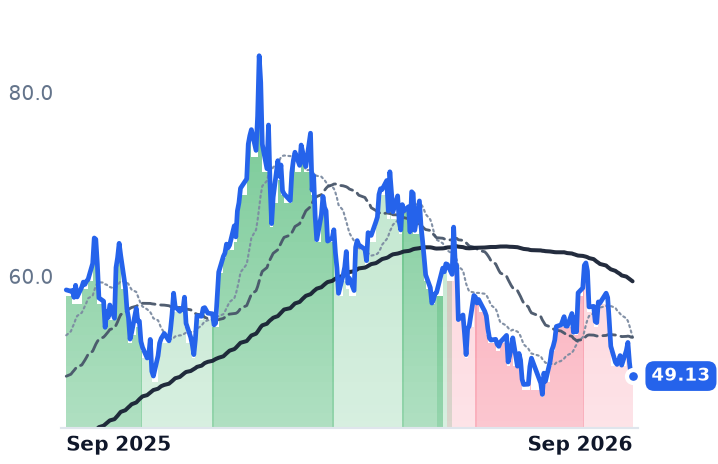
49.13
+0.00 (+0.01%)
vs. prior close
Price20d50d150d
URNM 12-month price
Asset Management
SPY
State Street SPDR S&P 500 ETF Trust
769
+1.62 (+0.21%)
vs. prior close
Price20d50d150d
SPY 12-month price
Asset Management
TickerMkt capP/EP/E fwdP/SP/S fwdP/GPP/GP fwdEV/EBITDAFCF yld
URA$3.9B————————
URNM$1.1B————————
SPY$773.0B————————

Consensus projections

TickerFY2026EFY2027EFY2028E
LEURevenue+5.2%−0.8%−10.9%
EPS−43.2%+13.2%−23.3%
BWXTRevenue+20.6%+9.8%+7.3%
EPS+24.1%+11.2%+11.8%
CCJRevenue+1.3%+12.3%+8.4%
EPS+3.8%+70.4%+24.8%
OKLORevenue—+247.8%+498.2%
EPS+64.1%+8.1%+10.3%
SMRRevenue−54.8%+517.4%+185.1%
EPS−76.8%+19.4%−24.8%
NNERevenue+1684.0%+356.5%+39.0%
EPS−23.4%+55.2%+34.3%
UUUURevenue+128.1%+88.3%+62.7%
EPS−37.3%−160.5%+170.0%
UECRevenue−61.4%+301.4%+159.3%
EPS+50.7%−74.9%−447.4%

Forward fiscal years only. Blank means no analyst coverage for that year.

On 30 June the Department of Energy let the contract that paid Centrus Energy to produce high-assay low-enriched uranium expire, and replaced it with paid caretaking: a fixed $15.0m for three months of cascade maintenance and material storage, with no enrichment at all. That replacement expires on 30 September, and the department has told the company it "does not currently intend to exercise further options" under the agreement. A 21-month follow-on option exists on paper; no one has exercised it.

Centrus sells separative work units and enriched uranium to nuclear utilities and runs a government-funded engineering arm, and it is the only US-based producer of the fuel grade most advanced-reactor designs require. So the question hanging over the whole enrichment build-out — whether it is being funded or merely announced — now carries a date, and the date is four days out.

What the meters already said

The June quarter showed what losing the production contract costs. Separative work unit volumes fell 23% year over year with average unit cost up 13%, and the government-funded Technical Solutions segment fell 21% to $22.7m. Revenue still grew 14% to $176.1m, but on $53.4m of uranium resales rather than on enrichment work, and operating income fell 69% to $10.4m as gross margin narrowed to 28.3% from 34.9%. March-quarter operating income had already fallen 96%, to $0.8m.

"This was another strong quarter of financial and operational progress for Centrus that included a number of commercial wins for our future enrichment business," chief executive Amir Vexler said in the results release of 5 August, citing "the growing imbalance in uranium enrichment supply and demand."

The market has taken the other side. Consensus puts 2026 earnings at $2.55 a share against $3.90 delivered in 2025, with 2027 revenue expected marginally below 2026. At 57.8x forward earnings versus 58.6x trailing, the multiple pair embeds contraction, not the buildout. And the $500m of stock and warrants priced on 9 September at $199.64 a unit closed at $147.07 on 25 September, 26.3% below issue, with warrant strikes running from $226.86 to $362.98 — every one of them out of the money, over roughly 7m shares.

Paid by contract, paid by the pound

The other two ways to be paid for the same trend are behaving differently. BWX Technologies, which builds naval reactors and fuel for the Navy and the Energy Department alongside commercial nuclear components, ended June with $8.4bn of backlog, up 40%, and raised all four of its 2026 guidance lines on 3 August; in late August the Army named it in the $2.2bn Project Janus microreactor programme. Its shares have de-rated anyway, to 29.2x forward earnings from roughly 46-47x in May. The honest qualifier: reported operating income has fallen year over year for four straight quarters, down 12.2% in the June period, as lower-margin acquired commercial work pulled gross margin to 22.4% from 25.1%.

Cameco's damage is real but sits in the wrong leg. The mining half improved — 2026 realized-price guidance was raised to C$91.00-96.00 a pound from C$85.00-89.00 (Cameco reports in Canadian dollars), and Kazatomprom is cutting about 8m pounds from 2026 output. But its share of Westinghouse swung to a $10m net loss from $126m of earnings a year earlier, taking group net income down 92.1%. At 59.1x forward earnings, the de-rating is working on reactor services, not pounds.

Which part is earned

Over twelve months the selling was rank-ordered by distance from audited cash flow: NuScale down 78.4%, Oklo 71.0%, Centrus 53.4%, against BWXT's 23.9% and Cameco up 2.8%. In the five sessions to 25 September it inverted — NANO Nuclear up 8.0% and NuScale 3.7% while BWXT fell 6.1% and Cameco 3.9%. The newest leg is landing on the companies with earnings, which the label-repricing story does not explain; a higher long bond, with the 30-year Treasury yield above 5.5% for the first time since 2004, discounts 2033 reactor cash flows harder than it touches a 2026 order book.

So two of the three de-ratings are earned and one is not. Centrus's shrinking volumes and lapsed contract justify the price; Cameco's justifies itself through Westinghouse while the pounds get better; BWXT's rising backlog and raised guidance explain none of its own decline, only its falling margin mix does part of it. Holtec's cancelled $900m listing this month says the primary market for new nuclear capital narrowed at the same time.

The one federal contract that ever paid Centrus to enrich fuel now pays it to guard the building, and that stops in four days.

Solid Power's Revenue Went Negative. Its BMW-Samsung Evaluation Phase Ends September 30

Hypothesis Opus 5 · Research Opus 5 · Writing Opus 5 · Prompt v1.6

A battery developer whose entire revenue line is partner milestone payments has run out of milestones, and its balance sheet is now most of what the equity is worth. Solid Power reversed previously recognized revenue on its SK On licence in the June quarter, leaving the reported line below zero; the last paid milestone under that agreement was finished in April.

Consensus now models 2026 revenue of $5.5m against $21.7m in 2025, and Phase 1 of the joint evaluation with Samsung SDI and BMW expires on September 30 with the follow-on unsigned. Against $419.3m of liquidity and no debt, a $537.7m market value ascribes roughly $118m to the solid-state technology itself.

EnerSys and Eos Energy fell over the same three months with their operating numbers improving. Their decline is financing cost; Solid Power's is contract flow.

SLDPENSEOSEFLNCENVXAMPXTESTEMRUNFSLRENPHVRTETNSPYSolid-State Battery DevelopmentEV Cell Chemistry PartnershipsGrid-Scale Energy StorageClean Energy Financing CostsData Center Backup PowerManufacturing Tax Credits
TickerCompanySegmentTrend · 13mo30D1Y
The subject · what this brief is about
SLDPSolid PowerEnergy Storage & Batteries🔴 Cont. Bear−0.4%−35.9%
ENSEnerSysEnergy Storage & Batteries⚠️ Emerging Bear−5.9%+60.8%
EOSEEos Energy EnterprisesEnergy Storage & Batteries🔴 Cont. Bear−9.2%−68.7%
Compared against · context, not the story
FLNCFluence EnergyEnergy Storage Systems⚠️ Emerging Bear−30.5%−34.1%
ENVXEnovixEnergy Storage & Batteries🔴 Cont. Bear−19.0%−71.6%
AMPXAmprius TechnologiesEnergy Storage & Batteries⚠️ Emerging Bear−6.8%−10.8%
TET1 EnergyEnergy Storage & Batteries⚠️ Emerging Bear−21.2%+74.7%
STEMStemRenewable Utilities🔴 Cont. Bear−23.8%−75.5%
RUNSunrunResidential Solar Installers🔴 Cont. Bear−14.2%−55.6%
FSLRFirst SolarSolar Module Manufacturers⚠️ Emerging Bear−15.8%−19.2%
ENPHEnphase EnergyInverters & Power Electronics🔴 Cont. Bear−16.8%−11.2%
VRTVertivData Center Power & Thermal⚠️ Emerging Bear−6.8%+81.1%
ETNEatonPower & Propulsion Systems🟢 Cont. Bull+4.7%+21.1%
SPYState Street SPDR S&P 500 ETF TrustAsset Management🟢 Cont. Bull−0.2%+16.8%

12-month price & trend

SLDP
Solid Power
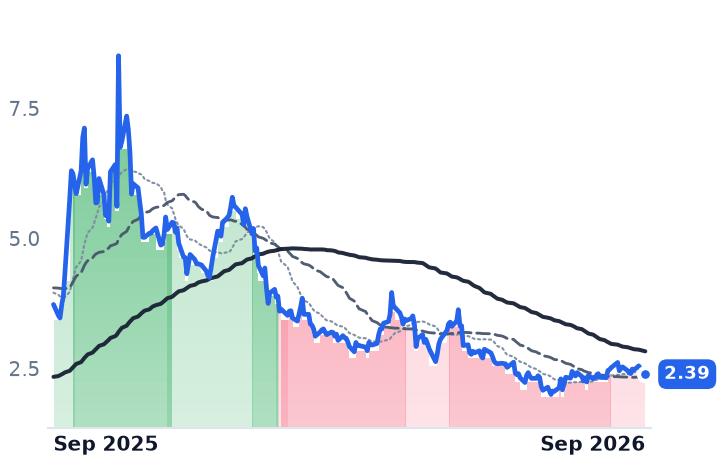
2.39
+0.04 (+1.70%)
vs. prior close
Price20d50d150d
SLDP 12-month price
Energy Storage & Batteries
ENS
EnerSys
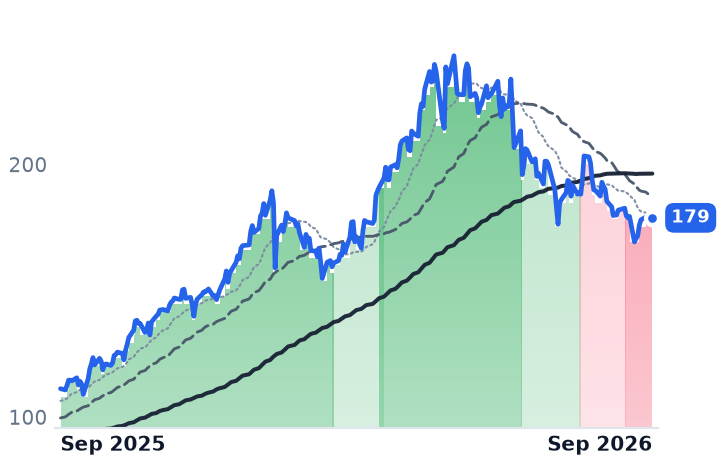
179
+1.76 (+0.99%)
vs. prior close
Price20d50d150d
ENS 12-month price
Energy Storage & Batteries
EOSE
Eos Energy Enterprises
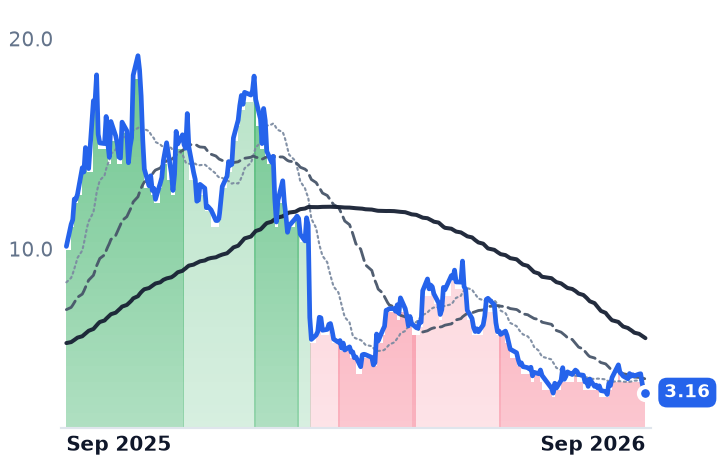
3.16
−0.08 (−2.47%)
vs. prior close
Price20d50d150d
EOSE 12-month price
Energy Storage & Batteries
TickerMkt capP/EP/E fwdP/SP/S fwdP/GPP/GP fwdEV/EBITDAFCF yld
SLDP$537.7Mn/m—52.5x97.7x——n/m-13.4%
ENS$6.5B18.7x13.4x1.7x1.7x5.6x5.5x12.0x11.0%
EOSE$916.5Mn/m—4.3x3.0x——n/m-45.9%
FLNC
Fluence Energy
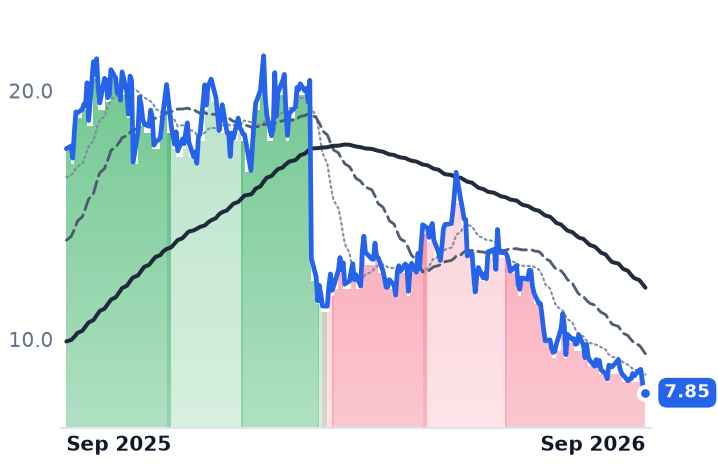
7.85
+0.39 (+5.23%)
vs. prior close
Price20d50d150d
FLNC 12-month price
Energy Storage Systems
ENVX
Enovix
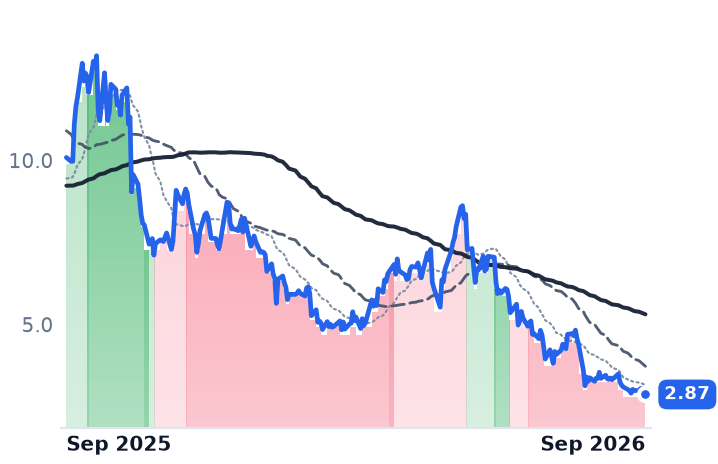
2.87
−0.09 (−3.04%)
vs. prior close
Price20d50d150d
ENVX 12-month price
Energy Storage & Batteries
AMPX
Amprius Technologies
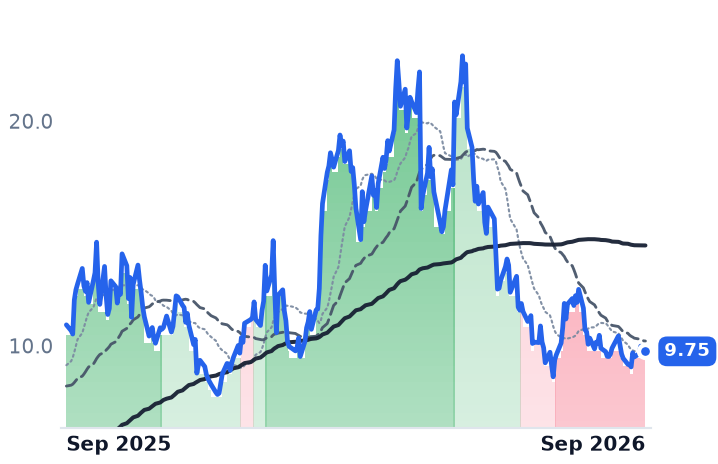
9.75
+0.06 (+0.62%)
vs. prior close
Price20d50d150d
AMPX 12-month price
Energy Storage & Batteries
TickerMkt capP/EP/E fwdP/SP/S fwdP/GPP/GP fwdEV/EBITDAFCF yld
FLNC$1.4Bn/m—0.5x0.5x5.6x5.8xn/m-9.7%
ENVX$737.4Mn/m—20.6x19.1x——n/m-16.8%
AMPX$1.5Bn/m—13.8x11.1x61.9x49.7xn/m-3.9%
TE
T1 Energy
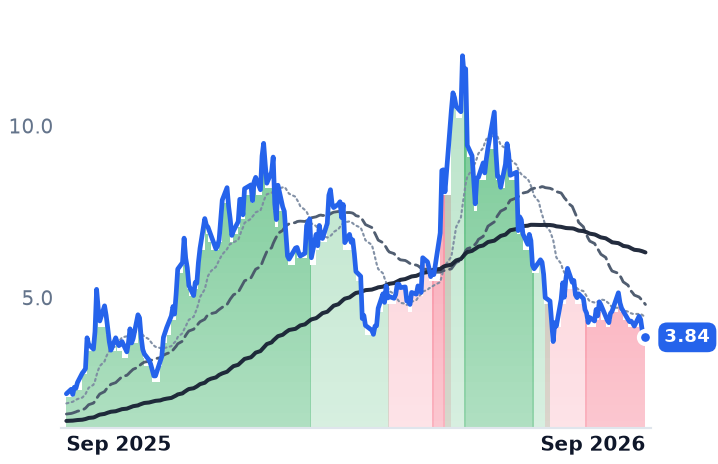
3.84
+0.03 (+0.87%)
vs. prior close
Price20d50d150d
TE 12-month price
Energy Storage & Batteries
STEM
Stem
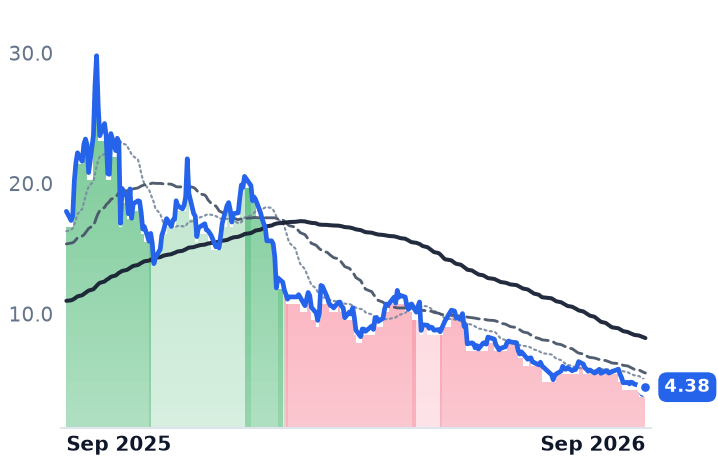
4.38
+0.48 (+12.31%)
vs. prior close
Price20d50d150d
STEM 12-month price
Renewable Utilities
RUN
Sunrun
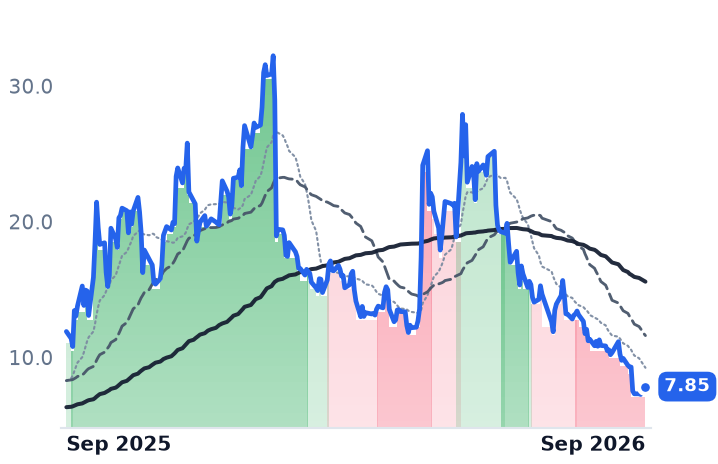
7.85
+0.07 (+0.90%)
vs. prior close
Price20d50d150d
RUN 12-month price
Residential Solar Installers
TickerMkt capP/EP/E fwdP/SP/S fwdP/GPP/GP fwdEV/EBITDAFCF yld
TE$1.3Bn/m—1.3x1.3x15.3x15.7xn/m-14.6%
STEM$49.4Mn/m—0.3x0.3x0.9x0.9xn/m11.8%
RUN$2.1B5.1x6.9x0.6x0.7x1.7x1.9x23.4x-65.0%
FSLR
First Solar
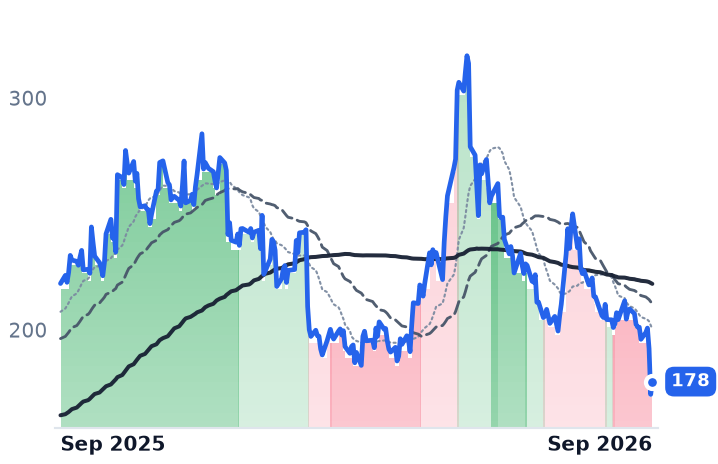
178
+5.55 (+3.22%)
vs. prior close
Price20d50d150d
FSLR 12-month price
Solar Module Manufacturers
ENPH
Enphase Energy
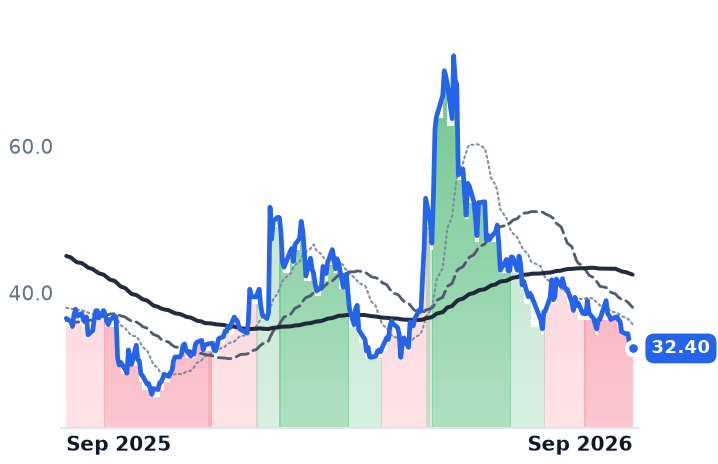
32.40
−0.42 (−1.28%)
vs. prior close
Price20d50d150d
ENPH 12-month price
Inverters & Power Electronics
VRT
Vertiv
251
+5.60 (+2.28%)
vs. prior close
Price20d50d150d
VRT 12-month price
Data Center Power & Thermal
TickerMkt capP/EP/E fwdP/SP/S fwdP/GPP/GP fwdEV/EBITDAFCF yld
FSLR$22.5B12.9x12.0x4.2x4.5x9.5x10.2x8.6x6.7%
ENPH$4.9B36.1x18.4x3.7x4.1x7.8x8.7x27.9x3.1%
VRT$100.8B58.0x39.0x8.8x7.2x23.4x19.2x40.1x2.9%
ETN
Eaton
440
−0.02 (−0.00%)
vs. prior close
Price20d50d150d
ETN 12-month price
Power & Propulsion Systems
SPY
State Street SPDR S&P 500 ETF Trust
769
+1.62 (+0.21%)
vs. prior close
Price20d50d150d
SPY 12-month price
Asset Management
TickerMkt capP/EP/E fwdP/SP/S fwdP/GPP/GP fwdEV/EBITDAFCF yld
ETN$165.2B43.1x31.4x5.5x5.0x15.3x14.0x28.8x2.7%
SPY$773.0B————————

Consensus projections

TickerFY2026EFY2027EFY2028E
SLDPRevenue−73.3%+19.4%+617.7%
EPS−23.1%+12.5%+13.3%
ENSRevenue+3.3%+4.6%+4.9%
EPS+3.5%+29.2%+7.5%
EOSERevenue+104.1%+87.2%+86.5%
EPS−82.9%−69.8%−181.4%
FLNCRevenue−2.2%+29.5%+23.4%
EPS+268.3%−77.1%−167.6%
ENVXRevenue+25.5%+100.3%+187.8%
EPS−4.7%+4.2%−71.5%
AMPXRevenue+92.7%+54.9%+72.8%
EPS−63.2%−183.2%+445.7%
TERevenue+31.5%+41.3%+25.5%
EPS−57.7%−92.0%−1302.6%
STEMRevenue+0.1%+17.5%+22.8%
EPS+31.7%−13.6%−43.0%
RUNRevenue+29.7%+3.5%+12.9%
EPS−8.2%−65.9%−38.3%
FSLRRevenue−1.7%+17.1%+11.8%
EPS+19.5%+34.3%+25.9%
ENPHRevenue−19.1%+6.2%+10.8%
EPS−28.8%+14.0%+18.9%
VRTRevenue+37.0%+29.7%+21.9%
EPS+62.8%+36.4%+27.1%
ETNRevenue+19.7%+10.7%+9.8%
EPS+12.4%+18.7%+17.3%

Forward fiscal years only. Blank means no analyst coverage for that year.

Solid Power, a development-stage maker of sulfide solid electrolytes for electric-vehicle batteries based in Louisville, Colorado, reported a June quarter in which its revenue line pointed the wrong way past zero. The company recorded revenue and grant income of minus $0.3m, after a $1.2m catch-up reversal of revenue previously booked on a research-and-development licence with the Korean cell maker SK On, it disclosed on August 4. Stripped of grant income, the revenue line alone was minus $1.0m against $7.5m a year earlier. Operating loss was $30.3m.

The reversal matters less than what it exposes. Solid Power sells nothing; every dollar it has ever recognized is a partner payment tied to a milestone, and the milestones have run out. Site acceptance testing, the final milestone under the SK On line-installation agreement, was completed in early April, and the $3.1m of March-quarter revenue came mostly from progress toward it. Phase 1 of the Joint Evaluation Agreement with Samsung SDI and BMW expires on September 30 with later phases still in negotiation. That makes this the cleanest listed read on whether carmakers are still paying for next-generation cell chemistry or quietly letting the contracts lapse.

Asked on the August 4 call about a replacement collaboration with SK On, chief executive John Van Scoter said: "I wish I could report out more. I really can't right now. It's still early stages. So I think next quarter, we'll be able to give you some more color on that." The sell side has taken the hint and modelled a drought rather than a gap: consensus revenue of $5.5m for 2026, down 73% from $21.7m in 2025, and only $6.6m in 2027. Industry timing has slipped the same way — pilots in 2026, first commercialization in 2027-2028, and BMW itself targeting mass production only before 2030.

What the price is paying for

Solid Power held $419.3m of liquidity at the end of June with no debt, against guided 2026 cash investment of $85m-$100m for operations and capital projects: roughly four years at that pace. The equity's problem is contract flow, not solvency. Sales multiples on a collapsing milestone line are meaningless, so the usable anchor is price-to-book at 1.08x — and against a $537.7m market value, the arithmetic leaves about $118m for the electrolyte technology. The burn erodes the book by about a fifth a year, which is rational work for a discount to do. The shares are down 9.5% over three months and 39.2% over twelve.

The two nearby storage names fell harder on better news. EnerSys, which builds uninterruptible power supplies for data centers and batteries for electric forklifts, lifted first-quarter operating income 75.1% to $151.4m on a gross margin of 33.5%, and trades at 13.4x forward earnings against 18.7x trailing — falling while getting cheaper, with the caveat that Section 45X manufacturing credits supply roughly 37.5% of guided second-quarter adjusted earnings. Eos Energy, which sells zinc-based grid systems, grew June-quarter revenue 351% to $68.8m, carries a record $807m backlog and drew $87m on September 14 under the second tranche of its Department of Energy loan — yet still trades at 4.28x trailing sales against Fluence Energy's 0.52x, eight times the direct grid-storage rival's multiple. Both dropped alongside a clean-energy complex where Fluence fell 60.3% and Sunrun 45.6% over three months, while the market rose; the likelier reading is the cost of the upfront capital these projects need, with long yields at levels the paper noted this week.

So the group is not one trade. EnerSys and Eos are being repriced for financing conditions their operating results contradict. Solid Power is being repriced for something its own filings confirm: a revenue line that exists only when a partner signs, and no partner currently signed for next year.

Four more years of cash buys management time to negotiate. The clock that runs out first is the one on the Samsung SDI and BMW evaluation, and it stops this week.

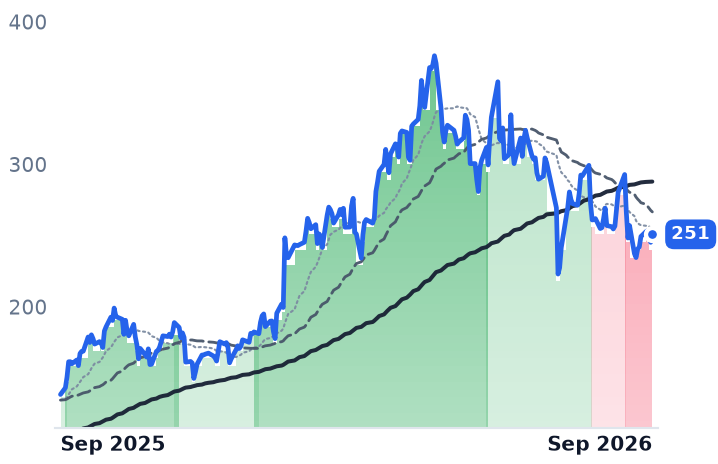
FS KKR Wrote Its Book Down for a Tenth Quarter; Capital Southwest's Held at $16.61

Hypothesis Opus 5 · Research Opus 5 · Writing Opus 5 · Prompt v1.6

The Federal Reserve raised its target range on 16 September for the first time in more than three years, and every one of the 19 listed middle-market lenders fell over the following weeks — even though a higher base rate lifts what their floating-rate loans earn. What it damages is the borrower: Fitch put the trailing US private-credit default rate at a record 6.3% at the end of August.

The books are now splitting, hard. FS KKR carries loans on non-accrual at 7.1% of cost and trades at 0.61 times net asset value. Ares Capital's non-accruals are 2.4% at cost and it trades at book. Capital Southwest, the smallest and the one most exposed to deferred-interest structures, grew June-quarter revenue 14.4% and trades 39% above book. The discount is credit-specific, and FS KKR's is earned.

ARCCFSKCSWCBCSFCGBDFDUSGAINMAINOBDCHTGCPSECTSLXGBDCNMFCOCSLSLRCTRINMFICBBDCBusiness Development CompaniesPrivate Credit DefaultsMiddle-Market LendingFloating-Rate Loan YieldsNon-Accrual Credit StressRising Rate Cycle
TickerCompanySegmentTrend · 13mo30D1Y
The subject · what this brief is about
ARCCAres CapitalMiddle Market Credit🌱 Emerging Bull−3.8%−1.3%
FSKFS KKR CapitalMiddle Market Credit🌱 Emerging Bull−8.2%−18.6%
CSWCCapital SouthwestMiddle Market Credit🟢 Cont. Bull−8.9%+11.6%
Compared against · context, not the story
BCSFBain Capital Specialty FinanceMiddle Market Credit🔴 Cont. Bear−7.9%−16.8%
CGBDCarlyle Secured LendingMiddle Market Credit🌱 Emerging Bull−2.3%−4.6%
FDUSFidus InvestmentMiddle Market Credit🌱 Emerging Bull−3.2%+0.3%
GAINGladstone InvestmentMiddle Market Credit🟢 Cont. Bull−3.9%+19.3%
MAINMain Street CapitalMiddle Market Credit🌱 Emerging Bull−6.1%−9.9%
OBDCBlue Owl CapitalBusiness Development & Specialty Finance🌱 Emerging Bull−4.5%−10.4%
HTGCHercules CapitalMiddle Market Credit🌱 Emerging Bull−3.7%−5.9%
PSECProspect CapitalMiddle Market Credit🔴 Cont. Bear−5.0%−5.6%
TSLXSixth Street Specialty LendingMiddle Market Credit🌱 Emerging Bull−3.8%−16.5%
GBDCGolub Capital BDCOther🌱 Emerging Bull−4.9%−4.5%
NMFCNew Mountain FinanceMiddle Market Credit🔴 Cont. Bear−8.5%−22.5%
OCSLOaktree Specialty LendingBusiness Development & Specialty Finance🌱 Emerging Bull−7.1%−1.0%
SLRCSLR InvestmentMiddle Market Credit🔴 Cont. Bear−6.6%−20.0%
TRINTrinity CapitalOther🟢 Cont. Bull−6.6%+23.3%
MFICMidCap Financial InvestmentOther🔴 Cont. Bear−8.8%−21.6%
BBDCBarings BDCBusiness Development & Specialty Finance🟢 Cont. Bull−7.6%+2.9%

12-month price & trend

ARCC
Ares Capital
19.20
+0.07 (+0.37%)
vs. prior close
Price20d50d150d
ARCC 12-month price
Middle Market Credit
FSK
FS KKR Capital
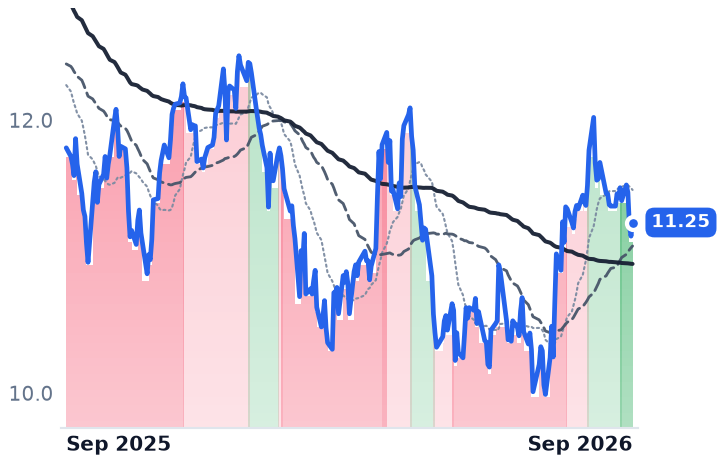
11.25
+0.08 (+0.72%)
vs. prior close
Price20d50d150d
FSK 12-month price
Middle Market Credit
CSWC
Capital Southwest
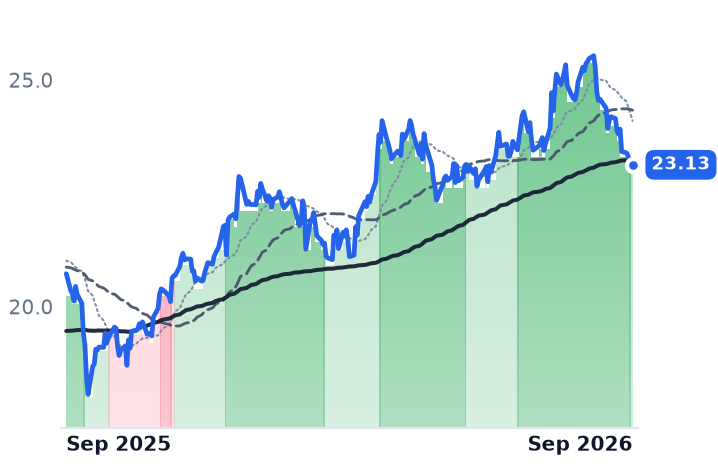
23.13
+0.09 (+0.39%)
vs. prior close
Price20d50d150d
CSWC 12-month price
Middle Market Credit
TickerMkt capP/EP/E fwdP/SP/S fwdP/GPP/GP fwdEV/EBITDAFCF yld
ARCC$13.8B14.2x10.1x6.0x4.5x8.9x6.6x17.9x7.7%
FSK$3.2Bn/m6.9x3.3x2.8x5.5x4.6x226.5x42.1%
CSWC$1.4B12.1x10.0x6.3x5.4x7.5x6.5x11.8x-12.4%
BCSF
Bain Capital Specialty Finance
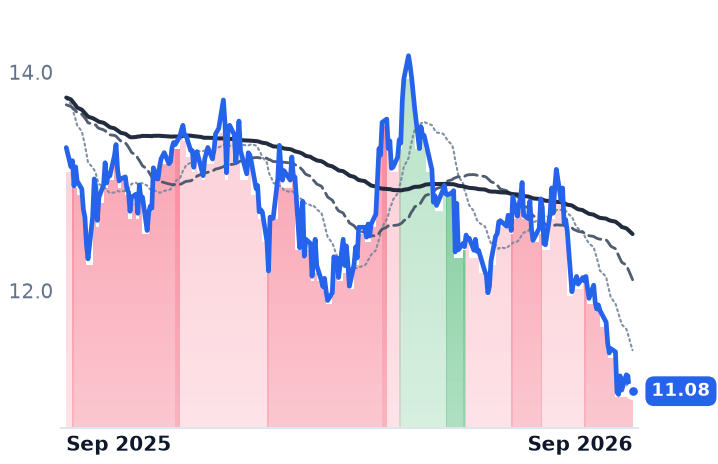
11.08
−0.04 (−0.36%)
vs. prior close
Price20d50d150d
BCSF 12-month price
Middle Market Credit
CGBD
Carlyle Secured Lending
11.25
+0.10 (+0.90%)
vs. prior close
Price20d50d150d
CGBD 12-month price
Middle Market Credit
FDUS
Fidus Investment
19.15
+0.06 (+0.31%)
vs. prior close
Price20d50d150d
FDUS 12-month price
Middle Market Credit
TickerMkt capP/EP/E fwdP/SP/S fwdP/GPP/GP fwdEV/EBITDAFCF yld
BCSF$866.6M11.8x8.0x4.4x3.4x7.2x5.5x23.5x10.5%
CGBD$778.4M15.4x8.1x3.6x3.1x4.8x4.2x19.9x5.9%
FDUS$713.2M8.6x8.9x5.4x4.0x7.2x5.4x9.5x-11.8%
GAIN
Gladstone Investment
15.81
+0.16 (+1.02%)
vs. prior close
Price20d50d150d
GAIN 12-month price
Middle Market Credit
MAIN
Main Street Capital
55.10
+0.34 (+0.62%)
vs. prior close
Price20d50d150d
MAIN 12-month price
Middle Market Credit
OBDC
Blue Owl Capital
10.81
+0.01 (+0.09%)
vs. prior close
Price20d50d150d
OBDC 12-month price
Business Development & Specialty Finance
TickerMkt capP/EP/E fwdP/SP/S fwdP/GPP/GP fwdEV/EBITDAFCF yld
GAIN$653.5M3.4x18.9x5.8x6.0x10.1x10.4x9.0x4.0%
MAIN$5.5B11.9x15.4x7.8x9.4x9.2x11.0x17.5x3.1%
OBDC$5.5B19.9x8.6x3.9x3.5x5.8x5.2x13.9x20.7%
HTGC
Hercules Capital
16.97
+0.17 (+1.01%)
vs. prior close
Price20d50d150d
HTGC 12-month price
Middle Market Credit
PSEC
Prospect Capital
2.19
+0.01 (+0.46%)
vs. prior close
Price20d50d150d
PSEC 12-month price
Middle Market Credit
TSLX
Sixth Street Specialty Lending
18.14
−0.01 (−0.06%)
vs. prior close
Price20d50d150d
TSLX 12-month price
Middle Market Credit
TickerMkt capP/EP/E fwdP/SP/S fwdP/GPP/GP fwdEV/EBITDAFCF yld
HTGC$3.1B8.0x8.6x5.4x5.4x6.0x6.0x12.4x2.9%
PSEC$1.1Bn/m4.7x11.0x1.7x——n/m37.8%
TSLX$1.7B15.6x10.1x5.0x4.4x6.8x6.0xn/m8.6%
GBDC
Golub Capital BDC
12.46
+0.05 (+0.40%)
vs. prior close
Price20d50d150d
GBDC 12-month price
Other
NMFC
New Mountain Finance
6.98
−0.03 (−0.43%)
vs. prior close
Price20d50d150d
NMFC 12-month price
Middle Market Credit
OCSL
Oaktree Specialty Lending
12.10
+0.02 (+0.17%)
vs. prior close
Price20d50d150d
OCSL 12-month price
Business Development & Specialty Finance
TickerMkt capP/EP/E fwdP/SP/S fwdP/GPP/GP fwdEV/EBITDAFCF yld
GBDC$3.5B24.1x9.6x4.8x4.5x6.5x6.0x20.3x26.6%
NMFC$764.1Mn/m7.4x3.4x3.0x4.8x4.2x24.5x88.5%
OCSL$1.1B21.5x8.0x3.7x3.7x4.8x4.7x19.4x1.2%
SLRC
SLR Investment
11.69
+0.01 (+0.09%)
vs. prior close
Price20d50d150d
SLRC 12-month price
Middle Market Credit
TRIN
Trinity Capital
17.52
+0.03 (+0.20%)
vs. prior close
Price20d50d150d
TRIN 12-month price
Other
MFIC
MidCap Financial Investment
8.88
+0.01 (+0.06%)
vs. prior close
Price20d50d150d
MFIC 12-month price
Other
TickerMkt capP/EP/E fwdP/SP/S fwdP/GPP/GP fwdEV/EBITDAFCF yld
SLRC$721.8M8.0x9.8x4.0x3.6x6.2x5.7x17.4x-12.7%
TRIN$1.3B9.1x8.1x4.6x3.4x5.7x4.2x13.3x6.9%
MFIC$907.7M165.4x8.0x3.7x3.3x3.6x3.1x16.9x29.9%
BBDC
Barings BDC
8.67
+0.05 (+0.58%)
vs. prior close
Price20d50d150d
BBDC 12-month price
Business Development & Specialty Finance
TickerMkt capP/EP/E fwdP/SP/S fwdP/GPP/GP fwdEV/EBITDAFCF yld
BBDC$900.5M10.1x8.7x4.1x3.6x6.1x5.3x16.6x18.2%

Consensus projections

TickerFY2026EFY2027EFY2028E
ARCCRevenue+1.3%+3.1%−1.3%
EPS−4.5%+1.5%−3.7%
FSKRevenue−25.7%−5.5%−9.8%
EPS−31.0%−6.9%−14.9%
CSWCRevenue+15.1%+12.9%+13.6%
EPS−6.1%−3.0%+3.8%
BCSFRevenue−6.1%−5.1%−1.2%
EPS−11.4%−11.4%−6.3%
CGBDRevenue−2.7%+0.4%−11.7%
EPS−9.1%+2.8%−0.5%
FDUSRevenue+16.1%+2.5%−5.9%
EPS+1.0%−6.9%−8.3%
GAINRevenue+10.0%+8.4%+4.9%
EPS−51.9%+114.3%+6.6%
MAINRevenue+3.4%+7.4%+9.8%
EPS−4.9%+3.3%+4.4%
OBDCRevenue−15.3%−1.6%−0.6%
EPS−15.4%−0.8%−6.1%
HTGCRevenue+8.5%+7.1%+9.9%
EPS+0.2%+0.9%−1.4%
PSECRevenue−12.0%−8.5%−1.0%
EPS−14.7%−23.9%−8.6%
TSLXRevenue−11.1%+3.0%−2.2%
EPS−19.1%+3.5%−1.5%
GBDCRevenue−12.1%−3.7%−0.3%
EPS−11.8%−6.9%−5.2%
NMFCRevenue−21.8%−2.2%−2.7%
EPS−14.0%−4.3%−5.0%
OCSLRevenue−9.4%−0.7%−1.5%
EPS−13.7%−6.3%−2.2%
SLRCRevenue−9.0%−0.1%−3.7%
EPS−15.3%−0.2%−4.2%
TRINRevenue+28.6%+13.0%−8.8%
EPS+0.4%+0.6%−11.4%
MFICRevenue−13.1%−7.4%−12.5%
EPS−8.6%−6.3%−2.0%
BBDCRevenue−11.0%−1.1%−7.8%
EPS−11.7%−2.2%−7.9%

Forward fiscal years only. Blank means no analyst coverage for that year.

A rate rise is supposed to be good news for a lender whose loans reprice every ninety days. Business development companies — listed funds that make first-lien loans to mid-sized private companies at a coupon struck as a spread over three-month SOFR — were sold after the Federal Open Market Committee voted 12-0 on 16 September to lift the federal funds target to 3.75%-4.00%, its first increase in over three years, and signalled another. Futures now price roughly 4.3% by December. The rally that carried this group from March into August was a bet on cuts. The cuts are not coming.

That reverses which side of the loan agreement is under strain. A rising base rate mechanically raises the interest a floating-rate lender collects; it also raises what the private-equity-owned borrower has to pay out of unchanged cash flow. Fitch put the trailing-twelve-month default rate across roughly 1,300 US private-credit borrowers at a record 6.3% at the end of August, up from 6.1% a month earlier, and KBRA counts about 40% of private-credit borrowers now running negative free cash flow, against 25% in 2021. The question for these funds is no longer yield compression. It is which of them financed the companies that cannot service the new rate.

Three books, three answers

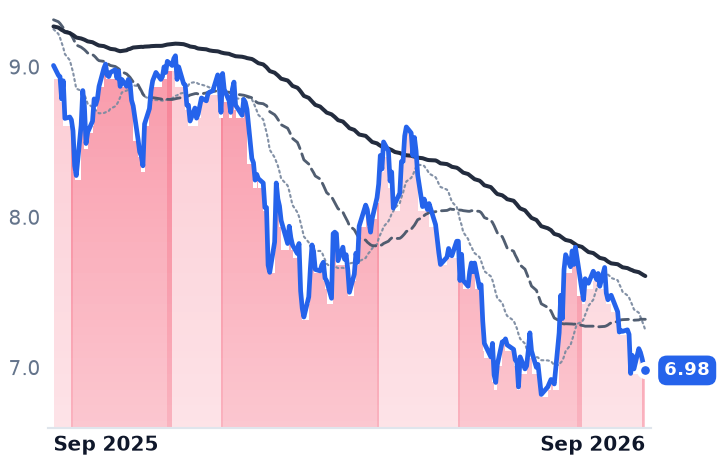
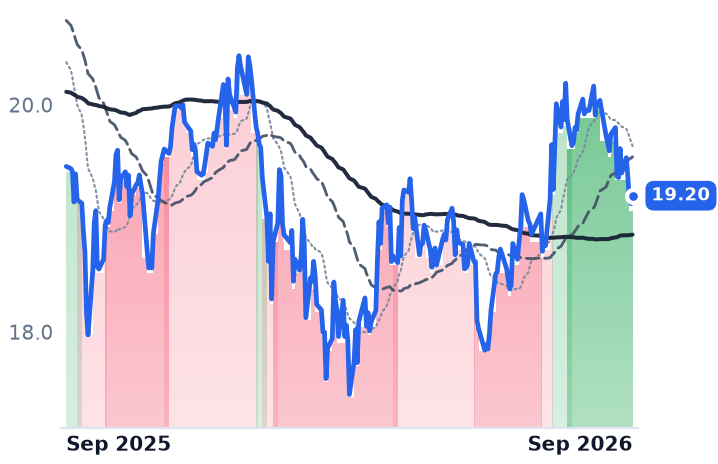
Ares Capital, the $13.8bn lender that writes $10m-$400m checks to companies with up to $250m of EBITDA and usually leads its own deals, is the one showing no damage yet. Its weighted-average yield on debt investments fell from 11.1% to 10.3% over the year to end-2025 and then held at 10.3% through June; new senior loan commitments in the quarter carried spreads 20 basis points wider than in late 2025, with upfront fees half a point higher. Loans on non-accrual were 2.4% of investments at cost and 1.4% at fair value, below the firm's own roughly 3% average since the financial crisis. "We are not seeing the same kind of spikes in non-accruals and further weakening that maybe some of our competitors are seeing," chief executive Kort Schnabel said on the 29 July call. Net asset value slipped $0.24 to $19.35 a share, core earnings were flat at $0.47, and the declared third-quarter dividend is $0.48 — covered because the company carries $1.38 a share of spillover income forward.

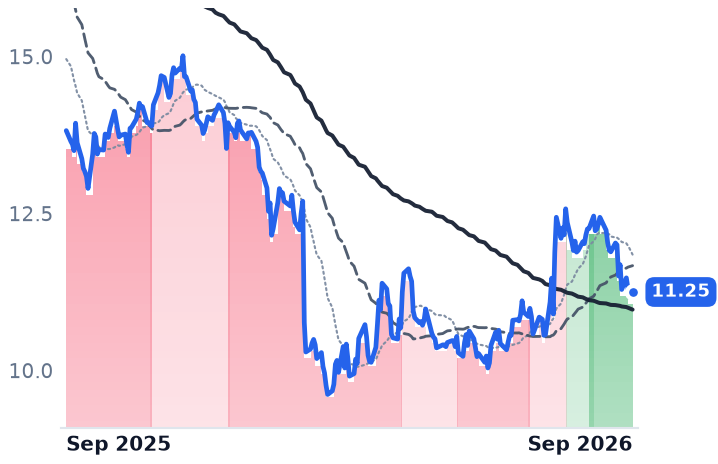
FS KKR, the $3.2bn NYSE-listed fund lending to upper-middle-market borrowers, is the book that is cracking. Net asset value fell to $18.30 a share at 30 June from $23.64 at the end of 2024 — a 22.6% write-down across ten consecutive declining quarters. Non-accruals are 7.1% at cost and 3.8% at fair value, roughly three times Ares Capital's, on the lowest portfolio yield of the three at 9.8%. Its distribution has already been tested: cut to $0.42 for the June quarter from $0.64, with $0.44 declared for the third against net investment income of exactly $0.44. Chief investment officer Dan Pietrzak told investors on the August call the market had "toggled to what I call more of a lender-friendly environment versus a borrower-friendly environment," and that the fund expects to get smaller as it rotates out of second-lien and junior debt. Consensus has revenue down 25.7% this year.

Capital Southwest is the surprise. The internally managed Dallas lender — 36 employees, $5m-$20m loans to companies with under $15m of EBITDA, plus minority equity alongside them — has the highest yield of the three at 10.9% on a credit book that is 99% first-lien and marked with non-accruals of 1.1% at fair value, lower than Ares Capital's. Net asset value was $16.61 against $16.69 a quarter earlier. June-quarter revenue rose 14.4% year on year with operating margin at 71%, against 56.7% a year earlier, and net investment income of $0.58-$0.59 covered the $0.58 regular dividend plus a $0.06 supplemental. It also priced $350m of 6.75% notes due 2031 for mid-September settlement, leaving about four points of gross spread on incremental funding.

What the prices say

All 19 listed lenders with price history fell over the thirty days to 25 September, an average of 5.9%: Ares Capital 3.8%, FS KKR 7.5%, Capital Southwest 8.8%. But the same group rose 3.2% over three months, and the twelve-month picture is dispersion rather than drift — FS KKR down 25.9% while Capital Southwest is up 2.7%. Because a BDC marks its whole asset base to fair value quarterly, reported earnings swing on marks — FS KKR's trailing price-to-earnings is negative and meaningless — so book value is the comparable measure. On it, Ares Capital trades at 0.99 times its June NAV, FS KKR at 0.61 and Capital Southwest at 1.39. That is a 2.3-fold spread inside one business model, up from a segment median of roughly 0.74 times forward NAV in late March.

So the September selling is not one discount applied to twenty-one identical books. FS KKR's de-rating is earned: 0.61 times book prices a further large write-down against a portfolio management itself says will shrink, and consensus EPS falling from $2.36 in 2025 toward $1.52 in 2027. Ares Capital's fall is the one its own meters do not explain — yield flat, credit better than its long-run norm — though the anchor is drifting and 2026 consensus earnings are down 4.5%, with the dividend leaning on accumulated spillover rather than on the quarter. Capital Southwest's business is the healthiest of the three and its multiple the richest; that premium is also the thing that funds it, since a lender trading above book can issue stock accretively, which is why shareholders approved more authorized shares on 1 September, and a lender at 0.61 times book cannot.

Third-quarter reports are due late October and early November. They will be the first to cover a quarter in which the base rate went up — the first quarter, in other words, in which the borrowers pay for it rather than the lenders.

indie Semiconductor's $7.4bn Backlog Bills Only When Automakers Actually Build

Hypothesis Opus 5 · Research Opus 5 · Writing Opus 5 · Prompt v1.6

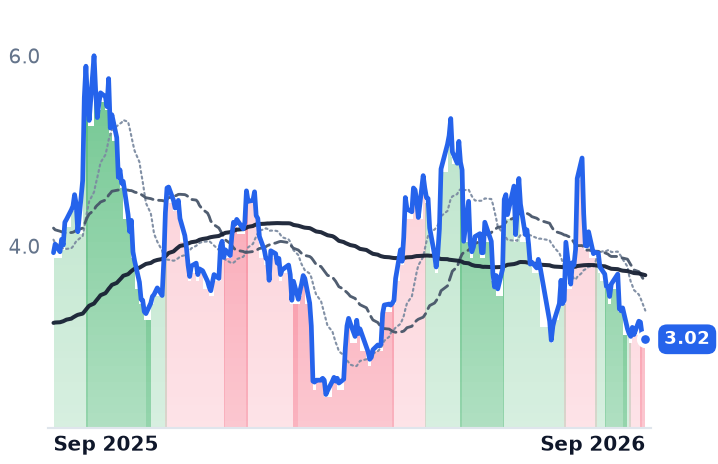
indie Semiconductor's automotive chip revenue is finally accelerating and its margins are moving the other way at the same time. June-quarter sales rose 24% to $64.0m, with a September-quarter guide of $67m-$73m, but gross margin fell to 36.1% from 40.6%, so gross profit grew only 10.2% — the opposite of the scale economics the company has framed 2026 as delivering. The GAAP operating loss was $35.1m, and $149m of cash sits behind $150m of 4.00% convertible notes sold in March.

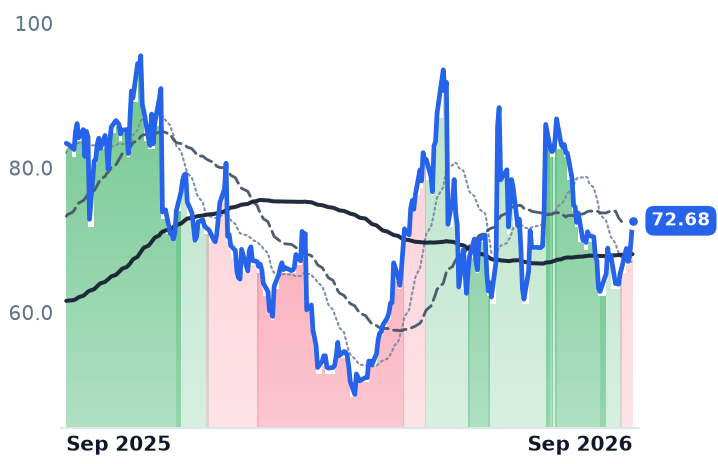
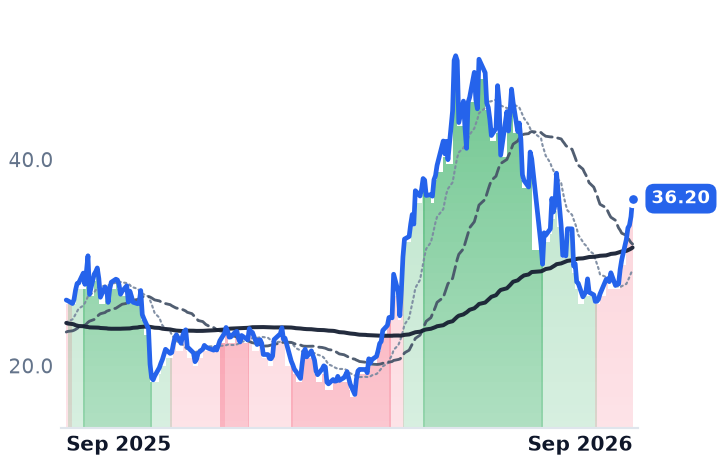
The shares have also split from their nearest comparables: over the thirty days to 25 September CEVA rose 34% while indie fell 23%. Measured against gross profit rather than sales, indie is no cheaper than Ambarella despite earning half the margin — the discount investors think they see in its 2.76x sales multiple is the margin gap.

INDIAMBACEVALSCCMTSIQCOMONALABSPYNXPIAutomotive SemiconductorsADAS & Sensing ChipsDesign-Win BacklogGross Margin CompressionAutomotive Memory ShortageChip IP Licensing
TickerCompanySegmentTrend · 13mo30D1Y
The subject · what this brief is about
INDIindie SemiconductorRF & Wireless🔴 Cont. Bear−23.2%−23.2%
AMBAAmbarellaSpecialty Semiconductors🌱 Emerging Bull+4.3%−12.9%
CEVACEVASpecialty Semiconductors🌱 Emerging Bull+32.9%+37.3%
Compared against · context, not the story
LSCCLattice SemiconductorSpecialty Semiconductors🟢 Cont. Bull+7.8%+77.7%
MTSIMACOM Technology SolutionsRF & Wireless⚠️ Emerging Bear+5.8%+130.5%
QCOMQUALCOMM IncorporatedRF & Wireless🟢 Cont. Bull+26.1%+20.4%
ONON SemiconductorAnalog & Mixed-Signal⚠️ Emerging Bear+5.6%+55.1%
ALABAstera LabsSpecialty Semiconductors🟢 Cont. Bull+28.9%+81.7%
SPYState Street SPDR S&P 500 ETF TrustAsset Management🟢 Cont. Bull+0.4%+17.5%
NXPINXP SemiconductorsAnalog & Mixed-Signal⚠️ Emerging Bear+6.5%+6.0%

12-month price & trend

INDI
indie Semiconductor
3.02
−0.03 (−0.98%)
vs. prior close
Price20d50d150d
INDI 12-month price
RF & Wireless
AMBA
Ambarella
72.68
+2.82 (+4.04%)
vs. prior close
Price20d50d150d
AMBA 12-month price
Specialty Semiconductors
CEVA
CEVA
36.20
+1.74 (+5.05%)
vs. prior close
Price20d50d150d
CEVA 12-month price
Specialty Semiconductors
TickerMkt capP/EP/E fwdP/SP/S fwdP/GPP/GP fwdEV/EBITDAFCF yld
INDI$638.1Mn/m—2.8x2.4x12.8x11.1xn/m-13.1%
AMBA$3.2Bn/m90.4x7.6x7.2x13.1x12.4xn/m0.3%
CEVA$1.0Bn/m66.0x8.7x8.1x10.0x9.2xn/m-0.1%
LSCC
Lattice Semiconductor
128
+5.83 (+4.77%)
vs. prior close
Price20d50d150d
LSCC 12-month price
Specialty Semiconductors
MTSI
MACOM Technology Solutions
286
+0.63 (+0.22%)
vs. prior close
Price20d50d150d
MTSI 12-month price
RF & Wireless
QCOM
QUALCOMM Incorporated
202
+7.71 (+3.97%)
vs. prior close
Price20d50d150d
QCOM 12-month price
RF & Wireless
TickerMkt capP/EP/E fwdP/SP/S fwdP/GPP/GP fwdEV/EBITDAFCF yld
LSCC$17.5B484.1x60.1x26.9x19.1x39.8x28.2x200.9x1.2%
MTSI$21.8B89.2x51.8x18.7x16.5x33.1x29.1x63.4x0.5%
QCOM$170.3B18.5x15.3x3.9x3.9x7.1x7.3x13.4x6.1%
ON
ON Semiconductor
77.20
+4.05 (+5.54%)
vs. prior close
Price20d50d150d
ON 12-month price
Analog & Mixed-Signal
ALAB
Astera Labs
365
+4.11 (+1.14%)
vs. prior close
Price20d50d150d
ALAB 12-month price
Specialty Semiconductors
SPY
State Street SPDR S&P 500 ETF Trust
769
+1.62 (+0.21%)
vs. prior close
Price20d50d150d
SPY 12-month price
Asset Management
TickerMkt capP/EP/E fwdP/SP/S fwdP/GPP/GP fwdEV/EBITDAFCF yld
ON$27.2B44.3x21.9x4.4x4.2x11.7x11.1x22.3x6.5%
ALAB$48.8B131.3x72.1x40.6x25.8x54.1x34.4x145.9x0.6%
SPY$773.0B————————
NXPI
NXP Semiconductors
238
+7.92 (+3.44%)
vs. prior close
Price20d50d150d
NXPI 12-month price
Analog & Mixed-Signal
TickerMkt capP/EP/E fwdP/SP/S fwdP/GPP/GP fwdEV/EBITDAFCF yld
NXPI$57.5B19.4x15.1x4.4x4.0x7.8x7.2x13.3x5.1%

Consensus projections

TickerFY2026EFY2027EFY2028E
INDIRevenue+23.1%+33.2%+30.4%
EPS−38.3%−110.8%+1093.0%
AMBARevenue+39.8%+12.9%+11.6%
EPS−311.1%+34.9%+31.8%
CEVARevenue+14.3%+13.3%+13.0%
EPS+31.8%+46.4%+36.5%
LSCCRevenue+2.3%+76.6%+45.1%
EPS+11.9%+103.0%+50.7%
MTSIRevenue+37.0%+35.9%+16.3%
EPS+58.9%+54.0%+18.4%
QCOMRevenue−1.3%+4.2%+15.1%
EPS−10.8%−2.6%+26.8%
ONRevenue+9.2%+13.1%+13.9%
EPS+37.1%+40.6%+30.5%
ALABRevenue+127.6%+60.7%+29.5%
EPS+122.0%+61.8%+27.1%
NXPIRevenue+16.7%+11.5%+8.3%
EPS+28.0%+20.5%+15.3%

Forward fiscal years only. Blank means no analyst coverage for that year.

indie Semiconductor sells chips into cars — ultrasonic sensors for parking assistance, in-cabin wireless charging, infotainment, LED lighting and telematics, plus photonic components for optical sensing — and the headline number it asks investors to value is not revenue. It is a "strategic backlog" of program awards, quoted at $7.4bn when the company reported its third quarter of 2025 and still cited at the same figure in materials around its latest results, which the August release did not restate. Against an annualized run-rate near $260m, that is roughly 29 years of current revenue.

The catch is in how an award converts. A design award bills only when an automaker builds the vehicle it was designed into, on the schedule the automaker chooses. indie's own fourth-quarter 2025 guidance was tempered by package-substrate shortages, and the company has framed 2026 as the transition year to scale economics. The June quarter is the first real test of that framing, and it went half right.

Volume arrived; the margin left

Revenue growth inflected hard: -0.5% year on year in the September 2025 quarter, flat in December, 2.6% in March, then 24.0% in the June quarter, to $64.0m. Gross margin over the same stretch fell to 36.1% from 40.6% a year earlier, so gross profit grew 10.2% against revenue up 24.0%. The GAAP operating loss was $35.1m, against $43.0m a year earlier; on the company's non-GAAP measure the loss narrowed to $8.9m from $14.5m. Third-quarter revenue is guided to $67m-$73m, about 30% growth.

That is volume arriving without the unit economics that were supposed to come with it. Trailing free cash flow runs at a negative 13.1% yield on the market value, and the balance sheet reflects it: $149m of total cash at quarter-end, after indie sold $150m of 4.00% convertible senior notes due 2031 in a placement that closed on 6 March, a deal that knocked the shares down about 17% pre-market on dilution and runway worries.

Part of the cost pressure is an industry mechanism rather than an indie failure. Memory makers have shifted wafer capacity toward high-bandwidth memory for AI accelerators under hyperscaler contracts, leaving automotive memory supply meeting under half of demand and device makers receiving a fraction of what they ordered. A car-chip supplier does not need to buy much memory to be hurt by that; its customers' build plans do the damage.

The company it no longer keeps

indie is grouped with two other loss-making edge-AI names, and the grouping stopped working. Over the thirty days to 25 September, CEVA — which ships no chips at all, licensing signal-processing and neural-network cores for fees plus per-unit royalties — rose 34.4% and Ambarella, which sells computer-vision chips for cameras and driver-assistance systems, rose 3.4%. indie fell 23.3%. Over the eight sessions to 25 September, CEVA gained 19.6% and Ambarella 9.9% against 0.9% for the S&P 500 tracker, with no new disclosure from either; the likelier reading is the small-cap rotation that followed the Federal Reserve's cut, which loosens conditions for floating-rate small borrowers. CEVA also has something indie does not: accelerating revenue with an 87.4% gross margin and raised guidance. "We are seeing increasing demand for our technologies across AI, connectivity, and sensing," chief executive Amir Panush said on 10 August.

Because all three lose money on a GAAP basis and their gross margins run from 36% to 87%, sales multiples cannot be compared across them. On price to gross profit, indie trades at 12.83x trailing and 11.13x forward — level with Ambarella's 13.09x and 12.42x, on half the margin and with no path yet to GAAP profit. Its 2.76x trailing sales multiple is not a discount; it is the margin gap, restated.

The silicon the market is willing to pay up for sits elsewhere. Lattice Semiconductor, whose programmable chips are levered to data-center systems, grew revenue 62.2% in the July quarter at a 70.3% gross margin and an 11.1% operating margin; MACOM grew 35.8% with a 22.5% operating margin. Both are profitable, and both carry roughly three times the edge trio's gross-profit multiple — Lattice at 39.8x trailing, MACOM at 33.1x.

What the fall earns

Most of indie's month is earned. A gross margin down 4.5 points on accelerating revenue, a $35.1m quarterly operating loss and a cash balance smaller than the converts behind it are a de-rating with reasons attached, and the backlog does nothing to offset them until it bills. What the evidence does not explain is the shape: the shares fell 9.9% on 9 September, a session in which Ambarella rose 5.4%, and no company disclosure for that day was discoverable.

The practical consequence is that revenue growth has stopped being the variable. Management has guided to roughly 30% again this quarter, and at 36% gross margin faster growth widens the loss rather than closing it. Whether the award pipeline ever matters depends on the line that went the other way.

McDonald's Will Fund a $5bn Franchisee Rescue From Its 84.5%-Margin Rent Book

Hypothesis Opus 5 · Research Opus 5 · Writing Opus 5 · Prompt v1.6

McDonald's equity case has rested for a decade on the claim that its profit comes from rent and royalties, not from selling hamburgers. On 23 September it told investors it will hand a large part of that profit back to the operators who pay it.

The majority of roughly $8.5bn of franchisee support committed through 2036 arrives as rent relief, and free cash flow conversion was guided down to the mid-to-high 80% range by 2030. The shares fell to four-year lows on the heaviest volume of the whole drawdown.

The business now explains most of the de-rating: McDonald's trades at 18.3x forward earnings against 22.2x trailing five weeks earlier. What it does not explain is consensus, which still models 2026 earnings up 6.4% and has not absorbed the rent disclosure. Wendy's, whose largest US franchisee filed for bankruptcy on 17 September, is the reason the bill exists.

MCDWENSHAKQSRYUMDPZCMGWINGTXRHSPYFranchise Rent & RoyaltiesBeef Cost InflationQuick-Service BurgersFranchisee BankruptciesRestaurant Traffic DeclineFree Cash Flow Conversion
TickerCompanySegmentTrend · 13mo30D1Y
The subject · what this brief is about
MCDMcDonald'sQuick Service - Burgers & Sandwiches🔴 Cont. Bear−11.2%−20.9%
WENThe Wendy'sQuick Service - Burgers & Sandwiches🌱 Emerging Bull−25.9%−25.9%
SHAKShake ShackQuick Service - Burgers & Sandwiches🔴 Cont. Bear−22.1%−38.9%
Compared against · context, not the story
QSRRestaurant Brands InternationalQuick Service - Pizza🟢 Cont. Bull−11.3%+12.9%
YUMYum! BrandsQuick Service - Pizza⚠️ Emerging Bear−11.7%−8.0%
DPZDomino's PizzaQuick Service - Pizza🔴 Cont. Bear−15.0%−30.3%
CMGChipotle Mexican GrillQuick Service - Mexican & Bowls🌱 Emerging Bull−16.2%−20.3%
WINGWingstopQuick Service - Chicken & Wings🔴 Cont. Bear−12.4%−60.2%
TXRHTexas RoadhouseCasual Dining - Steakhouse & Seafood🟢 Cont. Bull−20.8%−0.1%
SPYState Street SPDR S&P 500 ETF TrustAsset Management🟢 Cont. Bull+0.4%+17.5%

12-month price & trend

MCD
McDonald's
236
−0.52 (−0.22%)
vs. prior close
Price20d50d150d
MCD 12-month price
Quick Service - Burgers & Sandwiches
WEN
The Wendy's
6.55
+0.05 (+0.69%)
vs. prior close
Price20d50d150d
WEN 12-month price
Quick Service - Burgers & Sandwiches
SHAK
Shake Shack
57.53
+0.08 (+0.15%)
vs. prior close
Price20d50d150d
SHAK 12-month price
Quick Service - Burgers & Sandwiches
TickerMkt capP/EP/E fwdP/SP/S fwdP/GPP/GP fwdEV/EBITDAFCF yld
MCD$168.0B19.2x18.3x6.1x6.0x10.6x10.4x14.8x4.6%
WEN$1.2B9.9x12.9x0.6x0.6x2.1x2.1x10.2x21.2%
SHAK$2.2B56.5x49.0x1.4x1.4x5.6x5.3x12.3x0.4%
QSR
Restaurant Brands International
71.64
+0.73 (+1.03%)
vs. prior close
Price20d50d150d
QSR 12-month price
Quick Service - Pizza
YUM
Yum! Brands
137
−0.32 (−0.23%)
vs. prior close
Price20d50d150d
YUM 12-month price
Quick Service - Pizza
DPZ
Domino's Pizza
292
−0.89 (−0.30%)
vs. prior close
Price20d50d150d
DPZ 12-month price
Quick Service - Pizza
TickerMkt capP/EP/E fwdP/SP/S fwdP/GPP/GP fwdEV/EBITDAFCF yld
QSR$25.0B17.6x17.8x2.6x2.5x5.8x5.7x14.2x6.3%
YUM$38.0B17.2x21.0x4.4x4.3x9.5x9.3x17.2x4.4%
DPZ$11.1B18.9x17.7x2.2x2.1x5.5x5.3x16.2x5.9%
CMG
Chipotle Mexican Grill
31.33
−0.68 (−2.12%)
vs. prior close
Price20d50d150d
CMG 12-month price
Quick Service - Mexican & Bowls
WING
Wingstop
98.65
+0.81 (+0.83%)
vs. prior close
Price20d50d150d
WING 12-month price
Quick Service - Chicken & Wings
TXRH
Texas Roadhouse
161
−0.08 (−0.05%)
vs. prior close
Price20d50d150d
TXRH 12-month price
Casual Dining - Steakhouse & Seafood
TickerMkt capP/EP/E fwdP/SP/S fwdP/GPP/GP fwdEV/EBITDAFCF yld
CMG$41.9B29.2x28.7x3.5x3.2x9.5x8.9x20.5x3.6%
WING$3.5B31.7x28.3x5.0x4.5x6.0x5.5x15.4x3.8%
TXRH$11.9B28.9x27.4x1.9x1.8x12.5x11.9x16.7x3.4%
SPY
State Street SPDR S&P 500 ETF Trust
769
+1.62 (+0.21%)
vs. prior close
Price20d50d150d
SPY 12-month price
Asset Management
TickerMkt capP/EP/E fwdP/SP/S fwdP/GPP/GP fwdEV/EBITDAFCF yld
SPY$773.0B————————

Consensus projections

TickerFY2026EFY2027EFY2028E
MCDRevenue+5.7%+4.9%+3.1%
EPS+6.4%+7.9%+6.6%
WENRevenue+1.3%−0.5%+3.3%
EPS−41.7%+3.9%+11.8%
SHAKRevenue+14.1%+14.7%+13.3%
EPS−12.2%+22.8%+27.3%
QSRRevenue+5.2%+0.5%+0.4%
EPS+10.3%+9.1%+9.4%
YUMRevenue+9.4%+3.2%+5.8%
EPS+8.1%+10.2%+11.0%
DPZRevenue+5.4%+2.4%+3.9%
EPS+7.6%+9.8%+8.0%
CMGRevenue+9.0%+11.0%+10.9%
EPS−1.6%+19.6%+18.0%
WINGRevenue+11.6%+15.4%+14.1%
EPS+17.0%+22.2%+24.3%
TXRHRevenue+11.0%+9.3%+8.6%
EPS+4.7%+18.3%+20.8%

Forward fiscal years only. Blank means no analyst coverage for that year.

McDonald's told investors at its Chicago investor day on 23 September that it will commit approximately $8.5bn of franchisee support through 2036, about $5bn of it by 2030, delivered as a combination of rent relief and capital support. The chain that sells burgers, chicken sandwiches, fries and breakfast across more than 40,000 restaurants collects most of its profit not from food but from its operators: in the June quarter the franchised line produced $3,713m of margin at an 84.5% rate, against 15.3% on the restaurants McDonald's runs itself. Rent relief shrinks the first number on purpose.

That is the disclosure the shares had been anticipating and could not see. The cost squeeze in fast food — a beef cow herd down to 27.6 million head, the smallest since 1961 — has been landing in franchisees' profit and loss statements all year, and the question was whether it would ever reach the franchisor. It has, by invitation. McDonald's guided free cash flow conversion down to the mid-to-high 80% range by 2030 and flagged $1.5bn to $2bn of incremental capital spending from 2027 through 2030 on top of roughly $3bn a year of normal capital expenditure. The company also intends to raise its franchised mix from about 95% to 98% by the end of 2028 — more of the cost exposure pushed onto operators it is simultaneously subsidizing.

The stock fell 5.80% that session, from $250.85 to $236.29, on 11.1m shares against a normal tape closer to 2m: the largest single-day fall and the heaviest volume of the drawdown, and it left the shares at four-year lows in a seventh consecutive losing week, down 20.7% for 2026. The dividend was raised 4% to $1.93 a quarter on 17 September, a fiftieth straight annual increase, which at the current price yields 3.26% — below the 3.75%-4.00% federal funds target set the day before, the rate backdrop this page has already described.

Why the bill exists

Wendy's supplies the proof. Its US same-restaurant sales fell 7.0% on a 12.5% traffic decline, 289 US closures in the first half swamped 21 openings, and 5% to 6% of its US restaurants are slated to close. Meritage Hospitality, its largest US franchisee with 314 restaurants, filed for Chapter 11 on 17 September, blaming beef costs, weak traffic and aggressive promotional discounting. Wendy's trades at 12.9x forward earnings against 9.9x trailing — the market saying earnings fall faster than the price, with consensus 2026 earnings per share 41.7% below 2025.

Shake Shack, which operates rather than franchises almost all its Shacks, is the cost meter. June-quarter revenue rose 17.2% purely on new openings while average weekly sales held flat at $78,000; food and paper reached 28.8% of Shack sales and operating margin fell to 4.97% from 6.28%. Its trailing enterprise value to earnings before interest, taxes, depreciation and amortization of 12.3x has now slipped below McDonald's 14.8x.

This was not a burger-specific month. Over the same thirty days Texas Roadhouse fell 20.6%, Chipotle 16.6%, Domino's 16.5% and Yum Brands 12.9% while the S&P 500 tracker rose 0.4%. McDonald's 11.9% decline was the mildest in the complex.

The verdict

At 19.2x trailing and 18.3x forward earnings on consensus 2026 earnings per share of $12.91, McDonald's has given back most of a multiple that stood at 22.2x on 18 August and near 26x a year ago — with reported earnings still growing, June-quarter net income up 4.8%. Until 23 September that gap looked like sentiment. The investor update closed it: the franchisor has agreed to fund the operator's fix out of the highest-margin line it owns, and analysts flagged that rent relief may more than offset the general and administrative savings in 2028 through 2030 estimates. What nothing yet explains is consensus, which still has 2026 earnings up 6.4% and 2027 up 7.9%. One of those two readings has to move.

Chief executive Chris Kempczinski, on CNBC's "Squawk on the Street" on 23 September, declined to forecast a recovery: "We're not expecting that the industry all of a sudden is going to go to having robust traffic growth. We think that's going to be largely flat. We do think inflation is going to be with us for, unfortunately, I think many more years at an elevated level." He added that the industry should stop calling it a difficult environment and accept that it is the environment. A company whose entire appeal is being what people buy when money is tight has just conceded it must pay its own operators to keep serving them.

Novartis's Failed Myotonia Trial Erased a Third of Dyne Therapeutics' Market Value

Hypothesis Opus 5 · Research Opus 5 · Writing Opus 5 · Prompt v1.6

A company with no revenue lost roughly $1.5bn of market value this month on a trial run by someone else. Novartis disclosed on 8 September that del-desiran missed its primary endpoint in myotonic dystrophy type 1 — change in video hand opening time at six months — the same measure Dyne Therapeutics' own registrational readout, due in the first quarter of 2027, will be judged on.

Dyne holds about $1.3bn of cash including a July offering that raised roughly $405m, leaving some $1.7bn of its value resting on that readout and a 21 January 2027 decision date in Duchenne muscular dystrophy. The eight-stock Barron's takeout list Dyne sits in is down 15.4% over thirty days, but acquisition appetite is not what broke: biopharma mergers ran 80 deals in the first half of 2026 against 50 in all of 2025.

DYNASNDCYTKMLTXDNLICGONPCVXALNYSPYNeuromuscular Genetic MedicinesMyotonic Dystrophy PipelineClinical Endpoint RiskDuchenne Regulatory ReviewBiopharma M&A Wave
TickerCompanySegmentTrend · 13mo30D1Y
The subject · what this brief is about
DYNDyne TherapeuticsGene Therapy & Cell Therapy🟢 Cont. Bull−38.1%+27.4%
ASNDAscendis Pharma A/SRare Genetic & Metabolic Diseases🟢 Cont. Bull−10.1%+18.9%
CYTKCytokinetics, IncorporatedCNS & Neurological🟢 Cont. Bull−16.4%+35.2%
Compared against · context, not the story
MLTXMoonLake ImmunotherapeuticsImmunology & Autoimmune🔴 Cont. Bear−22.2%−78.6%
DNLIDenali TherapeuticsCNS & Neurological🟢 Cont. Bull−16.4%+51.8%
CGONCG OncologyOther🟢 Cont. Bull−13.5%+84.1%
PCVXVaxcyteInfectious Diseases & Vaccines🟢 Cont. Bull−7.8%+74.9%
ALNYAlnylam PharmaceuticalsRNA-Based Therapeutics🔴 Cont. Bear+6.7%−43.1%
SPYState Street SPDR S&P 500 ETF TrustAsset Management🟢 Cont. Bull+0.4%+17.5%

12-month price & trend

DYN
Dyne Therapeutics
16.03
−0.48 (−2.91%)
vs. prior close
Price20d50d150d
DYN 12-month price
Gene Therapy & Cell Therapy
ASND
Ascendis Pharma A/S
226
−5.10 (−2.21%)
vs. prior close
Price20d50d150d
ASND 12-month price
Rare Genetic & Metabolic Diseases
CYTK
Cytokinetics, Incorporated
64.66
−1.00 (−1.52%)
vs. prior close
Price20d50d150d
CYTK 12-month price
CNS & Neurological
TickerMkt capP/EP/E fwdP/SP/S fwdP/GPP/GP fwdEV/EBITDAFCF yld
DYN$3.0Bn/m—n/m———n/m-16.7%
ASND$14.0B16.4x16.2x11.7x10.4x12.9x11.5x152.8x2.7%
CYTK$8.0Bn/m—113.4x53.7x133.4x63.2xn/m-7.2%
MLTX
MoonLake Immunotherapeutics
12.04
−0.08 (−0.66%)
vs. prior close
Price20d50d150d
MLTX 12-month price
Immunology & Autoimmune
DNLI
Denali Therapeutics
20.39
−0.08 (−0.39%)
vs. prior close
Price20d50d150d
DNLI 12-month price
CNS & Neurological
CGON
CG Oncology
67.15
−1.61 (−2.34%)
vs. prior close
Price20d50d150d
CGON 12-month price
Other
TickerMkt capP/EP/E fwdP/SP/S fwdP/GPP/GP fwdEV/EBITDAFCF yld
MLTX$1.6Bn/m—n/m———n/m-14.5%
DNLI$3.7Bn/m—n/m104.4x——n/m-11.5%
CGON$6.3Bn/m——568.3x——n/m-2.6%
PCVX
Vaxcyte
56.21
−0.69 (−1.21%)
vs. prior close
Price20d50d150d
PCVX 12-month price
Infectious Diseases & Vaccines
ALNY
Alnylam Pharmaceuticals
256
+6.37 (+2.55%)
vs. prior close
Price20d50d150d
ALNY 12-month price
RNA-Based Therapeutics
SPY
State Street SPDR S&P 500 ETF Trust
769
+1.62 (+0.21%)
vs. prior close
Price20d50d150d
SPY 12-month price
Asset Management
TickerMkt capP/EP/E fwdP/SP/S fwdP/GPP/GP fwdEV/EBITDAFCF yld
PCVX$8.4Bn/m—n/m335.4x——n/m-14.3%
ALNY$32.8B40.3x36.8x6.8x6.0x8.6x7.5x28.2x1.6%
SPY$773.0B————————

Consensus projections

TickerFY2026EFY2027EFY2028E
DYNRevenue+43.8%+5202.8%+423.5%
EPS+3.5%−7.7%−24.6%
ASNDRevenue+90.9%+46.5%+27.1%
EPS−516.5%−35.2%+58.5%
CYTKRevenue+94.8%+182.8%+110.5%
EPS−6.8%−26.1%−52.9%
MLTXRevenue——+499.2%
EPS+6.4%−5.3%−19.5%
DNLIRevenue+1299.4%+204.0%+150.9%
EPS−18.1%+0.8%−24.6%
CGONRevenue+292.5%+669.5%+432.7%
EPS+26.5%+2.4%−97.0%
PCVXRevenue—+248.6%+103.3%
EPS+51.9%−19.8%−5.5%
ALNYRevenue+45.6%+26.9%+19.6%
EPS+171.3%+51.0%+24.2%

Forward fiscal years only. Blank means no analyst coverage for that year.

Novartis told investors on 8 September that del-desiran had failed to beat placebo on the primary endpoint of its Phase 3 HARBOR study in myotonic dystrophy type 1. Dyne Therapeutics, a Waltham, Massachusetts developer of muscle-targeted genetic medicines, published nothing of its own that day. Its shares fell 14.7%, on 9.2m shares against a recent daily average nearer 1m, and no comparable move hit neuromuscular peers.

By 25 September the stock had ground down to $16.03, a 34% decline in twelve sessions and roughly $1.5bn of market value. That matters beyond one bad fortnight because of what Dyne is: a $2.99bn company holding about $1.3bn of cash, which leaves some $1.7bn of value resting on two dated events, both in 2027, and one of them is a trial measured exactly the way Novartis's was.

The endpoint, not the molecule

The registrational expansion stage of Dyne's ACHIEVE trial of z-basivarsen is testing change from baseline in middle-finger myotonia by video hand opening time at six months versus placebo — the endpoint HARBOR missed. That is the transmission channel. It is also contestable: Jefferies argued after HARBOR that Dyne now "claims frontrunner status" in the disease, citing stronger tissue penetration, more consistent hand-opening effects and a larger splicing effect than Avidity's — the company Novartis bought for $12bn at a 46% premium, a deal that had itself been read as evidence that Dyne was next.

Dyne's own meters are short. Revenue has been zero in every quarter on record back to 2021. The second-quarter operating loss widened 57% to $181.7m, and diluted shares rose 45% over the year to 165.5m. Cash was $898.5m at 30 June plus about $405m net from a July offering, funding operations into the second quarter of 2028. The dates are a 21 January 2027 decision deadline for z-rostudirsen in exon-51 Duchenne muscular dystrophy, and ACHIEVE topline in the first quarter of 2027. Price-to-book of 3.78x is the only anchor that means anything; forward price-to-sales of 3,006x sits on $1m of consensus revenue. Analysts' 2028 revenue estimates run from $154m to $774m.

The list fell; the premise did not

Equal-weighted, the eight-stock Barron's takeout list Dyne belongs to is down 15.4% over thirty days while the S&P 500 exchange-traded fund rose 0.4%. But Alnylam rose 7.1% in the same window, and the other sharp declines each carry their own cause. Ascendis Pharma, the Danish maker of the TransCon slow-release hormone therapies, fell 9.5% on 15 September when Novo Nordisk handed back its obesity licence; Cytokinetics, which sells the oral heart-muscle inhibitor MYQORZO, fell 8.5% on 28 August when positive Phase 3 data in non-obstructive cardiomyopathy came with a modest effect size. Acquisition appetite, meanwhile, is widening: 80 deals worth $96bn in the first half of 2026 against 50 for all of 2025.

The three are paid for different things, which is why one drawdown means three things. Ascendis grew second-quarter revenue 118% and swung its operating margin to +18.4% from −33.5%, and now trades at 10.4x forward sales against 11.7x trailing — against roughly 11x in mid-September — while owing BioMarin a 20% royalty on U.S. Yuviwel sales. Its constraint is keeping patients on drug: "The majority of the drop-off is during that titration period," Jay Wu, president of Ascendis U.S., told investors on the 13 August call. Cytokinetics' $25.3m of second-quarter product revenue against a $175.9m operating loss supports 53.7x forward sales at gross margins within a point of Ascendis's, with consensus showing no profit until 2029; its de-rating from 57x is the one the arithmetic invites.

Dyne's is not a de-rating at all. Nothing about its cash, its timelines or its data changed in September; what changed is the market's estimate of how hard the hand-opening endpoint is to clear, learned from someone else's failure. That is real information, and it is not information about Dyne's molecule.

Which leaves a company whose next two quarterly reports cannot settle anything. The first day that can is in January 2027 — and it concerns a different muscle disease entirely.