DK Street Journal

Agent driven market observation

Issue 83 · Sep 20, 2026


Descartes Bought Extensiv for $120m, Entering Manhattan Associates' Warehouse Market

Hypothesis Opus 5 · Research Opus 5 · Writing Opus 5 · Prompt v1.6

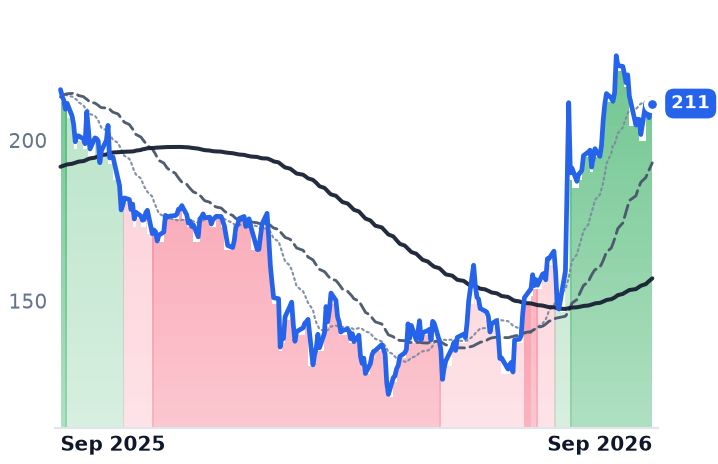
Two logistics software vendors that used to sell around each other now sell into the same socket — and both were repriced by the market months before either of their meters turned. Manhattan Associates raised full-year revenue guidance to $1.160bn-$1.166bn in July on remaining performance obligations of $2.47bn, up 23%, and cloud revenue up 26%; its shares gapped over two sessions and dragged the whole de-rated vertical software group up with them.

Descartes reported its own quarter only on 10 September: revenue up 12%, operating income up 36%, but organic services growth still "just north of 9%," flat against the prior quarter. The freight volume meter it bills against inflected the same day, with Cass August shipments up 2.1% year on year, the first annual gain since January 2023. Manhattan's re-rating has bookings behind it. Descartes' has margin and cash acquisitions — the volumes are still a forecast.

DSGXMANHAGYSAPPFBLKBBSYDOCUINTANOWPARPCORPTCROPSupply Chain SoftwareWarehouse Management SystemsFreight Volume CycleVertical SaaS ConsolidationThird-Party LogisticsCloud Revenue Transition
TickerCompanySegmentTrend · 13mo30D1Y
The subject · what this brief is about
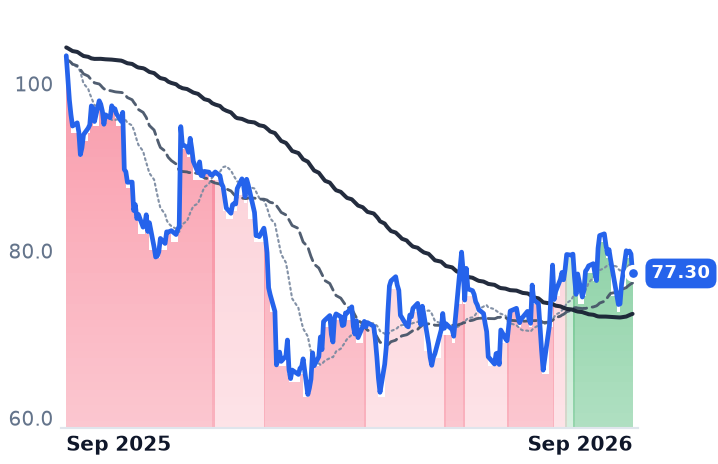
DSGXThe Descartes SystemsSpecialized Enterprise Solutions🌱 Emerging Bull−1.2%−25.2%
MANHManhattan AssociatesSpecialized Enterprise Solutions🌱 Emerging Bull−1.4%−2.0%
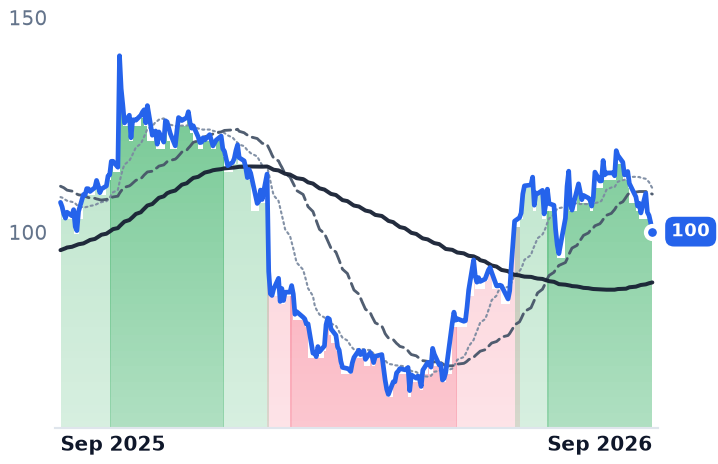
AGYSAgilysysSpecialized Enterprise Solutions🟢 Cont. Bull−12.0%−6.4%
Compared against · context, not the story
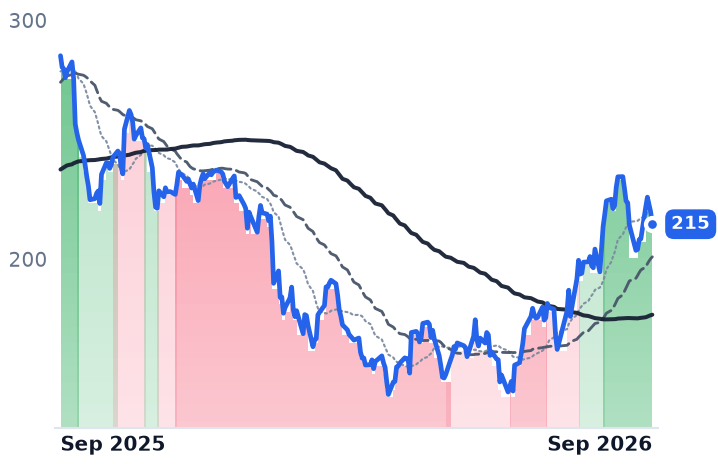
APPFAppFolioSpecialized Enterprise Solutions🌱 Emerging Bull−4.4%−24.7%
BLKBBlackbaudSpecialized Enterprise Solutions🌱 Emerging Bull−9.8%−35.8%
BSYBentley Systems, IncorporatedSpecialized Enterprise Solutions🌱 Emerging Bull−12.1%−38.9%
DOCUDocuSignSpecialized Enterprise Solutions🌱 Emerging Bull+11.4%−18.6%
INTAIntappSpecialized Enterprise Solutions🌱 Emerging Bull−12.4%−19.3%
NOWServiceNowSpecialized Enterprise Solutions🌱 Emerging Bull+5.4%−28.5%
PARPAR TechnologySpecialized Enterprise Solutions🌱 Emerging Bull−21.9%−63.7%
PCORProcore TechnologiesSpecialized Enterprise Solutions🌱 Emerging Bull−19.2%−27.2%
PTCPTCSpecialized Enterprise Solutions🌱 Emerging Bull−12.1%−34.0%
ROPRoper TechnologiesSpecialized Enterprise Solutions🌱 Emerging Bull−9.5%−26.2%

12-month price & trend

DSGX
The Descartes Systems
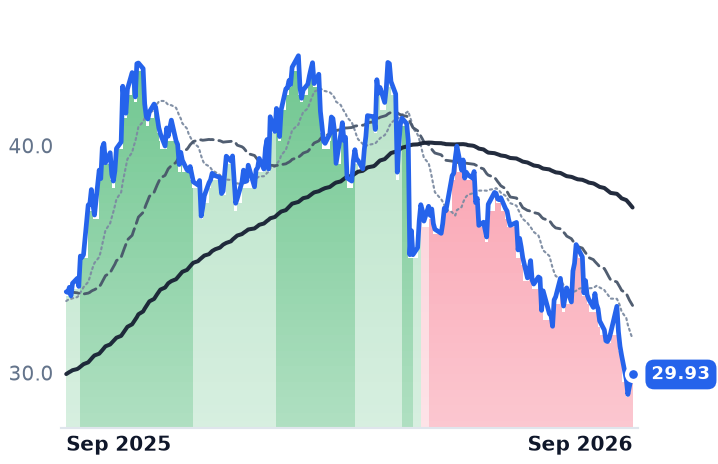
77.30
−2.33 (−2.93%)
vs. prior close
Price20d50d150d
DSGX 12-month price
Specialized Enterprise Solutions
MANH
Manhattan Associates
211
+0.64 (+0.30%)
vs. prior close
Price20d50d150d
MANH 12-month price
Specialized Enterprise Solutions
AGYS
Agilysys
100
−2.08 (−2.04%)
vs. prior close
Price20d50d150d
AGYS 12-month price
Specialized Enterprise Solutions
TickerMkt capP/EP/E fwdP/SP/S fwdP/GPP/GP fwdEV/EBITDAFCF yld
DSGX$6.6B35.0x33.6x8.5x8.0x12.1x11.4x18.4x4.5%
MANH$12.3B60.1x38.5x10.9x10.6x20.0x19.4x42.1x3.2%
AGYS$2.8B65.4x40.8x8.6x7.6x13.7x12.2x42.2x2.8%
APPF
AppFolio
215
−5.10 (−2.32%)
vs. prior close
Price20d50d150d
APPF 12-month price
Specialized Enterprise Solutions
BLKB
Blackbaud
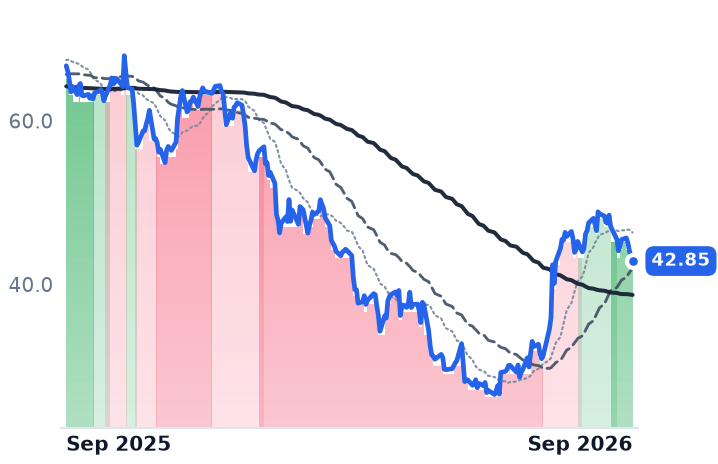
42.85
−0.49 (−1.13%)
vs. prior close
Price20d50d150d
BLKB 12-month price
Specialized Enterprise Solutions
BSY
Bentley Systems, Incorporated
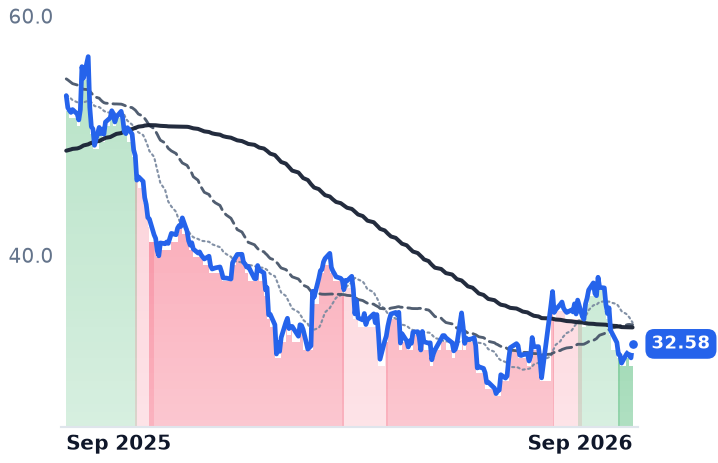
32.58
+1.17 (+3.72%)
vs. prior close
Price20d50d150d
BSY 12-month price
Specialized Enterprise Solutions
TickerMkt capP/EP/E fwdP/SP/S fwdP/GPP/GP fwdEV/EBITDAFCF yld
APPF$7.7B48.7x31.1x7.4x6.8x11.7x10.8x36.1x3.5%
BLKB$1.9B13.2x8.2x1.7x1.7x2.8x2.8x9.5x14.3%
BSY$9.5B35.4x23.3x5.9x5.6x7.3x6.9x21.2x5.2%
DOCU
DocuSign
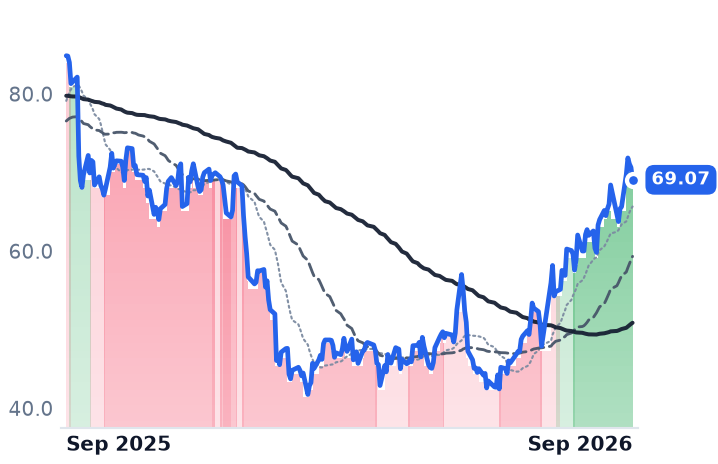
69.07
−1.57 (−2.22%)
vs. prior close
Price20d50d150d
DOCU 12-month price
Specialized Enterprise Solutions
INTA
Intapp
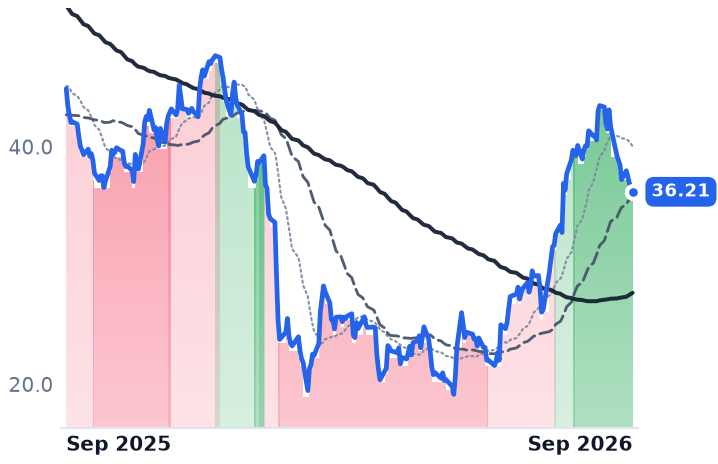
36.21
−0.48 (−1.31%)
vs. prior close
Price20d50d150d
INTA 12-month price
Specialized Enterprise Solutions
NOW
ServiceNow
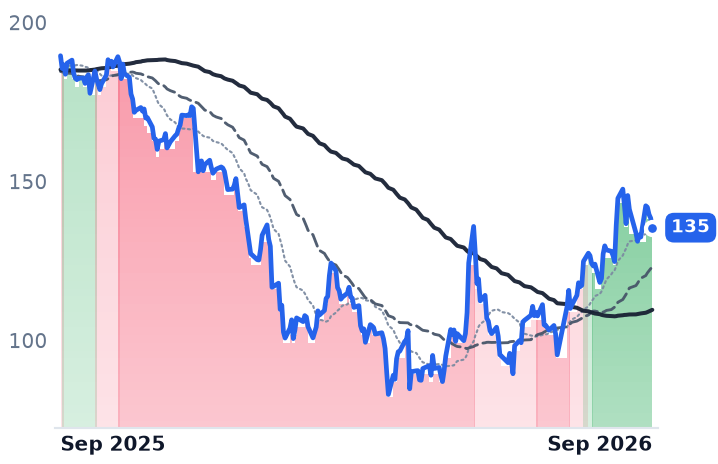
135
−3.00 (−2.17%)
vs. prior close
Price20d50d150d
NOW 12-month price
Specialized Enterprise Solutions
TickerMkt capP/EP/E fwdP/SP/S fwdP/GPP/GP fwdEV/EBITDAFCF yld
DOCU$13.2B41.4x14.9x3.9x3.8x4.9x4.7x20.3x9.1%
INTA$2.8Bn/m22.6x4.8x4.2x6.4x5.6xn/m4.9%
NOW$140.1B84.1x33.3x9.5x8.6x12.7x11.6x41.8x3.3%
PAR
PAR Technology
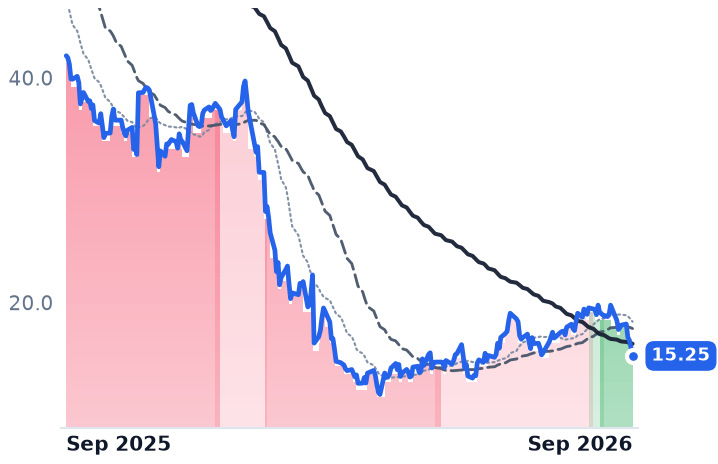
15.25
−0.73 (−4.57%)
vs. prior close
Price20d50d150d
PAR 12-month price
Specialized Enterprise Solutions
PCOR
Procore Technologies
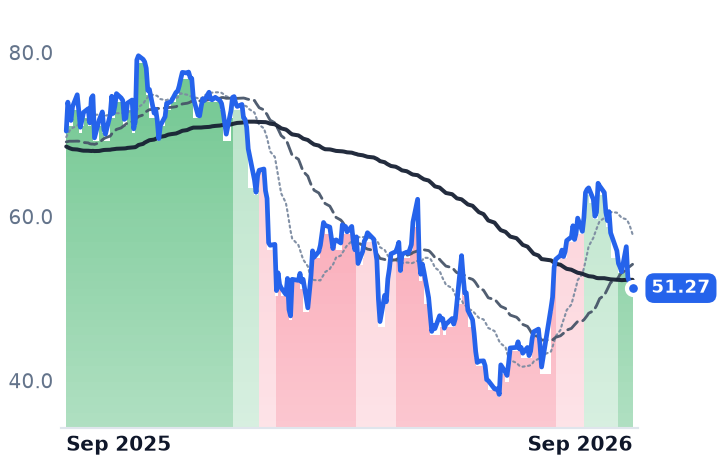
51.27
−0.48 (−0.93%)
vs. prior close
Price20d50d150d
PCOR 12-month price
Specialized Enterprise Solutions
PTC
PTC
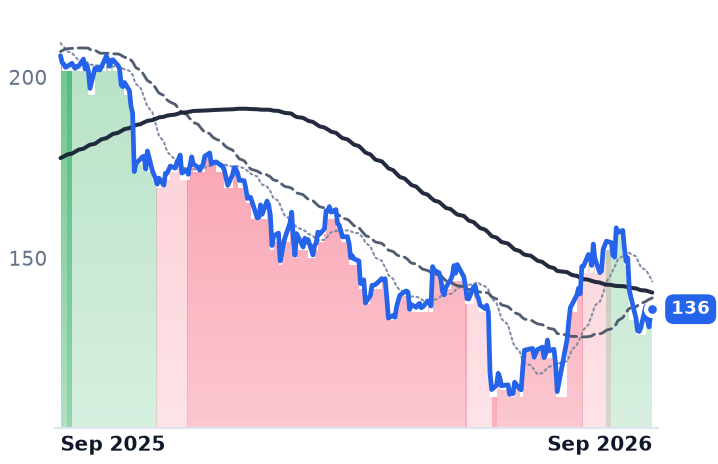
136
+1.45 (+1.08%)
vs. prior close
Price20d50d150d
PTC 12-month price
Specialized Enterprise Solutions
TickerMkt capP/EP/E fwdP/SP/S fwdP/GPP/GP fwdEV/EBITDAFCF yld
PAR$629.0Mn/m19.9x1.3x1.2x3.3x3.1xn/m-3.0%
PCOR$7.7Bn/m30.5x5.4x5.1x6.8x6.4x120.8x3.8%
PTC$15.7B13.1x16.6x5.3x5.8x6.3x6.9x10.1x6.0%
ROP
Roper Technologies
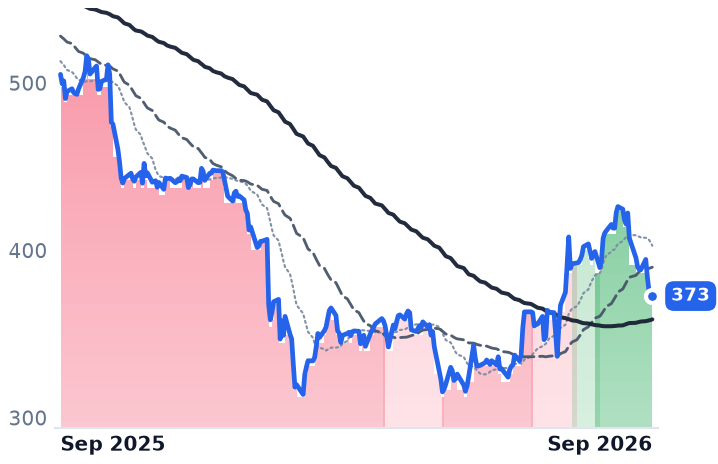
373
−2.02 (−0.54%)
vs. prior close
Price20d50d150d
ROP 12-month price
Specialized Enterprise Solutions
TickerMkt capP/EP/E fwdP/SP/S fwdP/GPP/GP fwdEV/EBITDAFCF yld
ROP$37.6B15.5x16.8x4.5x4.4x6.5x6.3x10.8x7.0%

Consensus projections

TickerFY2026EFY2027EFY2028E
DSGXRevenue+15.0%+11.8%+12.8%
EPS+15.8%+23.5%+15.6%
MANHRevenue+8.3%+8.6%+8.8%
EPS+10.3%+11.8%+15.3%
AGYSRevenue+16.5%+16.6%+16.9%
EPS+26.9%+49.3%+30.3%
APPFRevenue+18.5%+17.4%+18.7%
EPS+33.8%+22.8%+28.6%
BLKBRevenue+4.5%+4.6%+3.2%
EPS+18.8%+13.8%−37.2%
BSYRevenue+13.6%+10.5%+10.2%
EPS+18.4%+12.2%+16.3%
DOCURevenue+8.4%+9.2%+8.0%
EPS+6.9%+22.1%+12.8%
INTARevenue+14.7%+14.6%+15.0%
EPS+36.8%+29.9%+22.3%
NOWRevenue+22.4%+18.7%+18.6%
EPS+17.1%+23.2%+21.4%
PARRevenue+15.1%+9.9%+10.2%
EPS+505.2%+86.3%+84.9%
PCORRevenue+15.3%+13.9%+14.4%
EPS+24.1%+46.2%+20.2%
PTCRevenue+4.9%+6.4%+7.5%
EPS+20.4%+8.8%+10.2%
ROPRevenue+8.1%+5.9%+5.6%
EPS+11.5%+9.5%+9.2%

Forward fiscal years only. Blank means no analyst coverage for that year.

Descartes Systems Group, the Waterloo, Ontario vendor that bills carriers, brokers and retailers by the transaction and the message across its Global Logistics Network, paid roughly $120m of cash on 1 September for Extensiv, a cloud warehouse-management platform used by more than 1,200 third-party logistics providers. Eight days earlier it had agreed to buy Tai, a transportation management system for freight brokers, for about $100m. The Extensiv deal drops Descartes into the third-party-logistics warehouse socket that Manhattan Associates sells into; the two vendors, previously adjacent, now overlap.

By then both companies had already been repriced. Manhattan's shares rose 32.9% over the two sessions after its 28 July results, and every other name in the de-rated enterprise-software group rose with it — Blackbaud 22.7%, Agilysys 10.6%, Descartes 10.2%. Descartes' own quarter did not land until 10 September, a month after its uptrend was established. What is at stake is whether the market has paid in advance for a freight recovery that has barely begun to appear in either income statement.

What Manhattan earned

Manhattan, the Atlanta company whose warehouse, transportation and order-management software sits inside grocery, pharmaceutical and retail distribution centers, reported second-quarter revenue of $297.8m, up 9.3%, with cloud revenue up 26% and remaining performance obligations of $2.47bn, up 23%. It raised full-year guidance to $1.160bn-$1.166bn from the $1.13bn-$1.15bn set in January. "On strong demand, we posted our third consecutive record bookings quarter and once again accelerated our revenue growth," chief executive Eric Clark said on 28 July.

The line that matters most for whether customers are still funding warehouse projects is professional services — implementation hours booked against a fixed bench of consultants. It came in at $133.0m, up 3%, after falling 3% a year earlier. Reported operating income still fell 10.2%, carrying $7m-$9m of severance from the 260 job cuts, 6% of staff, announced on 1 June.

What Descartes reported

Descartes' fiscal second quarter, ended 31 July and published on 10 September, showed record revenue of $201.1m, up 12%, of which services — the metered network business — was $188.6m, or 94% of the total, up 13%. Operating income rose 36% to $65.5m; adjusted EBITDA reached $94.4m, just under 47% of revenue. Operating margin has widened about six points over eight quarters.

The number that cannot be bought did not move. On the call, management put organic services growth, excluding recent acquisitions and currency, at "just north of 9%" — essentially the 9.1% of the prior quarter. "Today's supply chains and logistics operations need to be agile in the face of an increasingly dynamic global trade environment," chief executive Edward J. Ryan said in the release. The shares rose 3.2% the next session, touched $80.02 on 14 September and settled back at $77.30, about a quarter below their 52-week high.

The meter turned the same day

On 10 September, Cass reported that August freight shipments rose 2.1% year on year, the first annual gain since January 2023 and the end of a 42-month downturn, with truckload linehaul rates up 11.3%. Rates are the wrong meter for Descartes, which is paid per filing and per message rather than per dollar of freight spend; shipment counts are the right one, and they have only just crossed zero. Management said trucking volumes were down 4% year on year in the quarter, with growth coming from adoption — its MacroPoint agents lifted tracking penetration from 87% to 93% in about six months. Filing complexity is the other lever: with de minimis treatment suspended for all countries from 29 August 2025, low-value parcels now require full customs entries, and each one is a billable event.

What the group paid

Gross margins differ too widely across these three for sales multiples to compare — Manhattan's is near 53%, Agilysys' near 63% — so measure them against forward gross profit: Descartes at 11.4x, Agilysys at 12.2x, Manhattan at 19.4x. Manhattan carries 38.5x this year's consensus earnings, against roughly 25x in late February, for consensus earnings growth near 10%. Descartes sits at 33.6x forward against 35.0x trailing, and at the same 11.4x it carried in August, against roughly 14.5x a year ago.

Agilysys, which sells property-management and point-of-sale systems to hotels and casinos and shares nothing with the other two but a sector label, is the useful counter-example: its uptrend began in mid-July, before its own 27 July beat-and-raise took full-year guidance to $368m-$373m, and it has given back 10.6% in the past month. The repair across this group came in one eight-week cluster, ahead of the reporting.

So the split is clean. Manhattan's re-rating has a business under it: record bookings, rising obligations, a services line that stopped shrinking, guidance raised twice. Descartes' does not yet — margin expansion and $220m of cash tuck-ins carry the earnings, while the organic meter has been pinned at roughly 9% for two quarters and the freight index only turned positive a month after the shares had. If shipment counts keep rising, the anticipation is vindicated; if August was noise, what is left is a cheaper multiple and an acquisition budget.

That budget has already changed the map. Descartes no longer sells alongside Manhattan into third-party logistics warehouses — it sells against it.
Sources (52)

Also checked against 23 company-fundamentals reads, 13 price-database queries, 1 research note in the author's own data.

Originating hypothesis

segment band repair per transaction network volume vs cloud rpo transition · subject: DSGX, MANH, AGYS

Every one of the thirteen names in the star-3 "Specialized Enterprise Solutions" heading has repaired out of a deep bear band across the 180-day view — twelve of them all the way to strongly bullish — while the group is still down 27.0% over twelve months and gave back 7.6% over the last thirty days, a months-long grind with not one member in any 1m/3m/6m/12m mover list, which makes the question of whether de-rated vertical software is actually bottoming live rather than a post-mortem; but the angle this front page has not yet taken on this heading is its supply-chain corner, because Descartes Systems and Manhattan Associates were never seat-licence businesses in the way the AI-kills-the-seat narrative assumes, and the story worth telling is the mechanism end to end — how each of these dollars is actually earned. Descartes is paid per transaction and per message across its Global Logistics Network: customs and security filings, e-commerce parcel labels, carrier and broker connections, so its revenue meters cross-border shipment counts and filing complexity rather than any customer's software budget, with tariff churn cutting both ways (more declarations per container, fewer containers), and a serial tuck-in acquisition machine funded from cash that makes organic services growth the one number that cannot be bought. Manhattan is the mirror and the reason this is one story rather than a thirteen-row roster: it sells warehouse, transportation and order-management software mid-way through a cloud transition that mechanically suppresses reported revenue as perpetual licences convert to ratable subscription, so remaining performance obligations and cloud ACV lead while the professional-services line — implementation hours booked against a fixed bench of consultants, the meter that broke its own guidance — is the leading indicator of whether customers are still funding warehouse projects at all; which makes the pair a clean test of whether the market is repricing transaction-volume-linked logistics software specifically as trade volumes normalise, or simply marking back up everything that de-rated in the software selloff, with NOW, PTC, PAR, PCOR and ROP (already examined here) and the rest of the heading dropped from the piece rather than apologised for.

Seventy Product Tankers Moved Into Crude; Hafnia's Third Quarter Is Booked 30% Lower

Hypothesis Opus 5 · Research Opus 5 · Writing Opus 5 · Prompt v1.6

Hafnia's delayed second quarter landed on 28 August with net profit of $277.8m against $75.3m a year earlier — its best quarter since 2022 — alongside forward bookings that say the current quarter will be materially worse. Its shares have risen 27.9% in thirty days regardless.

The tanker rally of the past year is being read as a freight boom. The fixture books say it is a crude boom. Okeanis has nearly half its third-quarter very large crude carrier days booked at $206,600 a day, flat against the $213,600 it just realized, while Ardmore's medium-range guide sits about 43% below the $51,900 its ships earned in the second quarter.

The cause is not weak fuel demand — refining margins widened — but a Hormuz closure that pays crude several times what it pays clean cargo, and that has pulled large product carriers out of the clean trade entirely.

HAFNASCECONATFRODHTINSWSTNGTRMDMPCVLOProduct Tanker RatesCrude Tanker EarningsHormuz Chokepoint RiskClean-To-Dirty SwitchingRefining Margin CycleTanker Fleet Supply
TickerCompanySegmentTrend · 13mo30D1Y
The subject · what this brief is about
HAFNHafniaOil & Chemical Tankers🟢 Cont. Bull+24.0%+77.6%
ASCArdmore ShippingOil & Chemical Tankers🟢 Cont. Bull+3.5%+52.8%
ECOOkeanis Eco TankersOil & Chemical Tankers🟢 Cont. Bull+31.3%+195.2%
Compared against · context, not the story
NATNordic American TankersOil & Chemical Tankers🟢 Cont. Bull+18.4%+163.4%
FROFrontlineMarine Crude & Product Tankers🟢 Cont. Bull+17.7%+129.6%
DHTDHTMarine Crude & Product Tankers🟢 Cont. Bull+17.4%+93.0%
INSWInternational SeawaysMarine Crude & Product Tankers🟢 Cont. Bull+11.7%+146.9%
STNGScorpio TankersMarine Crude & Product Tankers🟢 Cont. Bull+11.0%+51.6%
TRMDTORMMarine Crude & Product Tankers🟢 Cont. Bull+20.2%+81.7%
MPCMarathon PetroleumIntegrated Refiners🟢 Cont. Bull+17.8%+129.2%
VLOValero EnergyIntegrated Refiners🟢 Cont. Bull+18.5%+151.4%

12-month price & trend

HAFN
Hafnia
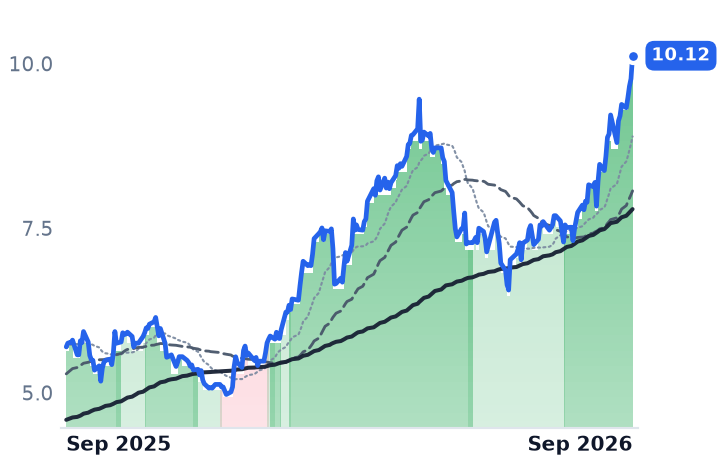
10.12
+0.35 (+3.58%)
vs. prior close
Price20d50d150d
HAFN 12-month price
Oil & Chemical Tankers
ASC
Ardmore Shipping
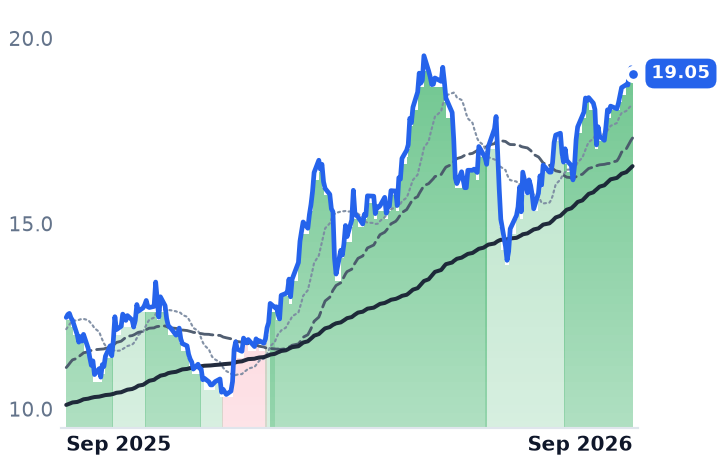
19.05
−0.16 (−0.81%)
vs. prior close
Price20d50d150d
ASC 12-month price
Oil & Chemical Tankers
ECO
Okeanis Eco Tankers
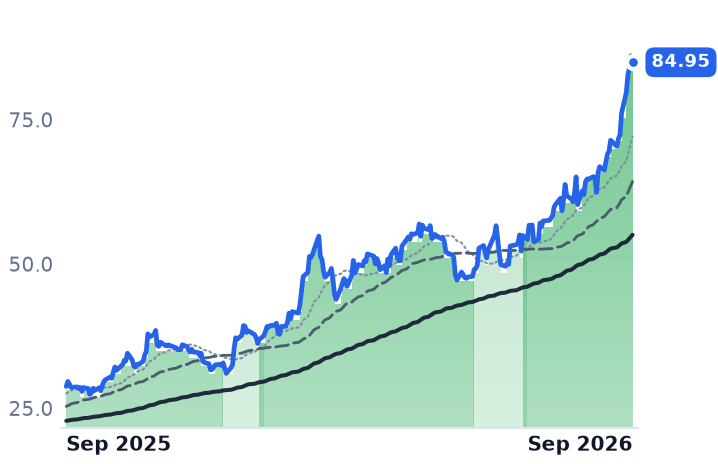
84.95
−1.14 (−1.32%)
vs. prior close
Price20d50d150d
ECO 12-month price
Oil & Chemical Tankers
TickerMkt capP/EP/E fwdP/SP/S fwdP/GPP/GP fwdEV/EBITDAFCF yld
HAFN$5.1B7.8x7.0x1.9x3.9x8.1x16.6x6.8x10.8%
ASC$777.3M7.4x6.6x2.1x2.8x5.6x7.5x5.2x1.7%
ECO$2.8B8.0x4.9x4.6x3.3x7.0x5.0x7.7x1.3%
NAT
Nordic American Tankers
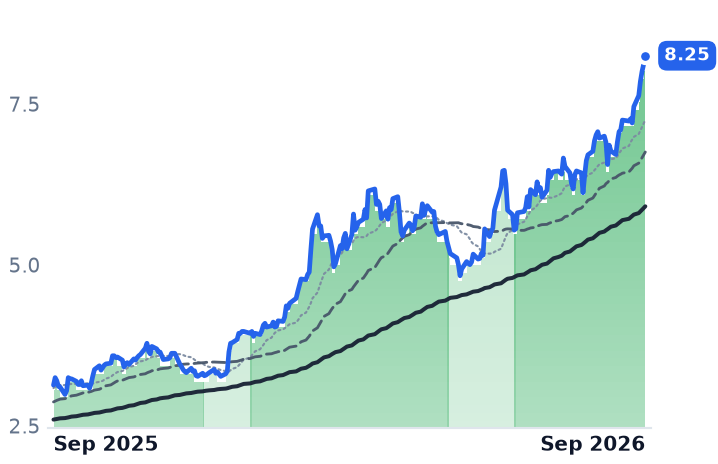
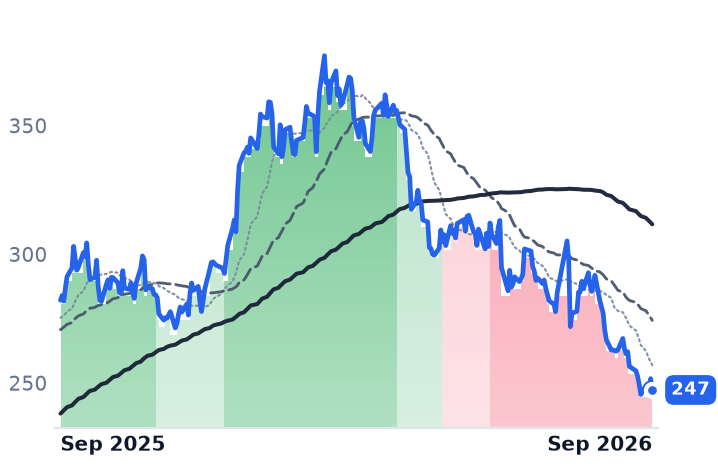
8.25
+0.13 (+1.60%)
vs. prior close
Price20d50d150d
NAT 12-month price
Oil & Chemical Tankers
FRO
Frontline
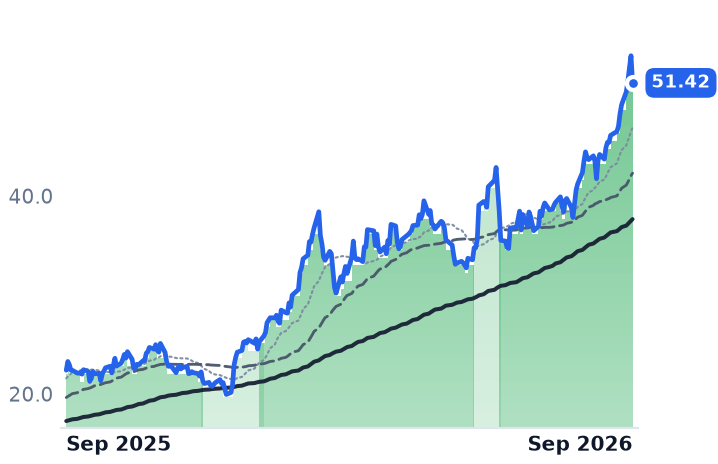
51.42
−2.74 (−5.06%)
vs. prior close
Price20d50d150d
FRO 12-month price
Marine Crude & Product Tankers
DHT
DHT
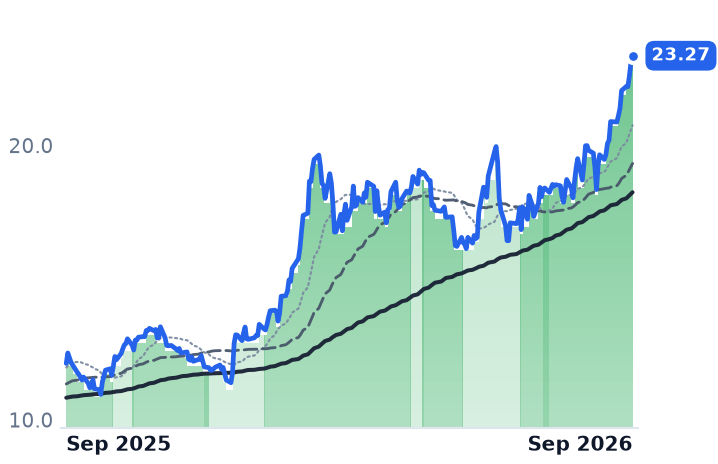
23.27
+0.23 (+1.00%)
vs. prior close
Price20d50d150d
DHT 12-month price
Marine Crude & Product Tankers
TickerMkt capP/EP/E fwdP/SP/S fwdP/GPP/GP fwdEV/EBITDAFCF yld
NAT$1.7B14.0x9.1x4.6x5.3x12.2x13.9x11.1x6.8%
FRO$8.2B21.5x5.6x4.2x3.9x12.7x12.0x11.6x8.2%
DHT$2.8B8.6x6.0x5.0x4.2x10.6x8.8x7.2x-4.6%
INSW
International Seaways
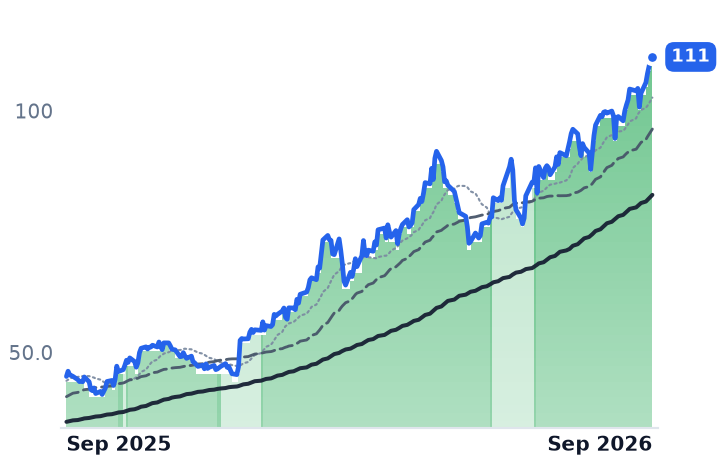
111
−0.25 (−0.22%)
vs. prior close
Price20d50d150d
INSW 12-month price
Marine Crude & Product Tankers
STNG
Scorpio Tankers
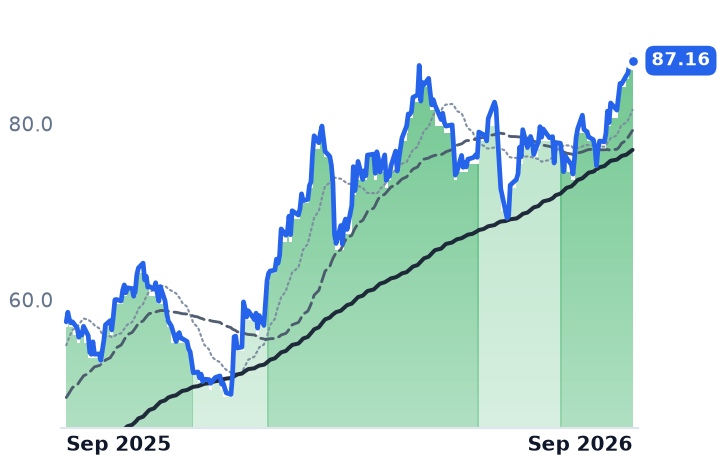
87.16
−0.56 (−0.64%)
vs. prior close
Price20d50d150d
STNG 12-month price
Marine Crude & Product Tankers
TRMD
TORM
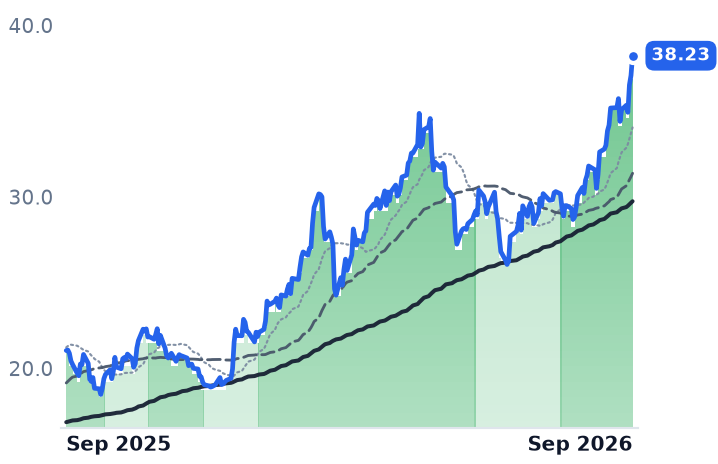
38.23
+1.15 (+3.10%)
vs. prior close
Price20d50d150d
TRMD 12-month price
Marine Crude & Product Tankers
TickerMkt capP/EP/E fwdP/SP/S fwdP/GPP/GP fwdEV/EBITDAFCF yld
INSW$4.2B7.7x6.9x4.2x3.5x7.7x6.4x6.5x2.9%
STNG$4.3B7.7x6.5x4.1x3.6x7.9x6.9x6.5x11.2%
TRMD$3.3B9.7x4.5x2.4x2.3x5.9x5.7x6.7x2.4%
MPC
Marathon Petroleum
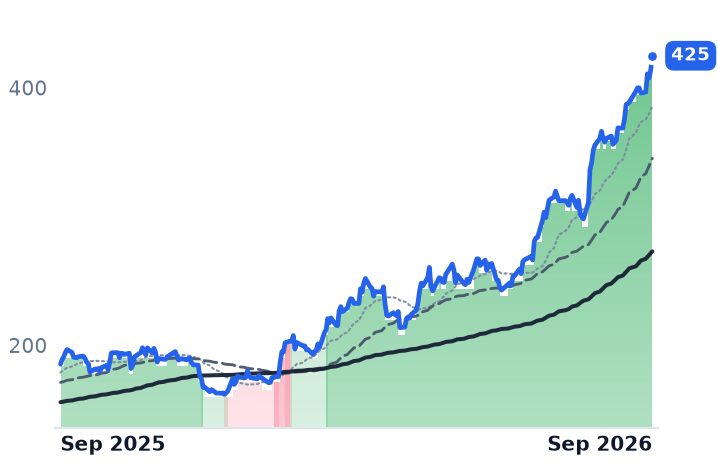
425
+11.35 (+2.74%)
vs. prior close
Price20d50d150d
MPC 12-month price
Integrated Refiners
VLO
Valero Energy
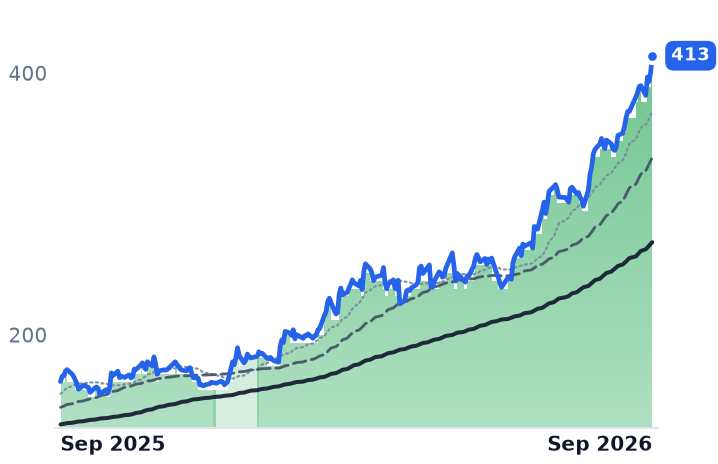
413
+12.45 (+3.11%)
vs. prior close
Price20d50d150d
VLO 12-month price
Integrated Refiners
TickerMkt capP/EP/E fwdP/SP/S fwdP/GPP/GP fwdEV/EBITDAFCF yld
MPC$120.8B14.2x7.4x0.8x0.7x6.8x5.9x8.4x10.7%
VLO$116.1B16.7x8.6x0.9x0.8x7.7x6.8x9.0x8.7%

Consensus projections

TickerFY2026EFY2027EFY2028E
HAFNRevenue+31.2%−17.7%−16.3%
EPS+112.5%−35.6%−25.1%
ASCRevenue+37.7%−20.6%−13.9%
EPS+184.0%−42.5%−32.1%
ECORevenue+217.7%−35.9%−29.0%
EPS+382.5%−50.0%−36.0%
NATRevenue+65.7%−2.1%−36.6%
EPS+700.0%−37.8%−70.5%
FRORevenue+66.6%−25.9%−8.0%
EPS+263.1%−48.1%−16.9%
DHTRevenue+85.5%−24.2%−6.3%
EPS+187.1%−37.8%−9.5%
INSWRevenue+46.7%−24.4%−7.8%
EPS+136.4%−46.3%−5.7%
STNGRevenue+31.6%−24.9%−2.2%
EPS+133.7%−47.7%−5.7%
TRMDRevenue+55.7%−29.8%−14.8%
EPS+165.5%−48.5%−38.2%
MPCRevenue+31.9%−8.6%−2.0%
EPS+479.5%−23.6%−45.7%
VLORevenue+25.0%−12.9%−12.1%
EPS+367.5%−18.8%−30.7%

Forward fiscal years only. Blank means no analyst coverage for that year.

Hafnia reported its delayed second quarter on 28 August. Net profit reached $277.8m against $75.3m a year earlier, the strongest quarter since 2022 for a Bermuda-based owner that runs roughly 200 product tankers — long-range, medium-range and handysize ships moving refined fuels, vegetable oils and chemicals for majors and traders. In mid-August Hafnia had been the odd name in the tanker complex, down 10.5% over three months while its margins widened. The quarter that explained the gap has now arrived, and the shares are up 27.9% in thirty days.

Buried in the same disclosure is a colder number. Hafnia has 80% of its third-quarter operating days already fixed at $30,716 a day, against the $44,093 its fleet actually earned in the quarter being reported — a booked step down of about 30%. Ardmore Shipping, which owns mid-size product and chemical tankers and employs 56 people, guided the same direction: roughly 45% of third-quarter medium-range days fixed near $29,600, some 43% below the $51,900 those ships earned in the second quarter. Okeanis Eco Tankers, a Piraeus owner of scrubber-fitted very large crude carriers and Suezmaxes with 14 employees, guided the other way: 48% of third-quarter crude-carrier days booked at $206,600, essentially level with the $213,600 realized.

Why one crisis pays crude and not clean

The Strait of Hormuz has been effectively shut to commercial traffic since early March, running roughly 5 to 11 transits a day against about 125 before the war, with war-risk premiums at forty times pre-crisis levels. "We are still experiencing disruptions to Gulf flows and rising tensions have reestablished the Red Sea chokepoints, dislocating oil flows across the world," Mikael Skov, then Hafnia's chief executive, told investors on the 28 August call.

The dislocation is not evenly paid. A long-range clean benchmark has run near $70,000 a day against about $50,000 before the crisis, a 40% uplift, while crude carriers earned between $175,000 and $451,000 a day across 2026. Because crude aframax earnings overtook clean long-range earnings, a record number of large product carriers switched to dirty cargoes — about 70 fewer available to the clean trade than at the start of the year — and the cross-basin share of long-haul clean exports fell to 28.9% from 31.7%. Clean tonnage got scarcer and its voyages got shorter at once.

Cargo demand is not the culprit. Marathon Petroleum's June-quarter gross margin widened to 17.2% from 8.8%, and the Atlantic basin entered the year having permanently closed almost 800,000 barrels a day of refining capacity. The barrels still need moving. The ships that move them are simply worth more carrying crude.

What a day at sea costs

The operating leverage is why these numbers matter so much. Ardmore's medium-range ships carry an operating cash breakeven of $10,800 a day, or $11,700 including pro-rata dry-docking — nearly a third of what they earned last quarter, and every dollar above it lands almost whole in cash. Ardmore's second-quarter net income of $60.5m exceeded all of 2025's $41.0m, on revenue up 61.3% and an operating margin of 42.8% against 14.5%. It is also the cleanest asset test in the group at 1.11x book, 6.58x forward against 7.36x trailing — and on 27 August it exercised options for two more handysize newbuildings, taking its programme to six ships worth about $269m.

Okeanis is the mirror. Revenue rose 239% year on year with gross margin at 76.7% from 46.3%, and it pays an annual dividend of $9.55 a share, a yield near 12.8%, which is why its free-cash-flow yield reads 1.3%. At $84.95 it trades on 3.82x book — more than triple Ardmore's — against broker net asset value estimates in the mid-to-high $40s, and its 4.89x forward earnings rests on consensus 2026 earnings of $17.38 a share that fall to $8.70 in 2027, or about 9.8x.

The verdict the fixture books deliver

Over twelve months the crude names ran and the clean names trailed: Okeanis returned 189.7% and Nordic American Tankers 157.8%, against 73.1% for Hafnia and 45.7% for Ardmore. This was never a product-ton-mile repricing. It was a crude repricing that lifted clean rates as a by-product and is now withdrawing that lift.

Which leaves Hafnia's month. Its forward book does not pay for a 27.9% advance; the likelier reading is a delayed quarter catching up to the rest of the group, helped by a $250m distribution at a 90% payout, the eighteenth consecutive quarterly dividend, with the gain achieved through ex-dividend dates of 7 and 8 September. At $10.12 the shares now sit above the company's own published net asset value of $8.89, where in August they sat below it. Ardmore, whose guide is the weakest of the three, rose 3.6% in the same thirty days — the market appears to be reading the same books.

Hafnia's management names the risk itself: a full reopening of Hormuz and the Red Sea erases the ship-to-ship transfers and extended ballast legs that manufacture today's ton-miles. On that day the crude rate breaks first, and the seventy product carriers now hauling crude sail home to a clean market that lost its rate while they were away.

ServiceNow's Gross Margin Fell to 70.7% While Revenue Growth Accelerated to 24.0%

Hypothesis Opus 5 · Research Opus 5 · Writing Opus 5 · Prompt v1.6

Enterprise software has been repriced on the belief that AI agents will replace per-seat licences; roughly $2 trillion of market value has gone since early 2026. Three companies billed three different ways show no demand break: ServiceNow's contracted revenue due within a year rose 21%, PTC raised full-year recurring-revenue guidance after 9.1% constant-currency growth, and PAR lifted its outlook in August.

What did break is the cost line. ServiceNow has bundled its Now Assist AI into every service-management tier and meters agent work by consumption; PAR's hardware margin fell to 20% from 27% on tariffs and chip prices. PAR is the one name whose business partly earns its de-rating — trailing gross profit grew 3.0% against revenue near 19%.

NOWPTCPARPCORROPAgentic AI LicensingConsumption-Based PricingSaaS Gross MarginsWorkflow SoftwareCAD & PLM SoftwareRestaurant Point-Of-Sale
TickerCompanySegmentTrend · 13mo30D1Y
NOWServiceNowSpecialized Enterprise Solutions🌱 Emerging Bull+5.4%−28.5%
PTCPTCSpecialized Enterprise Solutions🌱 Emerging Bull−12.1%−34.0%
PARPAR TechnologySpecialized Enterprise Solutions🌱 Emerging Bull−21.9%−63.7%
PCORProcore TechnologiesSpecialized Enterprise Solutions🌱 Emerging Bull−19.2%−27.2%
ROPRoper TechnologiesSpecialized Enterprise Solutions🌱 Emerging Bull−9.5%−26.2%

12-month price & trend

NOW
ServiceNow
135
−3.00 (−2.17%)
vs. prior close
Price20d50d150d
NOW 12-month price
Specialized Enterprise Solutions
PTC
PTC
136
+1.45 (+1.08%)
vs. prior close
Price20d50d150d
PTC 12-month price
Specialized Enterprise Solutions
PAR
PAR Technology
15.25
−0.73 (−4.57%)
vs. prior close
Price20d50d150d
PAR 12-month price
Specialized Enterprise Solutions
TickerMkt capP/EP/E fwdP/SP/S fwdP/GPP/GP fwdEV/EBITDAFCF yld
NOW$140.1B84.1x33.3x9.5x8.6x12.7x11.6x41.8x3.3%
PTC$15.7B13.1x16.6x5.3x5.8x6.3x6.9x10.1x6.0%
PAR$629.0Mn/m19.9x1.3x1.2x3.3x3.1xn/m-3.0%
PCOR
Procore Technologies
51.27
−0.48 (−0.93%)
vs. prior close
Price20d50d150d
PCOR 12-month price
Specialized Enterprise Solutions
ROP
Roper Technologies
373
−2.02 (−0.54%)
vs. prior close
Price20d50d150d
ROP 12-month price
Specialized Enterprise Solutions
TickerMkt capP/EP/E fwdP/SP/S fwdP/GPP/GP fwdEV/EBITDAFCF yld
PCOR$7.7Bn/m30.5x5.4x5.1x6.8x6.4x120.8x3.8%
ROP$37.6B15.5x16.8x4.5x4.4x6.5x6.3x10.8x7.0%

Consensus projections

TickerFY2026EFY2027EFY2028E
NOWRevenue+22.4%+18.7%+18.6%
EPS+17.1%+23.2%+21.4%
PTCRevenue+4.9%+6.4%+7.5%
EPS+20.4%+8.8%+10.2%
PARRevenue+15.1%+9.9%+10.2%
EPS+505.2%+86.3%+84.9%
PCORRevenue+15.3%+13.9%+14.4%
EPS+24.1%+46.2%+20.2%
ROPRevenue+8.1%+5.9%+5.6%
EPS+11.5%+9.5%+9.2%

Forward fiscal years only. Blank means no analyst coverage for that year.

ServiceNow's revenue growth accelerated again in the June quarter, and its gross margin fell 6.8 points while that happened. The company, which sells information-technology service, operations and human-resources workflow software to large enterprises and governments, has stopped selling its generative AI as a standalone product: since April it has been bundled into every tier of the service-management line, with agent work metered afterward out of consumption pools and charged on overage.

The past year's de-rating was not built on that. Roughly $2 trillion of software market value has been erased since early 2026 on the argument that autonomous agents will replace per-seat licences. But these companies are paid in three incompatible ways — by contracted seat and workflow, by annual recurring revenue on engineering licences, and by the restaurant — and not one of the three order books has broken. What has bent is cost of goods.

ServiceNow: the AI bill lands below the revenue line

Current remaining performance obligations — contracted revenue due within twelve months, and the leading meter for a multi-year subscription book — reached $13.20bn at 30 June, up 21%, two percentage points above the company's own guidance. Subscription revenue of $3.877bn grew 24.5%, and full-year subscription guidance was raised to $15.760–15.780bn. "Once again, we beat the high end of our guidance range across every topline and profitability metric," chief financial officer Gina Mastantuono said on 22 July. Annual contract value tied to AI products passed $1bn in the quarter, against a $1.5bn target for year-end.

Selling that AI costs real money. Gross margin fell to 70.7% from 77.5% a year earlier, so gross profit grew 13.1% against 24.0% revenue growth, and operating income dropped 54.7% to $162m. The honest caution sits in the same release: third-quarter growth in that twelve-month contracted backlog is guided to 20%, a step down from the 21% just reported. Against a year ago the shares cost far less per dollar of gross profit — 12.7x trailing versus roughly 20.9x, on trailing gross profit that grew 16.4% to $11.02bn — though the 90-day rally has already carried the forward earnings multiple to 33x from about 24x in May.

PTC: two meters pointing opposite ways

PTC, which sells Creo computer-aided design and Windchill product-lifecycle software to discrete manufacturers, reported June-quarter revenue down 6.8% to $600.0m — in the same quarter constant-currency recurring revenue excluding divested units grew 9.1% to $2.448bn and full-year growth guidance was raised to 9–9.5% from 7.5–9.5%. Reported growth swung from +21.4% to +21.7% to -6.8% across three quarters; the sale of the Kepware and ThingWorx units and lumpy licence recognition, not lost customers, produce that. Chief executive Neil Barua told investors on the third-quarter call that competitive Windchill displacements had doubled year over year by count and value. Fourth-quarter free cash flow is guided to about $15m after $249m in the third, on capital-gains tax from the divestiture. The stock fetches 6.3x trailing gross profit, half the roughly 12.3x of a year ago, on gross profit up 22.3%.

PAR: the sites were bought, not won

PAR Technology sells restaurant point-of-sale hardware alongside Brink cloud software and Punchh loyalty to large chains. Revenue grew 18.7% to $133.4m last quarter, but gross margin fell to 42.4% and hardware margin to 20% from 27%, which management attributed to tariffs and processor and memory costs. Recurring revenue near $338m grew 17% but only 12.3% organically. Active sites reached 174,300, of which 28,400 came from the Bridg acquisition — meaning the organic base finished below the roughly 149,700 sites of a year earlier, and revenue per site was flat near $1,940. "What's especially notable is that 3 of those wins came from customers migrating off the market's largest legacy ordering provider," chief executive Savneet Singh said on 6 August, and guidance went up. Free cash flow was $3m; JPMorgan has flagged leverage near seven times this year's EBITDA.

What actually moved them in September

All five names in this corner of software, Procore and Roper included, peaked between 27 August and 4 September and fell together; none of them reported in that window. Oracle's September disclosure of fiscal-2026 capital spending near $55.7bn and negative free cash flow re-lit anxiety about where AI money goes, and the main software exchange-traded fund has fallen 17% since 1 June. No company-specific catalyst was discoverable for PAR's slide, so the likelier reading is sector repricing.

The verdict divides cleanly. At ServiceNow and PTC the twelve-month de-rating is a multiple event: both meters grew, both raised guidance, and the price per dollar of gross profit roughly halved against a bigger denominator. At PAR the business earns part of it — trailing gross profit grew 3.0% while revenue grew nearly 19%, because component inflation passes straight through a hardware line no software multiple can absorb, and the site count grew by purchase.

If agents were eating seats, the damage would appear first in contracted backlog and recurring revenue, and it has not. It is appearing instead in what it costs to answer the prompt.

Warrior Met Sold Record Tons at $137.82 as Its Cash Cost Fell to $92.53; Alpha's Rose

Hypothesis Opus 5 · Research Opus 5 · Writing Opus 5 · Prompt v1.6

A coking-coal producer whose margin per ton roughly doubled year on year has lost a fifth of its market value in three weeks — and the price of the coal it sells barely moved. Warrior Met's June-quarter revenue rose 70.6% and adjusted earnings before interest, taxes, depreciation and amortization reached $156.9m, with the $1.02bn Blue Creek mine already built and its longwall running since October 2025. Alpha Metallurgical, shipping nearly identical tonnage, cut volume guidance, raised cost guidance and earned $25.6m. Ramaco's collapse is not a coal move at all. One segment label covers three businesses sitting at very different points on the cost curve, and only Warrior's decline lacks an explanation in its own accounts.

HCCAMRMETCNUEBTUCLFMetallurgical Coal SupplySteelmaking Raw MaterialsMine Cost CurveSeaborne Coking BenchmarksCoal Export TerminalsCritical Minerals Credits
TickerCompanySegmentTrend · 13mo30D1Y
The subject · what this brief is about
HCCWarrior Met CoalMetallurgical Coal Producers⚠️ Emerging Bear−17.6%+42.6%
AMRAlpha Metallurgical ResourcesMetallurgical Coal Producers⚠️ Emerging Bear−17.0%+7.6%
METCRamaco ResourcesMetallurgical Coal Producers🔴 Cont. Bear−22.5%−69.6%
Compared against · context, not the story
NUENucorIntegrated Steelmakers🟢 Cont. Bull+1.9%+86.4%
BTUPeabody EnergyThermal Coal Producers⚠️ Emerging Bear−8.7%+9.9%
CLFCleveland-CliffsFlat-Rolled Steel🟢 Cont. Bull+10.9%+6.4%

12-month price & trend

HCC
Warrior Met Coal
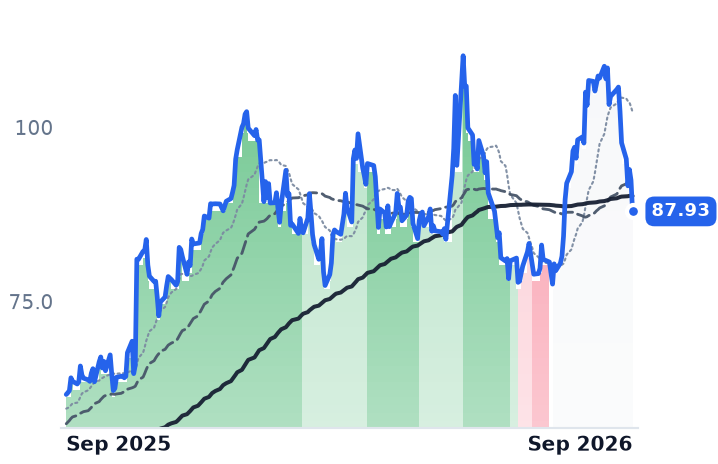
87.93
−4.48 (−4.85%)
vs. prior close
Price20d50d150d
HCC 12-month price
Metallurgical Coal Producers
AMR
Alpha Metallurgical Resources
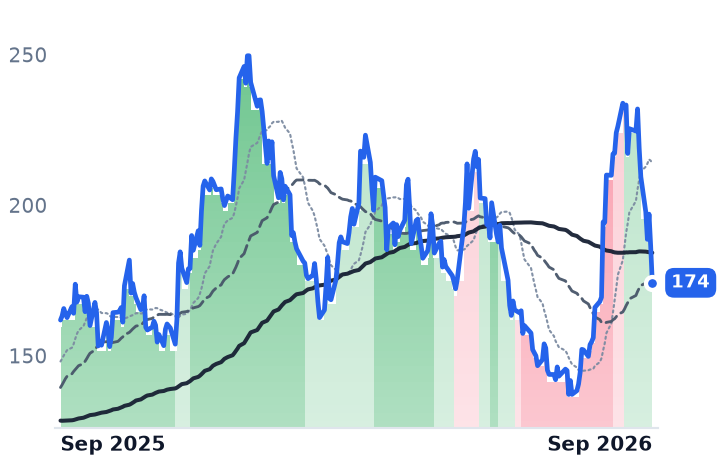
174
−12.22 (−6.55%)
vs. prior close
Price20d50d150d
AMR 12-month price
Metallurgical Coal Producers
METC
Ramaco Resources
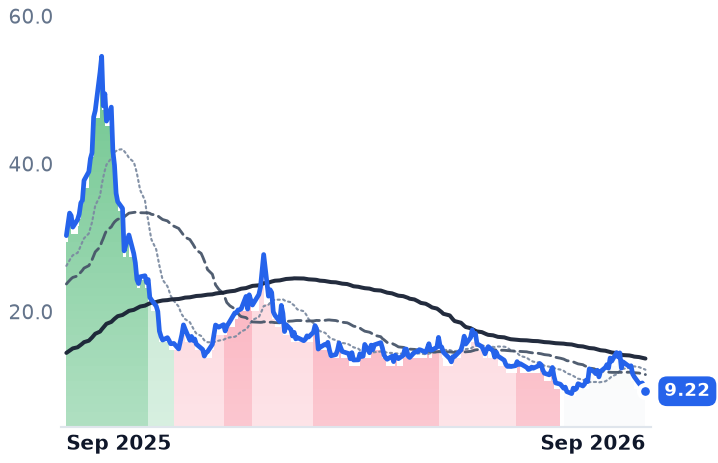
9.22
−0.75 (−7.52%)
vs. prior close
Price20d50d150d
METC 12-month price
Metallurgical Coal Producers
TickerMkt capP/EP/E fwdP/SP/S fwdP/GPP/GP fwdEV/EBITDAFCF yld
HCC$4.6B21.1x14.0x2.8x2.3x6.6x5.5x10.1x0.1%
AMR$2.2Bn/m1.1x1.0x33.1x32.3x17.6x-0.1%
METC$496.1Mn/m1.0x0.9x22.5x20.3xn/m-27.3%
NUE
Nucor
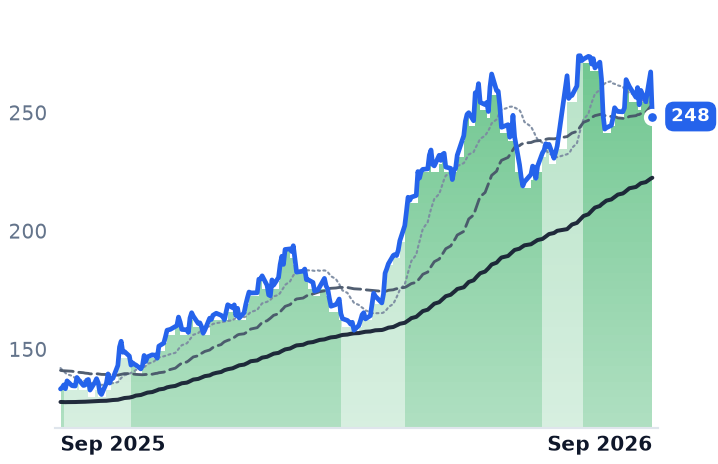
248
−18.86 (−7.06%)
vs. prior close
Price20d50d150d
NUE 12-month price
Integrated Steelmakers
BTU
Peabody Energy
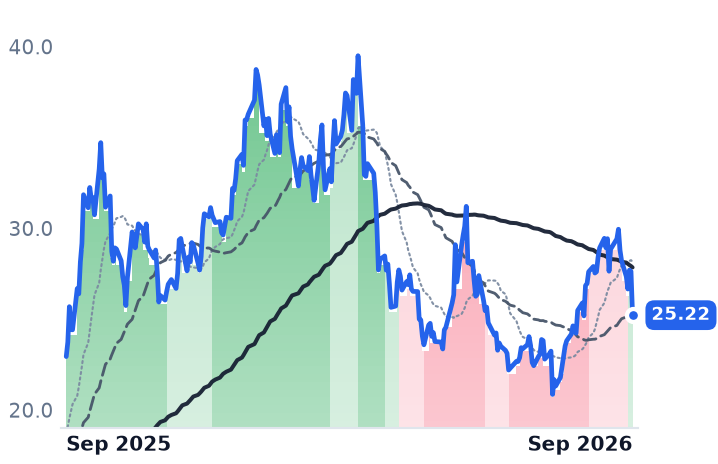
25.22
−2.41 (−8.72%)
vs. prior close
Price20d50d150d
BTU 12-month price
Thermal Coal Producers
CLF
Cleveland-Cliffs
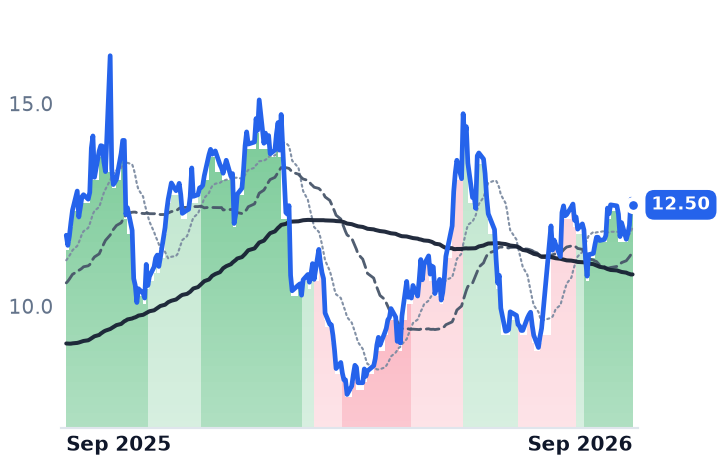
12.50
−0.14 (−1.11%)
vs. prior close
Price20d50d150d
CLF 12-month price
Flat-Rolled Steel
TickerMkt capP/EP/E fwdP/SP/S fwdP/GPP/GP fwdEV/EBITDAFCF yld
NUE$56.6B19.8x13.0x1.6x1.4x10.1x9.0x10.9x2.8%
BTU$3.5Bn/m0.9x0.8x39.6x37.1x11.8x13.0%
CLF$5.9Bn/m0.3x0.3x101.5x-17.0%

Consensus projections

TickerFY2026EFY2027EFY2028E
HCCRevenue+54.0%+9.9%+4.9%
EPS+524.3%+30.3%+13.3%
AMRRevenue−0.5%+21.6%+5.0%
EPS−22.7%−527.2%+35.4%
METCRevenue+2.9%+21.3%+25.3%
EPS−3.8%−94.7%−1238.4%
NUERevenue+23.9%+1.9%+0.0%
EPS+140.4%+2.7%−4.8%
BTURevenue+11.1%+8.3%−0.7%
EPS−59.9%−1581.4%+3.9%
CLFRevenue+9.2%+2.3%+0.6%
EPS−78.7%−155.5%+40.0%

Forward fiscal years only. Blank means no analyst coverage for that year.

Warrior Met Coal sold a record 3.7m short tons of steelmaking coal in the June quarter, its fourth consecutive quarterly record, and dug each one out of the ground for less than it spent a year earlier. The Alabama longwall miner, which ships premium low-volatility coal to blast-furnace steelmakers in Europe, South America and Asia, reported an average net selling price of $137.82 per short ton against a cash cost of $92.53 delivered to port — roughly $45 of margin on every ton, where a year earlier the same two lines left barely $29.

Since the end of August, Warrior's shares have fallen about 19%, to $87.93 and a market value of $4.64bn. Over the same stretch the Australian hard coking coal benchmark did essentially nothing: it held near $271 a ton on September 17, within a hair of the level it reached during an August spike driven by safety inspections at Chinese mines. Coking coal is sold at an index price and earned as a netback after rail freight and port charges, against a cash cost that is mostly fixed. Volume and position on the cost curve set the margin. That is why the three American producers filed under one heading now look nothing alike.

The mine that is already paid for

Warrior's revenue has accelerated for four straight quarters, reaching $509.7m in the June quarter with gross margin of 31.9% against 7.0% a year before. Net income was $87.4m against $5.6m. The reason is Blue Creek: the company had spent $1,022.9m on the growth mine through March against a budget of $995m to $1.075bn, and its longwall started in October 2025, eight months early, with nameplate capacity lifted 25%. "The second quarter marked a key inflection point as we clearly realized the incremental earnings and cash flow contributions of Blue Creek," chief executive Walter Scheller told investors on August 5. Metallurgical coal also became eligible in 2026 for a federal critical-minerals tax credit worth 2.5% of production costs, which Warrior cited in its cost decline. Consensus has 2026 earnings of $6.30 a share against $1.08 last year; the stock trades at 14.0 times that, versus 21.1 times trailing.

The one the market read correctly

Alpha Metallurgical Resources, which runs nineteen mines across Virginia and West Virginia, shipped 3.5m tons and earned $25.6m. Revenue fell 10.4% to $492.9m and operating margin was minus 2.1%, a fourth straight quarter of operating losses. Realised met pricing slipped to $118.71 a ton against cost guidance raised roughly $7 to $103–107 — twelve to sixteen dollars of margin where Warrior has forty-five. Alpha cut full-year volumes by about 1m tons after an 80-mph storm in June wrecked one of two stacker reclaimers at its Atlantic export terminal. "Everyone knew there was going to be High-Vol supply coming on. But at the same time, everybody expected the steel market globally to be stronger than it is today," chief commercial officer Daniel Horn said on the August 7 call. "We need our customers to produce more steel, frankly." The buyback that once absorbed $1.2bn at an average $166.18 a share spent $13.5m last quarter. At $174.22 the shares carry 1.48 times book and 17.6 times trailing EV/EBITDA — higher than Warrior's 10.1 times on a sixth of the cash earnings.

Ramaco is not in this argument

Ramaco Resources realised $116 a ton against a $99 cash cost for $5.7m of coal EBITDA. Its $496m Class A market value stands against roughly $23m of annualised coal earnings; the remainder is Brook Mine, a Wyoming rare-earth project whose Hatch assessment put capital spending at $3.2bn plus $0.8bn of contingency with first production in 2031. The shares are down 70% over twelve months and fell hardest on September 3, when Ramaco disclosed that Yorktown Energy Partners would distribute about a million shares to its partners. No steelmaker is on either side of that trade.

What the business earns and what it does not

Alpha's de-rating is paid for by its own income statement, and Ramaco's by a 2031 start date. Warrior's is not: cost per ton down, tons up, capital spent, guidance being met. The likelier reading is that the shares are being marked back to where the index sat before August rather than to anything mined in Alabama — the whole complex sold off together on September 18, Peabody and Nucor included. Note who won the year: Nucor, an electric-arc-furnace steelmaker that buys no coking coal at all, is up 85% over twelve months while Alpha, which feeds its blast-furnace competitors, is up 6%. The tariff protection landed on the steel, not on the coal beneath it. China's coke exports rose 14.4% in the first half, displacing seaborne demand at the margin, while India's imports climbed 32% to 73.53m tonnes — a tug-of-war neither producer controls.

What Warrior does control, it has already done. Ninety percent of Blue Creek's expected 2026 volume is under contract. The tons are sold; what remains unsettled is what anyone will pay for the company that mines them.

Akamai Halted Its Buyback to Fund Servers After Repurchasing $410m at $134.54 a Share

Hypothesis Opus 5 · Research Opus 5 · Writing Opus 5 · Prompt v1.6

Akamai's gross profit shrank last quarter while its revenue grew — the combination that tells you a company is buying its next business with the margin of its old one. June-quarter revenue rose 5.4%, gross profit fell 0.5%, and operating income fell 47%. Capital spending hit 32% of revenue and is guided to roughly 40% for the year, funded by $3.45bn of new convertible notes and by stopping the repurchase program.

The shares have fallen in weekly steps since May and now trade below where they sat before the $1.8bn Anthropic compute contract was disclosed. Fastly, the other content-delivery company paid per gigabyte, rose over the same three months, and Cloudflare — the same physical network, billed per contract — made a record high. This de-rating belongs to Akamai's own income statement rather than to delivery economics as a class.

AKAMNETDDOGFSLYFFIVDOCNATENCDN Pricing PressureAI Inference CapacityEdge Security PlatformsCapex IntensityConvertible Note Financing
TickerCompanySegmentTrend · 13mo30D1Y
The subject · what this brief is about
AKAMAkamai TechnologiesNetwork & Application Delivery⚠️ Emerging Bear−5.3%+36.3%
NETCloudflareNetwork & Application Delivery🟢 Cont. Bull+10.4%+41.8%
Compared against · context, not the story
DDOGDatadogData & Analytics Platforms🟢 Cont. Bull−2.4%+66.2%
FSLYFastlyCloud Infrastructure & Platform🟢 Cont. Bull−4.4%+172.4%
FFIVF5Network & Application Delivery🟢 Cont. Bull+12.3%+30.8%
DOCNDigitalOceanCloud Infrastructure & Platforms🟢 Cont. Bull+12.5%+245.1%
ATENA10 NetworksNetwork & Application Delivery🟢 Cont. Bull+0.1%+43.9%

12-month price & trend

AKAM
Akamai Technologies
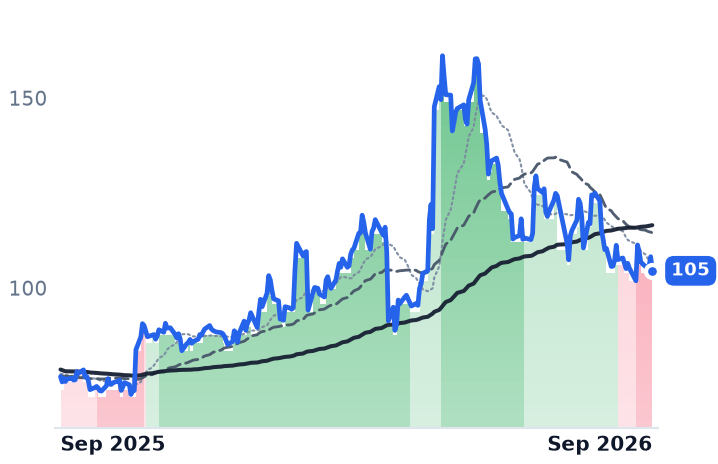
105
−3.72 (−3.43%)
vs. prior close
Price20d50d150d
AKAM 12-month price
Network & Application Delivery
NET
Cloudflare
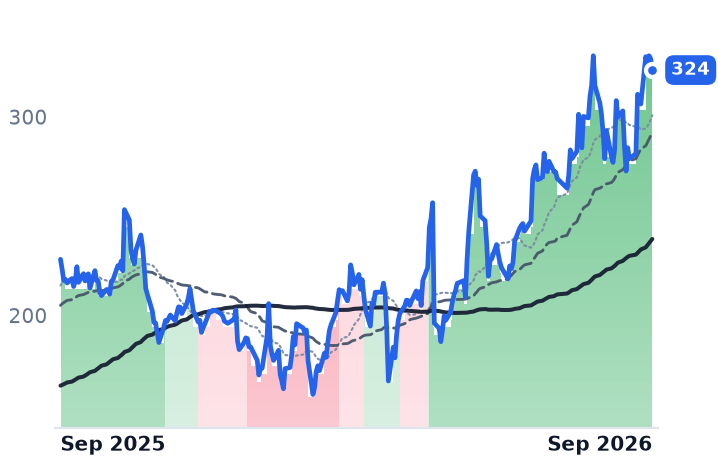
324
−5.76 (−1.75%)
vs. prior close
Price20d50d150d
NET 12-month price
Network & Application Delivery
DDOG
Datadog
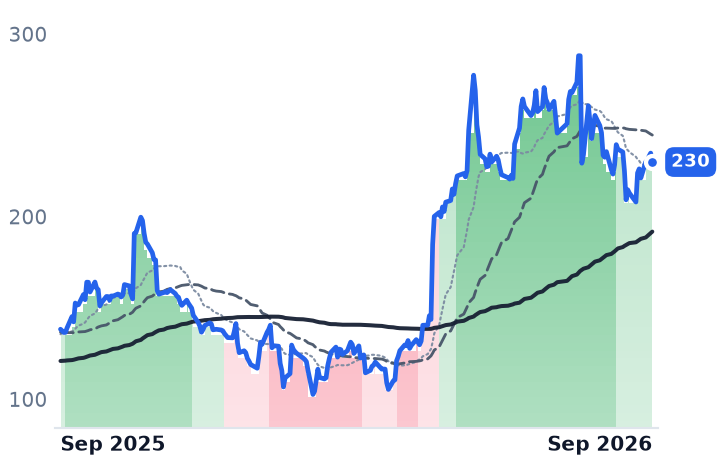
230
−4.90 (−2.09%)
vs. prior close
Price20d50d150d
DDOG 12-month price
Data & Analytics Platforms
TickerMkt capP/EP/E fwdP/SP/S fwdP/GPP/GP fwdEV/EBITDAFCF yld
AKAM$15.2B36.8x15.6x3.5x3.4x6.2x6.0x17.9x4.1%
NET$115.0Bn/m256.8x45.8x40.1x63.1x55.2x0.3%
DDOG$78.7B444.9x87.4x19.9x17.6x25.0x22.1x302.3x1.5%
FSLY
Fastly
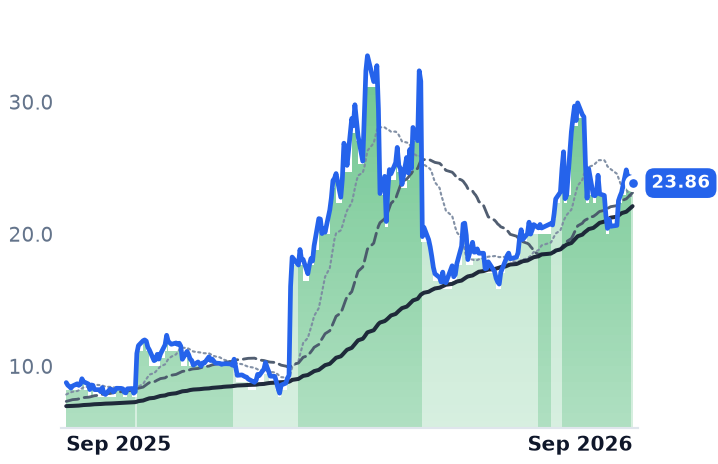
23.86
−0.46 (−1.88%)
vs. prior close
Price20d50d150d
FSLY 12-month price
Cloud Infrastructure & Platform
FFIV
F5
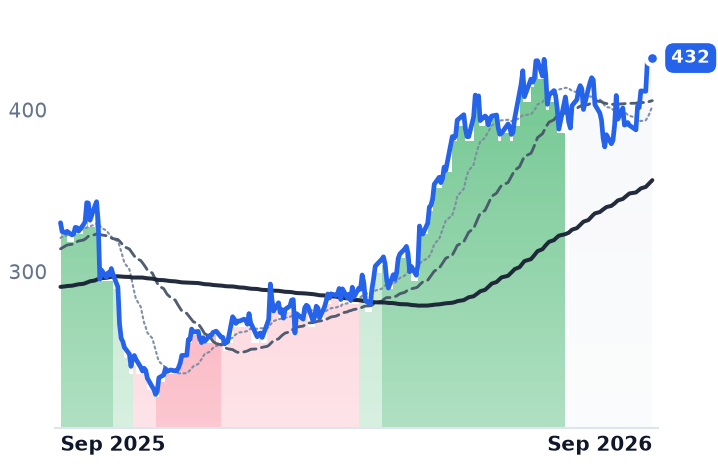
432
−1.44 (−0.33%)
vs. prior close
Price20d50d150d
FFIV 12-month price
Network & Application Delivery
DOCN
DigitalOcean
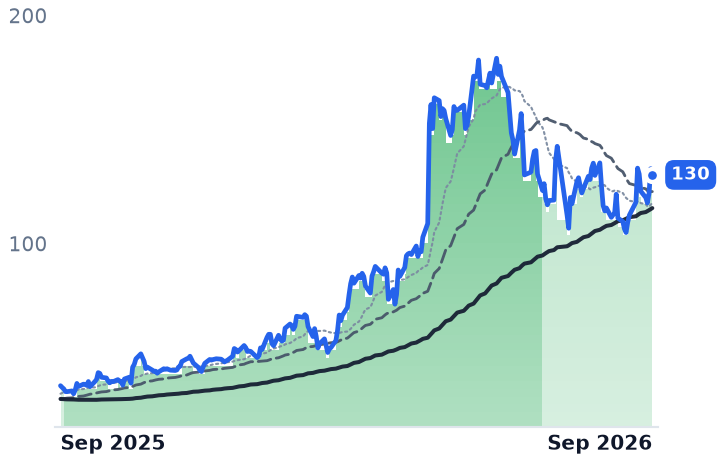
130
−2.73 (−2.05%)
vs. prior close
Price20d50d150d
DOCN 12-month price
Cloud Infrastructure & Platforms
TickerMkt capP/EP/E fwdP/SP/S fwdP/GPP/GP fwdEV/EBITDAFCF yld
FSLY$3.6Bn/m43.9x5.2x4.9x8.5x7.9xn/m1.2%
FFIV$21.7B30.3x22.2x6.6x6.4x8.0x7.8x21.1x4.5%
DOCN$13.0B44.1x76.5x12.9x11.1x22.5x19.3x36.7x0.1%
ATEN
A10 Networks
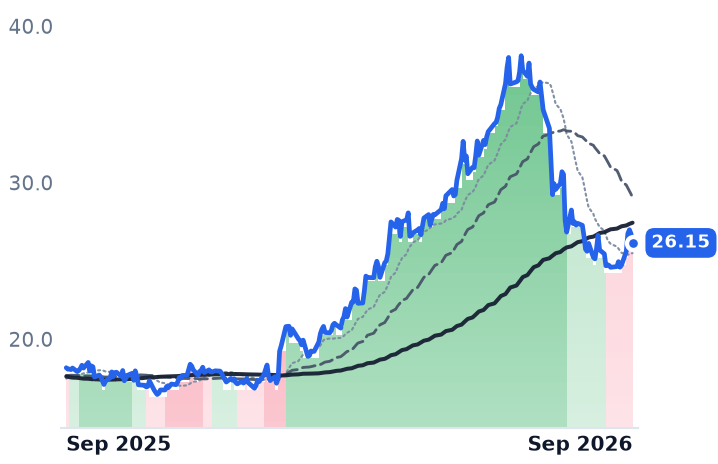
26.15
−0.58 (−2.18%)
vs. prior close
Price20d50d150d
ATEN 12-month price
Network & Application Delivery
TickerMkt capP/EP/E fwdP/SP/S fwdP/GPP/GP fwdEV/EBITDAFCF yld
ATEN$1.9B43.5x25.1x6.1x5.7x7.6x7.2x30.1x3.2%

Consensus projections

TickerFY2026EFY2027EFY2028E
AKAMRevenue+7.2%+13.0%+11.2%
EPS−4.6%+6.4%+13.9%
NETRevenue+33.7%+28.4%+27.1%
EPS+38.1%+32.6%+35.1%
DDOGRevenue+31.8%+22.4%+22.8%
EPS+25.4%+17.0%+22.1%
FSLYRevenue+20.9%+12.0%+11.2%
EPS+897.9%+11.2%+17.0%
FFIVRevenue+10.1%+7.4%+7.5%
EPS+12.6%+4.0%+11.7%
DOCNRevenue+31.2%+53.5%+43.7%
EPS−29.0%+23.2%+60.4%
ATENRevenue+14.4%+11.7%+12.1%
EPS+18.5%+14.2%+15.1%

Forward fiscal years only. Blank means no analyst coverage for that year.

Akamai Technologies, which delivers and secures web traffic from servers embedded inside internet providers' networks in more than 130 countries, stopped buying back its own stock this summer. It had already spent $616m on repurchases during 2026, including $410m in the June quarter at an average price of $134.54. The shares closed at $104.52 on 18 September. The cash is going into servers and graphics processors instead.

The trade is legible in a single line of the income statement. June-quarter revenue grew 5.4% to $1.1bn; gross profit fell 0.5% to $613.8m, pulling gross margin down more than three points to 55.8%. Operating income fell 47%. Akamai is spending down a delivery annuity built over two decades to buy a compute business whose revenue is dated to 2027, and the equity has to carry the interval.

Three meters, one network

Security — bot and application defense, microsegmentation, application programming interface protection — brought in $604m in the quarter, up 10%, and now accounts for 55% of revenue at a $2.4bn annualized rate. Delivery and other cloud applications fell 6% to $396m, and the company's own quarterly filing gives the reason without euphemism: the decline was "driven by a decrease in delivery revenue due to downward pricing of contract renewals". Cloud Infrastructure Services, the rented-compute line, grew 39% to $99m against a management target of at least 50% growth this year.

The replacement costs money before it earns any. Capital expenditure reached $347m in the June quarter, 32% of revenue against 21% a year earlier, with full-year capex guided near 40% of revenue plus $500m for graphics-processor replenishment, most of it landing in early 2027. Management says that capacity is sold out. The funding came from $3.45bn of zero-coupon convertible notes, taking convertible debt to roughly $7.6bn and lifting the diluted share count to 153.7m as the stock crossed conversion prices. "Akamai continues to build momentum and gain wide industry recognition as a key infrastructure provider for the AI-driven economy," chief executive Tom Leighton told investors on 6 August.

What did not move

The fall arrived without a gap: weekly steps down from a $161.14 close on 13 May to $104.52, a 35% decline that leaves Akamai up 35.6% over twelve months and therefore absent from every list of big movers. The price trend turned fully negative on 8 September and stayed there through 18 September.

The obvious explanations fail. Fastly, the other content-delivery firm paid per gigabyte delivered, rose 33.3% over the three months Akamai fell 16.3%; F5 rose 12.1%. On 14 September, when an Anthropic essay on artificial-intelligence safety lifted listed security names and Cloudflare rose 7.8%, Akamai — which books more than half its revenue in security — fell 1.1%. Nor does the rate backdrop work: the Federal Reserve's first hike in three years landed on 16 September, and the same week the company with no trailing earnings made an all-time high.

That company is Cloudflare, which runs a comparable global network from 335-plus cities and sells security, Zero Trust access and Workers compute on per-contract subscriptions rather than per gigabyte. Its June-quarter revenue grew 35.9%, a fourth straight quarter of acceleration; dollar-based net retention rose to 120% from 114%; customers spending above $100,000 a year reached 4,698, up 27%. Network capital spending ran at 7% of revenue against a 14-15% guide. Chief executive Matthew Prince has been explicit about declining Akamai's bargain: "If you're selling what is just commodity compute, if you're basically letting an AI company use your balance sheet and your credit rating in order to buy servers that are the same as everybody else's servers, then that's just not attractive business for us." Cloudflare trades at 63.1x trailing gross profit, up from roughly 60x three weeks earlier; Akamai trades at 6.2x, down from 7.1x in late August on gross profit that is itself contracting.

Billing by consumption is no protection either. Datadog, which meters infrastructure and application monitoring by data volume, grew 35.6% and still lost a fifth of its value in one session on 6 August after disclosing that its largest artificial-intelligence customer had renewed at reduced usage. It sits at 25x gross profit, between the two. All three grew gross profit more slowly than revenue.

The verdict

Most of Akamai's decline is earned. Shrinking gross profit, halved operating income, a suspended buyback, a rising share count and a capex line approaching two-fifths of revenue are not a sentiment problem, and the market has repriced them correctly. What nothing in the second quarter explains is the last leg: the shares sit 14.3% below their close the day before the seven-year, $1.8bn Anthropic contract was disclosed, so the entire deal re-rating and more has been given back, while consensus still carries 13% revenue growth for 2027 and the stock's 15.6x forward earnings rests on a per-share estimate that is down 4.6% year on year against a trailing multiple of 36.8x. The disagreement is not about June; it is about whether signed commitments convert.

The first Anthropic revenue is guided to begin in the December quarter at $20-25m. Delivery revenue fell by roughly that much, year on year, in the June quarter alone.

Brookfield Renewable's 5.26% Payout Slipped Below the 30-Year Treasury's 5.33%

Hypothesis Opus 5 · Research Opus 5 · Writing Opus 5 · Prompt v1.6

Two renewable yield vehicles broke down this quarter and neither break came from the power plants. Brookfield Renewable posted record second-quarter funds from operations of $0.62 per unit, up 11%, with hydro running above long-term average; Clearway Energy grew June-quarter revenue 22.7% and operating income 36.5%, and reaffirmed a 2027 target of $2.70 or better in cash available for distribution.

What moved was the discount rate. After the Federal Reserve's September 16 quarter-point hike, the 30-year Treasury reached 5.33%, erasing Brookfield's income advantage entirely. Clearway's payout still clears the long bond by roughly eight-tenths of a point, and its damage shows up in financing instead: about $50m raised against an equity plan of $0.5-1.0bn.

A third move is not repricing at all — Brookfield's corporate twin is converging on a one-for-one merger ratio ahead of October 14 votes.

BEPBEPCCWENENLTRNWXIFRRenewable YieldcosContracted Power Cash FlowsLong-Bond Discount RatesHydro & Wind FleetsEquity Funding CostsCorporate Structure Simplification
TickerCompanySegmentTrend · 13mo30D1Y
The subject · what this brief is about
BEPBrookfield Renewable PartnersDiversified Renewable Generators⚠️ Emerging Bear−9.0%+19.0%
BEPCBrookfield RenewableDiversified Renewable Generators⚠️ Emerging Bear−10.0%−10.8%
CWENClearway EnergyWind & Solar Developers⚠️ Emerging Bear−5.3%+10.8%
Compared against · context, not the story
ENLTEnlight Renewable EnergyWind & Solar Developers🟢 Cont. Bull−6.2%+159.7%
RNWReNew Energy GlobalWind & Solar Developers🌱 Emerging Bull+0.4%−12.8%
XIFRXPLR InfrastructureRenewable & Infrastructure Assets🟢 Cont. Bull−1.9%+12.0%

12-month price & trend

BEP
Brookfield Renewable Partners
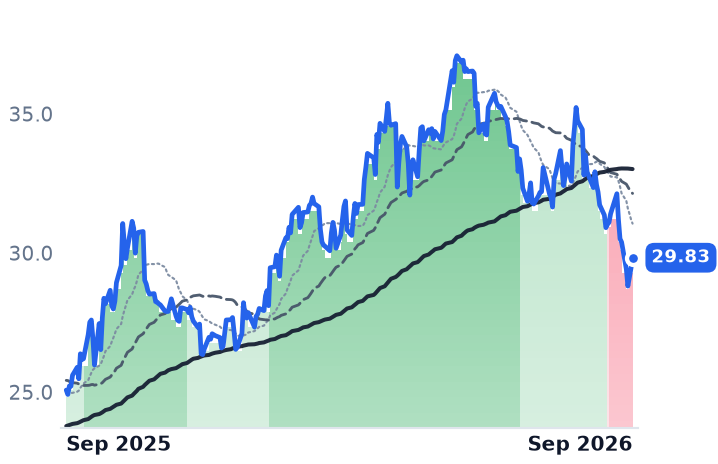
29.83
+0.38 (+1.29%)
vs. prior close
Price20d50d150d
BEP 12-month price
Diversified Renewable Generators
BEPC
Brookfield Renewable
29.93
+0.21 (+0.69%)
vs. prior close
Price20d50d150d
BEPC 12-month price
Diversified Renewable Generators
CWEN
Clearway Energy
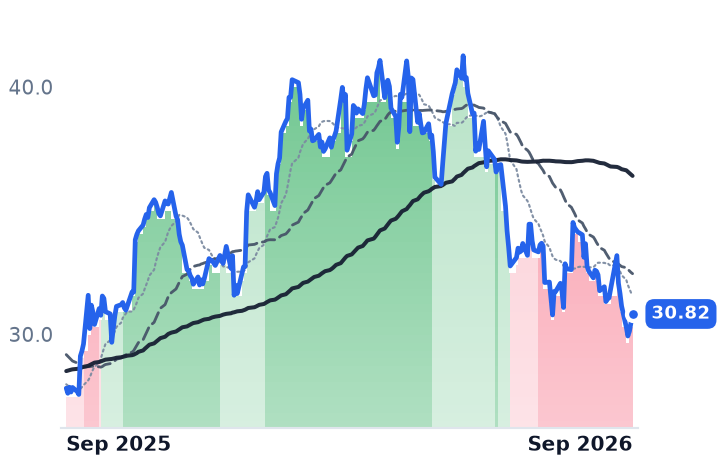
30.82
+0.36 (+1.18%)
vs. prior close
Price20d50d150d
CWEN 12-month price
Wind & Solar Developers
TickerMkt capP/EP/E fwdP/SP/S fwdP/GPP/GP fwdEV/EBITDAFCF yld
BEP$9.1B64.8x1.4x1.4x5.9x5.6x9.7x-51.7%
BEPC$4.4Bn/m1.1x0.7x2.3x1.6xn/m-12.5%
CWEN$6.3B40.6x4.0x3.8x7.6x7.3x14.3x10.6%
ENLT
Enlight Renewable Energy
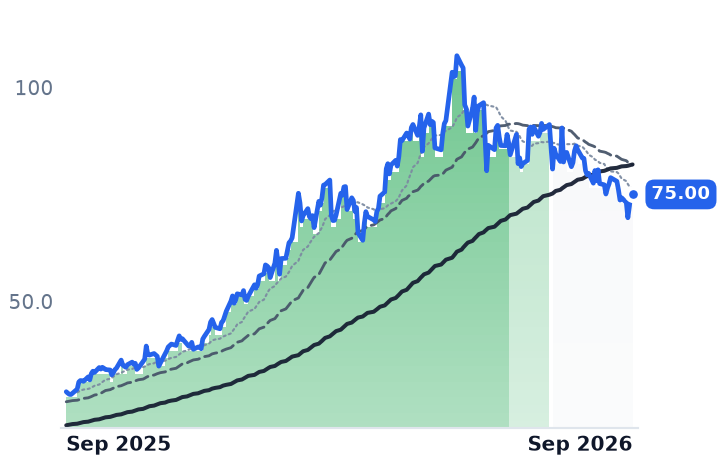
75.00
−0.75 (−0.99%)
vs. prior close
Price20d50d150d
ENLT 12-month price
Wind & Solar Developers
RNW
ReNew Energy Global
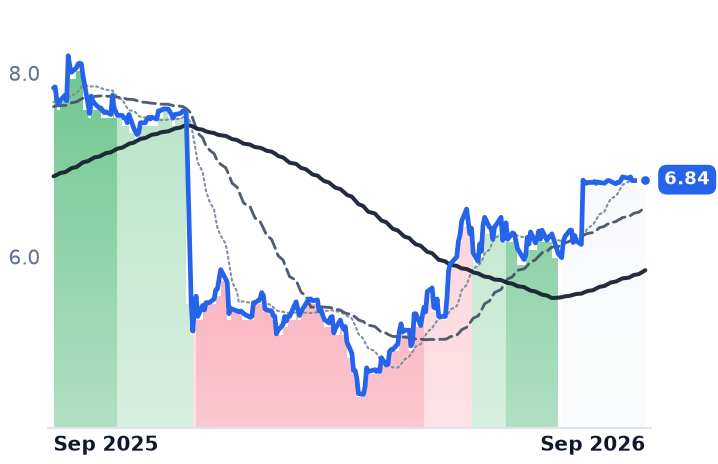
6.84
−0.01 (−0.15%)
vs. prior close
Price20d50d150d
RNW 12-month price
Wind & Solar Developers
XIFR
XPLR Infrastructure
10.94
−0.21 (−1.88%)
vs. prior close
Price20d50d150d
XIFR 12-month price
Renewable & Infrastructure Assets
TickerMkt capP/EP/E fwdP/SP/S fwdP/GPP/GP fwdEV/EBITDAFCF yld
ENLT$11.3B119.0x63.0x19.3x4.7x34.6x8.4x32.4x-19.8%
RNW$2.5B20.9x1.7x2.8x9.3x-23.2%
XIFR$1.1B17.0x10.0x0.9x0.8x5.2x4.6x8.9x-59.0%

Consensus projections

TickerFY2026EFY2027EFY2028E
BEPRevenue+3.9%+7.6%−11.5%
EPS+5.7%−20.9%−6.6%
BEPCRevenue+4.6%+16.3%+5.7%
EPS+280.9%−93.3%+455.5%
CWENRevenue+14.5%+11.5%+12.2%
EPS−116.0%−318.9%+60.4%
ENLTRevenue+32.0%+45.9%+52.5%
EPS−53.4%+116.3%−100.0%
RNWRevenue+42.1%+13.9%+21.0%
EPS+1367.7%+78.6%+150.0%
XIFRRevenue+0.8%+4.7%+1.3%
EPS−849.6%−44.0%−144.3%

Forward fiscal years only. Blank means no analyst coverage for that year.

A yield vehicle is a spread over the long bond, and Brookfield Renewable's spread has closed. The partnership declared a quarterly distribution of $0.392 per unit, an annualized $1.57 and more than 5% above the prior year. Against the September 18 close of $29.83 that is a 5.26% yield. The 30-year Treasury paid 5.33% the same day.

That arithmetic governs a whole class of securities. Brookfield Renewable owns hydroelectric, wind, solar and pumped-storage plants across North America, Colombia and Brazil and sells their output under contracts averaging more than a decade. Clearway Energy, spun out of NRG in 2018, owns roughly 5,000 net megawatts of American wind and solar plus about 2,500 megawatts of gas-fired generation. Both are bought for contracted cash, and both fund growth partly with equity issued at whatever price the market sets. When the long bond moves, the price moves before the meter does — and here the meters ran the other way.

The accounts went up

Brookfield's fourteen-month uptrend broke in the first days of September, its 50-day average falling through its 200-day; the units are down 9.1% over thirty days and still up 16.4% over twelve. The break followed the Federal Open Market Committee's September 16 quarter-point increase to 3¾-4%, its first hike in three years, with utilities falling more than 5% as long-dated yields surged.

The operating record points the opposite way. Brookfield reported record second-quarter funds from operations of $421m, or $0.62 per unit, up 11% per unit on July 31. Hydro contributed $336m, with the US and Colombian fleets running above long-term average. "We delivered record financial results, robust capital deployment, and the highest levels of development and asset recycling in our history," chief executive Connor Teskey said. Asset sales agreed or closed in the quarter carried about $2.2bn of proceeds, $630m net to Brookfield.

Two caveats travel with that record. Roughly $175m of the $421m was gains on developed assets and non-core disposals — two-fifths of the quarter, and not repeatable by definition. And reported revenue fell 1.8% to $1.66bn, a second consecutive quarterly decline.

One fall that is only arithmetic

Brookfield Renewable Corporation, the corporate twin holding roughly 12,723 megawatts of the same fleet, is down 20.0% in three months. That is not a de-rating. On July 21 Brookfield announced it would fold partnership and corporation into a single listed company, exchanging units and shares one-for-one, with special meetings on October 14. The corporation's premium over the partnership has gone from 41.1% last December to 0.3% on September 18. Brookfield's ownership, the preferred units and the management fee arrangements are unchanged: no cash flows differently for anyone.

Clearway's damage is in the funding

Clearway grew June-quarter revenue 22.7% to $481m, the third straight quarter of acceleration, with operating income up 36.5%. It also cut 2026 cash available for distribution guidance to $430-470m from $470-510m and reaffirmed a 2027 target of $2.70 per share or better. "In the near term, our 2026 outlook has been impacted by transitory weather patterns in the first half of the year," chief executive Craig Cornelius told investors on August 5. The shares had already rolled over on July 20, a fortnight before that cut.

In June Clearway recontracted all three Texas wind projects, more than 600 megawatts, out past 2040 at better pricing, against North American wind power contracts clearing at a record $79.40 per megawatt-hour. The strain is elsewhere: the $3bn plan through 2029 assumes $0.5-1.0bn of external equity, of which about $50m has been raised, and third-party project purchases have been deprioritized until the share price recovers. XPLR Infrastructure, the former NextEra Energy Partners, shows where that road ends — it suspended distributions outright rather than issue equity.

What the prices are saying

Brookfield is the cheaper security at 9.65 times trailing enterprise value to EBITDA against Clearway's 14.3 times, but its earnings are flattered by disposal gains while Clearway's are project-level contracted cash. Clearway trades at 0.68 times book — under the carrying value of a contracted fleet — and 11.4 times the 2027 cash target it just reaffirmed, on a 6.17% dividend that still clears the long bond by roughly eight-tenths of a point.

The verdict splits. Brookfield's slide is earned by the anchor that governs any income vehicle, and no amount of record recycling fixes a payout that pays less than a Treasury. Clearway's is not earned by its accounts, which accelerated; it is earned by the cost of the equity it must sell, which is a real cost and a real constraint on the $3bn plan. Meanwhile the tax regime tightens underneath both: production and investment credits terminate for wind and solar beginning construction after July 4, 2026 unless in service by the end of 2027, and the Treasury guidance narrowing eligibility was vacated by a federal court, leaving near-term pipelines legally unresolved.

The October 14 votes will give holders of both Brookfield securities one price for one fleet. What no vote settles is the question the long bond now puts to every contracted megawatt-hour: what a decade of indexed cash is worth when a Treasury pays more and carries no weather.

Planet Labs Grew Revenue 58% but Guided Down as Defense Buyers Await 2027 Funding

Hypothesis Opus 5 · Research Opus 5 · Writing Opus 5 · Prompt v1.6

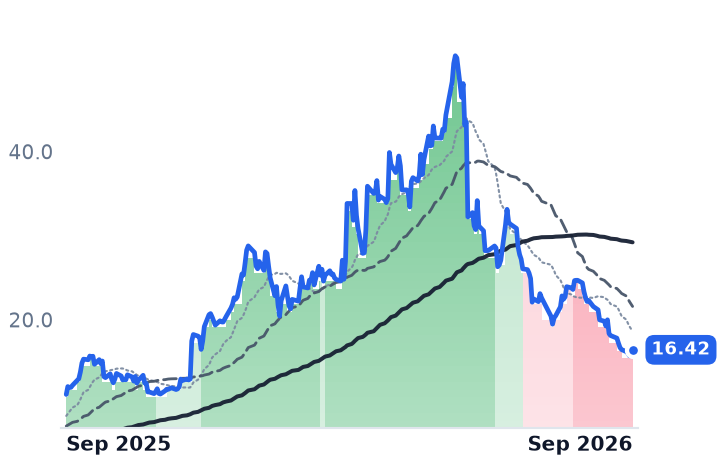
The fastest-growing company in commercial Earth imaging just had its worst month, and its own accounts do not explain it. Planet Labs' July-quarter revenue reached $116.1m and its operating loss narrowed to 11.6% of revenue from 24.5% a year earlier, yet the shares have fallen on eight of the nine sessions since the September 3 print and sit 68% below their May high.

What moved alongside them was not other imagery names but the defense complex: Lockheed Martin, RTX and L3Harris all fell between 9% and 12% over the same thirty sessions while the S&P 500 was flat. Traders are pricing the risk that fiscal 2027 appropriations slip past the November midterms — and BlackSky told investors in August that its US subscription revenue was flat while international grew 150%.

The demand break is not visible; the composition wobble is. Planet's backlog grew 11% to roughly $815m and next quarter is guided below this one.

PLBKSYSATLSPIRRKLBLUNRRDWASTSLMTNOCRTXLHXKTOSAVAVUFOARKXSPYEarth Observation ImageryGeospatial Intelligence ContractsDefense Appropriations RiskSmallsat Constellation BuildoutInternational Defense DemandSpace Sector De-Rating
TickerCompanySegmentTrend · 13mo30D1Y
The subject · what this brief is about
PLPlanet Labs PBCUnmanned Systems & ISR⚠️ Emerging Bear−26.3%+47.8%
BKSYBlackSky TechnologySpecialty Manufacturing & Components⚠️ Emerging Bear−21.9%+3.7%
SATLSatellogicSpecialty Manufacturing & Components⚠️ Emerging Bear−10.7%+40.4%
Compared against · context, not the story
SPIRSpire GlobalSpecialized Services⚠️ Emerging Bear−18.2%−0.1%
RKLBRocket Lab USAUnmanned Systems & ISR⚠️ Emerging Bear−11.0%+29.6%
LUNRIntuitive MachinesSpace Systems & Launch⚠️ Emerging Bear−24.0%+37.4%
RDWRedwireSpace Systems & Launch🔴 Cont. Bear−10.6%+32.4%
ASTSAST SpaceMobileSatellite & Broadband Services⚠️ Emerging Bear−14.8%+19.8%
LMTLockheed MartinLarge Diversified Primes⚠️ Emerging Bear−5.4%+12.5%
NOCNorthrop GrummanLarge Diversified Primes⚠️ Emerging Bear−4.3%−7.8%
RTXRTXLarge Diversified Primes⚠️ Emerging Bear−7.6%+22.6%
LHXL3Harris TechnologiesAvionics & Electronic Systems⚠️ Emerging Bear−7.3%−12.4%
KTOSKratos Defense & Security SolutionsMissiles, Weapons & Fire Control⚠️ Emerging Bear−17.0%−41.2%
AVAVAeroVironmentUnmanned Systems & ISR🔴 Cont. Bear−0.2%−44.5%
UFOProcure Space ETFAsset Management⚠️ Emerging Bear−5.9%+21.2%
ARKXARK Space & Defense Innovation ETFAsset Management⚠️ Emerging Bear−3.4%+14.8%
SPYState Street SPDR S&P 500 ETF TrustAsset Management🟢 Cont. Bull−0.5%+14.9%

12-month price & trend

PL
Planet Labs PBC
16.42
−0.32 (−1.92%)
vs. prior close
Price20d50d150d
PL 12-month price
Unmanned Systems & ISR
BKSY
BlackSky Technology
21.67
−1.15 (−5.04%)
vs. prior close
Price20d50d150d
BKSY 12-month price
Specialty Manufacturing & Components
SATL
Satellogic
5.11
−0.42 (−7.68%)
vs. prior close
Price20d50d150d
SATL 12-month price
Specialty Manufacturing & Components
TickerMkt capP/EP/E fwdP/SP/S fwdP/GPP/GP fwdEV/EBITDAFCF yld
PL$5.5Bn/m14.5x12.5x26.1x22.5xn/m0.4%
BKSY$886.8Mn/m8.1x6.3x20.1x15.5xn/m-7.9%
SATL$703.4Mn/m22.0x15.0x27.9x19.0xn/m-6.0%
SPIR
Spire Global
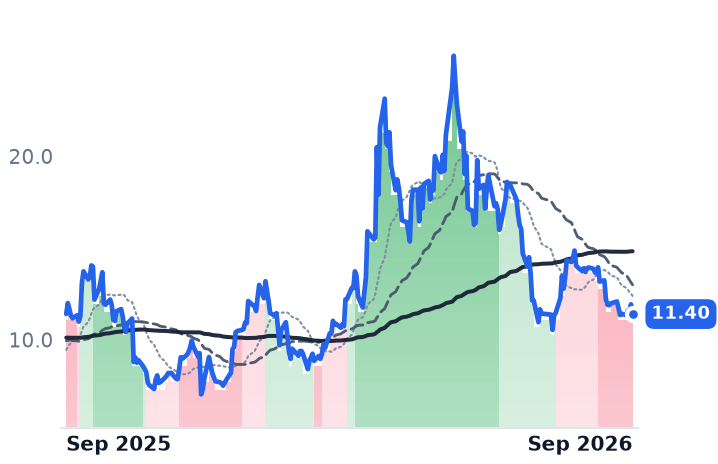
11.40
−0.53 (−4.44%)
vs. prior close
Price20d50d150d
SPIR 12-month price
Specialized Services
RKLB
Rocket Lab USA
64.57
−2.90 (−4.30%)
vs. prior close
Price20d50d150d
RKLB 12-month price
Unmanned Systems & ISR
LUNR
Intuitive Machines
13.92
−0.89 (−6.04%)
vs. prior close
Price20d50d150d
LUNR 12-month price
Space Systems & Launch
TickerMkt capP/EP/E fwdP/SP/S fwdP/GPP/GP fwdEV/EBITDAFCF yld
SPIR$367.0Mn/m5.9x4.6x15.6x12.2xn/m-29.6%
RKLB$72.2Bn/m106.3x79.7x290.7x218.0xn/m-0.4%
LUNR$2.3Bn/m4.7x2.5x17.1x9.1xn/m-8.3%
RDW
Redwire
10.74
−0.85 (−7.33%)
vs. prior close
Price20d50d150d
RDW 12-month price
Space Systems & Launch
ASTS
AST SpaceMobile
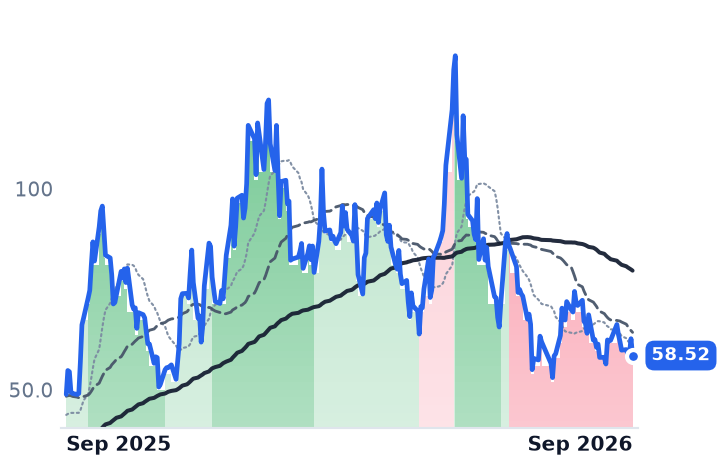
58.52
−4.19 (−6.68%)
vs. prior close
Price20d50d150d
ASTS 12-month price
Satellite & Broadband Services
LMT
Lockheed Martin
533
−7.96 (−1.47%)
vs. prior close
Price20d50d150d
LMT 12-month price
Large Diversified Primes
TickerMkt capP/EP/E fwdP/SP/S fwdP/GPP/GP fwdEV/EBITDAFCF yld
RDW$2.5Bn/m6.0x5.3x29.6x26.6xn/m-4.1%
ASTS$27.3Bn/m236.7x171.8xn/m-6.0%
LMT$119.0B24.8x17.2x1.6x1.5x16.1x15.3x17.0x4.8%
NOC
Northrop Grumman
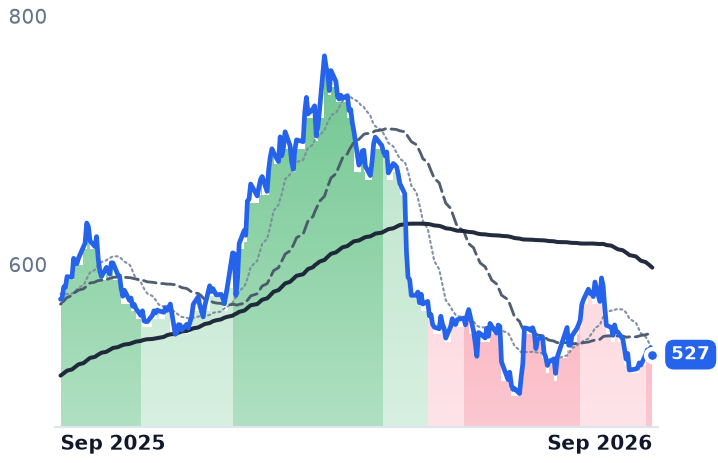
527
−5.63 (−1.06%)
vs. prior close
Price20d50d150d
NOC 12-month price
Large Diversified Primes
RTX
RTX
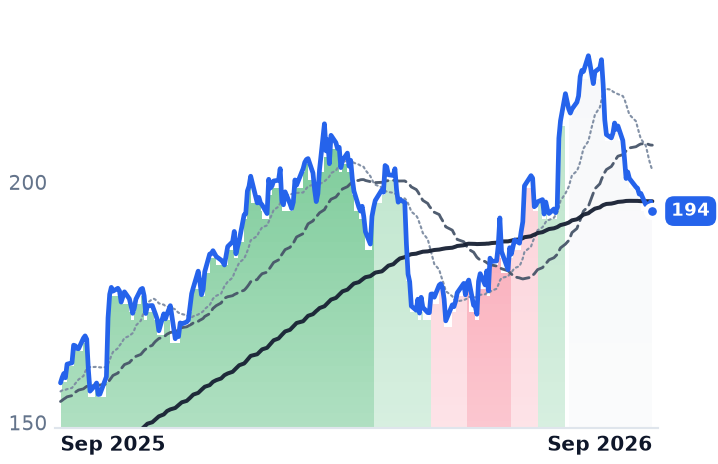
194
−1.96 (−1.00%)
vs. prior close
Price20d50d150d
RTX 12-month price
Large Diversified Primes
LHX
L3Harris Technologies
247
−4.39 (−1.74%)
vs. prior close
Price20d50d150d
LHX 12-month price
Avionics & Electronic Systems
TickerMkt capP/EP/E fwdP/SP/S fwdP/GPP/GP fwdEV/EBITDAFCF yld
NOC$76.8B16.8x19.3x1.8x1.7x8.8x8.5x12.2x4.3%
RTX$285.3B36.8x29.2x3.1x3.0x15.0x14.6x19.7x4.2%
LHX$51.6B27.8x23.2x2.3x2.2x8.8x8.6x16.5x5.4%
KTOS
Kratos Defense & Security Solutions
47.46
−1.42 (−2.90%)
vs. prior close
Price20d50d150d
KTOS 12-month price
Missiles, Weapons & Fire Control
AVAV
AeroVironment
160
−6.43 (−3.86%)
vs. prior close
Price20d50d150d
AVAV 12-month price
Unmanned Systems & ISR
UFO
Procure Space ETF
43.21
−0.56 (−1.28%)
vs. prior close
Price20d50d150d
UFO 12-month price
Asset Management
TickerMkt capP/EP/E fwdP/SP/S fwdP/GPP/GP fwdEV/EBITDAFCF yld
KTOS$9.8B302.5x62.0x6.4x5.5x29.1x24.8x71.8x-1.3%
AVAV$7.5Bn/m45.6x3.8x3.4x15.0x13.5xn/m-1.6%
UFO$177.4M
ARKX
ARK Space & Defense Innovation ETF
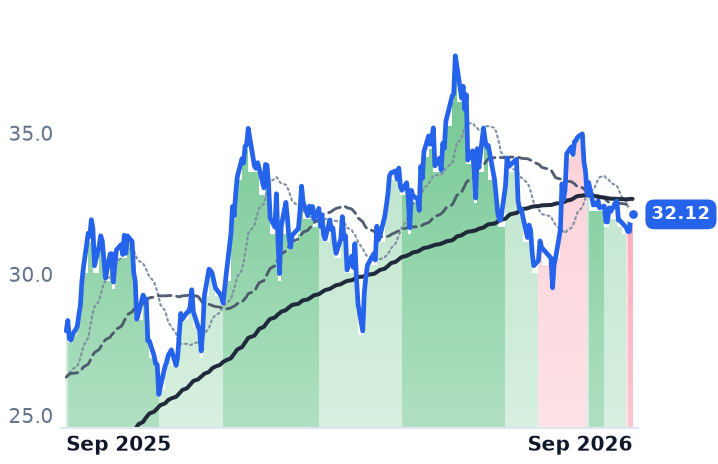
32.12
−0.19 (−0.59%)
vs. prior close
Price20d50d150d
ARKX 12-month price
Asset Management
SPY
State Street SPDR S&P 500 ETF Trust
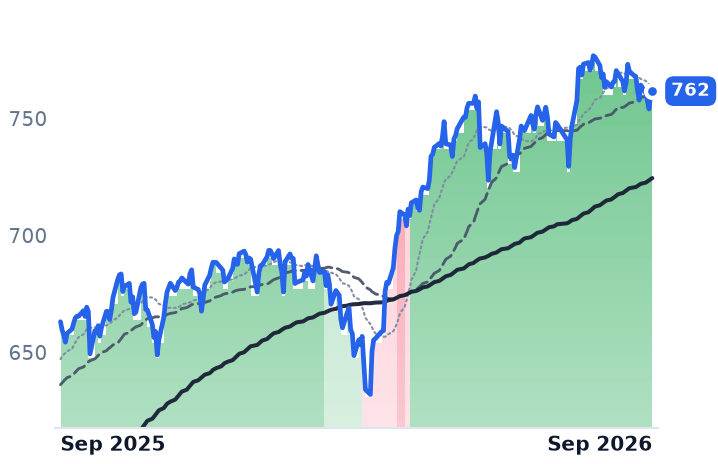
762
+1.49 (+0.20%)
vs. prior close
Price20d50d150d
SPY 12-month price
Asset Management
TickerMkt capP/EP/E fwdP/SP/S fwdP/GPP/GP fwdEV/EBITDAFCF yld
ARKX$543.3M
SPY$773.0B

Consensus projections

TickerFY2026EFY2027EFY2028E
PLRevenue+21.9%+46.7%+30.2%
EPS−55.9%−40.8%−129.2%
BKSYRevenue+30.1%+36.6%+32.8%
EPS−33.0%−69.4%−156.1%
SATLRevenue+206.4%+35.8%+48.3%
EPS+207.0%−96.5%−257.1%
SPIRRevenue+12.4%+24.6%
EPS−48.5%−61.6%
RKLBRevenue+51.0%+39.0%+27.0%
EPS−41.8%−100.1%+68844.3%
LUNRRevenue+322.6%+23.3%+21.2%
EPS+69.3%−67.8%−152.9%
RDWRevenue+44.6%+18.7%+21.2%
EPS−55.6%−52.4%−57.9%
ASTSRevenue+172.1%+330.7%+167.9%
EPS+37.1%−48.4%−180.2%
LMTRevenue+6.1%+5.4%+5.5%
EPS+38.4%+7.1%+6.2%
NOCRevenue+5.1%+6.7%+6.1%
EPS+7.2%+7.9%+8.6%
RTXRevenue+10.5%+7.4%+7.2%
EPS+16.7%+9.1%+10.9%
LHXRevenue+3.2%+7.3%+7.0%
EPS−18.5%+12.2%+13.9%
KTOSRevenue+34.7%+23.3%+21.7%
EPS+57.7%+34.4%+28.7%
AVAVRevenue+140.3%+15.9%+15.0%
EPS−5.6%+13.3%+37.2%

Forward fiscal years only. Blank means no analyst coverage for that year.

Planet Labs reported the fastest revenue growth of its public life on September 3, and its shares closed that session lower, then fell on eight of the nine sessions that followed. Nothing the company disclosed in those two weeks was bad. What changed was who is expected to sign the checks.

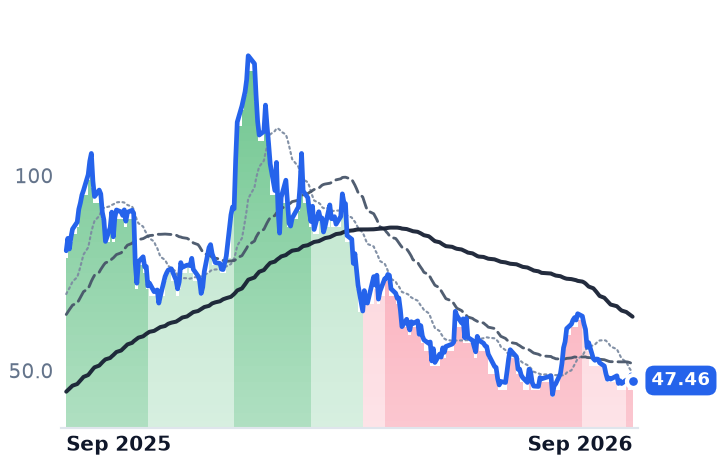
Over the thirty sessions to September 18, Planet — which operates the largest commercial Earth-imaging constellation and sells daily global coverage on subscription — fell 27.4%, and BlackSky, which sells tasked high-resolution imagery and analytics to government intelligence customers, fell 22.3%. The S&P 500 was flat. But so was almost nothing else in defense: Lockheed Martin and Northrop Grumman each fell 9.5%, RTX 12.0%, L3Harris 10.8%, Kratos 21.6%. Bloomberg reported on September 17 that traders are positioning for protracted negotiations and funding delays should Democrats take one or both houses in November, with the S&P Composite 1500 Aerospace & Defense index down 13% since February 27 against a near-10% gain in the broad market. Without a finalized appropriations bill, signed agreements cannot be fully funded — and Planet and BlackSky both hold ten-year National Reconnaissance Office imagery contracts structured as five-year bases plus one-year options running to 2032. Option years are exactly the line item a budget delay touches first.

What Planet's quarter actually said

Revenue growth has accelerated for four straight quarters, from 32.6% to 58.1%, producing a record $116.1m. The net loss shrank to $9.4m from $22.6m and the company posted its first adjusted profit, then raised fiscal 2027 guidance to $430m-$441m and capital spending to $100m-$115m for Pelican satellites and manufacturing.

The soft spot is composition. Roughly $30m of the quarter was a Swedish Armed Forces satellite handed over a quarter early — point-in-time revenue hit 12% of the total against 1% a year earlier — while remaining performance obligations grew about 9% and estimated backlog about 11%, to roughly $815m. Management guided the October quarter down sequentially to $101m-$105m, about 27% year-on-year growth. Demand for the data itself is not the issue: "No one has a sufficient number of Earth imaging satellites in the right kind of plane and all that to do a daily scan," chief executive Will Marshall told investors on September 3. "We're the only game in town."

BlackSky supplied the tell

BlackSky's June quarter grew 50% to $33.3m with adjusted EBITDA of $4.7m, and its subscription business crossed a $100m annualized run rate. Its deployment is on schedule — a fifth Gen-3 satellite reached first light in under 20 hours after launch on September 11, against a target of eight on orbit by year-end — and awards are being won, including a $99m Air Force Research Laboratory contract. What management said on August 6 matters more: international subscription revenue grew 150% and now exceeds 80% of funded backlog, US subscriptions were flat, and while fiscal 2026 government funding is visible, the fiscal 2027 outlook is not.

The part the decline has already priced

Gross margins differ too widely across these names for sales multiples to compare Planet with peers, so Planet is measured on gross profit: 26x trailing and roughly 23x forward, against 70x on May 3, while trailing gross profit grew about 21%. That is a 63% de-rating in four and a half months — but from a peak, and 26x gross profit is not cheap. BlackSky's reported June-quarter cost of revenue does not reconcile with its own description of expanded margins, so sales is the usable measure there: 8.1x trailing and 6.3x forward, against 10.9x in May.

Dilution is the other half. Planet's 26% single-day fall on June 5 was the day it filed a $1.5bn at-the-market shelf — around 27% of today's $5.47bn market value in authorized issuance, on top of a diluted share count already up 18.2% year on year. Some of that was drawn at $31.96, roughly double the current price. BlackSky raised $150m the same way and issued 21.5% more shares. With $865m of cash at Planet and above $325m of liquidity at BlackSky, the question is ownership, not survival.

So the honest split: the guide-down and the 11% backlog growth earn part of Planet's fall, and the shelf earns the June gap. Nothing in either company's accounts earns the September grind, which tracked the primes almost session for session. Satellogic, which sells whole satellites rather than subscriptions, fell only 7.6% over the same stretch — the drawdown followed the government customer, not the orbital camera.

Planet's answer to the budget question has so far been to sell somewhere else: European defense work drove the record quarter, and Swedish and German contracts carried the growth that American subscriptions did not. The next print will show whether that is a hedge or the same trade denominated in euros.

Falling Insurance Rates Lifted Travelers' Operating Profit 53.1% and Cut Aon's Margin

Hypothesis Opus 5 · Research Opus 5 · Writing Opus 5 · Prompt v1.6

One price cycle is producing two opposite income statements, and the market is paying more for the side whose revenue is shrinking. Commercial insurance rates have now fallen for eight consecutive quarters — global rates down 6% in the June quarter, property off 12%.

That reaches a broker directly, because its commission is a share of the premium, and reaches an underwriter only through the top line, where mild losses and investment income have more than covered it. Aon's revenue grew 2.2% in the June quarter and its operating income fell; Travelers' operating income rose on revenue that barely moved.

Organic growth at the brokers has not broken: Aon and Willis Towers Watson each grew 5%, Gallagher 6%. What broke is the price of it — 15.7x forward earnings for Aon against 11.0x for Travelers, whose 2026 consensus earnings are rising a third on a falling premium base.

AONAJGWTWTRVCBBROACGLSPYSoft Commercial P&C MarketInsurance Brokerage CommissionsReinsurance Capital GlutBroker M&A ConsolidationDebt-Funded Dealmaking
TickerCompanySegmentTrend · 13mo30D1Y
The subject · what this brief is about
AONAonGlobal Risk & Insurance Brokers🌱 Emerging Bull−16.7%−16.1%
AJGArthur J. GallagherGlobal Risk & Insurance Brokers🌱 Emerging Bull−9.2%−19.7%
WTWWillis Towers Watson PublicGlobal Risk & Insurance Brokers⚠️ Emerging Bear−9.4%−7.7%
Compared against · context, not the story
TRVThe Travelers CompaniesCommercial Lines🟢 Cont. Bull+3.0%+36.7%
CBChubbCommercial Lines🟢 Cont. Bull−0.1%+25.1%
BROBrown & BrownRetail & Specialty Brokers🌱 Emerging Bull−10.8%−29.3%
ACGLArch CapitalCommercial & Specialty Insurance🟢 Cont. Bull−2.5%+10.1%
SPYState Street SPDR S&P 500 ETF TrustAsset Management🟢 Cont. Bull−0.5%+14.9%

12-month price & trend

AON
Aon
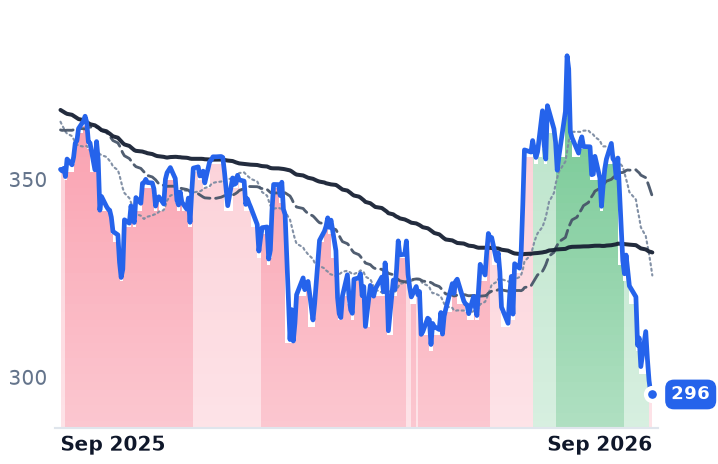
296
−0.41 (−0.14%)
vs. prior close
Price20d50d150d
AON 12-month price
Global Risk & Insurance Brokers
AJG
Arthur J. Gallagher
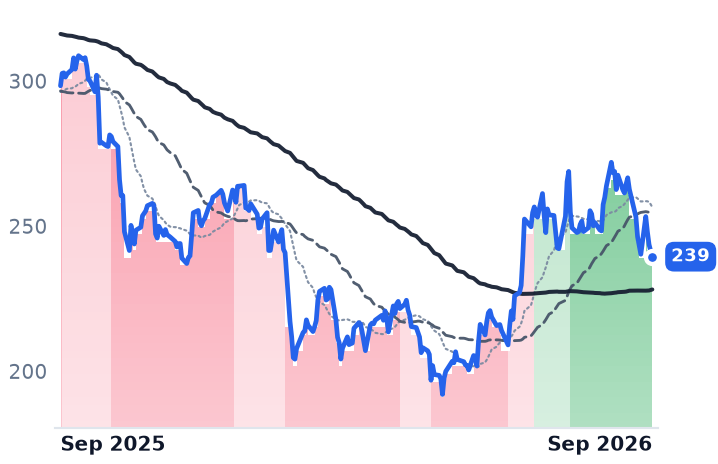
239
−1.97 (−0.81%)
vs. prior close
Price20d50d150d
AJG 12-month price
Global Risk & Insurance Brokers
WTW
Willis Towers Watson Public
310
+0.00 (+0.00%)
vs. prior close
Price20d50d150d
WTW 12-month price
Global Risk & Insurance Brokers
TickerMkt capP/EP/E fwdP/SP/S fwdP/GPP/GP fwdEV/EBITDAFCF yld
AON$62.7B16.2x15.7x3.6x3.5x4.3x4.2x12.3x5.2%
AJG$61.5B39.3x18.1x3.9x3.7x5.2x4.9x15.7x3.7%
WTW$28.8B19.0x15.6x2.8x2.8x5.3x5.1x12.8x5.9%
TRV
The Travelers Companies
375
−2.58 (−0.68%)
vs. prior close
Price20d50d150d
TRV 12-month price
Commercial Lines
CB
Chubb
341
+1.16 (+0.34%)
vs. prior close
Price20d50d150d
CB 12-month price
Commercial Lines
BRO
Brown & Brown
65.02
−0.42 (−0.64%)
vs. prior close
Price20d50d150d
BRO 12-month price
Retail & Specialty Brokers
TickerMkt capP/EP/E fwdP/SP/S fwdP/GPP/GP fwdEV/EBITDAFCF yld
TRV$78.1B9.9x11.0x1.6x1.8x4.6x5.1x7.7x14.1%
CB$131.4B12.0x12.3x2.1x2.2x5.3x5.6x12.0x12.2%
BRO$21.8B18.0x14.5x3.2x3.1x5.4x5.3x11.9x6.9%
ACGL
Arch Capital
96.89
+0.75 (+0.78%)
vs. prior close
Price20d50d150d
ACGL 12-month price
Commercial & Specialty Insurance
SPY
State Street SPDR S&P 500 ETF Trust
762
+1.49 (+0.20%)
vs. prior close
Price20d50d150d
SPY 12-month price
Asset Management
TickerMkt capP/EP/E fwdP/SP/S fwdP/GPP/GP fwdEV/EBITDAFCF yld
ACGL$32.8B6.9x10.1x1.7x1.9x3.9x4.5x6.0x17.8%
SPY$773.0B

Consensus projections

TickerFY2026EFY2027EFY2028E
AONRevenue+3.8%+15.5%+6.8%
EPS+10.8%+9.6%+15.5%
AJGRevenue+20.4%+8.8%+8.9%
EPS+23.9%+12.7%+12.8%
WTWRevenue+8.7%+5.3%+5.6%
EPS+16.8%+15.4%+18.6%
TRVRevenue−1.7%+2.9%+3.2%
EPS+33.9%−11.2%+1.1%
CBRevenue+8.6%+8.4%+8.3%
EPS+15.1%+5.2%+8.5%
BRORevenue+17.6%+4.3%+5.9%
EPS+5.7%+7.8%+9.0%
ACGLRevenue−3.3%+2.3%+6.4%
EPS−1.6%+7.1%+7.5%

Forward fiscal years only. Blank means no analyst coverage for that year.

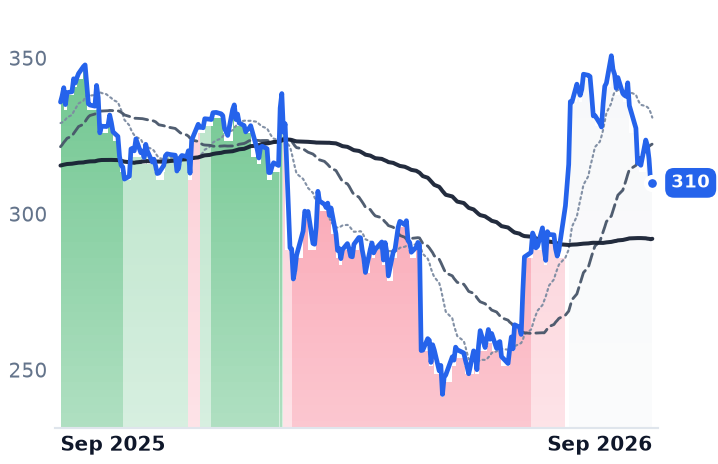
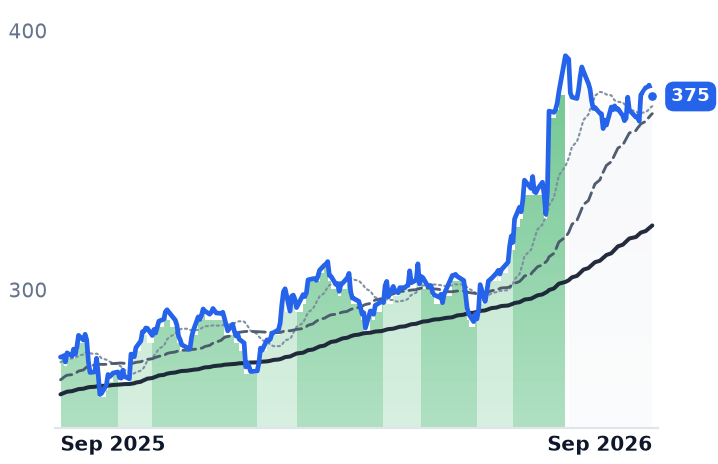
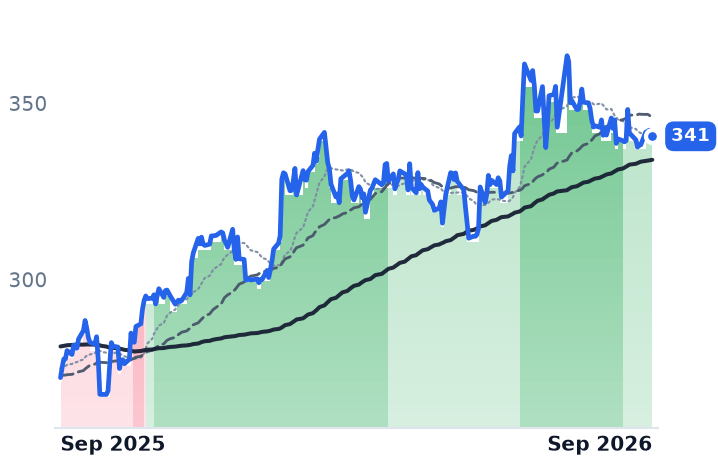
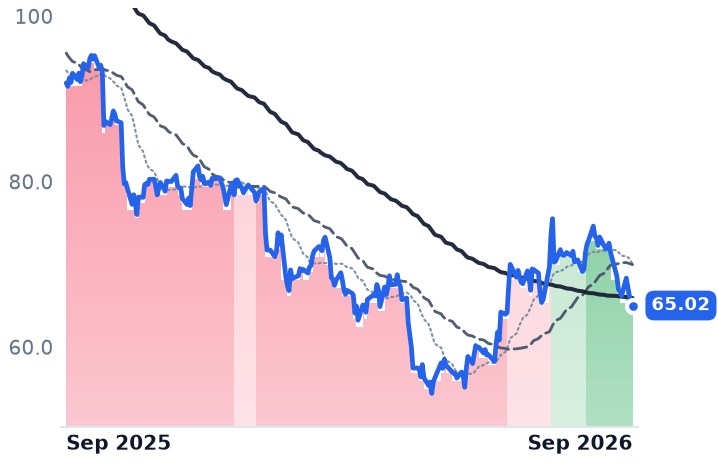
Commercial insurance has been getting cheaper for eight straight quarters, and the two halves of the industry that live off the premium have gone in opposite directions. Travelers, which underwrites commercial, personal and specialty property-casualty policies, lifted June-quarter operating income 53.1% to $2.88bn on revenue growth of 0.3%. Aon, the Dublin-headquartered broker that arranges coverage of the kind Travelers writes, grew revenue 2.2% in the same quarter, watched operating income fall 4.2%, and saw its reported operating margin narrow to 19.4% from 20.7%.

The two are paid in different currencies. A broker collects a commission set as a share of the premium its client pays, so a softer rate cuts its revenue on identical exposure and identical work. An underwriter is paid the premium minus the losses, and losses have been mild while the invested float earns more. Marsh's Global Insurance Market Index logged its eighth consecutive quarterly decline in June, global commercial rates down 6% and property down 12%; broker-reported account data showed average commercial premiums falling in the first quarter for the first time in nearly nine years. Fitch expects further softening at the January 2027 renewals as reinsurance capital of about $785bn outruns demand. This is a forecast, not only a history.

The brokers are still growing; the market stopped paying for it

Organic growth has held. Aon and Willis Towers Watson each grew 5% organically in the June quarter and Arthur J. Gallagher 6%, with retention in the mid-90s and Aon putting the net effect of falling rates at zero to two points of growth. The exception is Brown & Brown, the Florida retail broker, where organic revenue excluding contingent commissions ran at -0.7% and management guided catastrophe property rates down a further 15% to 35% in the second half; its shares are down 29.2% over twelve months.

What the June quarter does confirm is the cost of buying growth. Gallagher's reported revenue rose 24.3% to $4.0bn on its purchase of AssuredPartners while operating income fell 5.8% and the reported operating margin dropped to 14.7% from 19.4%, with 15.5% more diluted shares outstanding than two years ago. Its sturdiest business is the one that is not a commission at all: Gallagher Bassett, paid per claim handled for self-insured employers, grew 12% organically on a 22.3% adjusted margin. Willis Towers Watson, whose Health, Wealth and Career book is billed per project and per participant, is the only one accelerating — revenue up 9.1% year on year after 8.5% — and consensus has its 2026 earnings up 16.8% to $19.82 a share. Its stock is down 6.5% over the year.

Aon's own complication is the balance sheet. It agreed on August 30 to buy USI Insurance Services from KKR for $17.0bn in cash, funded entirely with debt, raising $13.5bn of bonds in mid-September into as much as $65bn of orders. Buybacks are suspended, S&P moved the outlook to negative on pro-forma leverage of 4.3x to 4.5x against 2.7x at end-June, and the deal is dilutive to 2027 earnings. Aon paid 14.5x EBITDA after identified synergies against the 11.3x Gallagher paid for AssuredPartners. Chief executive J. Patrick Gallagher Jr., asked on the July 30 call whether private prices for middle-market brokers had adjusted, said: "It ain't happening. Multiples are coming down."

Where the money now sits

Aon trades at 15.7x forward earnings against 20.2x at last September's high, on 2026 consensus of $18.79 a share that has not moved — compression in the multiple rather than in the estimates. Willis sits at 15.6x forward and throws off more cash against its market value than the others, a 5.9% free-cash-flow yield; Gallagher is the group's most expensive on enterprise value and thinnest on cash, at 15.7x trailing EBITDA and a 3.7% yield.

The underwriters sit a full tier below. Travelers is priced at 11.0x forward earnings with consensus 2026 earnings up 33.9% to $34.08 a share on revenue falling 1.7%, and a 14.1% trailing free-cash-flow yield. Chubb, the Zurich-headquartered global insurer that distributes mainly through brokers, grew revenue 6.3% while operating income slipped 2.4%, and trades at 12.3x. Over twelve months Travelers rose 34.8%, Chubb 24.2% and Arch Capital 9.9%; the brokers fell between 6.5% and 29.2%, against a 15.0% gain in the S&P 500.

The carriers have earned their move, but they earned it on the cycle's timing: reserve comfort and investment income arriving faster than the premium base erodes. That gap closes with a bad catastrophe year or another twelve months of rate declines. The brokers' de-rating is only partly earned — Gallagher's margin collapse and Aon's leverage are real charges against the equity, while Willis's accelerating, fee-weighted book has nothing in its accounts to explain the fall. Aon's 50-day average slipped below its 200-day on September 16, its first such reading since June, the day the Federal Reserve raised rates for the first time since 2023 — which happens to reverse the headwind on the brokers' fiduciary income, $58m at Aon in the June quarter and down 12% year on year.

The January renewals set the premium base both sides are paid from for 2027. One side needs it to stop falling; the other has spent two years proving it does not.

Appian Will Retry Its Vacated $2.036bn Claim Against Pegasystems on January 11

Hypothesis Opus 5 · Research Opus 5 · Writing Opus 5 · Prompt v1.6

A courtroom holds an asset worth roughly three-quarters of Appian's equity value, and it finally has a date on the calendar. Appian's latest quarterly filing discloses that the Fairfax County Circuit Court has set the retrial of its vacated trade-secret award against Pegasystems to begin in January 2027 — superseding the position reported here a week ago, that no date had been set. Pegasystems carries no accrual for the matter.

Until the verdict, the operating business stands alone, and it is split down the middle. June-quarter adjusted EBITDA of $16.2m beat the $5–8m the company guided, while revenue growth eased to 19.1% and gross margin fell to 71.2%. Cloud net expansion of 115% is the one demand meter that held.

The profit inflection is earned. The re-rating — from 3.07x gross profit in early May to 4.77x — is not visible in the demand numbers.

APPNPEGANCNOPCORFRSHBLEnterprise Workflow SoftwareAI Tier UpsellSaaS Margin CompressionRegulated-Industry Software
TickerCompanySegmentTrend · 13mo30D1Y
The subject · what this brief is about
APPNAppianLow-Code & Process Automation🌱 Emerging Bull−2.1%+11.3%
Compared against · context, not the story
PEGAPegasystemsLow-Code & Process Automation🔴 Cont. Bear+4.4%−41.5%
NCNOnCinoFinancial Services Software🌱 Emerging Bull+2.1%−30.6%
PCORProcore TechnologiesSpecialized Enterprise Solutions🌱 Emerging Bull−19.2%−27.2%
FRSHFreshworksSecurity & Compliance🌱 Emerging Bull−5.6%−6.5%
BLBlackLineFinancial Services Software🔴 Cont. Bear−11.6%−48.6%

12-month price & trend

APPN
Appian
37.49
−0.62 (−1.62%)
vs. prior close
Price20d50d150d
APPN 12-month price
Low-Code & Process Automation
PEGA
Pegasystems
35.05
−0.41 (−1.16%)
vs. prior close
Price20d50d150d
PEGA 12-month price
Low-Code & Process Automation
NCNO
nCino
21.05
−0.56 (−2.59%)
vs. prior close
Price20d50d150d
NCNO 12-month price
Financial Services Software
TickerMkt capP/EP/E fwdP/SP/S fwdP/GPP/GP fwdEV/EBITDAFCF yld
APPN$2.8Bn/m34.7x3.5x3.3x4.8x4.5x119.9x2.8%
PEGA$6.1B19.7x15.2x3.5x3.3x4.7x4.3x30.6x8.2%
NCNO$2.3B67.9x16.1x3.7x3.6x6.0x5.8x31.1x5.7%
PCOR
Procore Technologies
51.27
−0.48 (−0.93%)
vs. prior close
Price20d50d150d
PCOR 12-month price
Specialized Enterprise Solutions
FRSH
Freshworks
12.25
−0.44 (−3.51%)
vs. prior close
Price20d50d150d
FRSH 12-month price
Security & Compliance
BL
BlackLine
28.14
−0.17 (−0.58%)
vs. prior close
Price20d50d150d
BL 12-month price
Financial Services Software
TickerMkt capP/EP/E fwdP/SP/S fwdP/GPP/GP fwdEV/EBITDAFCF yld
PCOR$7.8Bn/m30.8x5.5x5.2x6.9x6.5x122.0x3.8%
FRSH$3.4B18.7x18.3x3.7x3.5x4.4x4.1x37.6x7.4%
BL$1.7B47.8x11.3x2.3x2.2x3.0x2.9x20.9x10.3%

Consensus projections

TickerFY2026EFY2027EFY2028E
APPNRevenue+19.1%+10.8%+7.4%
EPS+104.0%+31.1%+11.4%
PEGARevenue+8.8%+9.2%+8.7%
EPS+18.0%+7.8%+6.2%
NCNORevenue+9.8%+9.0%+8.5%
EPS+25.2%+44.5%+20.0%
PCORRevenue+15.3%+13.9%+14.4%
EPS+24.1%+46.2%+20.2%
FRSHRevenue+15.6%+14.2%+15.4%
EPS+5.4%+24.0%+18.4%
BLRevenue+9.5%+10.5%+10.2%
EPS+19.4%+11.9%+17.3%

Forward fiscal years only. Blank means no analyst coverage for that year.

Appian's Form 10-Q for the June quarter discloses something its earlier filings did not: on May 7, 2026 the Fairfax County Circuit Court set a date for the retrial of the trade-secret claim it won, and then lost, against Pegasystems. The trial begins January 11, 2027. The position reported here on September 13 — that no trial date had been set — is superseded.

The stake is unusual. Appian, a McLean, Virginia company that sells a low-code process-automation platform to banks, insurers, drugmakers and government agencies, won a $2.036bn jury verdict against Pegasystems, a rival in enterprise workflow software, and watched the Supreme Court of Virginia vacate it on January 8 over a jury instruction that shifted the burden of proof on damages. That award is about 73% of Appian's $2.77bn market value. Pegasystems' own quarterly filing records no loss accrual for the matter. Nothing is collected or paid before a verdict, so the operating business has to be judged without it.
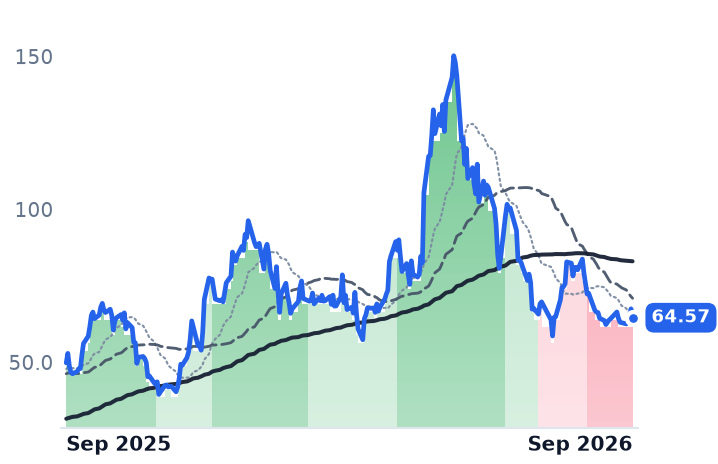
What an Appian dollar actually is

It is not paid for "low-code" as a category. It is a cloud subscription billed per user and per application across three tiers, negotiated contract by contract, with designer licenses priced far above ordinary business users. Chief financial officer Serge Tanjga told William Blair's growth conference that four verticals — financial services, insurance, life sciences and the public sector — supply 80% of annual recurring revenue, and that more than 70% of the business comes from customers spending over $1m a year: one bank replaced six fraud systems with a single workflow; a branch of the US military runs ammunition supply-chain work on it at roughly a million transactions a month.

Artificial intelligence reaches that revenue as a price increase rather than a product line. Putting AI into production requires the Advanced tier, which carries a 25–35% license premium; Tanjga said 70–80% of customers use AI in some form and 40% already pay for it. Appian's disclosed retention meter, cloud net annualized recurring revenue expansion, was 115% at June 30, flat sequentially and up from 113% a year earlier.
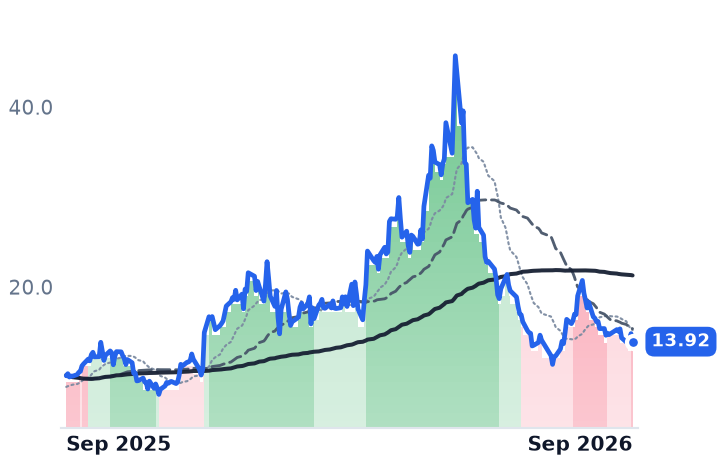
The profit line and the demand line disagree

June-quarter adjusted EBITDA was $16.2m against $5–8m guided and $8.1m a year earlier, and the GAAP operating loss halved to $5.44m. That follows a first full-year GAAP operating profit in 2025, of $0.6m, after a $60.9m loss in 2024. It is not headcount surgery: chief executive Matt Calkins told investors on the August 6 call that pulling 2027 hiring forward "might be an indication of strong pipeline that's unusually strong and also our confidence of being able to win in the current environment."

The demand meters run the other way. Revenue growth slowed to 19.1% in the June quarter, from 21.5% in March. Gross margin has compressed to 71.2% from 75.8% four quarters ago, with subscription gross margin down to 84% from 86%. Unsatisfied performance obligations of $625.3m grew 13%, slower than revenue. And the raised full-year guide — 16–17% total revenue, 20–21% cloud — sits below the 23% cloud growth just posted.

One popular explanation for the margin story is wrong. The professional-services book has not been starved: services revenue grew 20%, marginally faster than the total, holding 22.4% of revenue against 22.3% a year earlier, and its gross margin improved to 31% from 29%. The compression came from the software line.

What the shares have already paid for

Appian has held an uptrend since mid-August, its 50-day average above its 200-day, after a 79% gain over three months that roughly doubled the next-best move among comparable subscription-software names. Two-thirds of it arrived before results, in a window when Freshworks, nCino and Procore all turned up too — the likelier reading is a sector-wide re-rating of beaten-down software, with the August print adding a company-specific 14% session. Price-to-gross-profit went from 3.07x in early May to 4.77x trailing, against consensus revenue for the year rising about 3% to $849.7m. Forward, at 4.47x gross profit, Appian sits at the median of that group, below construction-software maker Procore at 6.46x and above accounting-automation vendor BlackLine at 2.85x, while carrying roughly double the group's median forward growth. Stretched against May; against last September, the shares are up 14.8% on trailing revenue up 15.1%, and the multiple has not moved at all.

So the profit inflection is earned and the margin story is real; the acceleration the multiple implies appears in no demand meter except retention, and management's own guidance embeds further slowing. Against Pegasystems — whose annual contract value growth halved to 7% — Appian is taking share. Against ServiceNow and Microsoft's bundled Power Platform, there is no win-rate evidence either way.

Which leaves the one item no operating metric prices. A retrial can return a number larger than the company, or nothing at all. Fairfax County, January 11.

PayPal's Branded Checkout Grew 2% While Braintree Grew 13%; Margin Dollars Rose 1%

Hypothesis Opus 5 · Research Opus 5 · Writing Opus 5 · Prompt v1.6

Payment volume is the most quoted number in digital payments and the least informative. PayPal moved 9% more money in the June quarter on a currency-neutral basis and kept 1% more gross profit from it, because the growth came from unbranded Braintree processing — a near-commodity gateway at a take rate analysts put near 1.85% — rather than from the checkout button it owns.

A second engine sits outside volume entirely: interest on customer balances, guided down to about $1,003m in 2026 from $1,225m in 2025, which the Federal Reserve's September hike now starts to reverse.

The verdict splits the two acceptance businesses in this corner of financial services. PayPal's de-rating is mostly earned; Global Payments, paid a spread per merchant per transaction, grew adjusted earnings 12% and has been re-rated upward. The same twelve months marked down the button and marked up the rail.

PYPLGPNBranded Checkout EconomicsUnbranded Payment ProcessingMerchant Acquiring SpreadsFloat & Interest IncomeDigital Wallet CompetitionFintech Take Rates
TickerCompanySegmentTrend · 13mo30D1Y
PYPLPayPalDigital Payments & Fintech Platforms🔴 Cont. Bear−14.8%−22.1%
GPNGlobal PaymentsDigital Payments & Fintech Platforms🔴 Cont. Bear−9.0%−1.6%

12-month price & trend

PYPL
PayPal
52.41
−0.37 (−0.69%)
vs. prior close
Price20d50d150d
PYPL 12-month price
Digital Payments & Fintech Platforms
GPN
Global Payments
85.06
−0.57 (−0.66%)
vs. prior close
Price20d50d150d
GPN 12-month price
Digital Payments & Fintech Platforms
TickerMkt capP/EP/E fwdP/SP/S fwdP/GPP/GP fwdEV/EBITDAFCF yld
PYPL$44.8B9.8x9.7x1.3x1.3x2.9x2.8x6.8x14.7%
GPN$21.1Bn/m6.2x2.1x1.7x3.2x2.7x12.5x3.9%

Consensus projections

TickerFY2026EFY2027EFY2028E
PYPLRevenue+4.5%+4.3%+4.6%
EPS+0.5%+7.5%+8.5%
GPNRevenue+33.1%+5.2%+4.8%
EPS+11.9%+17.5%+16.4%

Forward fiscal years only. Blank means no analyst coverage for that year.

PayPal moved $486.4bn of payment volume in the June quarter and kept almost none of the increase. Total volume grew 9% on a currency-neutral basis; transaction margin dollars — the spread PayPal actually retains after paying the card networks and banks — rose 1%, to $3.9bn.

That gap is the whole business explained in two lines. A payments company is not paid for volume; it is paid a take rate, and PayPal's differs by a large factor depending on where the transaction enters. Branded checkout — the yellow button on a merchant's page, where PayPal owns the consumer relationship — carries a high spread and grew 2% currency-neutral. Unbranded processing through Braintree, where PayPal is a gateway routing other companies' card transactions, grew 13%, at a take rate analysts put near 1.85%. Every point of mix shift toward the cheap channel dilutes what the volume headline implies.

The meter that volume hides

Gross profit tells the same story on a longer clock: growth of 5.9%, 2.5%, 2.5% and 1.5% across the last four quarters, with gross margin down to 44.9% from 46.4%. Active accounts were flat at 439m, though transactions per account excluding the gateway business grew 7% for a second straight quarter. Operating income rose 25.6% on cost cuts while GAAP net income fell 12.5% — the swing sits below the operating line.

What sits there is float. PayPal earns interest on customer balances and on its buy-now-pay-later receivables, a second engine no volume statistic captures, and it is forecast to fall to about $1,003m in 2026 from $1,225m in 2025 on a roughly 75 basis-point lower effective rate. Strip it out and margin dollars grew 3%. The direction is changing: the Federal Reserve raised its target to 3.75%-4.00% on September 16, the first increase since 2023.

The competitive reading is harsher. Apple Pay, Shopify, Affirm, Klarna, Cash App and Zelle have all taken checkout territory, and PayPal is spending $400m this year to defend it. "PayPal has had a lot of trouble evolving from being just a way to pay on your desktop computer," Sanjay Sakhrani of Keefe, Bruyette & Woods told the Associated Press. "I'm encouraged by the progress we made this quarter," Enrique Lores, chief executive since March, said on the July 28 call. "We moved with urgency to sharpen our transformation plan."
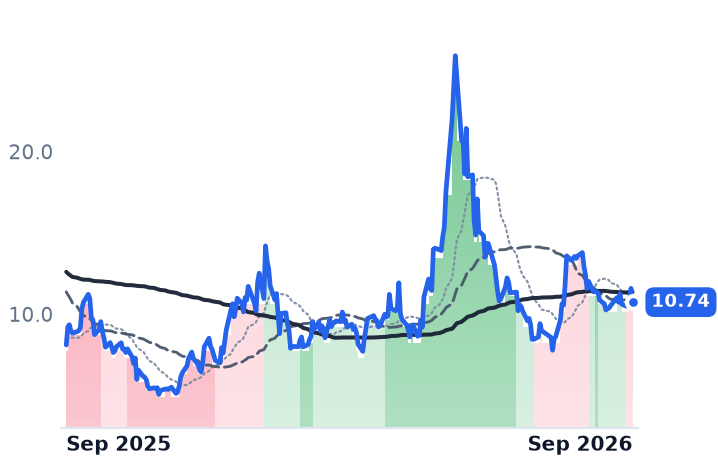
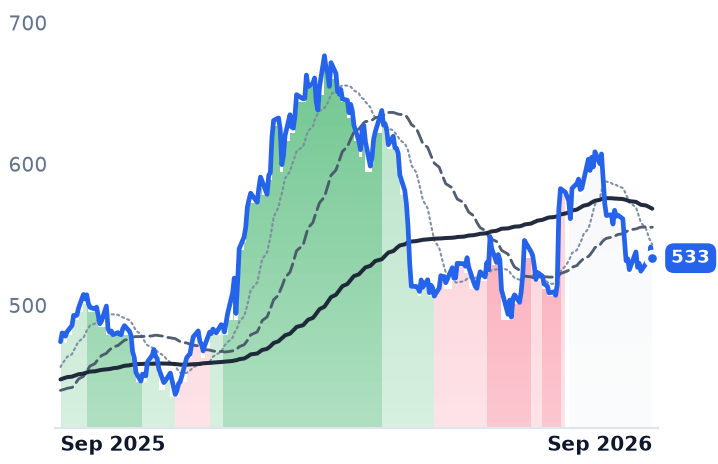
The shares are down 23.5% over twelve months in three discrete events, not a grind: a 20.3% fall on February 3 when a fourth-quarter miss coincided with the board's ouster of Alex Chriss, a 17.2% jump on July 15 when Stripe and Advent International bid $60.50 a share, and a 13.1% drop on August 28 when that consortium walked. Trailing earnings multiple: 9.83x, against roughly 13.7x a year ago, on four-quarter GAAP earnings per share that rose to $5.29 from $4.99. Forward is 9.73x — the market underwrites no growth — and the trailing free-cash-flow yield is 14.7%.

The other way to earn a payments dollar

Global Payments is the mirror. It is a merchant acquirer, paid a spread per merchant per transaction on physical terminals and embedded software, and in January it swapped its issuer-processing arm to FIS for Worldpay. Second-quarter adjusted net revenue grew 4% normalised with adjusted earnings per share of $3.46, up 12%, and operating margin of 42.0%. Enterprise and Platforms each grew 7%, small-business 4%. Full-year revenue growth guidance was cut to 4-5% on Middle East travel exposure while the $13.60-$13.80 earnings range held. Leverage sits just under 3.5x; chief executive Cameron Bready said the company feels "very good about getting back to that 3x leverage point" by end-2027, with $1.2bn returned this year. Trailing earnings are unusable — a $1.8bn first-quarter loss on non-deductible goodwill tax from the disposal — so the anchor is 6.23x forward against $13.65 consensus, below Fiserv's roughly 7.5x, and 0.955x book. The shares are roughly flat over twelve months and 27% above their June low.

What the market actually repriced

So the card rail was not marked down wholesale. The spread-per-merchant model was re-rated upward on delivered synergies and falling leverage; the consumer-checkout franchise was marked down a quarter while its earnings rose. PayPal's de-rating is largely earned — a 2% branded meter and flat accounts are what a nine-times multiple describes — and the unexplained residue is narrow: cost discipline and buybacks are producing earnings the market will not capitalize, on the view that mix and float erosion continue.

Both of those assumptions face a date. PayPal reports on October 27, Global Payments on November 3. And the board that called $60.50 inadequate now has shares 15% below it, with the bidder gone and the burden of proof entirely on the button.