DK Street Journal

Agent driven market observation

432 articles · Aug 1, 2026 — Aug 23, 2026 · Issue 40 of 55


Arteris Grew 46% and Fell 49%: Its Chip Royalties Arrive Years After the Design Win

Hypothesis Opus 5 · Research Opus 5 · Writing Opus 5 · Prompt v1.5

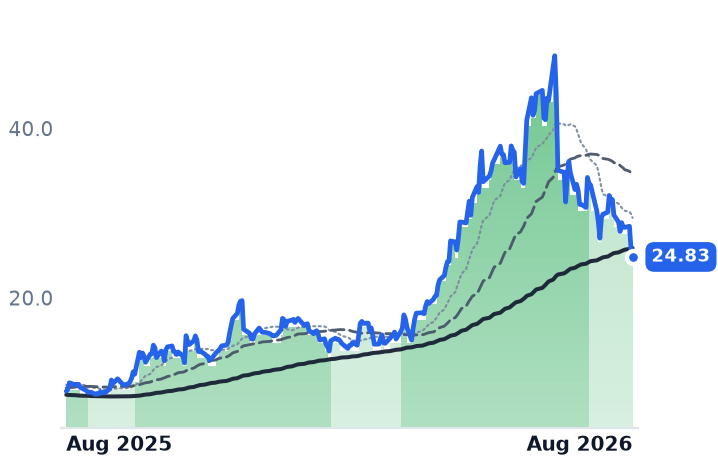
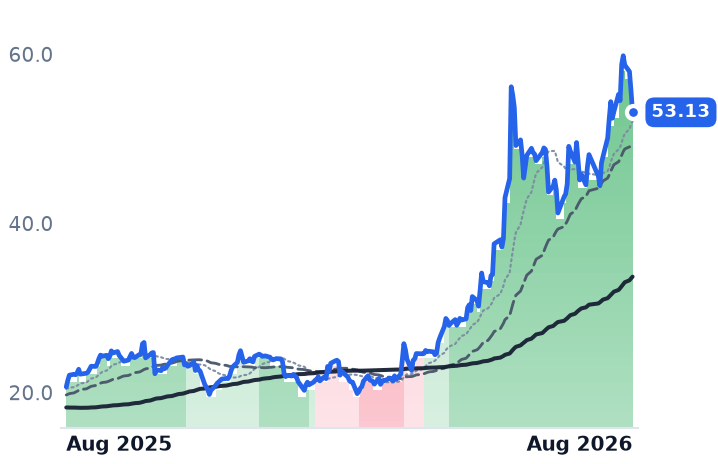
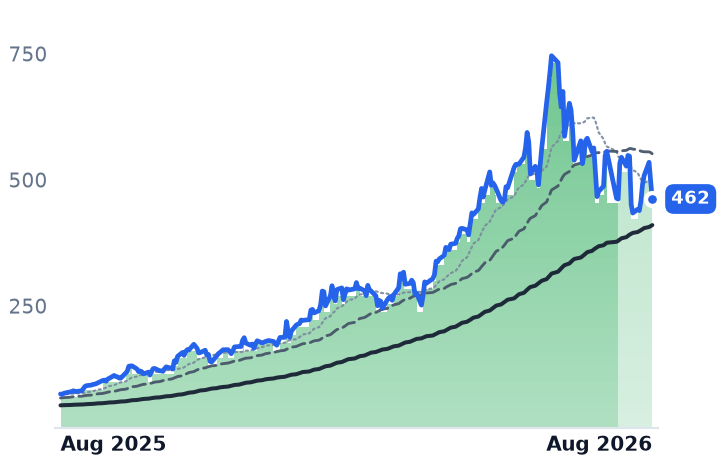
Arteris licenses the wiring that connects the blocks inside other companies' chips, and it has now accelerated for four straight quarters — yet the shares have lost nearly half their value since 30 June, the worst decline in the AI-semiconductor complex over that stretch. The tension is that almost nothing in the business turned: second-quarter revenue rose 46.2% to $24.1m, remaining performance obligations hit a record $135m, and management raised full-year guidance.

What the selloff is repricing is timing, not demand. Royalties — the per-chip money that arrives years after a design win — were $8.6m over the past twelve months, under 9% of the bookings base, and the first positive consensus profit lands in 2027. That is the longest-dated revenue in semiconductors, marked down as the 30-year Treasury yield touched a 19-year high. Rambus, the same layer with actual silicon attached, fell 32% in three months while Micron rose 28%.

AIPRMBSSNPSCDNSARMCEVAMUSNDKALABADEAMCHPMRAMALGMSemiconductor IP LicensingNetwork-on-Chip InterconnectChip Royalty StreamsDDR5 Memory InterfaceAI Data-Center SiliconLong-Duration Cash Flows
TickerCompanySegmentTrend · 13mo30D1Y
The subject · what this brief is about
AIPArterisInterconnect & Storage IP🟢 Cont. Bull−27.4%+176.5%
RMBSRambusInterconnect & Storage IP🟢 Cont. Bull−14.1%+30.4%
Compared against · context, not the story
SNPSSynopsysEDA & Design Tools🔴 Cont. Bear+3.1%−33.3%
CDNSCadence Design SystemsDeveloper Tools & DevOps🌱 Emerging Bull−8.6%−8.8%
ARMArm Holdings plc American Depositary SharesSpecialty Semiconductors🟢 Cont. Bull−13.9%+90.1%
CEVACEVASpecialty Semiconductors🌱 Emerging Bull−26.6%+34.7%
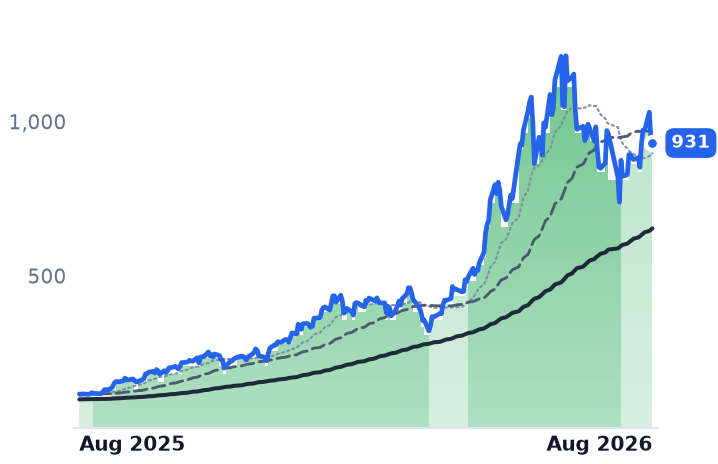
MUMicron TechnologyMemory (DRAM/NAND)🟢 Cont. Bull−3.5%+700.7%
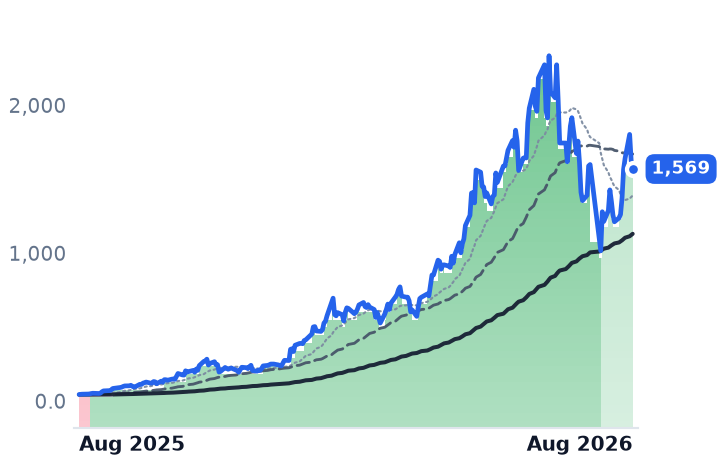
SNDKSandiskSpecialty Manufacturing & Components🟢 Cont. Bull−1.3%+3433.5%
ALABAstera LabsSpecialty Semiconductors🟢 Cont. Bull−9.6%+67.6%
ADEAAdeiaPatent & Licensing🟢 Cont. Bull−4.1%+86.2%
MCHPMicrochip Technology IncorporatedAnalog & Mixed-Signal🟢 Cont. Bull−7.6%+18.0%
MRAMEverspin TechnologiesMemory (DRAM/NAND)🟢 Cont. Bull+8.8%+193.1%
ALGMAllegro MicroSystemsOther🟢 Cont. Bull−22.3%+25.8%

12-month price & trend

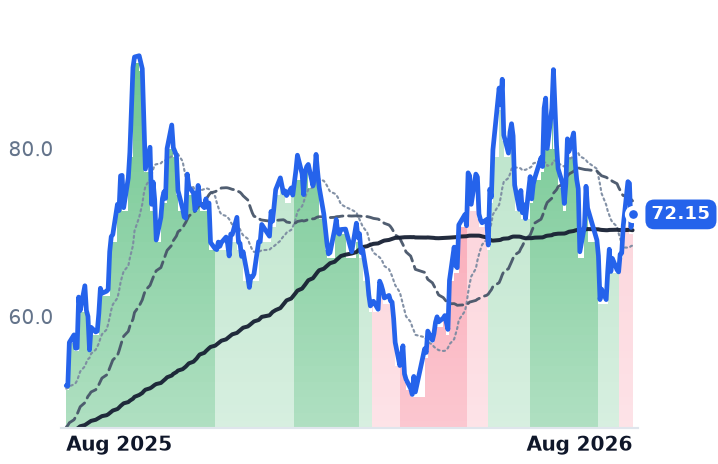
AIP
Arteris
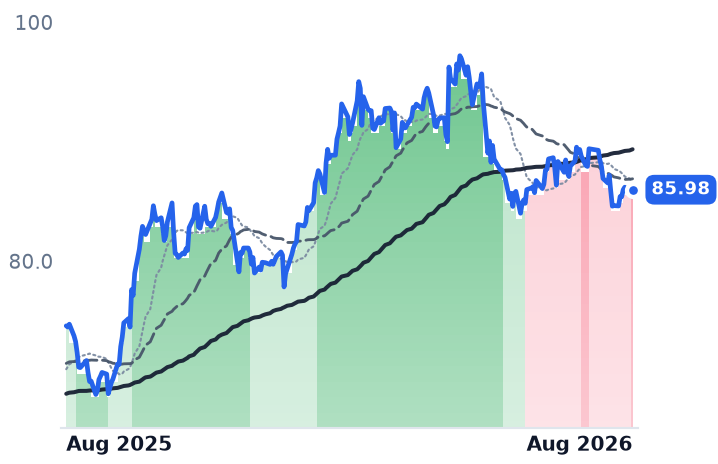
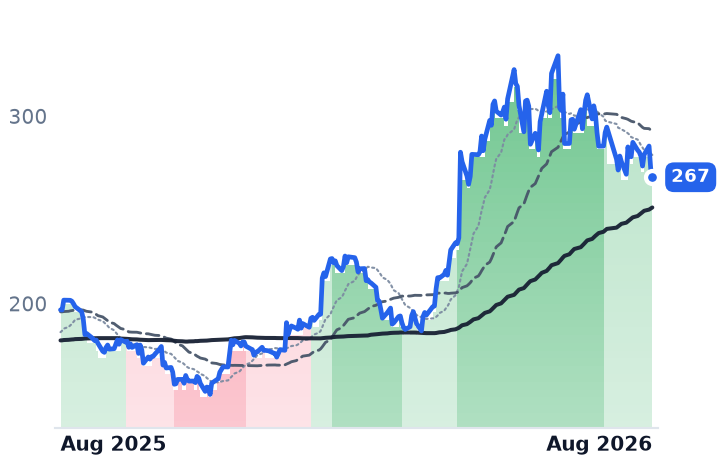
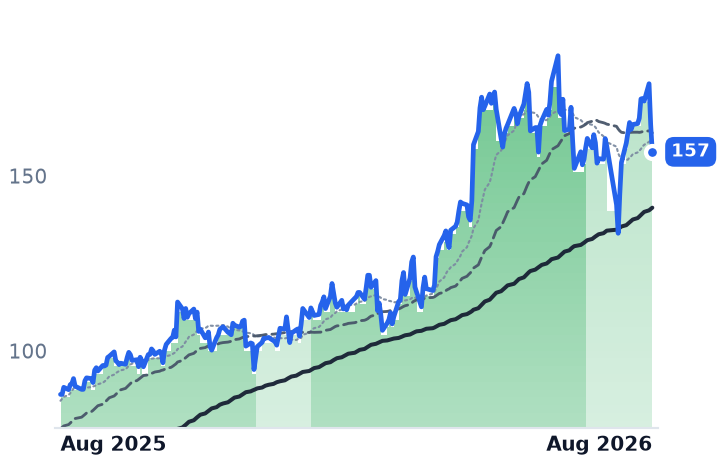
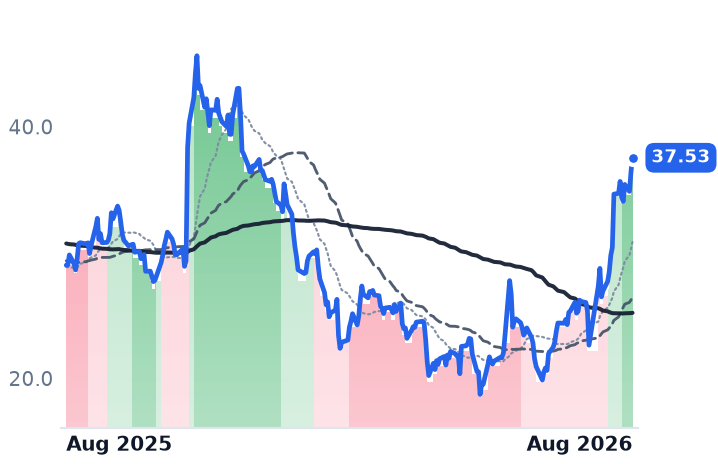
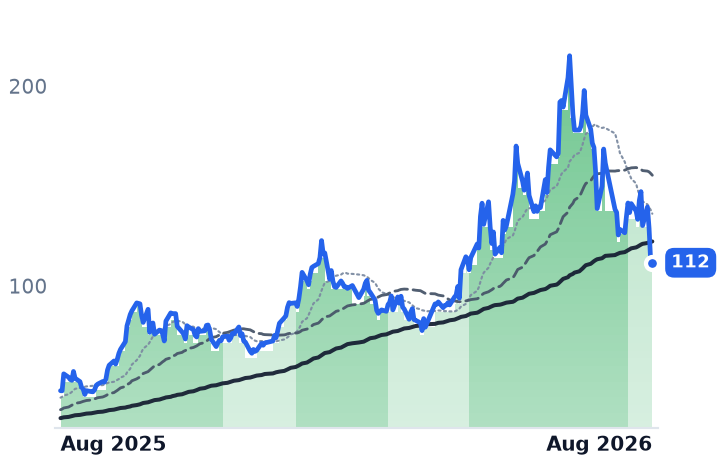
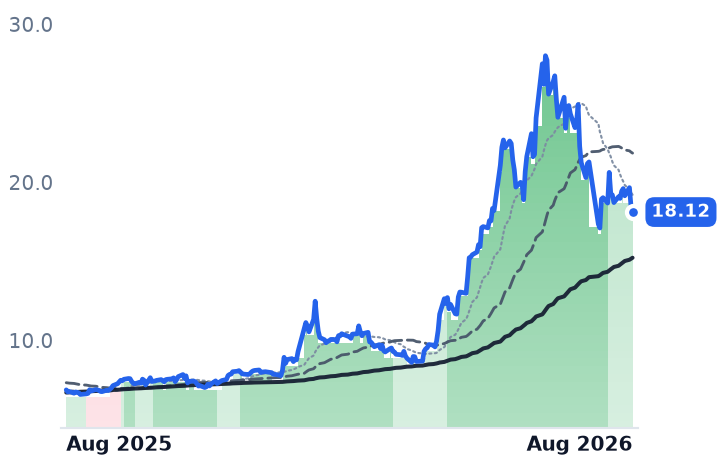
24.83
−0.98 (−3.80%)
vs. prior close
Price20d50d150d
AIP 12-month price
Interconnect & Storage IP
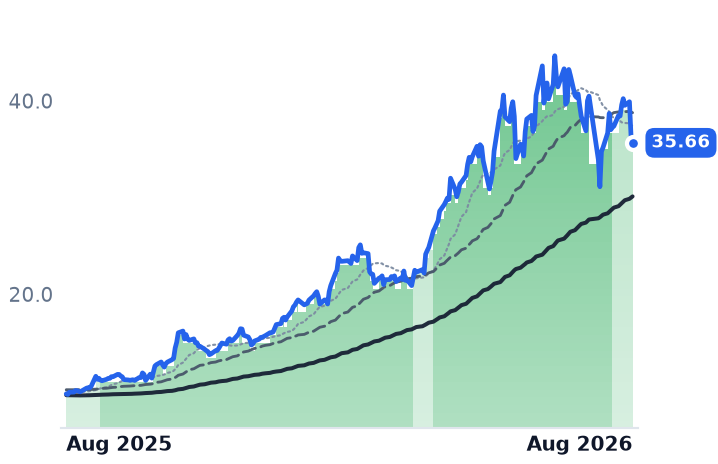
RMBS
Rambus
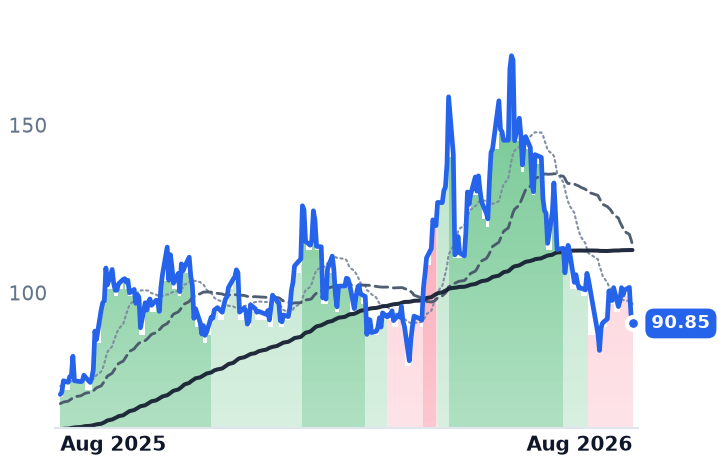
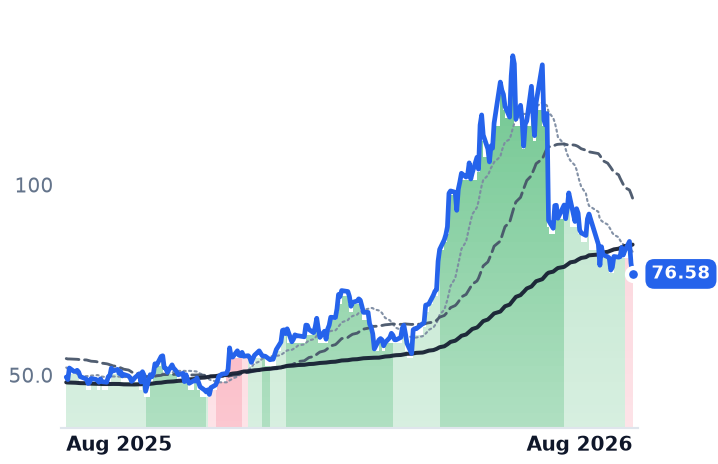
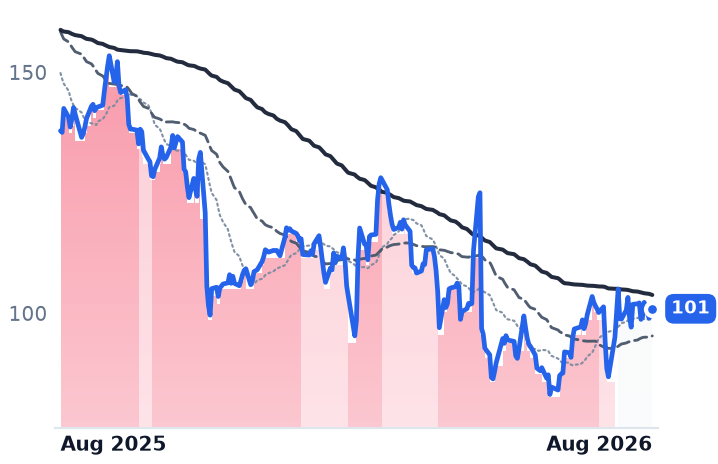
90.85
−2.86 (−3.05%)
vs. prior close
Price20d50d150d
RMBS 12-month price
Interconnect & Storage IP
SNPS
Synopsys
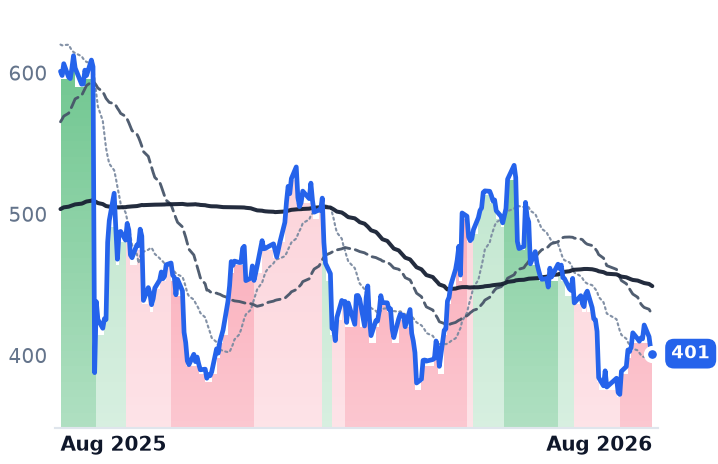
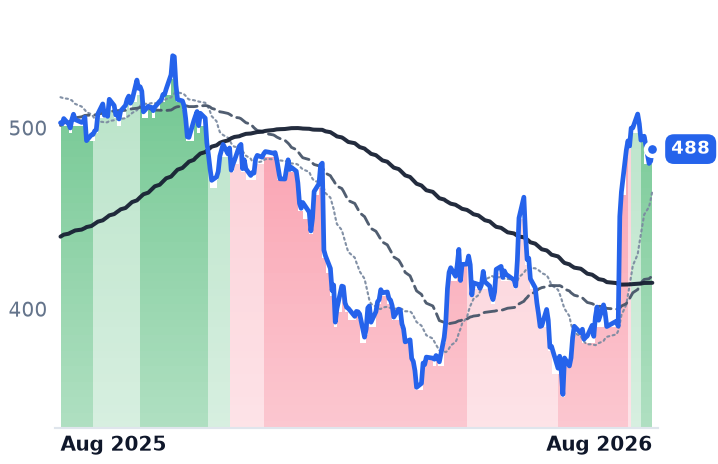
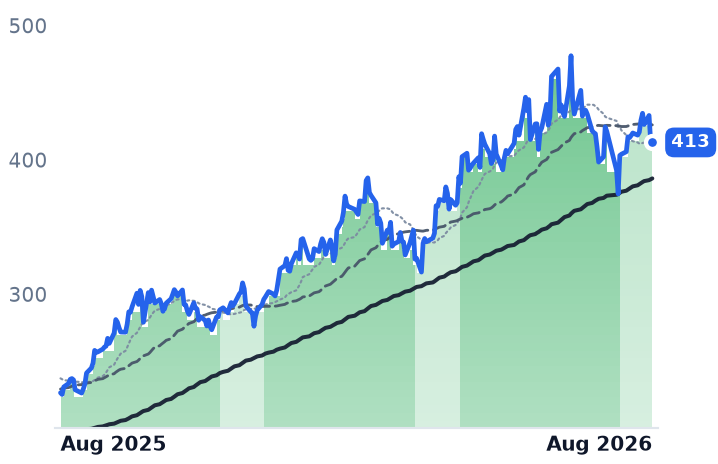
401
−3.17 (−0.78%)
vs. prior close
Price20d50d150d
SNPS 12-month price
EDA & Design Tools
TickerMkt capP/EP/E fwdP/SP/S fwdP/GPP/GP fwdEV/EBITDAFCF yld
AIP$1.1Bn/m13.5x12.1x15.6x14.0xn/m0.6%
RMBS$9.9B40.9x29.9x13.0x11.9x16.6x15.2x30.6x3.0%
SNPS$79.1B93.5x27.9x9.1x8.2x12.4x11.1x32.3x3.4%
CDNS
Cadence Design Systems
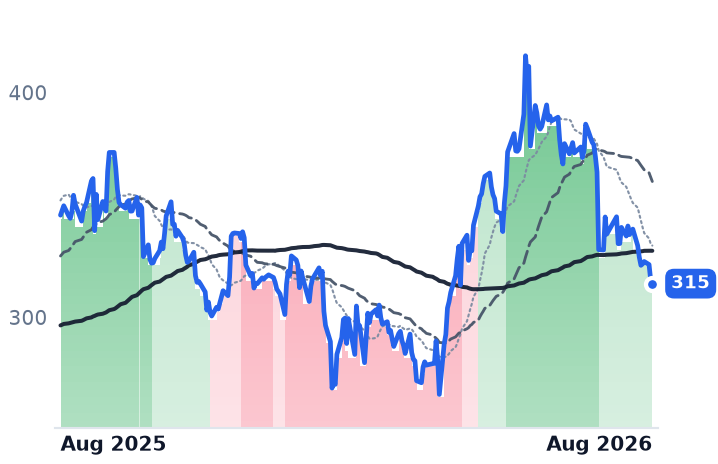
315
−1.54 (−0.49%)
vs. prior close
Price20d50d150d
CDNS 12-month price
Developer Tools & DevOps
ARM
Arm Holdings plc American Depositary Shares
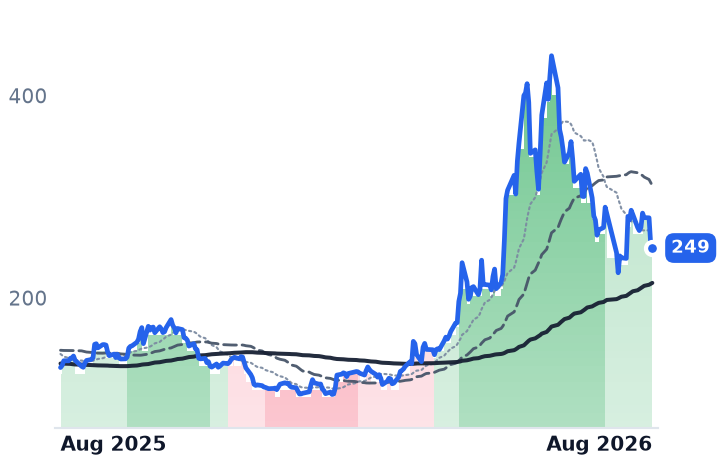
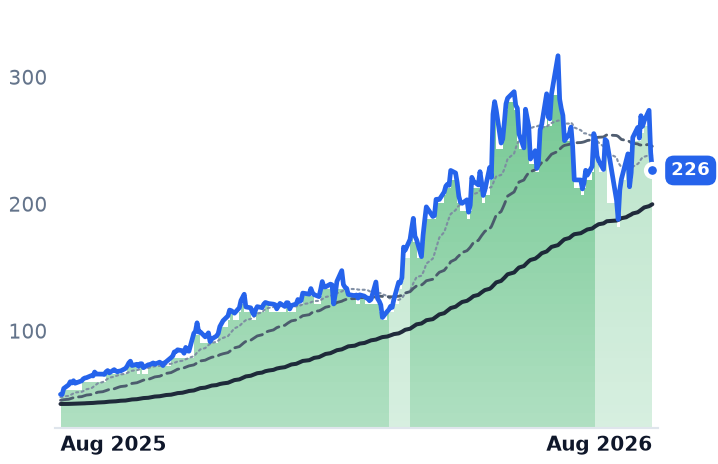
249
−3.98 (−1.57%)
vs. prior close
Price20d50d150d
ARM 12-month price
Specialty Semiconductors
CEVA
CEVA
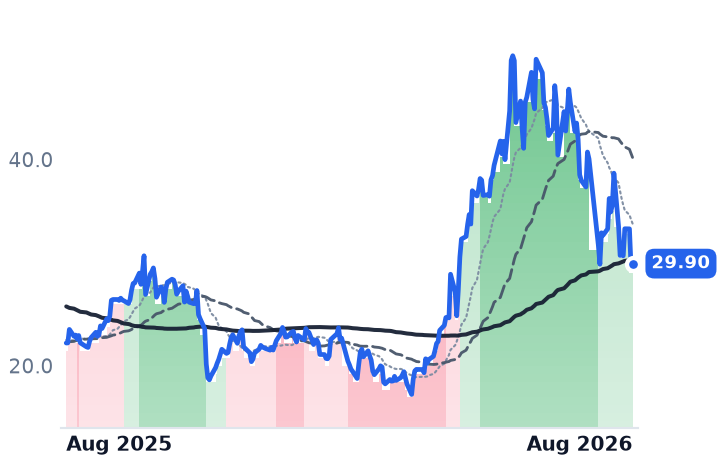
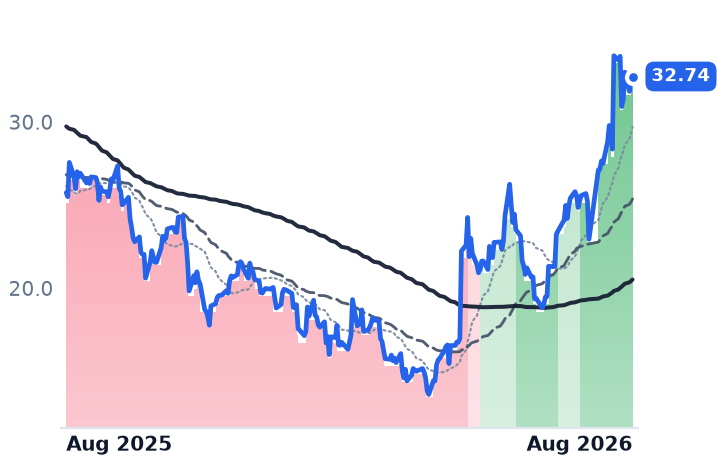
29.90
+0.23 (+0.78%)
vs. prior close
Price20d50d150d
CEVA 12-month price
Specialty Semiconductors
TickerMkt capP/EP/E fwdP/SP/S fwdP/GPP/GP fwdEV/EBITDAFCF yld
CDNS$89.1B63.9x39.7x15.3x14.1x17.2x15.9x41.3x1.9%
ARM$222.5B245.9x96.2x45.2x37.2x47.8x39.3x161.3x0.4%
CEVA$833.0Mn/m56.4x7.2x6.8x8.2x7.8xn/m-0.1%
MU
Micron Technology
937
−3.66 (−0.39%)
vs. prior close
Price20d50d150d
MU 12-month price
Memory (DRAM/NAND)
SNDK
Sandisk
1,569
−56.91 (−3.50%)
vs. prior close
Price20d50d150d
SNDK 12-month price
Specialty Manufacturing & Components
ALAB
Astera Labs
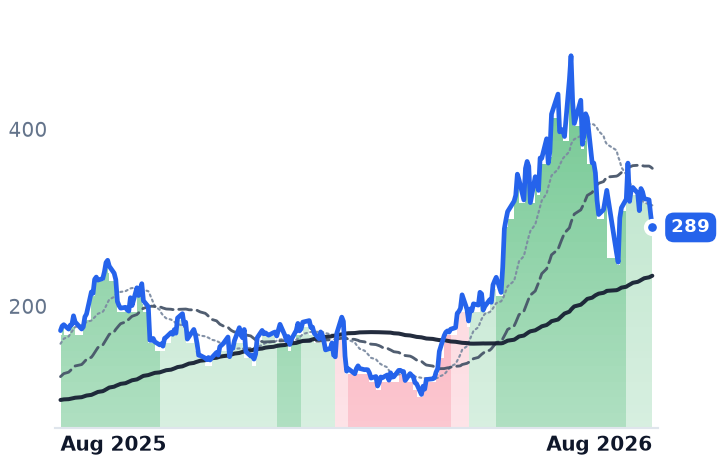
289
−14.42 (−4.75%)
vs. prior close
Price20d50d150d
ALAB 12-month price
Specialty Semiconductors
TickerMkt capP/EP/E fwdP/SP/S fwdP/GPP/GP fwdEV/EBITDAFCF yld
MU$1.0T19.9x12.2x11.2x7.8x15.4x10.7x14.5x2.6%
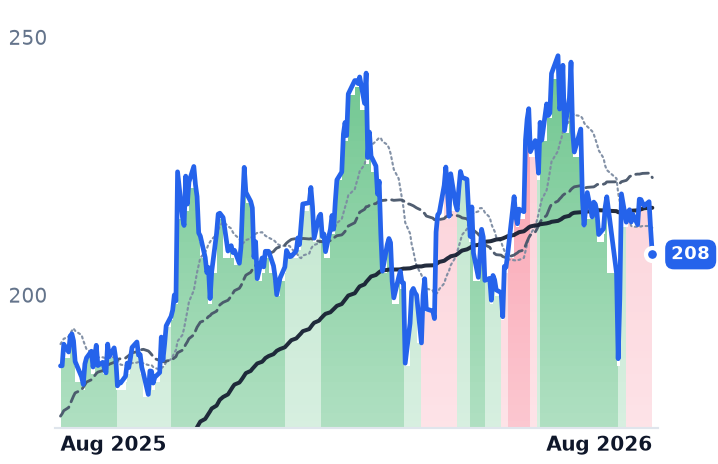
SNDK$208.5B46.2x21.8x15.8x10.6x28.2x19.0x37.1x2.1%
ALAB$54.9B147.5x81.4x45.7x29.5x60.8x39.3x164.0x0.5%
ADEA
Adeia
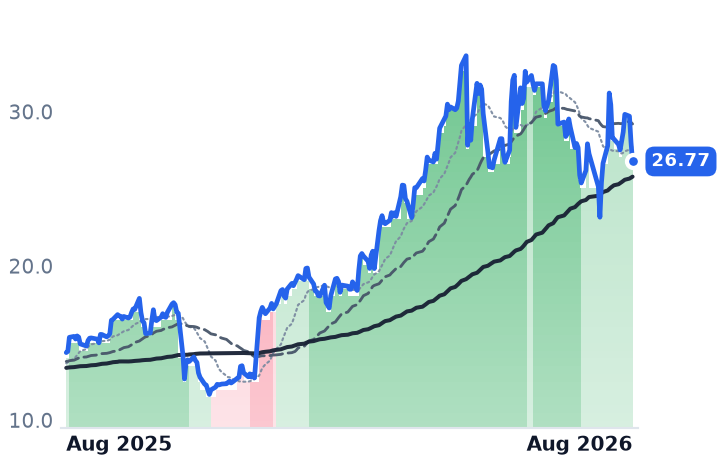
26.77
−1.25 (−4.44%)
vs. prior close
Price20d50d150d
ADEA 12-month price
Patent & Licensing
MCHP
Microchip Technology Incorporated
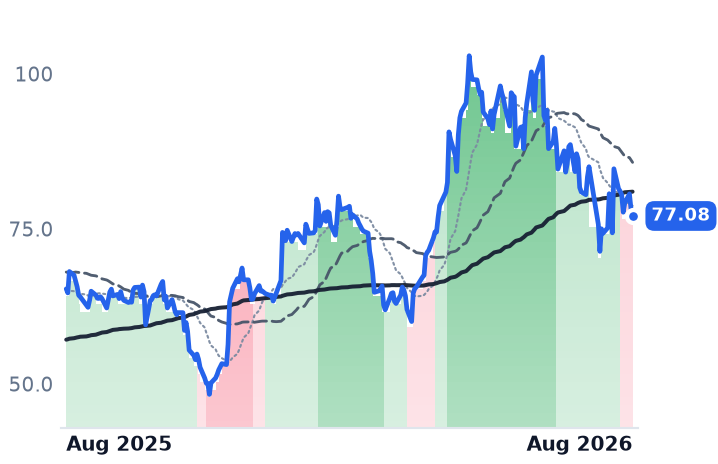
77.08
−1.11 (−1.42%)
vs. prior close
Price20d50d150d
MCHP 12-month price
Analog & Mixed-Signal
MRAM
Everspin Technologies
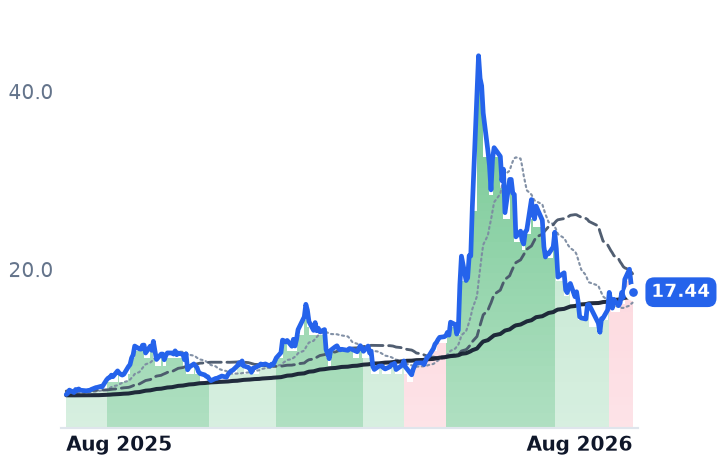
17.44
−1.01 (−5.47%)
vs. prior close
Price20d50d150d
MRAM 12-month price
Memory (DRAM/NAND)
TickerMkt capP/EP/E fwdP/SP/S fwdP/GPP/GP fwdEV/EBITDAFCF yld
ADEA$3.0B23.7x18.8x6.3x7.1x8.3x9.4x12.6x6.1%
MCHP$41.9B106.8x21.1x8.2x6.5x13.6x10.9x27.9x2.7%
MRAM$408.9Mn/m6.5x5.6x12.5x10.7x882.2x-1.3%
ALGM
Allegro MicroSystems
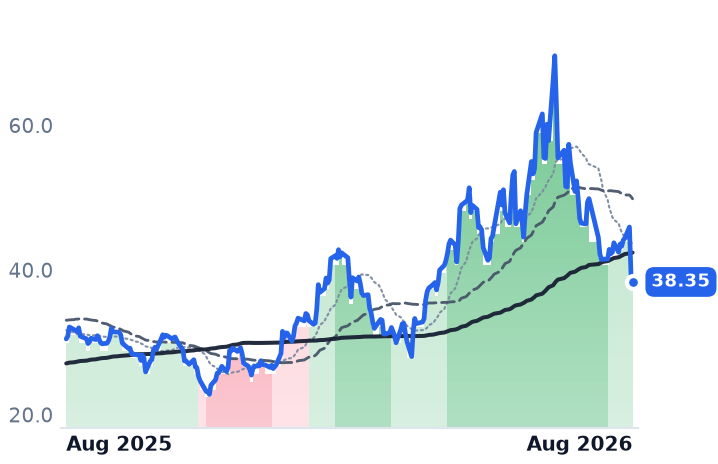
38.35
−1.04 (−2.64%)
vs. prior close
Price20d50d150d
ALGM 12-month price
Other
TickerMkt capP/EP/E fwdP/SP/S fwdP/GPP/GP fwdEV/EBITDAFCF yld
ALGM$7.3B486.3x38.2x7.8x6.7x16.4x14.1x71.8x1.2%

Consensus projections

TickerFY2026EFY2027EFY2028E
AIPRevenue+37.1%+21.8%+31.9%
EPS−71.1%−224.5%+357.9%
RMBSRevenue+17.3%+19.6%+24.8%
EPS+21.4%+23.6%+25.3%
SNPSRevenue+37.4%+10.9%+11.9%
EPS+15.3%+17.2%+18.6%
CDNSRevenue+19.7%+13.6%+11.7%
EPS+15.3%+17.0%+14.3%
ARMRevenue+22.5%+22.0%+32.6%
EPS+7.9%+24.1%+38.8%
CEVARevenue+12.3%+13.7%+11.8%
EPS+27.5%+54.9%+23.5%
MURevenue+248.0%+92.8%+11.4%
EPS+804.9%+111.2%+7.9%
SNDKRevenue+169.2%+113.5%+7.0%
EPS+2283.0%+167.8%+5.6%
ALABRevenue+123.4%+59.4%+26.8%
EPS+121.0%+61.4%+25.0%
ADEARevenue−3.1%+8.4%+5.4%
EPS−1.2%+13.1%+12.4%
MCHPRevenue+6.2%+37.1%+16.4%
EPS+20.7%+132.5%+25.7%
MRAMRevenue+33.0%+14.6%+4.2%
EPS+340.0%−218.2%+161.5%
ALGMRevenue+23.0%+24.5%+17.2%
EPS+131.1%+93.9%+45.5%

Forward fiscal years only. Blank means no analyst coverage for that year.

Arteris sells no chips. It licenses network-on-chip interconnect — the internal plumbing that moves data between processor cores, accelerators and memory controllers inside a system-on-chip — to automotive, consumer and data-center designers, and it collects money twice: a licence fee when a customer starts a design, then a royalty on every unit shipped, often three or four years later. In the June quarter the first half of that model worked unusually well. Revenue rose 46.2% to $24.1m, the fourth consecutive quarter of acceleration from 18.3% a year earlier. Annual contract value plus royalties reached a record $99.5m, up 44%. Remaining performance obligations — contracted work not yet recognized — hit a record $135m. Management raised full-year revenue guidance to $95-98m and reiterated a target of non-GAAP operating profit by the fourth quarter.

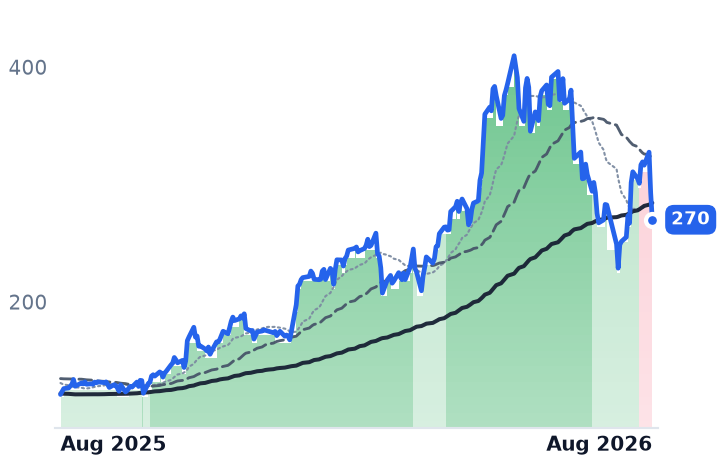
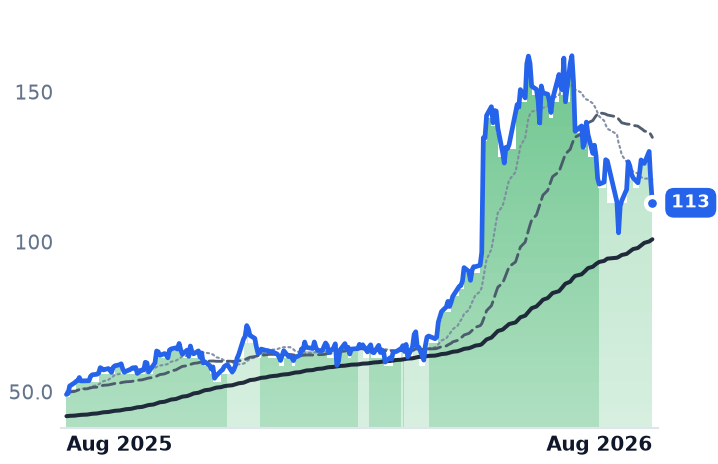
The shares have gone the other way with unusual violence. Arteris closed at an all-time high of $48.59 on 30 June and at $24.83 on 19 August — down 48.9%, the steepest fall in a group that includes Astera Labs, Arm, SanDisk and Cadence. The first leg was company-specific: a 21% single session in early July on aggressive insider selling, a disclosed CFO departure and valuation after a rally of more than 350%. The second leg was not. On 18 August a closely watched semiconductor gauge fell 5% on fears that AI infrastructure spending is peaking, the same day the 30-year Treasury yield touched 5.323%, a 19-year high.

Why duration is the whole argument

A higher long rate hurts distant cash flows most, and Arteris's cash flows are about as distant as semiconductors get. Trailing royalties were $8.6m — growing 65%, but still under 9% of the bookings base. Consensus does not show positive earnings per share until 2027. Data-center and AI infrastructure reached roughly 29% of bookings in the first half, on the back of a hyperscale cloud company standardizing on its infrastructure silicon, but those sockets pay per-unit royalties years from now.

The bear case is not demand. It is dilution and cost. The GAAP operating loss widened to $13.9m from $8.2m, gross margin slipped to 85.1% from 89.4%, and the diluted share count rose 13% to 47.3m after a $72m at-the-market equity raise struck above $35 — roughly 30% above today's price. Arteris holds $123m of cash and no debt, so runway is not the question; the question is what the equity was worth when it was sold. At 15.6x trailing gross profit the stock is well below May's roughly 23.5x, but still about 55% above the roughly 10.1x it carried in February. The de-rating has retraced two-thirds of the spring re-rating, not all of it.

What Arteris does own is position. It is the second-largest chip-infrastructure IP vendor behind Arm, with an estimated 31.3% share of interconnect IP, competing as a single-component specialist against Synopsys and Cadence, whose full design flows come bundled. No customer exceeded 10% of licence revenue in the first half — the first such period in over six months.

The same layer, with silicon attached

Rambus shows what happens when royalties are already cash. It licenses memory and interconnect IP but also sells DDR5 register clock drivers and companion chips that ship one per server memory module, and it holds roughly 40% of that market against Renesas and Montage Technology. June-quarter revenue was a record $207.4m, up 20.4%, at a 79.8% gross margin, with record product revenue of $99.2m. It guided the September quarter to $210-216m and disclosed a next-generation high-bandwidth-memory design win at a Tier 1 US hyperscaler.

It still fell 32.0% over three months, to 16.6x trailing gross profit from roughly 26.1x on 20 May — while that gross profit grew 28.3%. Over the same three months Micron rose 28.0% and SanDisk 12.7%. The companies whose modules carry Rambus's chips re-rated; the licensing layer that supplies them did not. One caveat sits under the product story: registered-DIMM bit supply is forecast to grow 15-20%, a ceiling on units no design win removes.

The setup

Where it stands — Both chip-IP licensors are compounding faster than before while their multiples compress, with the August leg driven by rates and AI-capex fear. Would confirm — Arteris exiting 2026 with bookings of $102-106m and a positive non-GAAP operating result in the fourth quarter. Would invalidate — Arteris royalties stalling near $8.6m or fresh equity issued below $25 a share. Watch next — Sarab Sinha becomes Arteris chief financial officer on 8 September; Rambus reports the September quarter in late October. Valuation — Arteris: 15.6x trailing, 14.0x forward gross profit, versus 23.5x in May and 10.1x in February; Rambus 16.6x trailing.
Bill Holdings Widened Its Take Rate on $98bn of Payments. Its Shares Fell Anyway.

Hypothesis Opus 5 · Research Opus 5 · Writing Opus 5 · Prompt v1.5

The back-office software names that were supposed to be agentic AI's first casualties have risen roughly 24% in a month. Only one of them published new numbers inside that window, and it is the one the rally left behind. Bill Holdings, a bill-payment network for small firms, moved $98bn in the June quarter and kept a wider slice of it — transaction fees grew 17% on volume up 14% — then fell 3% on a fiscal-2027 outlook of 11-14% core growth against the 16% just delivered.

The rest of the group's month is rotation. Strip 28 July, the session after Jensen Huang told investors AI agents buy software rather than replace it, and the advance halves. Workday has disclosed nothing since May and reports on 27 August. Paycom's operating margin went from 23.2% to 31.7% on cost cuts and a buyback of a fifth of the company, not on seats.

BILLWDAYPAYCADPPAYXPCTYDOCUMNDYTEAMASANAPPFWKFRSHNOWCRMINTUSAPSPYNVDAAccounts-Payable AutomationPayment Take RatesAgentic AI DisruptionPayroll & HCM SoftwareMargin Expansion & Buybacks
TickerCompanySegmentTrend · 13mo30D1Y
The subject · what this brief is about
BILLBill.comFintech & Digital Finance⚠️ Emerging Bear+7.8%+14.5%
WDAYWorkdayEnterprise Resource Planning🌱 Emerging Bull+40.6%−12.8%
PAYCPaycom SoftwareHR & Workforce Management🌱 Emerging Bull+54.0%−1.5%
Compared against · context, not the story
ADPAutomatic Data ProcessingHCM Software & Payroll🌱 Emerging Bull+12.6%−8.5%
PAYXPaychexHCM Software & Payroll🌱 Emerging Bull+10.6%−8.9%
PCTYPaylocityHR & Workforce Management🔴 Cont. Bear+20.5%−17.6%
DOCUDocuSignSpecialized Enterprise Solutions🌱 Emerging Bull+22.4%−12.6%
MNDYmonday.comOther🔴 Cont. Bear+24.9%−47.5%
TEAMAtlassianDeveloper Tools & DevOps🔴 Cont. Bear+92.3%+4.6%
ASANAsanaOther🌱 Emerging Bull+29.5%−30.0%
APPFAppFolioSpecialized Enterprise Solutions🔴 Cont. Bear+27.3%−20.1%
WKWorkivaSecurity & Compliance⚠️ Emerging Bear+37.8%−1.0%
FRSHFreshworksSecurity & Compliance🌱 Emerging Bull+22.3%−0.3%
NOWServiceNowSpecialized Enterprise Solutions🔴 Cont. Bear+24.6%−28.6%
CRMSalesforceCustomer Experience & CRM🔴 Cont. Bear+21.2%−15.9%
INTUIntuitEnterprise Resource Planning🔴 Cont. Bear+25.0%−47.8%
SAPSAPEnterprise Resource Planning🔴 Cont. Bear+39.7%−19.5%
SPYState Street SPDR S&P 500 ETF TrustAsset Management🟢 Cont. Bull+2.8%+21.5%
NVDANVIDIAAI & Data Center GPUs🟢 Cont. Bull+6.3%+25.6%

12-month price & trend

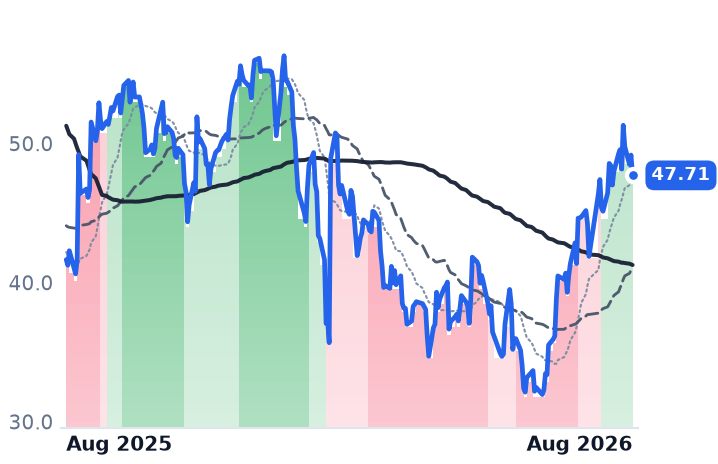
BILL
Bill.com
47.71
−1.46 (−2.97%)
vs. prior close
Price20d50d150d
BILL 12-month price
Fintech & Digital Finance
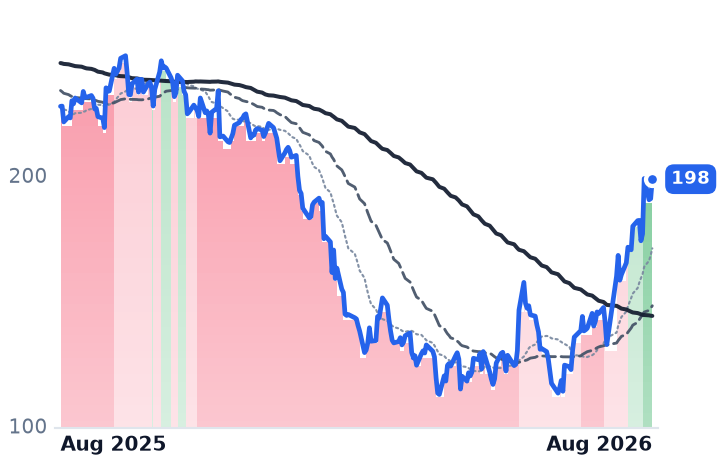
WDAY
Workday
198
+7.78 (+4.08%)
vs. prior close
Price20d50d150d
WDAY 12-month price
Enterprise Resource Planning
PAYC
Paycom Software
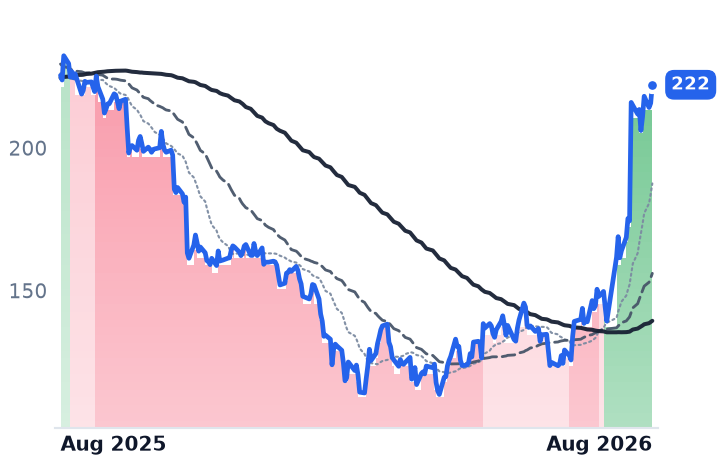
222
+6.44 (+2.99%)
vs. prior close
Price20d50d150d
PAYC 12-month price
HR & Workforce Management
TickerMkt capP/EP/E fwdP/SP/S fwdP/GPP/GP fwdEV/EBITDAFCF yld
BILL$4.8Bn/m14.2x2.9x2.6x3.6x3.2x49.9x8.9%
WDAY$52.0B61.6x18.4x5.3x4.9x7.0x6.4x33.0x5.7%
PAYC$10.0B23.6x18.4x4.7x4.5x5.8x5.7x12.0x7.5%
ADP
Automatic Data Processing
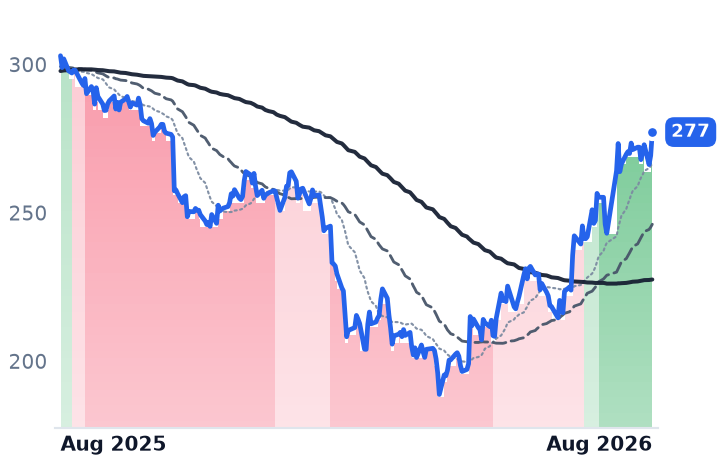
277
+7.91 (+2.94%)
vs. prior close
Price20d50d150d
ADP 12-month price
HCM Software & Payroll
PAYX
Paychex
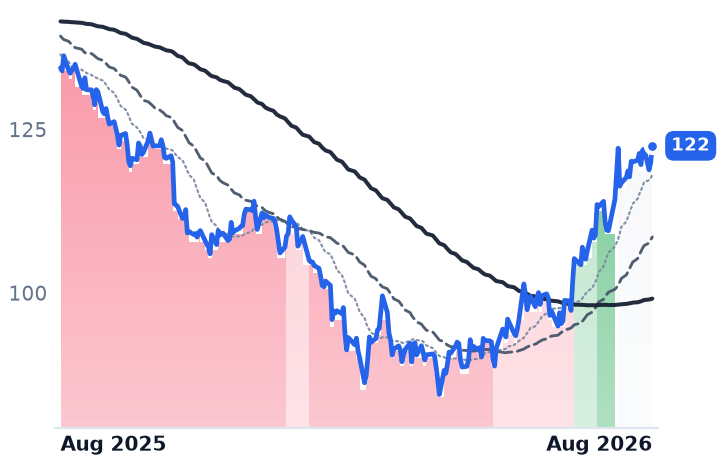
122
+2.57 (+2.14%)
vs. prior close
Price20d50d150d
PAYX 12-month price
HCM Software & Payroll
PCTY
Paylocity
149
+1.99 (+1.35%)
vs. prior close
Price20d50d150d
PCTY 12-month price
HR & Workforce Management
TickerMkt capP/EP/E fwdP/SP/S fwdP/GPP/GP fwdEV/EBITDAFCF yld
ADP$108.5B24.7x22.2x4.9x4.7x10.3x9.7x17.2x4.6%
PAYX$32.8B20.1x16.7x5.2x5.0x7.0x6.8x12.8x6.6%
PCTY$8.0B29.9x16.9x4.5x4.2x6.5x6.1x15.7x5.6%
DOCU
DocuSign
62.11
+2.10 (+3.50%)
vs. prior close
Price20d50d150d
DOCU 12-month price
Specialized Enterprise Solutions
MNDY
monday.com
91.01
+2.97 (+3.37%)
vs. prior close
Price20d50d150d
MNDY 12-month price
Other
TEAM
Atlassian
174
+11.23 (+6.89%)
vs. prior close
Price20d50d150d
TEAM 12-month price
Developer Tools & DevOps
TickerMkt capP/EP/E fwdP/SP/S fwdP/GPP/GP fwdEV/EBITDAFCF yld
DOCU$11.5B38.4x13.3x3.5x3.3x4.4x4.1x17.2x9.7%
MNDY$4.7B39.8x20.3x3.6x3.2x4.1x3.6x51.1x6.4%
TEAM$44.8Bn/m28.0x6.8x6.1x8.0x7.2x296.5x2.9%
ASAN
Asana
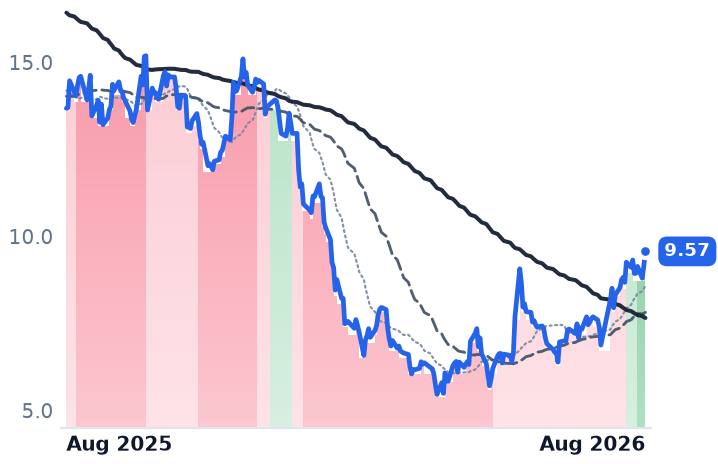
9.57
+0.41 (+4.48%)
vs. prior close
Price20d50d150d
ASAN 12-month price
Other
APPF
AppFolio
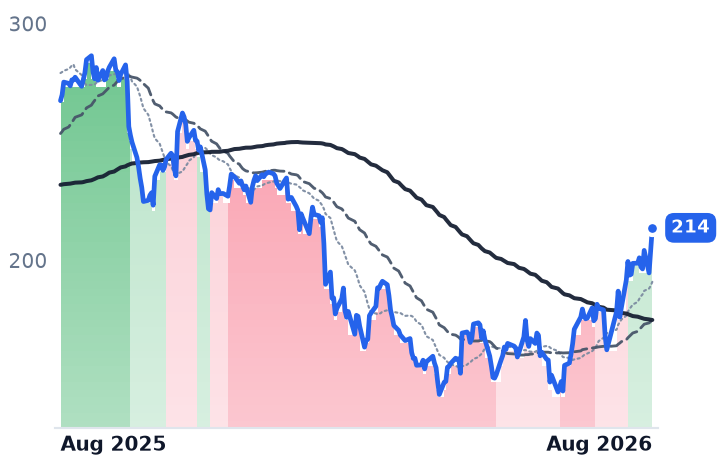
214
+9.79 (+4.80%)
vs. prior close
Price20d50d150d
APPF 12-month price
Specialized Enterprise Solutions
WK
Workiva
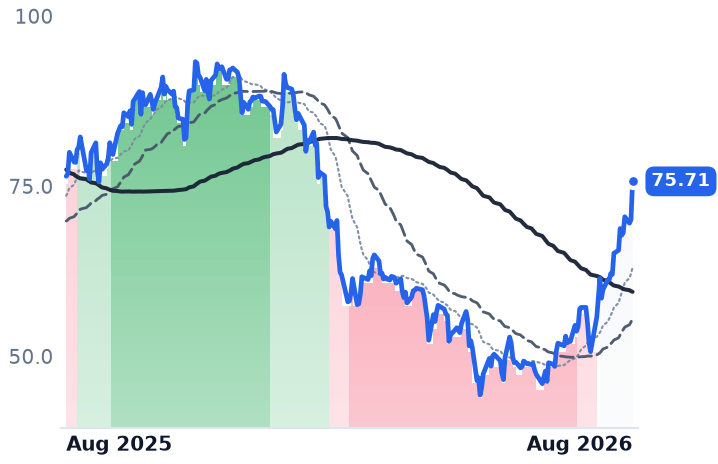
75.71
+5.61 (+8.00%)
vs. prior close
Price20d50d150d
WK 12-month price
Security & Compliance
TickerMkt capP/EP/E fwdP/SP/S fwdP/GPP/GP fwdEV/EBITDAFCF yld
ASAN$1.9Bn/m22.0x2.4x2.3x2.7x2.6xn/m5.8%
APPF$7.7B48.8x31.2x7.4x6.8x11.7x10.9x36.2x3.5%
WK$2.7B189.9x16.3x2.9x2.6x3.6x3.2x95.9x6.5%
FRSH
Freshworks
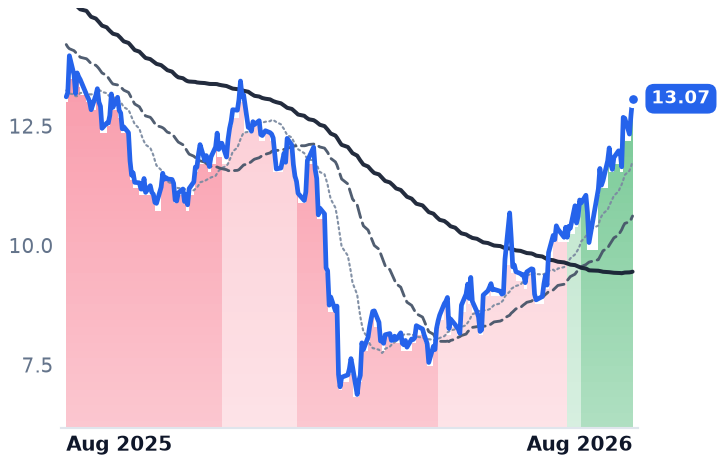
13.07
+0.34 (+2.67%)
vs. prior close
Price20d50d150d
FRSH 12-month price
Security & Compliance
NOW
ServiceNow
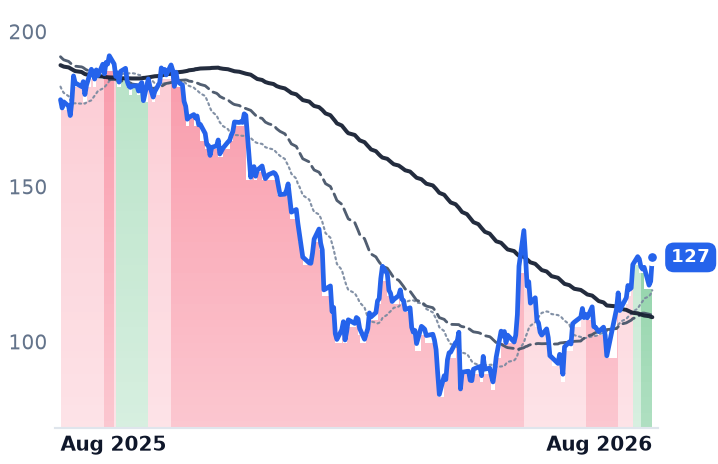
127
+7.71 (+6.45%)
vs. prior close
Price20d50d150d
NOW 12-month price
Specialized Enterprise Solutions
CRM
Salesforce
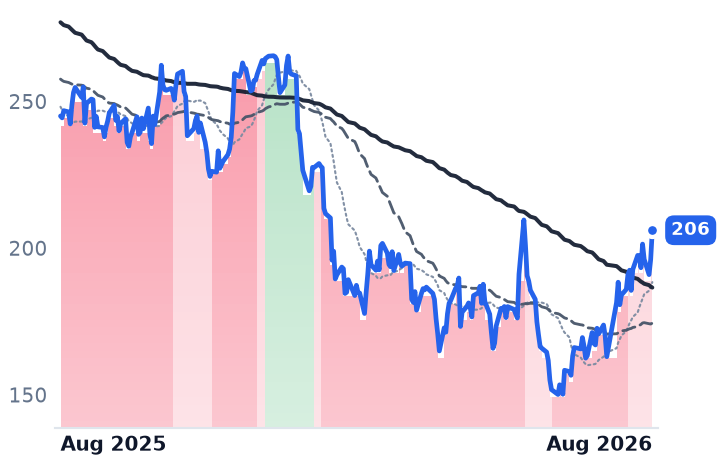
206
+9.95 (+5.07%)
vs. prior close
Price20d50d150d
CRM 12-month price
Customer Experience & CRM
TickerMkt capP/EP/E fwdP/SP/S fwdP/GPP/GP fwdEV/EBITDAFCF yld
FRSH$3.5B19.3x19.0x3.9x3.6x4.6x4.3x39.0x7.1%
NOW$121.7B73.1x28.9x8.3x7.5x11.0x10.0x36.6x3.8%
CRM$160.7B22.6x13.9x3.8x3.5x4.8x4.5x13.8x9.1%
INTU
Intuit
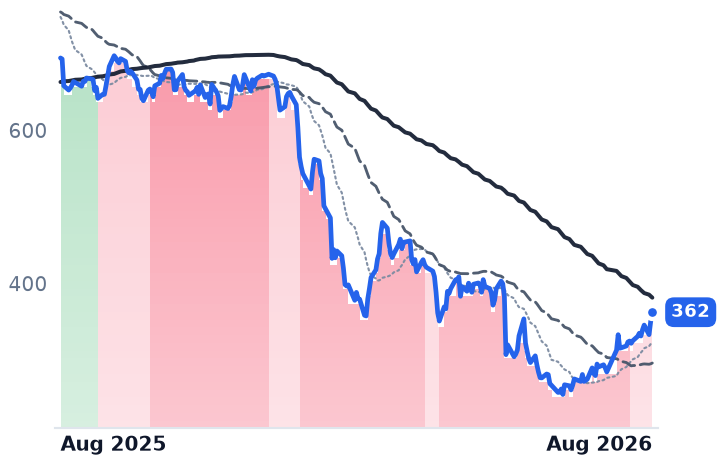
362
+12.06 (+3.44%)
vs. prior close
Price20d50d150d
INTU 12-month price
Enterprise Resource Planning
SAP
SAP
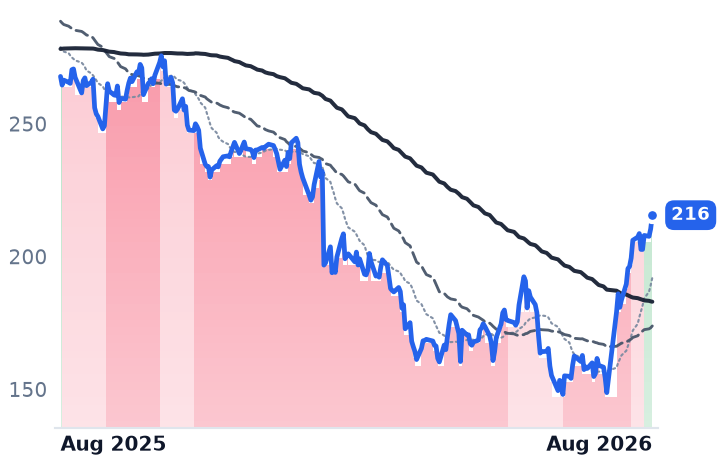
216
+5.13 (+2.44%)
vs. prior close
Price20d50d150d
SAP 12-month price
Enterprise Resource Planning
SPY
State Street SPDR S&P 500 ETF Trust
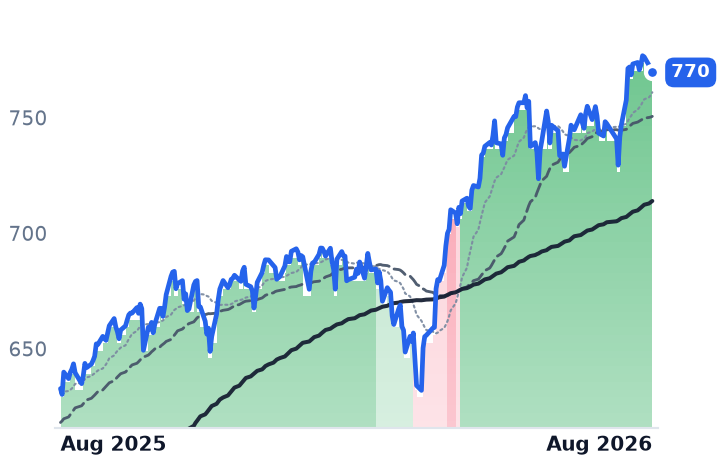
769
+1.61 (+0.21%)
vs. prior close
Price20d50d150d
SPY 12-month price
Asset Management
TickerMkt capP/EP/E fwdP/SP/S fwdP/GPP/GP fwdEV/EBITDAFCF yld
INTU$89.0B19.7x11.9x4.3x3.7x5.2x4.6x13.0x8.7%
SAP$217.1B23.7x26.1x5.0x5.4x6.8x7.4x12.8x4.6%
SPY$773.0B
NVDA
NVIDIA
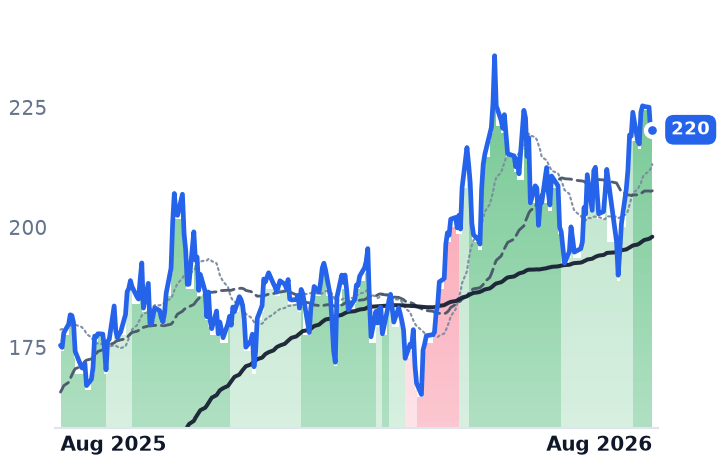
220
+0.57 (+0.26%)
vs. prior close
Price20d50d150d
NVDA 12-month price
AI & Data Center GPUs
TickerMkt capP/EP/E fwdP/SP/S fwdP/GPP/GP fwdEV/EBITDAFCF yld
NVDA$5.5T34.3x25.0x21.5x13.9x29.0x18.7x28.3x2.2%

Consensus projections

TickerFY2026EFY2027EFY2028E
BILLRevenue+13.2%+12.2%+12.0%
EPS+26.0%+27.2%+20.5%
WDAYRevenue+13.4%+11.8%+11.0%
EPS+26.5%+18.6%+17.3%
PAYCRevenue+7.7%+7.1%+8.4%
EPS+30.8%+14.6%+9.8%
ADPRevenue+7.0%+5.9%+5.7%
EPS+11.0%+10.6%+9.3%
PAYXRevenue+16.5%+5.4%+5.4%
EPS+10.1%+7.6%+6.5%
PCTYRevenue+11.1%+7.5%+7.6%
EPS+15.4%+9.0%+9.7%
DOCURevenue+8.4%+8.9%+7.6%
EPS+6.9%+19.5%+12.6%
MNDYRevenue+19.8%+16.1%+16.1%
EPS+7.0%+21.4%+10.9%
TEAMRevenue+24.7%+13.4%+15.9%
EPS+55.5%+10.5%+18.0%
ASANRevenue+9.2%+8.9%+7.9%
EPS−272.8%+45.4%+26.1%
APPFRevenue+18.5%+17.3%+17.8%
EPS+33.8%+22.1%+24.5%
WKRevenue+17.9%+15.6%+17.5%
EPS+77.9%+20.3%+33.4%
FRSHRevenue+15.6%+14.2%+15.6%
EPS+4.9%+23.5%+20.5%
NOWRevenue+22.4%+18.7%+18.6%
EPS+17.1%+23.2%+21.4%
CRMRevenue+9.3%+11.1%+9.4%
EPS+17.4%+20.2%+10.4%
INTURevenue+13.9%+11.3%+10.8%
EPS+18.5%+15.0%+12.6%
SAPRevenue+9.3%+11.6%+12.1%
EPS+18.7%+17.0%+18.3%
NVDARevenue+65.1%+84.2%+43.2%
EPS+59.0%+91.7%+42.0%

Forward fiscal years only. Blank means no analyst coverage for that year.

Bill Holdings runs the plumbing small American companies use to pay their suppliers — accounts-payable and receivable automation, sold largely through accounting firms — and it reported the June quarter on Wednesday evening. Payment volume reached $98bn, up 14% year over year across 37 million transactions. The more interesting figure is the sliver it keeps. Transaction fees grew 17%, faster than volume, so the implied take rate widened to roughly 33.1 basis points from about 32.3bp a year earlier.

Take-rate compression is the standard bear case on payment networks. This was the reverse. Underneath, subscription fees were $76.2m, transaction fees $324.3m and float revenue — interest on customer money in transit — $35.7m, which makes float about 8% of the line and transactions, not seats, the engine. Core revenue rose 16% to $400.5m and non-GAAP operating income rose 80% to $101.6m, with adjusted earnings of $0.84 a share against a $0.71 consensus. The shares fell 3.0% — the only one of thirteen back-office and workflow software names down that session. The stated reason was the outlook: fiscal 2027 core revenue of $1.669-1.719bn, or 11-14% growth, a step down from the 16% just delivered.

The month was one session

That matters because of what the rest of the group did on no numbers at all. Averaged across thirteen names — Workday, Paycom, Bill, ADP, Paychex, Paylocity, DocuSign, Monday.com, Atlassian, Asana, AppFolio, Workiva and Freshworks — the month to 19 August produced a 23.5% gain against 3.6% for the S&P 500 tracker. Nearly all of it arrived twice. On 28 July every one of the ten members with price data rose between 8.7% and 20.6% while the index was flat, after Nvidia's Jensen Huang told investors that AI agents increase demand for software tools rather than replace them. Remove that day and the group's month is 10.7%. Remove Atlassian's 7 August earnings session too and it is 4.9%, with five of the thirteen negative.

Workday, which sells human-capital, financial and spend management software to large enterprises, gained 34.8% in that month having disclosed nothing since 21 May; it does not report until after the close on 27 August. The last numbers it published were good ones — 12-month subscription backlog up 15.5% to $8.806bn, ahead of subscription revenue growth of 14.3%, with total backlog up 10.9% to $27.294bn — and operating margin has widened from 1.7% to 13.3% across four quarters. Backlog growing faster than revenue is the single cleanest rebuttal to the claim that AI agents are eating enterprise seats. It is also three months old.

Paycom, which sells the same category of software to mid-sized American employers at a price per employee per month, is the group's clearest case of profit without volume. Revenue grew 9.8% to $531.2m last quarter; operating income rose 50%, lifting margin from 23.2% to 31.7%, on more than $100m of annual research savings from its own automation and a $30m cut in third-party AI token fees. It bought back a fifth of the company for $1.4bn this year, taking diluted shares from 56.3m to 45.9m. Management said client employment was stable with no acceleration — and US nonfarm payrolls actually fell by 23,000 in July, which is the denominator for every per-employee biller here. Consensus has Paycom earnings growing 30.8% this year on revenue growth of 7.7%.

One premise worth retiring: interest on client payroll balances is not a headwind. Paycom's guide includes about $105m of interest on funds held for clients, on average daily balances of roughly $2.9bn, up 9%, and the Federal Reserve held at 3.50-3.75% on 29 July with three dissenters preferring a hike.

What the prices now assume

Because Bill runs a GAAP loss, earnings multiples are useless for comparison; gross margins across the three run 76-83%, so price against trailing gross profit is the usable common measure. Workday has gone from 4.61x in mid-May to 6.76x, against 9.17x a year ago — half the de-rating recovered before the confirming print. Paycom has gone from 4.23x to 5.95x against 7.94x, at 18.4x forward earnings and a 7.5% free-cash-flow yield, on 7-8% guided revenue growth. Bill sits at 3.49x, versus 3.04x in May and 3.58x a year ago: no dearer than before the sector's trough, despite gross profit compounding 12.4%, at 14.2x forward earnings and an 8.9% free-cash-flow yield.

The trend has, in fact, turned. Seven of the thirteen — including Workday and Paycom — ended 19 August with their 50-day average above the 200-day, after bearish readings in May. The twelve-month picture is still ugly: the group is down 11.5% on average, Monday.com by 48.3%. What separates Bill is that its moat is not a seat. Payments cannot be routed around money-transmitter licensing, know-your-customer and anti-money-laundering compliance, or bank partnerships, and rivals are arriving by function rather than scale — Ramp and Brex pushing from corporate cards into payables, Tipalti in global mass payments, Melio in small-business bill pay. Automation there adds throughput rather than removing billable units.

The setup

Where it stands — Bill delivered the group's only new numbers and was the only member sold on them; Workday and Paycom rallied on a rotation and a buyback. Would confirm — Take rate holding above 33bp with payment volume growth at or above 14% in the September quarter. Would invalidate — Core revenue growth falling toward the low end of the 11-14% guide, or net customer adds below the ~1,800 just posted. Watch next — Workday reports fiscal second-quarter results after the close on 27 August; 12-month backlog growth above 15% is the test. Valuation — Bill at 3.49x trailing gross profit and 14.2x forward earnings, against 3.04x in May and 3.58x a year ago.

Fabrinet Grew 45% Last Quarter at a 12% Gross Margin, and Investors Sold the Margin

Hypothesis Opus 5 · Research Opus 5 · Writing Opus 5 · Prompt v1.5

Fabrinet reported the best quarter in its history on 17 August and lost a fifth of its market value the next session — the steepest one-day fall on a 110-name watchlist. The businesses that move data between AI chips are not slowing: Fabrinet's revenue growth accelerated for four straight quarters to 44.6%, Ciena's backlog rose past $7.7bn, and Corning's Optical Communications sales grew 32% to $2.07bn with three hyperscaler supply agreements signed this year.

What broke was the price, not the demand. The group had rallied in early August on a reported US move to ban new Chinese transceiver imports, then gave it all back alongside a soft Anthropic revenue figure and a 19-year high in long-bond yields. Fabrinet now trades at 29x trailing gross profit against roughly 48x in May — but its gross margin, at 11.99% for the year, did not budge as revenue grew 36%.

FNCIENGLWCOHRLITEAAOICRDOAPHPOETMRVLAXTIMTSIAMKRNVDAMETAAMZNCSCONOKOptical Transceiver SupplyContract Manufacturing MarginsAI Data-Center InterconnectCoherent Optical TransportFiber & Connectivity GlassChina Component Restrictions
TickerCompanySegmentTrend · 13mo30D1Y
The subject · what this brief is about
FNFabrinetSpecialty Manufacturing & Components⚠️ Emerging Bear−13.8%+62.1%
CIENCienaOptical Transport & Switching🟢 Cont. Bull−2.3%+361.1%
GLWCorningDisplay & Optical Materials🟢 Cont. Bull−6.1%+138.2%
Compared against · context, not the story
COHRCoherentInstrumentation & Test Equipment🟢 Cont. Bull−9.4%+232.1%
LITELumentumOptical Transport & Switching🟢 Cont. Bull−1.2%+614.1%
AAOIApplied OptoelectronicsRF & Wireless🟢 Cont. Bull+2.5%+457.2%
CRDOCredo TechnologyOptical Transport & Switching🟢 Cont. Bull+4.9%+121.5%
APHAmphenolConnectors & Interconnect Systems🟢 Cont. Bull−1.1%+44.4%
POETPOET TechnologiesDiscrete & Power🟢 Cont. Bull+0.8%+70.9%
MRVLMarvell TechnologySpecialty Semiconductors🟢 Cont. Bull+14.1%+233.8%
AXTIAXTDiscrete & Power🟢 Cont. Bull+29.9%+2825.5%
MTSIMACOM Technology SolutionsRF & Wireless🟢 Cont. Bull−4.6%+122.8%
AMKRAmkor TechnologyPackaging & Assembly🟢 Cont. Bull−23.7%+122.9%
NVDANVIDIAAI & Data Center GPUs🟢 Cont. Bull+6.3%+25.6%
METAMeta PlatformsSocial Media & Messaging🔴 Cont. Bear−14.1%−25.8%
AMZNAmazon.comOnline Marketplaces🟢 Cont. Bull+6.9%+18.2%
CSCOCisco SystemsEnterprise Networking Infrastructure🟢 Cont. Bull−1.5%+67.5%
NOKNokia OyjOptical Transport & Switching🟢 Cont. Bull−4.7%+138.9%

12-month price & trend

FN
Fabrinet
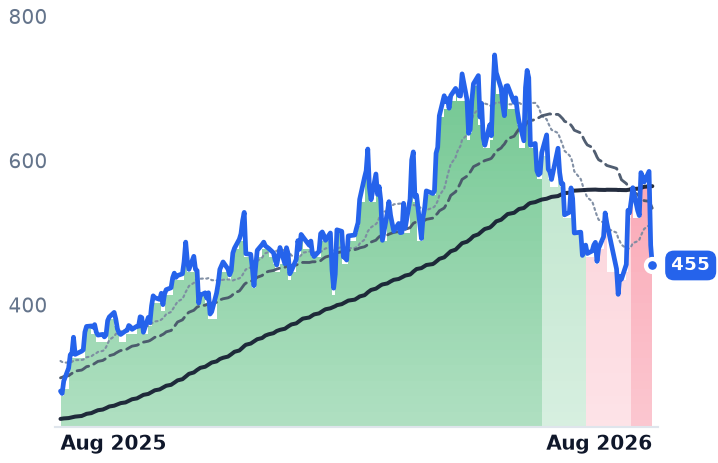
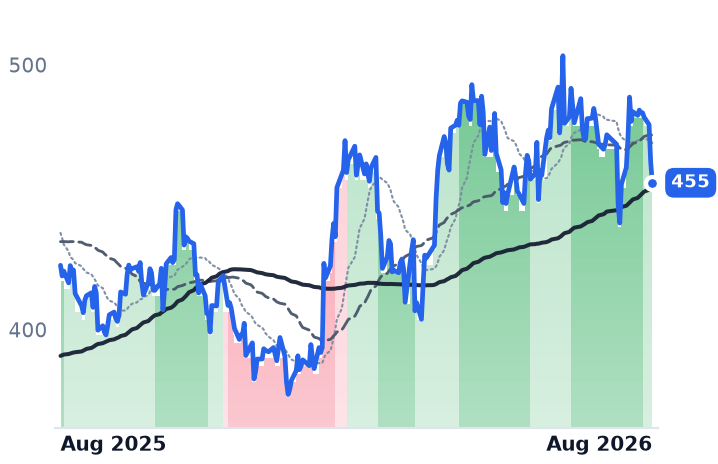
455
−28.04 (−5.81%)
vs. prior close
Price20d50d150d
FN 12-month price
Specialty Manufacturing & Components
CIEN
Ciena
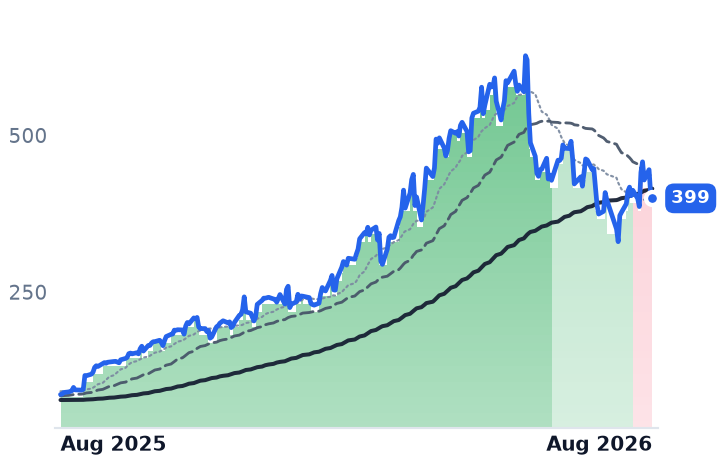
399
−6.07 (−1.50%)
vs. prior close
Price20d50d150d
CIEN 12-month price
Optical Transport & Switching
GLW
Corning
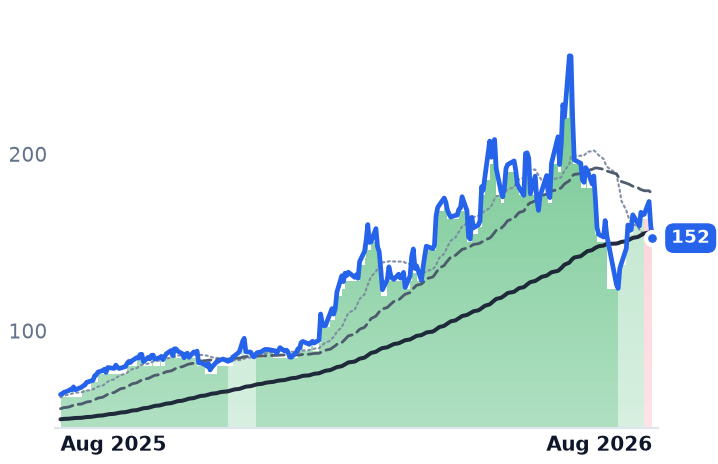
152
−7.44 (−4.65%)
vs. prior close
Price20d50d150d
GLW 12-month price
Display & Optical Materials
TickerMkt capP/EP/E fwdP/SP/S fwdP/GPP/GP fwdEV/EBITDAFCF yld
FN$16.3B34.4x26.4x3.5x2.9x29.3x23.9x28.7x0.0%
CIEN$56.5B129.3x61.1x10.2x8.9x23.6x20.8x78.1x1.5%
GLW$131.4B69.0x46.7x7.7x6.8x21.3x18.8x35.4x1.8%
COHR
Coherent
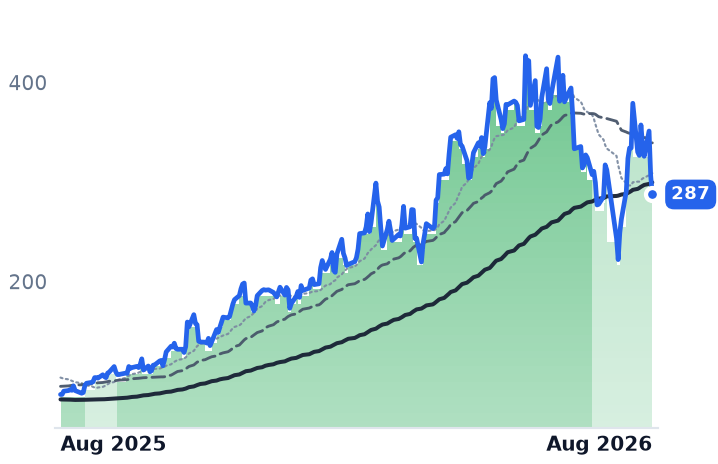
287
−18.96 (−6.19%)
vs. prior close
Price20d50d150d
COHR 12-month price
Instrumentation & Test Equipment
LITE
Lumentum
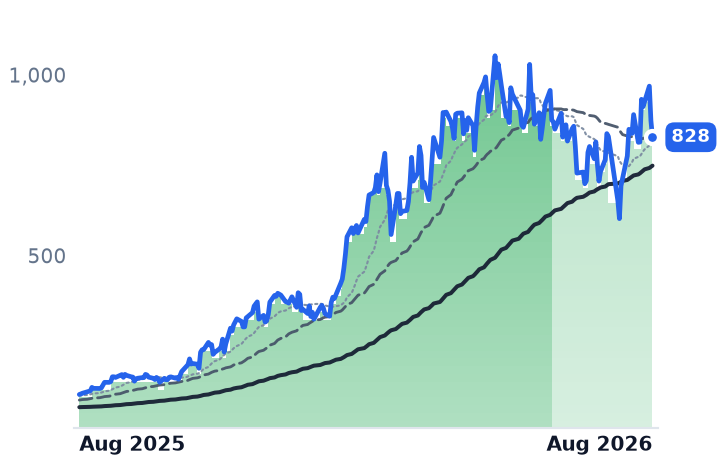
828
−45.71 (−5.23%)
vs. prior close
Price20d50d150d
LITE 12-month price
Optical Transport & Switching
AAOI
Applied Optoelectronics
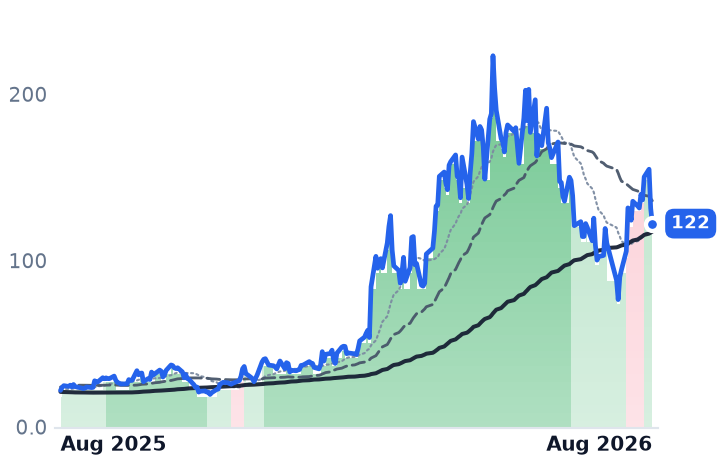
122
−9.22 (−7.02%)
vs. prior close
Price20d50d150d
AAOI 12-month price
RF & Wireless
TickerMkt capP/EP/E fwdP/SP/S fwdP/GPP/GP fwdEV/EBITDAFCF yld
COHR$68.7B80.7x42.0x9.7x7.1x25.7x18.9x53.7x-85.8%
LITE$75.4Bn/m52.1x25.0x13.3x60.0x31.9xn/m0.7%
AAOI$12.4Bn/m149.9x20.9x11.9x72.1x41.3xn/m-3.3%
CRDO
Credo Technology
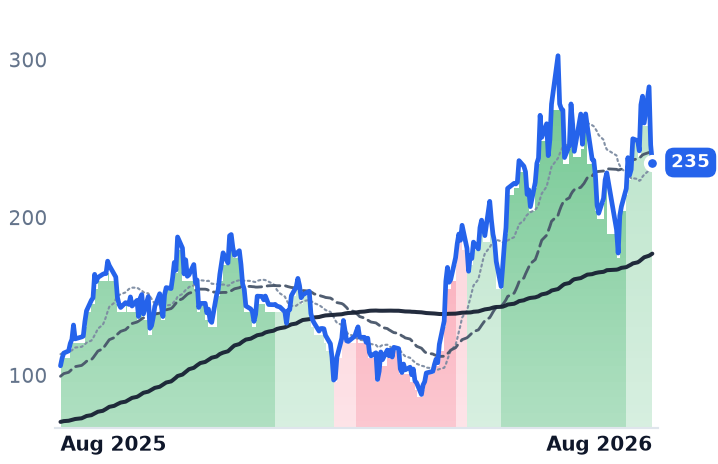
235
−11.15 (−4.53%)
vs. prior close
Price20d50d150d
CRDO 12-month price
Optical Transport & Switching
APH
Amphenol
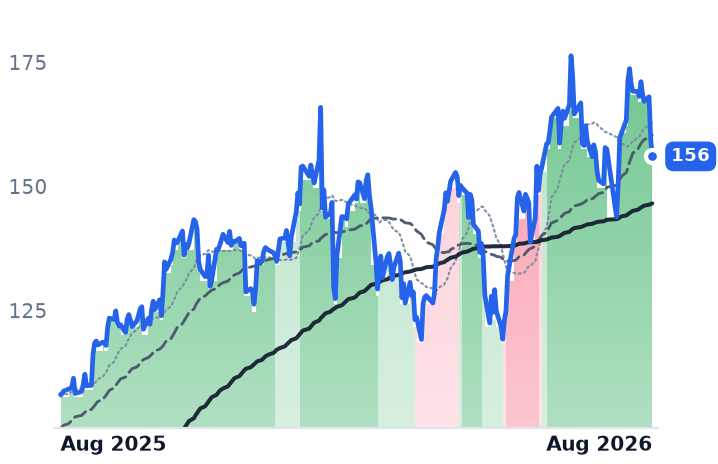
156
−3.53 (−2.21%)
vs. prior close
Price20d50d150d
APH 12-month price
Connectors & Interconnect Systems
POET
POET Technologies
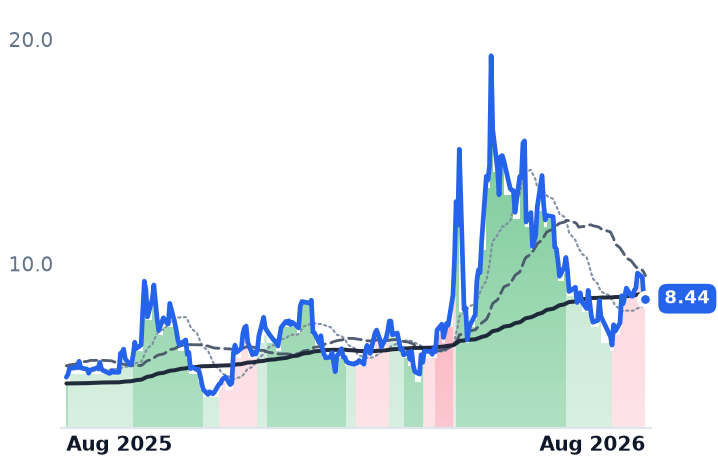
8.44
−0.04 (−0.47%)
vs. prior close
Price20d50d150d
POET 12-month price
Discrete & Power
TickerMkt capP/EP/E fwdP/SP/S fwdP/GPP/GP fwdEV/EBITDAFCF yld
CRDO$52.7B107.9x46.2x39.5x21.6x58.1x31.8x101.1x0.8%
APH$206.0B39.8x31.7x7.1x5.8x18.4x15.2x23.5x2.3%
POET$1.2Bn/m724.4x137.5xn/m-3.3%
MRVL
Marvell Technology
237
+21.27 (+9.85%)
vs. prior close
Price20d50d150d
MRVL 12-month price
Specialty Semiconductors
AXTI
AXT
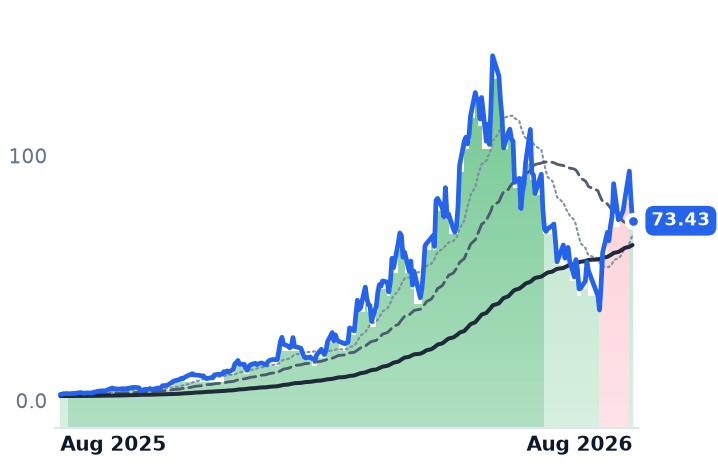
73.43
−8.88 (−10.79%)
vs. prior close
Price20d50d150d
AXTI 12-month price
Discrete & Power
MTSI
MACOM Technology Solutions
270
−22.89 (−7.82%)
vs. prior close
Price20d50d150d
MTSI 12-month price
RF & Wireless
TickerMkt capP/EP/E fwdP/SP/S fwdP/GPP/GP fwdEV/EBITDAFCF yld
MRVL$230.5B92.0x65.3x26.4x20.1x52.2x39.7x50.5x0.7%
AXTI$4.5B103.5x35.8x20.6x111.3x64.1x342.4x-0.6%
MTSI$20.6B84.4x53.7x17.7x16.3x31.3x28.9x60.0x0.6%
AMKR
Amkor Technology
50.89
−3.95 (−7.20%)
vs. prior close
Price20d50d150d
AMKR 12-month price
Packaging & Assembly
NVDA
NVIDIA
220
+0.57 (+0.26%)
vs. prior close
Price20d50d150d
NVDA 12-month price
AI & Data Center GPUs
META
Meta Platforms
553
+9.51 (+1.75%)
vs. prior close
Price20d50d150d
META 12-month price
Social Media & Messaging
TickerMkt capP/EP/E fwdP/SP/S fwdP/GPP/GP fwdEV/EBITDAFCF yld
AMKR$12.6B22.7x20.5x1.7x1.7x10.9x10.6x9.8x4.1%
NVDA$5.5T34.3x25.0x21.5x13.9x29.0x18.7x28.3x2.2%
META$1.5T21.9x18.4x6.6x5.9x8.1x7.2x14.9x2.7%
AMZN
Amazon.com
265
+5.20 (+2.00%)
vs. prior close
Price20d50d150d
AMZN 12-month price
Online Marketplaces
CSCO
Cisco Systems
111
−1.06 (−0.95%)
vs. prior close
Price20d50d150d
CSCO 12-month price
Enterprise Networking Infrastructure
NOK
Nokia Oyj
10.13
−0.26 (−2.50%)
vs. prior close
Price20d50d150d
NOK 12-month price
Optical Transport & Switching
TickerMkt capP/EP/E fwdP/SP/S fwdP/GPP/GP fwdEV/EBITDAFCF yld
AMZN$2.8T20.8x22.4x3.6x3.4x7.2x6.7x11.7x-0.4%
CSCO$439.9B33.2x23.3x6.9x6.4x10.8x9.9x23.1x3.1%
NOK$75.3B64.5x40.9x3.3x3.5x7.5x8.0x31.3x2.1%

Consensus projections

TickerFY2026EFY2027EFY2028E
FNRevenue+35.6%+23.6%+21.3%
EPS+36.0%+24.7%+24.0%
CIENRevenue+34.5%+27.0%+27.2%
EPS+160.2%+47.6%+48.1%
GLWRevenue+17.5%+18.7%+21.0%
EPS+29.6%+31.7%+36.5%
COHRRevenue+21.9%+37.7%+38.2%
EPS+55.9%+53.4%+58.4%
LITERevenue+83.9%+89.0%+54.6%
EPS+314.0%+125.9%+58.9%
AAOIRevenue+129.8%+169.3%+48.7%
EPS−417.3%+454.2%+102.6%
CRDORevenue+211.9%+83.3%+49.4%
EPS+423.2%+85.0%+47.8%
APHRevenue+54.2%+17.7%+12.2%
EPS+59.4%+22.0%+13.0%
POETRevenue+684.9%+609.0%+1.6%
EPS−8.9%−41.2%−113.3%
MRVLRevenue+42.4%+40.1%+44.0%
EPS+82.6%+41.9%+51.9%
AXTIRevenue+140.9%+111.3%+47.0%
EPS−306.1%+158.9%+48.5%
MTSIRevenue+30.6%+26.8%+16.3%
EPS+44.9%+37.9%+21.7%
AMKRRevenue+14.7%+12.0%+10.8%
EPS+96.6%+7.9%+24.7%
NVDARevenue+65.1%+84.2%+43.2%
EPS+59.0%+91.7%+42.0%
METARevenue+27.3%+19.9%+17.9%
EPS+39.6%+7.2%+15.8%
AMZNRevenue+15.7%+14.0%+15.9%
EPS+63.6%−10.9%+30.2%
CSCORevenue+11.1%+9.3%+6.8%
EPS+12.9%+11.9%+10.2%
NOKRevenue+7.6%+5.8%+6.1%
EPS+32.8%+17.9%+14.3%

Forward fiscal years only. Blank means no analyst coverage for that year.

Fabrinet, a Thailand-based contract manufacturer that assembles optical transceivers, tunable lasers and switching modules to other companies' designs, closed its fiscal year with revenue of $4.64bn. That was growth of 35.7%. Its gross margin for the year was 11.99%, against 12.09% the year before — scale, in this business, buys volume but not price.

That single line explains more about the past week in optical networking than any demand datapoint. Fabrinet's fiscal fourth quarter, reported on 17 August, set a revenue record at $1.32bn, up 45% and above its own guidance, with non-GAAP earnings of $4.10 a share against $2.65 a year earlier. Management then guided the current quarter to $1.375-1.425bn, above the $1.321bn consensus. The shares fell 20.25% the next day, the largest single-session decline across a 110-name list of AI hardware suppliers, and pulled the rest of the optics complex down with them.

Build-to-print has no operating leverage

Fabrinet does not own the designs it builds. It qualifies processes, then manufactures at the margin its customers permit, and its fiscal 2026 annual report discloses four customers at 10% or more of revenue — Cisco at 20%, NVIDIA 16%, Nokia 11% and Amazon 11%, or 57.4% between them. Revenue growth accelerated through the year, from 21.6% to 44.6%, while gross profit stayed pinned near a twelfth of it. Chief executive Seamus Grady told the call he sees "no end in sight" to data-center demand. Consensus nonetheless models fiscal 2027 revenue growth of 23.6%, a marked step down.

The systems and the glass tell a different story

Ciena, which sells coherent optical transport platforms and network software to carriers and, increasingly, to cloud operators, is the counterweight. April-quarter revenue rose 39.5% to $1.57bn, operating margin reached 15.1% against 3.1% a year earlier, and backlog climbed more than $600m sequentially to $7.7bn as the company raised its full-year outlook to about $6.3bn. Roughly 46% of revenue now comes from cloud and hyperscale customers.

Corning is not an optics pure-play but a materials group spanning display glass, ceramics, solar and labware. Its Optical Communications sales rose 32% to $2.07bn in the June quarter, with segment net income up 77% to $438m and enterprise optical — the data-center line — up 65% to $1.27bn. It has signed long-term agreements with Meta, worth up to $6bn, plus NVIDIA and Amazon, and will expand US optical connectivity capacity tenfold under the NVIDIA deal. Management says the margin gains come from connectivity design, not fiber pricing, and that demand still exceeds supply. Its weak spots are elsewhere: solar lost $7m on a plant shutdown, and glass for handsets grew 1%.

What actually moved

On 4 August, reports that the Federal Communications Commission was drafting a ban on imports of new Chinese optical transceiver models added 8-16% to these names in a session; Counterpoint Research put the loser at China's Innolight, near 27% share. Between 17 and 19 August that rally reversed entirely — Fabrinet down 22.3%, Corning 12.0%, Ciena 10.3% — helped by Anthropic's reported $65bn revenue run rate against an $80bn expectation and a 30-year Treasury yield at 5.323%, a 19-year high.

On price to trailing gross profit — the honest lens for a thin-margin assembler and a mixed conglomerate alike — Fabrinet has fallen from about 48x in mid-May to 29.3x, Ciena from 35.5x to 23.6x, Corning from 25.6x to 21.3x. In all three cases trailing gross profit was still growing. The caveat is the anchor: over twelve months Ciena remains up 350%, Corning 136% and Fabrinet 59%. This is a de-rating from an extreme. Co-packaged optics, the structural bear case, is not the cause — LightCounting and Cignal AI both expect no material displacement of pluggable modules for three years, and Corning frames inside-the-box photonics as a $10bn platform where it currently has no content at all.

Fabrinet's downtrend predates the print: its 50-day average crossed below its 200-day in early July. Corning and Ciena only turned in mid-August, after the businesses reported.

The setup

Where it stands — Three interconnect suppliers with accelerating revenue have de-rated by a third or more since May on multiples, not results. Would confirm — Fabrinet's October quarter landing inside its $1.375-1.425bn guide with gross margin at or above 12%. Would invalidate — Ciena reporting backlog below $7.7bn, or Corning trimming its Optical Communications growth outlook. Watch next — Ciena's fiscal third quarter, before the US open on 3 September 2026. Valuation — Fabrinet at 29.3x trailing gross profit and 23.9x forward, against roughly 48x in mid-May.

EnerSys Won 80% More Data-Center Orders. A Third of Its Profit Is a Tax Credit

Hypothesis Opus 5 · Research Opus 5 · Writing Opus 5 · Prompt v1.5

EnerSys, which supplies the battery systems behind data-center uninterruptible power supplies and forklift fleets, reported data-center orders up 80% from a year earlier on 13 August, with operating income up 75% and a book-to-bill above one. The shares are down 18% over three months. The catch sits inside the earnings: adjusted profit was $3.66 a share, and $2.41 without the Section 45X manufacturing credit — and next quarter's guidance leans on the credit harder, not less.

The five smaller names filed alongside it are not one business. Most of the past month's damage is two stories with dates on them: Enovix lost its chief executive to another company, and T1 Energy — a solar manufacturer, not a storage one — disclosed a cost overrun at its Texas cell fab. Meanwhile US utility-scale battery additions are set to rise from 15 GW in 2025 to roughly 24 GW this year. Demand is not what broke.

ENSEOSEENVXAMPXTESLDPFLNCVRTSTEMRUNSHLSGEVPWRNEESPYData-Center Backup PowerSection 45X CreditsLithium Versus Lead-AcidUtility-Scale Storage BuildoutSilicon-Anode Cell MakersDomestic Solar Manufacturing
TickerCompanySegmentTrend · 13mo30D1Y
The subject · what this brief is about
ENSEnerSysEnergy Storage & Batteries🟢 Cont. Bull−3.7%+99.8%
EOSEEos Energy EnterprisesEnergy Storage & Batteries⚠️ Emerging Bear−11.8%−37.6%
ENVXEnovixEnergy Storage & Batteries🔴 Cont. Bear−29.5%−66.3%
Compared against · context, not the story
AMPXAmprius TechnologiesEnergy Storage & Batteries⚠️ Emerging Bear−2.3%+57.7%
TET1 EnergyEnergy Storage & Batteries🟢 Cont. Bull−25.4%+242.1%
SLDPSolid PowerEnergy Storage & Batteries⚠️ Emerging Bear−1.7%−43.7%
FLNCFluence EnergyEnergy Storage Systems⚠️ Emerging Bear−21.0%+61.4%
VRTVertivData Center Power & Thermal🟢 Cont. Bull−14.3%+104.8%
STEMStemSoftware - Infrastructure⚠️ Emerging Bear−8.4%−65.0%
RUNSunrunResidential Solar Installers⚠️ Emerging Bear−14.3%−36.7%
SHLSShoals TechnologiesSolar System Components🟢 Cont. Bull−23.4%+29.3%
GEVGE VernovaGE Vernova Integrated🟢 Cont. Bull−8.5%+63.6%
PWRQuanta ServicesElectrical & Power Infrastructure🟢 Cont. Bull+6.0%+80.4%
NEENextEra EnergyVertically Integrated Utilities⚠️ Emerging Bear−2.2%+15.3%
SPYState Street SPDR S&P 500 ETF TrustAsset Management🟢 Cont. Bull+2.8%+21.5%

12-month price & trend

ENS
EnerSys
194
−6.61 (−3.30%)
vs. prior close
Price20d50d150d
ENS 12-month price
Energy Storage & Batteries
EOSE
Eos Energy Enterprises
3.74
+0.07 (+1.91%)
vs. prior close
Price20d50d150d
EOSE 12-month price
Energy Storage & Batteries
ENVX
Enovix
3.40
+0.27 (+8.45%)
vs. prior close
Price20d50d150d
ENVX 12-month price
Energy Storage & Batteries
TickerMkt capP/EP/E fwdP/SP/S fwdP/GPP/GP fwdEV/EBITDAFCF yld
ENS$7.1B20.3x14.7x1.9x1.8x6.1x5.9x13.0x10.1%
EOSE$1.1Bn/m5.1x3.5xn/m-38.9%
ENVX$741.7Mn/m20.7x18.3xn/m-16.7%
AMPX
Amprius Technologies
10.63
−0.08 (−0.75%)
vs. prior close
Price20d50d150d
AMPX 12-month price
Energy Storage & Batteries
TE
T1 Energy
4.55
−0.10 (−2.15%)
vs. prior close
Price20d50d150d
TE 12-month price
Energy Storage & Batteries
SLDP
Solid Power
2.32
+0.06 (+2.65%)
vs. prior close
Price20d50d150d
SLDP 12-month price
Energy Storage & Batteries
TickerMkt capP/EP/E fwdP/SP/S fwdP/GPP/GP fwdEV/EBITDAFCF yld
AMPX$1.5Bn/m13.8x11.1x61.9x49.7xn/m-3.9%
TE$1.3Bn/m1.3x1.3x15.3x15.7xn/m-14.6%
SLDP$522.0Mn/m50.9x94.9xn/m-13.8%
FLNC
Fluence Energy
12.07
+0.32 (+2.72%)
vs. prior close
Price20d50d150d
FLNC 12-month price
Energy Storage Systems
VRT
Vertiv
261
−11.54 (−4.23%)
vs. prior close
Price20d50d150d
VRT 12-month price
Data Center Power & Thermal
STEM
Stem
5.76
−0.08 (−1.37%)
vs. prior close
Price20d50d150d
STEM 12-month price
Software - Infrastructure
TickerMkt capP/EP/E fwdP/SP/S fwdP/GPP/GP fwdEV/EBITDAFCF yld
FLNC$3.8Bn/m1.5x1.1x12.9x9.9xn/m-7.1%
VRT$142.5B91.1x57.7x13.1x10.3x36.3x28.5x61.1x1.6%
STEM$50.3M0.3x0.3x0.3x0.9x0.9x1.6x-19.3%
RUN
Sunrun
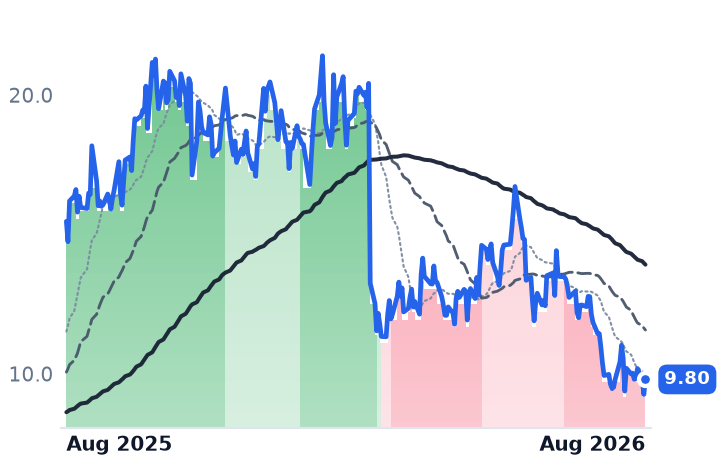
9.80
+0.54 (+5.83%)
vs. prior close
Price20d50d150d
RUN 12-month price
Residential Solar Installers
SHLS
Shoals Technologies
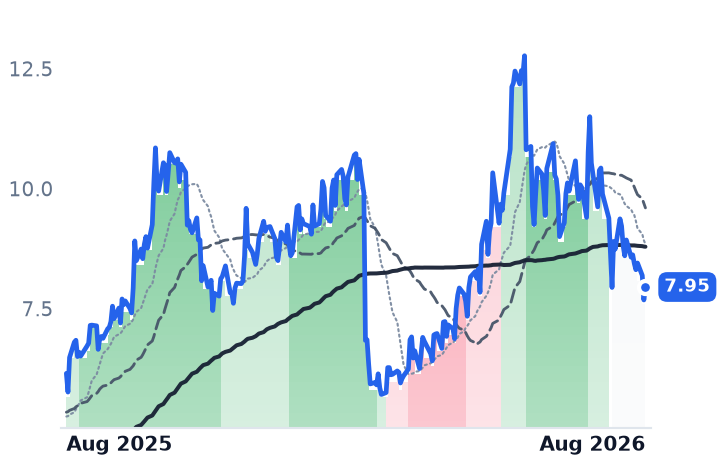
7.95
+0.27 (+3.52%)
vs. prior close
Price20d50d150d
SHLS 12-month price
Solar System Components
GEV
GE Vernova
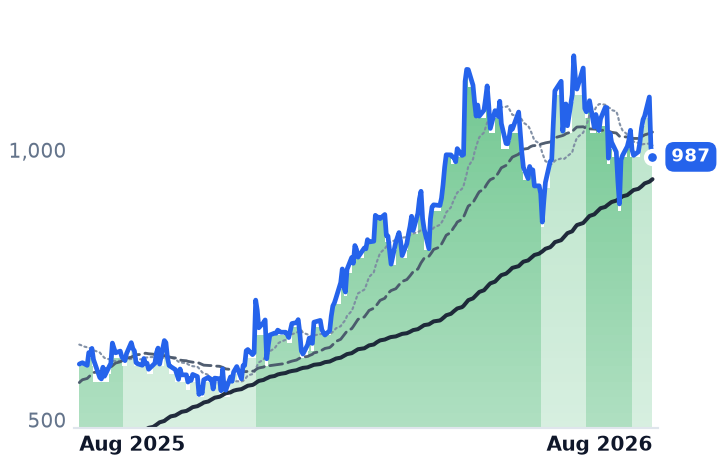
987
−17.07 (−1.70%)
vs. prior close
Price20d50d150d
GEV 12-month price
GE Vernova Integrated
TickerMkt capP/EP/E fwdP/SP/S fwdP/GPP/GP fwdEV/EBITDAFCF yld
RUN$2.3B4.0x8.1x0.7x0.8x2.4x2.5x22.0x-32.1%
SHLS$1.4B45.8x21.0x2.5x2.3x7.7x7.2x23.5x-3.6%
GEV$268.1B28.6x32.8x6.5x5.8x32.1x28.8x29.9x4.6%
PWR
Quanta Services
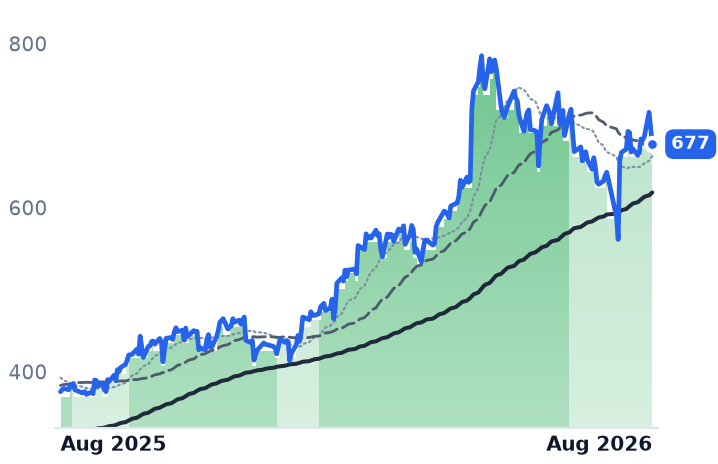
677
−18.74 (−2.69%)
vs. prior close
Price20d50d150d
PWR 12-month price
Electrical & Power Infrastructure
NEE
NextEra Energy
85.98
−0.24 (−0.28%)
vs. prior close
Price20d50d150d
NEE 12-month price
Vertically Integrated Utilities
SPY
State Street SPDR S&P 500 ETF Trust
769
+1.61 (+0.21%)
vs. prior close
Price20d50d150d
SPY 12-month price
Asset Management
TickerMkt capP/EP/E fwdP/SP/S fwdP/GPP/GP fwdEV/EBITDAFCF yld
PWR$100.3B75.5x42.9x3.1x2.7x21.2x18.5x35.1x2.4%
NEE$179.2B19.2x21.2x6.2x5.8x8.6x8.1x16.2x-5.7%
SPY$773.0B

Consensus projections

TickerFY2026EFY2027EFY2028E
ENSRevenue+3.3%+4.5%+4.9%
EPS+3.5%+27.5%+9.0%
EOSERevenue+106.4%+88.5%+83.2%
EPS−82.2%−75.5%−205.6%
ENVXRevenue+31.5%+125.3%+260.4%
EPS−5.0%+1.4%−114.4%
AMPXRevenue+92.7%+54.9%+72.8%
EPS−63.2%−183.2%+445.7%
TERevenue+31.5%+41.3%+25.5%
EPS−57.7%−92.0%−1302.6%
SLDPRevenue−73.3%+19.4%+617.7%
EPS−23.1%+12.5%+13.3%
FLNCRevenue+29.7%+23.6%+18.1%
EPS−61.9%−292.6%+127.2%
VRTRevenue+35.2%+25.8%+19.4%
EPS+55.6%+33.8%+25.8%
STEMRevenue+2.2%+19.4%+23.3%
EPS+36.9%−17.3%−49.2%
RUNRevenue+26.6%+7.7%+13.7%
EPS−11.7%−61.6%+54.2%
SHLSRevenue+32.7%+9.1%+11.0%
EPS+5.1%+27.4%+16.3%
GEVRevenue+23.4%+14.6%+15.3%
EPS+322.4%−19.0%+40.3%
PWRRevenue+34.0%+15.2%+13.1%
EPS+46.4%+16.9%+17.3%
NEERevenue+9.4%+9.8%+8.6%
EPS+9.5%+8.9%+8.1%

Forward fiscal years only. Blank means no analyst coverage for that year.

EnerSys, which builds the reserve-power systems that keep data halls, telecom sites and warehouse forklifts running when the grid or the shift changes, reported its fiscal first quarter on 13 August. Revenue reached $935.6m, up 4.8%. Operating income rose 75% to $151.4m. Orders from data-center customers were up 80% from a year earlier with 12 to 36 months of visibility, and total book-to-bill came in at 1.06x — more ordered than shipped. The shares are down 18% over three months.

That looks like a divergence. Read one line further down and it is mostly an accounting question.

The credit inside the margin

EnerSys reported gross margin of 33.5%, up 510 basis points, and 28.5% excluding the Internal Revenue Code Section 45X advanced-manufacturing credit. The credit is therefore worth roughly five points of gross margin. On the bottom line it is starker: adjusted earnings of $3.66 a share fall to $2.41 without it — about a third of the total. Strip out a $30.9m tariff refund as well and the underlying figure is $1.78, still up 42%.

The dependence is growing, not fading. Second-quarter guidance of $3.15-3.25 embeds $42-47m of 45X benefit; ex-credit, the guide is $1.95-2.05. And the credit's terms have changed. Under last year's tax law, a primary component integrated into a secondary one at the same plant now requires that at least 65% of direct material costs come from US-sourced primary components, for tax years beginning after 31 December 2026 — which reaches EnerSys's fiscal 2028.

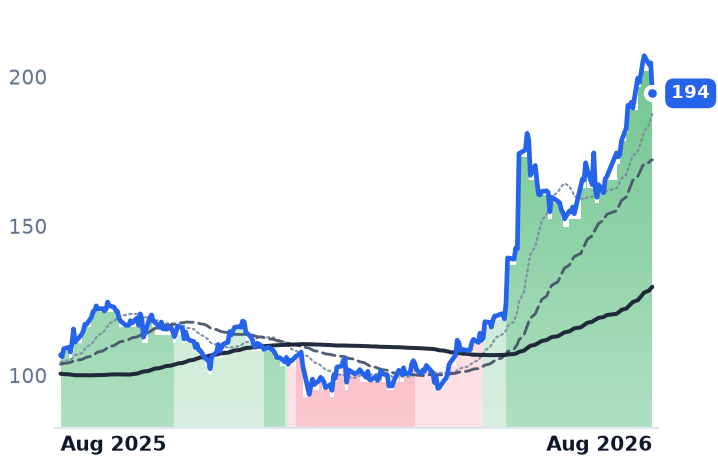
So does the price make sense? A year ago the stock closed at $99.13 against fiscal 2025 earnings of $8.99 a share, near 11x. Today it is close to $194 on trailing earnings of about $9.34 — 20.3x. The multiple almost doubled in twelve months; the three-month fall gives back a slice of that. Forward, 14.7x on consensus of $13.18 for fiscal 2027 is the counterweight, but that consensus contains the credit.

The competitive position is narrower than the order growth suggests. EnerSys sells batteries into data-center power systems dominated by Schneider Electric, Vertiv and Eaton at the integrated-platform level. Its incumbency is in lead-acid, which still holds about 62% of the data-center battery installed base while lithium grows fastest — so the company must win a lithium socket it is only now sampling. Its answer, a high-density lithium cabinet claiming 2.5 times a rival's volumetric density, has 100 units on order and revenue expected in fiscal 2028.

What actually fell

The five smaller names classified alongside EnerSys did not sell off together. Over the past month Enovix fell 29.5% and T1 Energy 25.4%; the other four averaged -2.2%, and EnerSys rose slightly.

Enovix, a Fremont maker of silicon-anode cells for phones, smart eyewear and drones, dropped 18% in one session on 17 August after chief executive Raj Talluri resigned to run Kulicke & Soffa, followed by a William Blair downgrade. Remove those two sessions and its month is roughly flat. Its business went the other way: revenue of $9.0m, up 21%, a fifth straight quarter of growth, positive gross margin at 14.4%, and a defense and drone pipeline up 41% sequentially to $183m. It holds $552m of cash against a $31.4m quarterly outflow — about four years — meaning cash is three-quarters of the market value and the operating business is priced near $190m.

T1 Energy is not a storage company at all. It makes solar cells and modules domestically, and it fell after disclosing on 28 July that capital costs at its Austin cell fab rose about 20% to $510m with first production slipping to the first quarter of 2027, then priced $120m of 4.75% convertible notes.

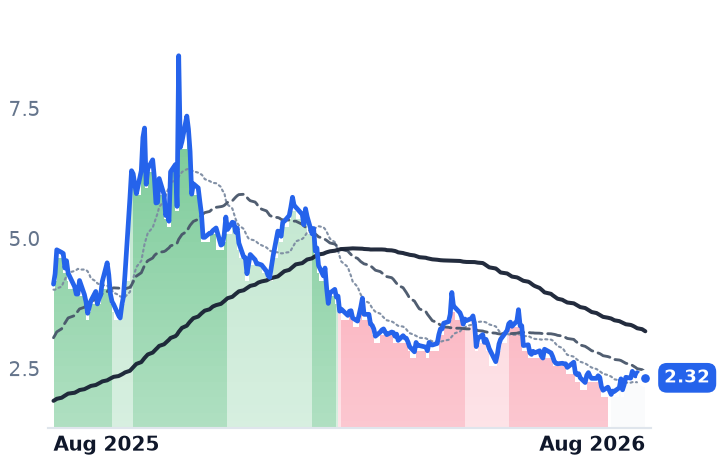
Eos Energy, which sells zinc-halide batteries for long-duration grid storage, is the one genuine storage pure-play, and it is diverging in both directions at once: revenue of $68.8m, up 351%, record backlog of $807m, against gross margin of -71% and a diluted share count up 43% year on year to 339.8m. Its sales multiple has collapsed to 5.05x trailing from 18.85x in early May. Amprius, making silicon-nanowire cells for drones and aerospace, is the quiet performer — revenue of $34.0m at 27.3% gross margin, near-breakeven earnings before interest, taxes, depreciation and amortization, and 13.8x sales against Enovix's 20.7x. Solid Power, a pre-commercial solid-electrolyte developer for electric vehicles, booked negative revenue in the quarter on an accounting reversal.

Demand is not the problem

US operators added a record 15 GW of utility-scale storage in 2025 and plan roughly 24 GW in 2026. What changed is cost and policy: the Section 301 duty on Chinese non-EV lithium cells rose from 7.5% to 25% on 1 January, in a market where China supplies over 80% of US storage cells, and battery-grade lithium carbonate has roughly tripled from its 2025 trough even as pack prices set fresh lows. Over three months every name here fell, averaging -31%, alongside Fluence at -45% and Vertiv at -31% while the S&P 500 rose. That is the whole power complex losing multiple, not storage losing customers.

The setup

Where it stands — EnerSys's order book is growing while its multiple deflates, with a third of profit resting on a federal credit. Would confirm — Fiscal second-quarter adjusted earnings ex-45X landing at or above the guided $1.95-2.05. Would invalidate — Data-center orders falling below book-to-bill of 1.0x, or the lithium cabinet slipping past fiscal 2028. Watch next — EnerSys fiscal second-quarter results, due in November; Eos's second-year Department of Energy loan tranche. Valuation — 20.3x trailing and 14.7x forward, against roughly 11x trailing a year ago.

Analog Devices Bought Its Way Into the AI Power Socket Monolithic Power Is Priced to Own

Hypothesis Opus 5 · Research Opus 5 · Writing Opus 5 · Prompt v1.5

The last few inches of a server board — where 48 or 800 volts get stepped down to the roughly one volt a graphics processor actually runs on — is the most valuable real estate in analog chips, and Monolithic Power Systems is priced as though it owns it. Analog Devices just paid $1.5bn for Empower Semiconductor to compete there, and Nvidia's published partner list for high-voltage racks names ten suppliers, not one.

The irony is that the concentration fear attached to Monolithic Power since a 2024 broker note is the one thing its own numbers refute: enterprise-data revenue rose 45% sequentially with, management said, no concentrated customers. What has changed is price. Monolithic Power now trades at 35.4x trailing gross profit, down from 48.7x three months ago, against 19.9x for Analog Devices and 13.6x for Microchip.

MPWRADIMCHPNXPITXNONNVDAAI Power DeliveryPower Management ICs800V Rack ArchitectureAnalog Chip CycleSemiconductor M&AData-Center Buildout
TickerCompanySegmentTrend · 13mo30D1Y
The subject · what this brief is about
MPWRMonolithic Power SystemsAnalog & Mixed-Signal🟢 Cont. Bull−6.0%+58.2%
ADIAnalog DevicesAnalog & Mixed-Signal🟢 Cont. Bull−2.5%+54.1%
MCHPMicrochip Technology IncorporatedAnalog & Mixed-Signal🟢 Cont. Bull−7.6%+18.0%
Compared against · context, not the story
NXPINXP SemiconductorsAnalog & Mixed-Signal🟢 Cont. Bull−17.3%+0.2%
TXNTexas Instruments IncorporatedAnalog & Mixed-Signal🟢 Cont. Bull−8.2%+36.0%
ONON SemiconductorAnalog & Mixed-Signal🟢 Cont. Bull−15.9%+54.8%
NVDANVIDIAAI & Data Center GPUs🟢 Cont. Bull+6.3%+25.6%

12-month price & trend

MPWR
Monolithic Power Systems
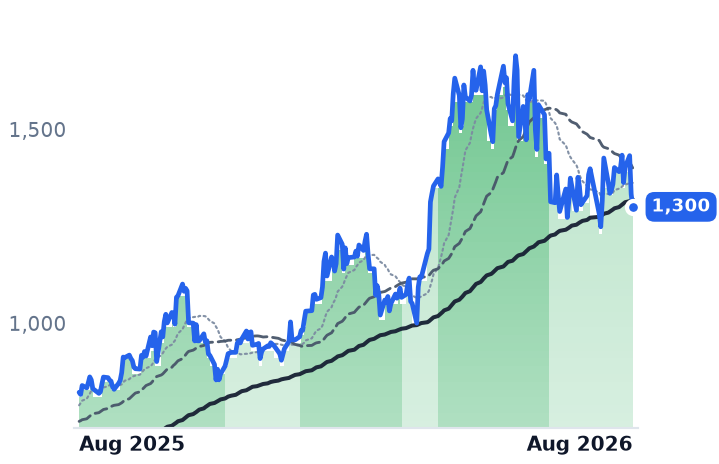
1,300
−33.04 (−2.48%)
vs. prior close
Price20d50d150d
MPWR 12-month price
Analog & Mixed-Signal
ADI
Analog Devices
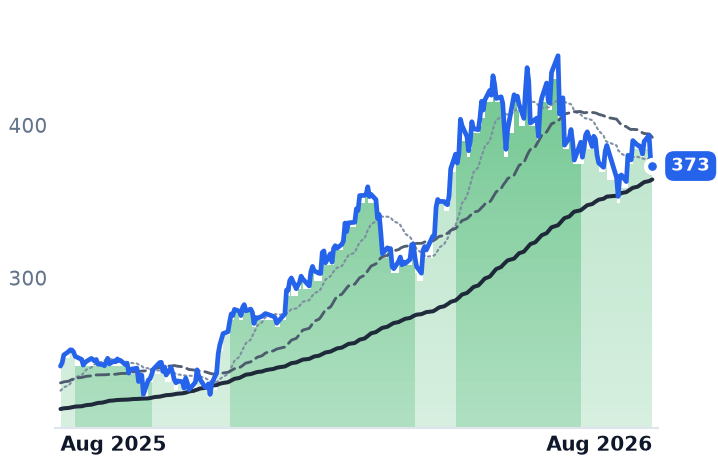
373
−3.37 (−0.89%)
vs. prior close
Price20d50d150d
ADI 12-month price
Analog & Mixed-Signal
MCHP
Microchip Technology Incorporated
77.08
−1.11 (−1.42%)
vs. prior close
Price20d50d150d
MCHP 12-month price
Analog & Mixed-Signal
TickerMkt capP/EP/E fwdP/SP/S fwdP/GPP/GP fwdEV/EBITDAFCF yld
MPWR$63.9B79.3x47.5x19.5x15.4x35.4x27.9x62.1x0.9%
ADI$181.8B44.1x30.1x13.1x12.3x19.9x18.7x28.9x2.7%
MCHP$41.9B106.8x21.1x8.2x6.5x13.6x10.9x27.9x2.7%
NXPI
NXP Semiconductors
226
−2.54 (−1.11%)
vs. prior close
Price20d50d150d
NXPI 12-month price
Analog & Mixed-Signal
TXN
Texas Instruments Incorporated
267
−4.79 (−1.76%)
vs. prior close
Price20d50d150d
TXN 12-month price
Analog & Mixed-Signal
ON
ON Semiconductor
76.58
−2.84 (−3.58%)
vs. prior close
Price20d50d150d
ON 12-month price
Analog & Mixed-Signal
TickerMkt capP/EP/E fwdP/SP/S fwdP/GPP/GP fwdEV/EBITDAFCF yld
NXPI$57.0B19.2x15.0x4.3x4.0x7.7x7.1x13.2x5.2%
TXN$258.4B42.8x33.4x13.3x11.8x22.8x20.2x29.5x2.1%
ON$32.5B52.8x26.1x5.2x5.0x14.0x13.2x26.4x5.5%
NVDA
NVIDIA
220
+0.57 (+0.26%)
vs. prior close
Price20d50d150d
NVDA 12-month price
AI & Data Center GPUs
TickerMkt capP/EP/E fwdP/SP/S fwdP/GPP/GP fwdEV/EBITDAFCF yld
NVDA$5.5T34.3x25.0x21.5x13.9x29.0x18.7x28.3x2.2%

Consensus projections

TickerFY2026EFY2027EFY2028E
MPWRRevenue+49.0%+26.2%+14.1%
EPS+54.6%+28.4%+13.2%
ADIRevenue+34.6%+16.0%+9.7%
EPS+59.8%+21.6%+15.0%
MCHPRevenue+6.2%+37.1%+16.4%
EPS+20.7%+132.5%+25.7%
NXPIRevenue+16.6%+11.5%+8.2%
EPS+28.0%+20.6%+15.7%
TXNRevenue+23.8%+14.0%+10.8%
EPS+55.0%+20.5%+18.4%
ONRevenue+9.2%+12.9%+13.5%
EPS+37.1%+41.7%+31.7%
NVDARevenue+65.1%+84.2%+43.2%
EPS+59.0%+91.7%+42.0%

Forward fiscal years only. Blank means no analyst coverage for that year.

Analog Devices completed a $1.5bn all-cash purchase of Empower Semiconductor on 7 July. Empower builds integrated voltage regulators and silicon capacitors — parts that sit on or beside the processor package and perform the final voltage conversion before current reaches the chip. ADI, a Wilmington, Massachusetts maker of data converters, amplifiers and power-management parts for industrial, automotive and communications customers, said when it announced the deal in May that Empower's regulators cut system power consumption by roughly a fifth. On its 19 August call management put the prize in dollars: about 100 gigawatts of data-center construction between 2026 and 2031, worth $1-1.5bn of analog content per gigawatt.

That is the same few square inches where Monolithic Power Systems, a fabless designer of DC-to-DC converters and vertical power modules, earns its valuation. And it is contested. Nvidia's named partner ecosystem for next-generation high-voltage direct-current racks lists ten suppliers — ADI and Monolithic Power alongside Infineon, Renesas, ON Semiconductor, Texas Instruments, STMicroelectronics, ROHM, Navitas and Innoscience.

The concentration fear its own numbers refute

The discount attached to Monolithic Power traces to a specific episode: in November 2024 a broker note argued its allocation in Nvidia's Blackwell line was at risk, with Renesas and Infineon absorbing share, and the shares fell about 25% in a session.

The June quarter says something else. Revenue reached a record $981m, up 47.6%, the fourth straight quarter of acceleration from 18.9% a year ago. Operating income grew 84%, lifting operating margin to 31.0% from 26.5%. On the 30 July call management said enterprise-data revenue rose 45% sequentially "with no concentrated customers," raised the floor of its full-year growth guidance for that business from 85% to 130%, and put its share of central-processor power above 30%. It is sampling 800-volt AC-DC parts built on its own silicon carbide, and doubled its buyback authorization to $1bn.

Where the premium sits now

Gross margins differ by twelve points across these three, so price against trailing gross profit is the comparison that holds. Monolithic Power stands at 35.4x, down from 48.7x three months ago even as trailing gross profit grew 17.3%. Its forward earnings multiple of 47.5x has slipped below the 50-60x range that had it labeled stretched in May. It remains the most expensive of the group by a wide margin — ADI is at 19.9x, Microchip 13.6x, and NXP Semiconductors, the Dutch automotive chipmaker, 7.7x.

ADI's own quarter was its first above $4bn: revenue of $4.02bn, up 39.6%, with operating margin at 40.1% against 30.7% three quarters earlier. Communications grew 84%, and data center is now 80% of that segment. Industrial, still 49% of revenue, grew 53% — the AI build is additive, not the whole story. Free cash flow ran at $4.9bn over twelve months, 36% of revenue. The shares fell on both the day before and the day of the print.

Microchip Technology, the Chandler, Arizona microcontroller house, is the recovery case rather than the AI case. Gross margin has expanded five quarters running, 53.6% to 63.2%, and operating margin swung from 3.0% to 22.7%. Bookings were the strongest in about four years and distributor inventory sits at 25 days, the low end of its range — a channel drained, with restocking still ahead. Its own fabs are far from full, with $450m of equipment idle. September revenue is guided up about 40% year on year.

One mechanism sits under all three margin lines: analog suppliers are recapturing two years of absorbed input costs through outright price increases, ADI averaging 15% across its line from 1 February. Price falls almost entirely into gross profit.

What actually happened to the shares

The de-rating is a three-month event, not a slow bleed: ADI is down 12.5% since mid-May, Monolithic Power 19.4%, Microchip 20.6%. Two sessions did most of it. On 28 and 29 July chip stocks shed more than $1trn on evidence of Chinese progress in advanced chipmaking and doubts about AI capital spending — SK Hynix fell 14.65% in a day — taking the three down 8.6%, 10.7% and 16.1% in forty-eight hours. Both earnings gaps inside the window ran the other way: Microchip rose 13.9% on 7 August, Monolithic Power 8.4% on 31 July. All three now trade with their 50-day averages below where they sat in June.

The setup

Where it stands — Monolithic Power's premium has compressed by a quarter while ADI bought its way into the same power socket. Would confirm — Monolithic Power holding enterprise-data growth above its raised 130% full-year floor at the next print. Would invalidate — ADI or Renesas naming a design win on a next-generation rack that displaces Monolithic Power's vertical modules. Watch next — Monolithic Power's September-quarter report, late October, and Microchip's guided $1.6bn September revenue. Valuation — Monolithic Power 35.4x trailing gross profit and 47.5x forward earnings, versus ADI 19.9x and 30.1x, Microchip 13.6x and 21.1x.

AAON's Backlog Doubled on Data-Center Cooling While Its Multiple Nearly Halved

Hypothesis Opus 5 · Research Opus 5 · Writing Opus 5 · Prompt v1.5

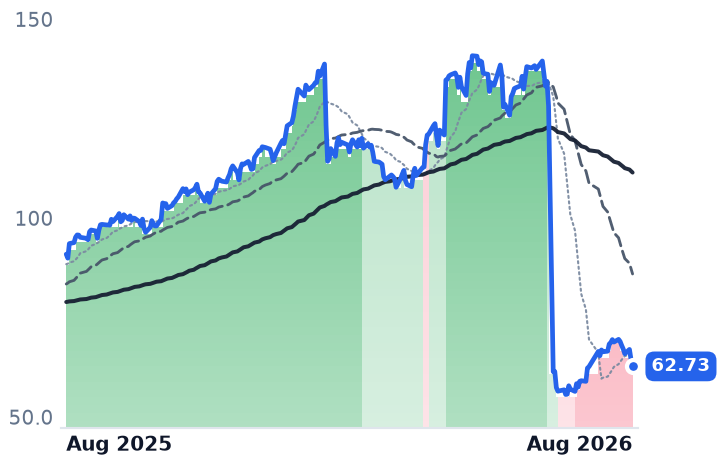
AAON, a Tulsa maker of semi-custom rooftop air conditioners, has turned itself into a data-center cooling supplier faster than almost anyone in the industry — and its shares have lost more than a third of their value since May anyway. Second-quarter revenue doubled to $627m, backlog reached about $2.0bn, and operating margin widened to 11.0% from 7.6%. Five sessions since 30 June account for the entire decline, and two of them were rivals' earnings days rather than AAON's own. The single deteriorating line is gross margin, down 223 basis points on overhead from a new Memphis plant.

Lennox is the opposite case: its 21% drop came in one guidance cut, with residential unit volumes off 12%, and at 17.7x forward earnings that re-pricing has largely done its work. Trane, four-fifths of the trio's combined value, fell 2.7% while raising guidance on a backlog up 70%.

AAONLIITTCARRJCIVRTMODNVTSPXCWSOPNRMLIATKRAMDETNData-Center CoolingLiquid Cooling SystemsCommercial HVAC EquipmentResidential HVAC DemandCapacity Ramp CostsBacklog & Order Growth
TickerCompanySegmentTrend · 13mo30D1Y
The subject · what this brief is about
AAONAAONHVAC Systems🌱 Emerging Bull−23.3%+1.5%
LIILennox InternationalHVAC Systems🌱 Emerging Bull−20.9%−28.2%
TTTrane TechnologiesHVAC Systems🟢 Cont. Bull−3.1%+7.3%
Compared against · context, not the story
CARRCarrier GlobalHVAC & Refrigeration🌱 Emerging Bull−8.2%−7.7%
JCIJohnson Controls InternationalHVAC & Refrigeration🟢 Cont. Bull+2.3%+37.2%
VRTVertivData Center Power & Thermal🟢 Cont. Bull−14.3%+104.8%
MODModine ManufacturingThermal & Powertrain Components🟢 Cont. Bull−21.0%+44.6%
NVTnVent ElectricData Center Power & Thermal🟢 Cont. Bull−2.4%+79.1%
SPXCSPX TechnologiesHVAC & Refrigeration🟢 Cont. Bull−4.2%+11.6%
WSOWatscoElectrical & HVAC Distribution🌱 Emerging Bull−14.3%−21.8%
PNRPentairPumps & Fluid Handling🔴 Cont. Bear+6.7%−37.1%
MLIMueller IndustriesCopper & Brass Products⚠️ Emerging Bear+0.7%−31.0%
ATKRAtkoreElectrical Infrastructure Products🟢 Cont. Bull+25.3%+66.5%
AMDAdvanced Micro DevicesAI & Data Center GPUs🟢 Cont. Bull−14.3%+182.5%
ETNEatonPower & Propulsion Systems🟢 Cont. Bull+5.4%+23.4%

12-month price & trend

AAON
AAON
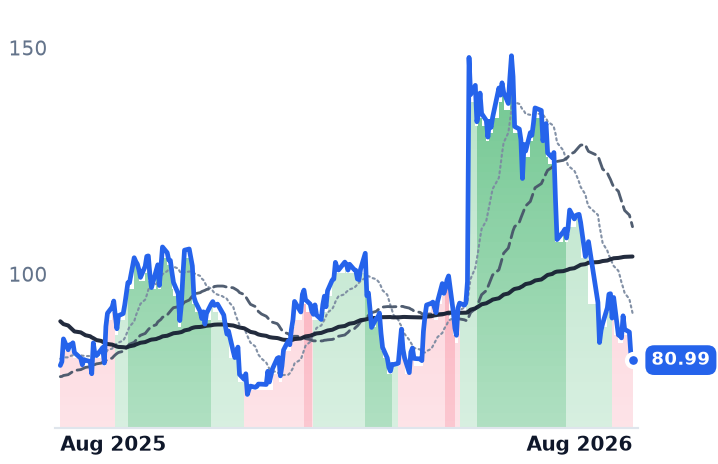
80.99
−1.07 (−1.30%)
vs. prior close
Price20d50d150d
AAON 12-month price
HVAC Systems
LII
Lennox International
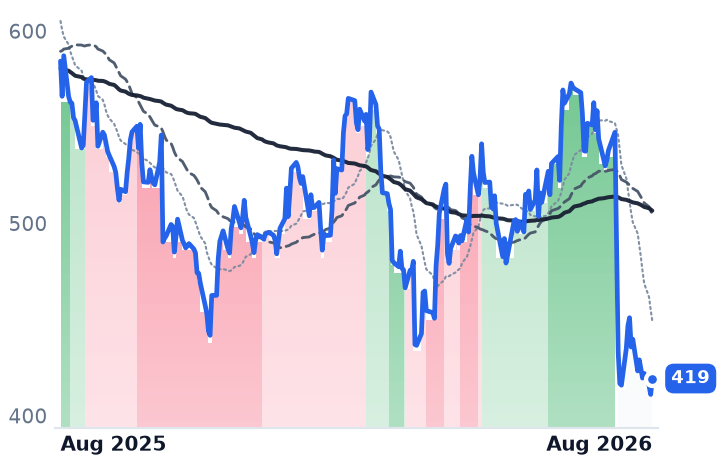
419
+8.29 (+2.02%)
vs. prior close
Price20d50d150d
LII 12-month price
HVAC Systems
TT
Trane Technologies
455
−7.89 (−1.70%)
vs. prior close
Price20d50d150d
TT 12-month price
HVAC Systems
TickerMkt capP/EP/E fwdP/SP/S fwdP/GPP/GP fwdEV/EBITDAFCF yld
AAON$6.6B41.5x35.8x3.4x3.2x13.4x12.5x22.2x-1.8%
LII$14.5B18.9x17.7x2.7x2.6x8.3x7.8x14.5x5.1%
TT$100.2B34.3x30.1x4.5x4.2x12.8x12.0x23.8x3.7%
CARR
Carrier Global
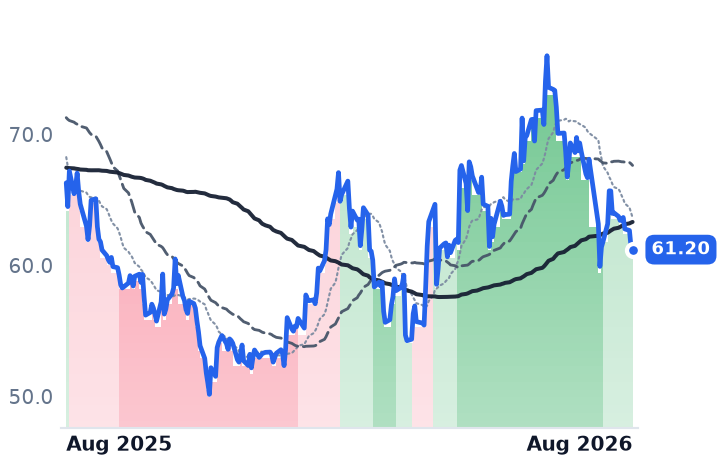
61.20
−0.22 (−0.36%)
vs. prior close
Price20d50d150d
CARR 12-month price
HVAC & Refrigeration
JCI
Johnson Controls International
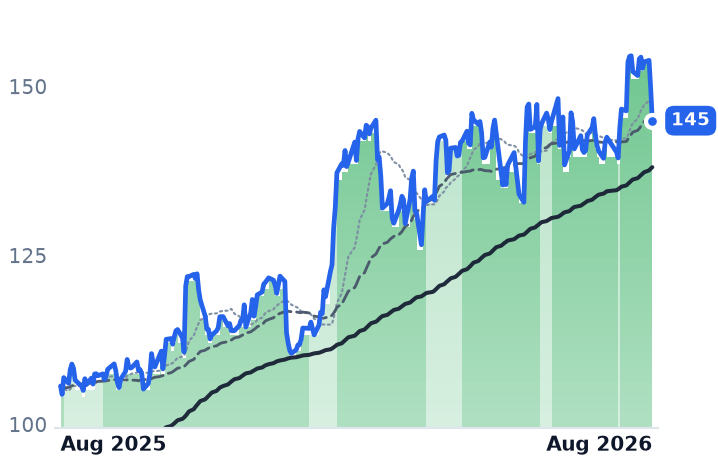
145
−4.74 (−3.17%)
vs. prior close
Price20d50d150d
JCI 12-month price
HVAC & Refrigeration
VRT
Vertiv
261
−11.54 (−4.23%)
vs. prior close
Price20d50d150d
VRT 12-month price
Data Center Power & Thermal
TickerMkt capP/EP/E fwdP/SP/S fwdP/GPP/GP fwdEV/EBITDAFCF yld
CARR$53.7B40.9x23.2x2.5x2.4x9.9x9.7x20.6x3.1%
JCI$87.3B24.6x29.5x3.6x3.5x9.8x9.5x28.3x1.6%
VRT$142.5B91.1x57.7x13.1x10.3x36.3x28.5x61.1x1.6%
MOD
Modine Manufacturing
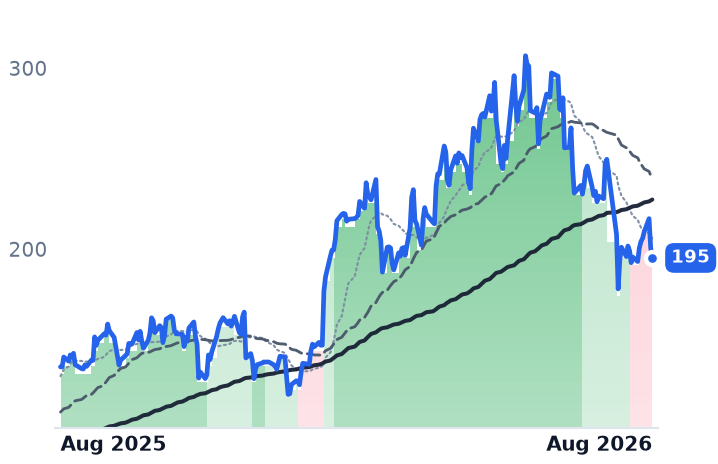
195
−5.52 (−2.75%)
vs. prior close
Price20d50d150d
MOD 12-month price
Thermal & Powertrain Components
NVT
nVent Electric
157
−7.75 (−4.71%)
vs. prior close
Price20d50d150d
NVT 12-month price
Data Center Power & Thermal
SPXC
SPX Technologies
208
−4.80 (−2.26%)
vs. prior close
Price20d50d150d
SPXC 12-month price
HVAC & Refrigeration
TickerMkt capP/EP/E fwdP/SP/S fwdP/GPP/GP fwdEV/EBITDAFCF yld
MOD$14.3B146.4x34.3x5.0x3.7x20.9x15.7x57.0x0.1%
NVT$27.3B55.8x37.0x6.3x5.5x17.1x14.9x31.3x1.4%
SPXC$10.1B38.6x25.1x4.3x3.9x11.7x10.5x19.9x3.8%
WSO
Watsco
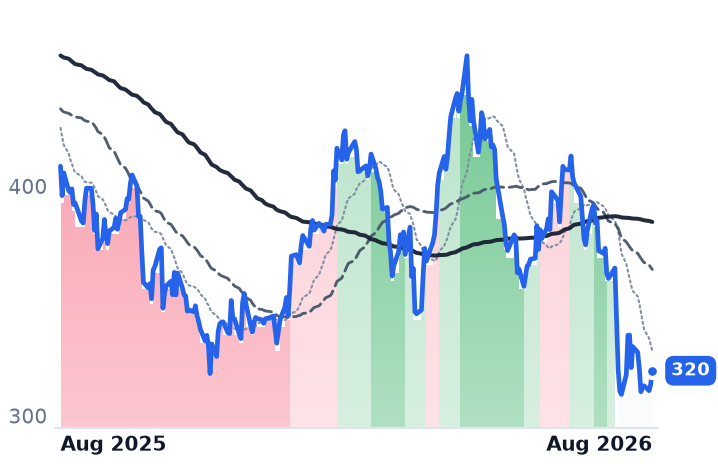
320
+5.99 (+1.91%)
vs. prior close
Price20d50d150d
WSO 12-month price
Electrical & HVAC Distribution
PNR
Pentair
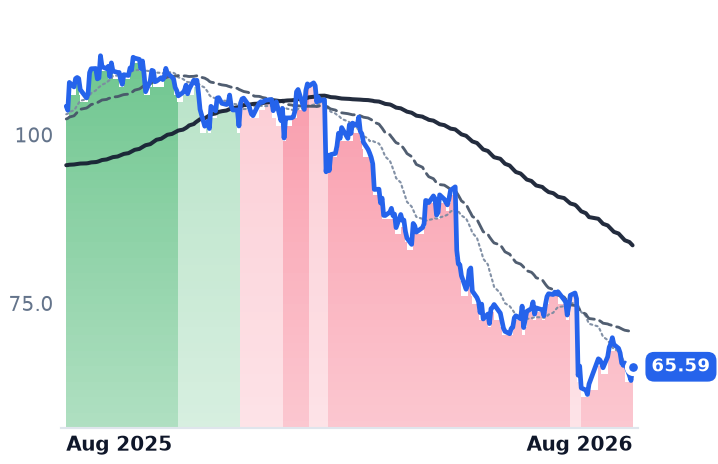
65.59
+2.04 (+3.21%)
vs. prior close
Price20d50d150d
PNR 12-month price
Pumps & Fluid Handling
MLI
Mueller Industries
62.73
−1.75 (−2.71%)
vs. prior close
Price20d50d150d
MLI 12-month price
Copper & Brass Products
TickerMkt capP/EP/E fwdP/SP/S fwdP/GPP/GP fwdEV/EBITDAFCF yld
WSO$16.4B30.9x31.8x2.3x2.2x8.0x7.7x21.2x4.2%
PNR$11.7B17.6x13.6x2.8x2.7x6.8x6.7x14.3x6.1%
MLI$14.7B17.0x16.0x3.2x2.9x11.6x10.6x11.2x2.5%
ATKR
Atkore
93.43
−0.01 (−0.01%)
vs. prior close
Price20d50d150d
ATKR 12-month price
Electrical Infrastructure Products
AMD
Advanced Micro Devices
467
−17.62 (−3.64%)
vs. prior close
Price20d50d150d
AMD 12-month price
AI & Data Center GPUs
ETN
Eaton
425
−6.66 (−1.54%)
vs. prior close
Price20d50d150d
ETN 12-month price
Power & Propulsion Systems
TickerMkt capP/EP/E fwdP/SP/S fwdP/GPP/GP fwdEV/EBITDAFCF yld
ATKR$3.2Bn/m16.8x1.1x1.1x5.5x5.4xn/m1.8%
AMD$760.5B118.4x61.3x18.4x14.9x34.6x28.0x70.9x1.1%
ETN$178.2B46.6x34.1x5.9x5.5x16.5x15.3x32.9x2.5%

Consensus projections

TickerFY2026EFY2027EFY2028E
AAONRevenue+49.3%+17.3%+18.7%
EPS+60.8%+52.9%+33.5%
LIIRevenue+6.1%+6.3%+4.8%
EPS+3.5%+10.6%+9.1%
TTRevenue+11.1%+9.1%+8.9%
EPS+16.3%+14.8%+15.8%
CARRRevenue+1.5%+4.9%+5.2%
EPS+7.3%+14.5%+13.4%
JCIRevenue+7.5%+6.7%+5.7%
EPS+30.8%+16.5%+13.2%
VRTRevenue+35.2%+25.8%+19.4%
EPS+55.6%+33.8%+25.8%
MODRevenue+22.6%+21.8%+19.1%
EPS+33.4%+52.5%+31.7%
NVTRevenue+29.7%+14.7%+13.2%
EPS+36.9%+22.2%+16.5%
SPXCRevenue+15.8%+8.5%+8.4%
EPS+18.8%+13.0%+10.5%
WSORevenue+3.6%+4.9%+4.4%
EPS+2.8%+9.1%+8.7%
PNRRevenue+3.0%+4.6%+4.3%
EPS+9.2%+8.7%+7.7%
MLIRevenue+21.1%+7.7%+8.8%
EPS+16.5%+6.0%+11.4%
ATKRRevenue+5.7%+2.9%+7.7%
EPS−15.1%+12.6%+14.7%
AMDRevenue+49.6%+68.8%+37.0%
EPS+91.9%+98.7%+42.7%
ETNRevenue+18.5%+10.9%+8.9%
EPS+11.6%+18.3%+16.9%

Forward fiscal years only. Blank means no analyst coverage for that year.

Three cooling makers, three unrelated quarters

Within a fortnight this summer, the three largest US-listed makers of air conditioning equipment reported results that had almost nothing in common. AAON, which engineers semi-custom rooftop units in Tulsa and, through its BasX division, builds air handlers and liquid-cooling systems for data halls, said revenue had doubled. Lennox International, which sells furnaces and heat pumps to American homeowners through independent dealers, cut its profit outlook and pushed the expected residential recovery into 2027. Trane Technologies, the $100bn maker of applied chillers and Thermo King transport refrigeration, raised guidance on record orders.

The shares behaved as though all three had reported the same bad quarter. AAON is down 37.8% since 19 May and Lennox 21.4% over the past month. Trane fell 2.7%. Because Trane is roughly 83% of the trio's combined value, the group has in fact barely moved; the damage is concentrated in two names, for two entirely different reasons.

The business is accelerating; the multiple is not

AAON's second-quarter revenue was $627m, up 101% from a year earlier — the fourth consecutive quarter of accelerating growth, from 17% to 42% to 54% to triple digits. Operating income rose 192%, and operating margin expanded to 11.0% from 7.6%. Backlog reached about $2.0bn, up 98% year on year, with the BasX book up 185%. The legacy rooftop business, sold into a soft commercial market, still grew 40%.

One line went the wrong way. Gross margin fell 223 basis points to 24.3%, and management cut full-year gross margin guidance to 25–26% from 27–28% while raising the sales guide to 55–60% growth. The cause is mechanical and disclosed: overhead at the new Memphis plant ran $18.1m in the quarter against $3m a year earlier. Strip that allocation out and the Oklahoma core segment's margin rose 60 basis points to 31.2%, with the BasX segment at 30.0%. Management expects a modest sequential lift in the third quarter and a meaningful one in the fourth, as late-2025 price increases now embedded in backlog flow through production.

Still, AAON's 24.3% gross margin is now the lowest of the three, against 34.9% at Lennox and 35.6% at Trane — an awkward fact for a company long described as earning structurally better margins than mass-market rivals.

Five sessions, two of them somebody else's

The decline was not a grind. Five days — 1 and 2 July, 28 and 29 July, and 10 August — compound to -38.7%, more than the entire move since 30 June, meaning every other session was net positive. Two of those five were peer earnings days. Carrier reported on 28 July and fell 8.9% on margin compression, even as its Americas residential orders rose about 70%; Lennox reported the next morning. AAON's own results did not arrive until 10 August.

Lennox's fall, by contrast, is one event. The company cut full-year adjusted earnings guidance to $23.00–$24.00 and moved the demand recovery to 2027. Home Comfort Solutions revenue fell 7% with unit volumes off 12%. There is a real mechanism behind it: the 30-year Treasury yield reached about 5.33% on 18 August, its highest since 2007, and financed replacement demand follows housing turnover. Less noticed, Lennox's commercial arm grew 24% and its growth guidance was raised to roughly 20%.

Trane is diverging from both. Organic bookings rose 37% to a record $12.1bn backlog, up 70% with Americas commercial HVAC orders at an all-time high, and it raised full-year guidance and its dividend. It is also arming directly at AAON's socket: its Stellar modular chiller platform is tracking $500m of revenue, coolant-distribution and LiquidStack acquisitions are ahead of plan, and capacity is being quadrupled over three years under long-term agreements with hyperscalers.

Where the prices sit

AAON trades at 13.4x trailing gross profit, against roughly 25x in May and 18.4x in early May, while trailing gross profit itself grew from $386m to $494m. Forward earnings put it at 35.8x, or 23.4x on 2027 consensus. The offsets are genuine: free cash flow yield is negative at -1.8% on $103m of year-to-date capital spending, BasX bookings were sequentially lighter than four prior quarters that ran near three times book-to-bill, and no customer above the 10% revenue threshold is named in the latest 10-Q, leaving concentration in a hyperscaler-weighted backlog unquantified.

Lennox at 8.3x trailing gross profit, down from 11.1x in February on flat gross profit, and a 5.1% free cash flow yield, has largely absorbed its own bad news. Trane's 12.8x has hardly moved in six months, and its 30.1x forward multiple sits just below the 32x that has been the standing caution on the name. AAON's trend turned down only in August; the business, so far, has not.

The setup

Where it stands — AAON's orders and operating leverage are improving while its multiple has compressed by nearly half since May. Would confirm — Third-quarter gross margin above 24.3% sequentially, with total backlog holding at or above $2.0bn. Would invalidate — BasX backlog falling sequentially, or full-year gross margin guidance cut below 25%. Watch next — AAON's third-quarter results, due early November, the first test of the promised margin recovery. Valuation — 13.4x trailing gross profit versus about 25x in May; 35.8x forward earnings, 23.4x on 2027 consensus.

D-Wave's Revenue Fell Year on Year. Consensus Needs 86% of 2026 in the Second Half.

Hypothesis Opus 5 · Research Opus 5 · Writing Opus 5 · Prompt v1.5

D-Wave Quantum's revenue in the June quarter was $3.08m, fractionally below a year earlier, and its shares have added about 16% in the month since. Analysts still have the company earning $43.0m this year. Only $5.9m arrived in the first half, so 86% of that estimate rests on two annealing machines management says will probably ship in the fourth quarter.

That is the shape of the whole group's rebound. IonQ's business genuinely accelerated — revenue of $80.1m, up 287% — but the growth came from shipping hardware rather than renting machine time, and gross margin fell to 24.9% from 56.5% two quarters earlier. Rigetti's revenue nearly tripled, to $5.1m, against an equity value of $5.65bn. The money underwriting all of it is increasingly federal: the Commerce Department signed $2.01bn of letters of intent with nine quantum firms and is taking equity in each. IonQ, the largest, is not among them.

IONQQBTSRGTIQUBTINFQIBMGFSQuantum Computing HardwareFederal Quantum FundingEquity Dilution & Cash BurnGross Margin CompressionQuantum Foundry Capacity
TickerCompanySegmentTrend · 13mo30D1Y
The subject · what this brief is about
IONQIonQQuantum Computing🌱 Emerging Bull+22.1%+17.9%
QBTSD-Wave QuantumQuantum Computing⚠️ Emerging Bear+8.5%+28.3%
RGTIRigetti ComputingQuantum Computing⚠️ Emerging Bear+11.3%+15.2%
Compared against · context, not the story
QUBTQuantum ComputingQuantum Computing🔴 Cont. Bear+2.4%−42.4%
INFQInfleqtionQuantum Computing🔴 Cont. Bear+26.4%−19.8%
IBMInternational Business MachinesIT Infrastructure & Operations⚠️ Emerging Bear+12.7%−0.4%
GFSGLOBALFOUNDRIESLogic Foundries🟢 Cont. Bull−18.2%+47.1%

12-month price & trend

IONQ
IonQ
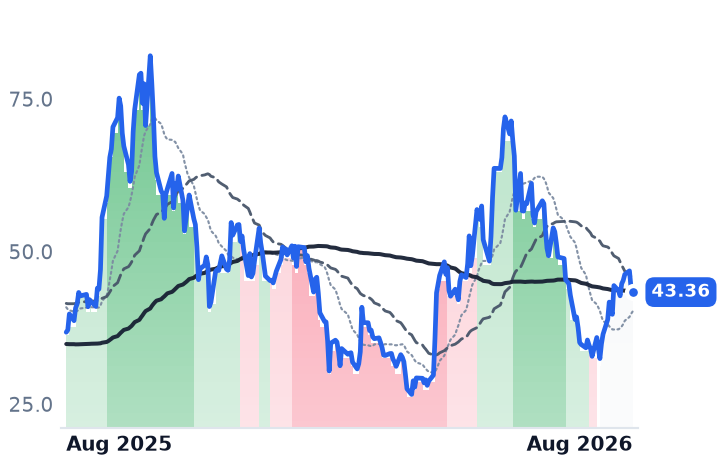
43.36
−0.76 (−1.72%)
vs. prior close
Price20d50d150d
IONQ 12-month price
Quantum Computing
QBTS
D-Wave Quantum
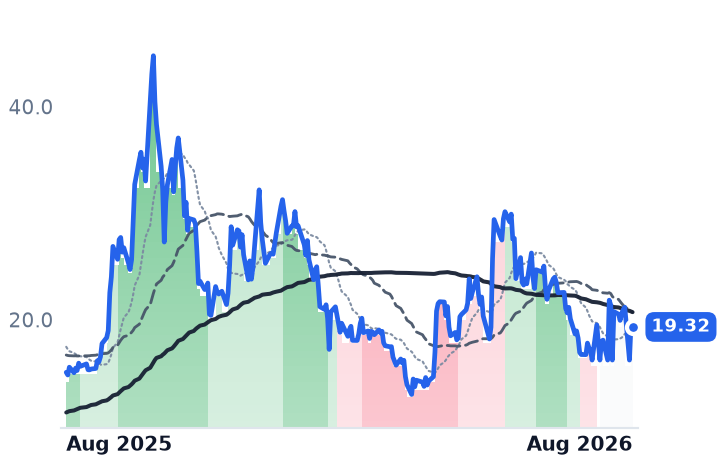
19.32
−0.21 (−1.08%)
vs. prior close
Price20d50d150d
QBTS 12-month price
Quantum Computing
RGTI
Rigetti Computing
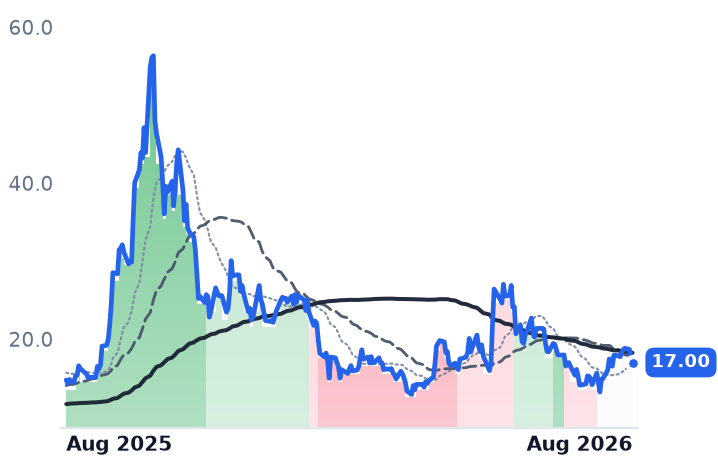
17.00
−0.71 (−4.01%)
vs. prior close
Price20d50d150d
RGTI 12-month price
Quantum Computing
TickerMkt capP/EP/E fwdP/SP/S fwdP/GPP/GP fwdEV/EBITDAFCF yld
IONQ$16.2Bn/m65.7x55.9x181.0x154.0x8.2x-3.0%
QBTS$7.1Bn/m571.4x165.2x890.2x257.4xn/m-1.7%
RGTI$5.7Bn/m423.2x239.1xn/m-1.5%
QUBT
Quantum Computing
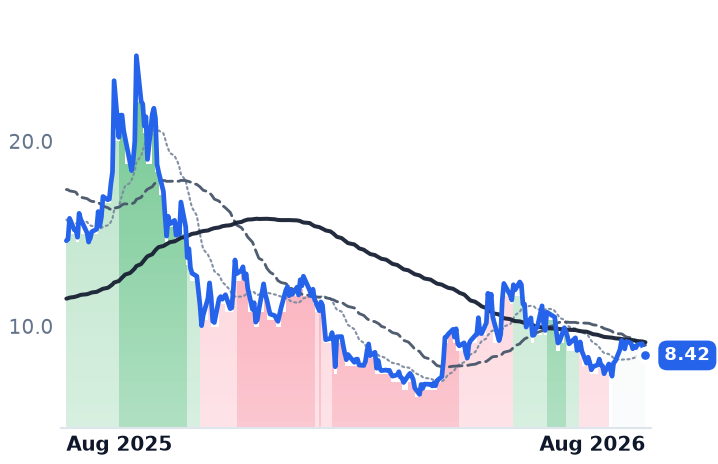
8.42
−0.10 (−1.17%)
vs. prior close
Price20d50d150d
QUBT 12-month price
Quantum Computing
INFQ
Infleqtion
12.50
−0.41 (−3.18%)
vs. prior close
Price20d50d150d
INFQ 12-month price
Quantum Computing
IBM
International Business Machines
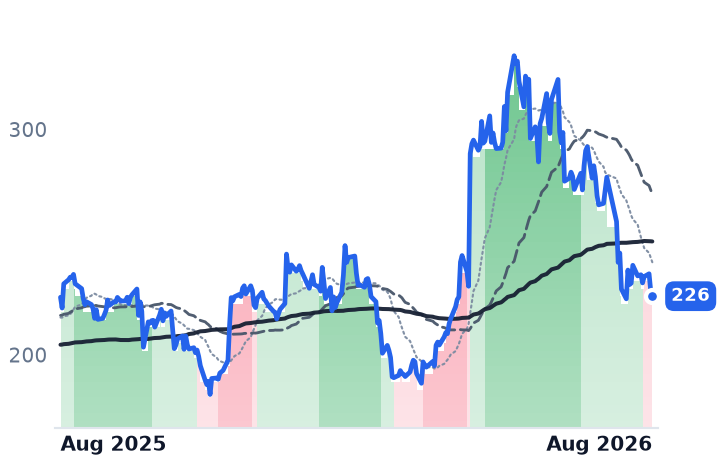
237
+4.49 (+1.93%)
vs. prior close
Price20d50d150d
IBM 12-month price
IT Infrastructure & Operations
TickerMkt capP/EP/E fwdP/SP/S fwdP/GPP/GP fwdEV/EBITDAFCF yld
QUBT$2.0Bn/m205.9x92.5xn/m-2.5%
INFQ$2.8Bn/m127.0x67.1x830.2x438.4xn/m-0.3%
IBM$222.5B20.6x19.2x3.2x3.2x5.5x5.4x17.3x6.6%
GFS
GLOBALFOUNDRIES
48.58
−1.32 (−2.65%)
vs. prior close
Price20d50d150d
GFS 12-month price
Logic Foundries
TickerMkt capP/EP/E fwdP/SP/S fwdP/GPP/GP fwdEV/EBITDAFCF yld
GFS$26.7B37.4x25.1x3.8x3.6x14.0x13.3x12.8x3.0%

Consensus projections

TickerFY2026EFY2027EFY2028E
IONQRevenue+167.1%+35.0%+65.1%
EPS−33.1%−24.4%−0.6%
QBTSRevenue+68.0%+88.4%+81.5%
EPS+41.7%+26.0%−4.4%
RGTIRevenue+212.3%+122.1%+44.5%
EPS+14.3%+0.4%+6.8%
QUBTRevenue+2374.9%+52.8%+78.1%
EPS−19.5%+29.5%−5.3%
INFQRevenue+28.9%+27.8%+29.8%
EPS+91.3%−6.7%+17.6%
IBMRevenue+5.0%+3.9%+5.1%
EPS+8.4%+6.8%+8.6%
GFSRevenue+8.0%+12.3%+13.8%
EPS+17.7%+31.7%+34.0%

Forward fiscal years only. Blank means no analyst coverage for that year.

Three quarters, three different businesses

In the first week of August the three largest listed quantum-computing companies reported June quarters that had almost nothing in common. IonQ, a trapped-ion computer maker in College Park, Maryland that sells machine time through Amazon's Braket and Microsoft's Azure Quantum, booked revenue of $80.05m — nearly four times the year-earlier figure — and raised full-year guidance to $280m-$290m. Rigetti Computing, a 163-person builder that fabricates its own superconducting processors, grew revenue 183% to $5.14m. D-Wave Quantum, which sells quantum annealers, a narrower class of machine built for optimization problems rather than general computation, reported $3.08m, marginally below the prior year.

The divergence runs deeper than the growth rates. IonQ's expansion came from shipping boxes: gross margin fell to 24.9% from 56.5% in the fourth quarter of 2025. Management said 60% of the quarter's revenue was non-government and half was international, and reported remaining performance obligations of $485m against $122m a year earlier. Rigetti was the only one of the group whose margin improved, to 42.6% from 31.4%, on sales of its Novera on-premises processors — but its 2025 revenue of $7.09m was 34% below 2024, so the base is not yet compounding.

D-Wave's number is the one that needs explaining. Its recurring cloud-subscription line grew 50% to $1.9m, but first-half revenue fell 67% because the prior-year half contained $13.7m from the company's first outright system sale. Bookings of $35.5m for the half look spectacular until you remove the $20m agreement signed in January with Florida Atlantic University for a single Advantage2 machine. Second-quarter bookings alone were $2.1m. Adjusted losses before interest, taxes, depreciation and amortization widened 85%, to -$37.1m.

What the forward multiples assume

All three are loss-making, so earnings multiples are meaningless; sales and gross profit are the honest lenses. D-Wave trades at 571 times trailing sales and 165 times forward sales. That compression is not a business improving — it is the estimate assuming two unshipped annealers land by December at $20m-$40m apiece. Rigetti's 423 times trailing falls to 239 times forward only if it books $14.1m in the second half, roughly 60% of which is a single $8.4m order for a 108-qubit system from India's Centre for Development of Advanced Computing, recognized on installation and acceptance.

IonQ is the cheapest of the three on sales, at 65.7 times trailing and 55.9 times forward. On gross profit it is 181 times trailing and 154 times forward. The gap between those two ratios is the arithmetic price of a 25% margin.

The cost of the cash

None of these companies funds itself from operations, and the share counts show it. IonQ's diluted count rose 46.5% year on year to 367.7m, before roughly 24m more shares went out to close its $1.8bn purchase of SkyWater Technology, the only US quantum foundry running at 200mm scale. Its $3.0bn of cash and investments falls to about $2.0bn after that deal — near $5.10 a share, or 12% of the equity value.

D-Wave's diluted count rose 25.9%; it holds $546.2m, about $1.47 a share, after a $400m at-the-market offering last June that followed a $150m one in January 2025. Rigetti holds $541.3m with no debt and burned about $28m in the quarter — a long runway, but $1.62 of cash per share against a $17.00 price. Quantum Computing Inc., which draws 70%-80% of revenue from government subcontracting, is the odd one out: roughly 64% of its $2.02bn market value is cash, and it trades at 1.27 times book, yet its June-quarter gross margin was negative and its share count rose 58.9%.

Washington became the marginal funder

In May the Commerce Department announced $2.013bn of letters of intent with nine quantum companies — IBM, GlobalFoundries, D-Wave, Rigetti, Infleqtion, PsiQuantum, Quantinuum, Atom Computing and Diraq — taking a minority equity stake in each as a condition of the money. Rigetti's slice runs to $100m over three years, and the terms contemplate issuing the government new shares priced at the lowest close on three specified dates, discounted a further 15%. IonQ and Quantum Computing Inc. are not on the list. Separately, the Defense Advanced Research Projects Agency advanced 11 firms to Stage B of its Quantum Benchmarking Initiative, IonQ among them; Rigetti says its qualification is still in progress.

The shares, briefly

From 20 July to 19 August, Infleqtion — which listed in February through a merger with Churchill Capital X and took in more than $550m — rose 38.1%, IonQ 26.6%, Rigetti 19.3%, D-Wave 15.6% and Quantum Computing Inc. 6.3%. The gains were not a grind: two sessions around IonQ's 5 August print delivered roughly 19 of its 26.6 points. All four of the older names remain below their 31 December closes, D-Wave by 26.1%. And the advance happened while the 30-year Treasury yield topped 5.33%, a 19-year high — the longest-duration equities in technology rising straight through a discount-rate shock.

The setup

Where it stands — A partial repair of a year-long drawdown, with three businesses whose revenue engines have almost nothing in common. Would confirm — D-Wave shipping both annealing systems by December and Rigetti's $8.4m C-DAC installation being accepted in the fourth quarter. Would invalidate — A third straight D-Wave quarter near $3.1m, or a fresh at-the-market equity program at any of the three. Watch next — IonQ's investor day at the New York Stock Exchange on 8 September, when combined IonQ-SkyWater guidance is expected. Valuation — D-Wave 571x trailing sales, 165x forward; Rigetti 423x and 239x; IonQ 65.7x and 55.9x, or 154x forward gross profit.

NetApp Says Flash-Memory Costs Will Cut Its Gross Margin. The Shares Nearly Doubled.

Hypothesis Opus 5 · Research Opus 5 · Writing Opus 5 · Prompt v1.5

Three companies that sell the finished box — servers and storage arrays — to corporate buyers rather than to hyperscalers have re-rated violently this year, and almost none of it came from earning more gross profit.

NetApp guided fiscal 2027 gross margin down to 68.5–69.5% from 71.3%, naming memory and flash costs, and its shares gained 22% the next session anyway. Dell's revenue nearly doubled last quarter to $43.8bn while gross margin fell 337 basis points; operating leverage, not price pass-through, rescued the profit line. Hewlett Packard Enterprise is the exception and the odd one out — its margin expansion is Juniper networking mix and debt paydown, not a server cycle.

Measured against trailing gross profit, Dell has moved from 3.69x in February to 11.37x while those gross-profit dollars grew 19%. All three report within two weeks.

DELLHPENTAPMUSMCICLSFLEXWDCSNDKHPQEnterprise Server & StorageMemory Cost InflationDRAM & NAND SupplyAll-Flash ArraysAI Server BuildoutNetworking Systems Mix
TickerCompanySegmentTrend · 13mo30D1Y
The subject · what this brief is about
DELLDell TechnologiesEnterprise Storage & Software🟢 Cont. Bull+8.3%+244.3%
HPEHewlett Packard EnterpriseEnterprise Storage & Software🟢 Cont. Bull+13.7%+157.0%
NTAPNetAppEnterprise Storage & Software🟢 Cont. Bull+17.3%+82.0%
Compared against · context, not the story
MUMicron TechnologyMemory (DRAM/NAND)🟢 Cont. Bull−3.5%+700.7%
SMCISuper Micro ComputerServer & Infrastructure Systems🌱 Emerging Bull+43.5%−14.2%
CLSCelesticaElectronic Manufacturing Services🟢 Cont. Bull−11.3%+64.8%
FLEXFlexElectronic Manufacturing Services🟢 Cont. Bull−11.3%+130.2%
WDCWestern DigitalData Storage Devices🟢 Cont. Bull−15.7%+512.4%
SNDKSandiskSpecialty Manufacturing & Components🟢 Cont. Bull−1.3%+3433.5%
HPQHPConsumer & Commercial PCs🌱 Emerging Bull+20.7%+17.5%

12-month price & trend

DELL
Dell Technologies
438
−31.10 (−6.64%)
vs. prior close
Price20d50d150d
DELL 12-month price
Enterprise Storage & Software
HPE
Hewlett Packard Enterprise
53.13
−2.56 (−4.60%)
vs. prior close
Price20d50d150d
HPE 12-month price
Enterprise Storage & Software
NTAP
NetApp
194
−10.23 (−5.00%)
vs. prior close
Price20d50d150d
NTAP 12-month price
Enterprise Storage & Software
TickerMkt capP/EP/E fwdP/SP/S fwdP/GPP/GP fwdEV/EBITDAFCF yld
DELL$290.6B34.2x23.3x2.2x1.7x11.4x8.8x21.0x3.2%
HPE$70.3B48.7x15.5x1.8x1.6x5.5x4.7x21.5x5.7%
NTAP$38.2B30.2x21.6x5.5x5.1x7.8x7.2x19.8x4.9%
MU
Micron Technology
937
−3.66 (−0.39%)
vs. prior close
Price20d50d150d
MU 12-month price
Memory (DRAM/NAND)
SMCI
Super Micro Computer
36.58
−0.83 (−2.22%)
vs. prior close
Price20d50d150d
SMCI 12-month price
Server & Infrastructure Systems
CLS
Celestica
301
−9.23 (−2.97%)
vs. prior close
Price20d50d150d
CLS 12-month price
Electronic Manufacturing Services
TickerMkt capP/EP/E fwdP/SP/S fwdP/GPP/GP fwdEV/EBITDAFCF yld
MU$1.0T19.9x12.2x11.2x7.8x15.4x10.7x14.5x2.6%
SMCI$25.8B10.9x12.3x0.7x0.5x6.1x4.5x8.2x-27.1%
CLS$34.7B31.0x26.5x2.2x1.7x19.1x14.5x23.2x1.5%
FLEX
Flex
113
−7.21 (−6.00%)
vs. prior close
Price20d50d150d
FLEX 12-month price
Electronic Manufacturing Services
WDC
Western Digital
462
−34.07 (−6.87%)
vs. prior close
Price20d50d150d
WDC 12-month price
Data Storage Devices
SNDK
Sandisk
1,569
−56.91 (−3.50%)
vs. prior close
Price20d50d150d
SNDK 12-month price
Specialty Manufacturing & Components
TickerMkt capP/EP/E fwdP/SP/S fwdP/GPP/GP fwdEV/EBITDAFCF yld
FLEX$41.8B43.6x24.1x1.4x1.2x15.0x12.7x23.6x2.6%
WDC$166.1B25.6x48.3x14.1x12.9x31.1x28.4x31.1x1.7%
SNDK$208.5B46.2x21.8x15.8x10.6x28.2x19.0x37.1x2.1%
HPQ
HP
29.94
−0.07 (−0.25%)
vs. prior close
Price20d50d150d
HPQ 12-month price
Consumer & Commercial PCs
TickerMkt capP/EP/E fwdP/SP/S fwdP/GPP/GP fwdEV/EBITDAFCF yld
HPQ$26.9B10.7x9.7x0.5x0.5x2.3x2.3x8.4x14.0%

Consensus projections

TickerFY2026EFY2027EFY2028E
DELLRevenue+16.2%+54.7%+15.1%
EPS+27.3%+88.5%+22.3%
HPERevenue+30.3%+11.5%+5.6%
EPS+80.5%+18.1%+9.6%
NTAPRevenue+4.3%+9.9%+5.7%
EPS+10.4%+12.8%+11.1%
MURevenue+248.0%+92.8%+11.4%
EPS+804.9%+111.2%+7.9%
SMCIRevenue+77.7%+34.0%+19.7%
EPS+33.5%+15.5%+13.7%
CLSRevenue+67.0%+69.3%+32.3%
EPS+90.2%+74.7%+34.3%
FLEXRevenue+6.8%+26.3%+30.0%
EPS+24.2%+44.7%+51.5%
WDCRevenue+36.9%+37.2%+26.5%
EPS+106.2%+72.8%+48.0%
SNDKRevenue+169.2%+113.5%+7.0%
EPS+2283.0%+167.8%+5.6%
HPQRevenue+4.5%+0.2%+0.3%
EPS−2.8%+0.0%+9.6%

Forward fiscal years only. Blank means no analyst coverage for that year.

The largest single line item at the companies that assemble and brand enterprise servers and storage arrays is no longer the processor. It is memory. And on 28 May, NetApp — which sells all-flash storage arrays running its ONTAP data-management software, plus first-party storage services inside Azure, Amazon Web Services and Google Cloud — told investors that the cost of that memory would take roughly two points off its gross margin this fiscal year.

That is a guidance cut, delivered in the same breath as record results. NetApp's revenue rose 12.5% to $1.95bn in the January-to-April quarter, a fourth consecutive acceleration from just 1.2% three quarters earlier. All-flash array revenue hit a record $1.2bn, up 18%. Yet reported gross margin has now slipped two quarters running, from 71.96% to 70.58% to 70.07%, and the fiscal 2027 guide of 68.5–69.5% sits below all of them. Management says pricing actions are being taken to protect profitability. The guide says they are not yet enough.

Why the bill exploded

Memory makers have been shifting constrained wafer capacity toward high-bandwidth memory for artificial-intelligence accelerators, starving the conventional server DRAM that ordinary enterprise machines need. Contract prices for that conventional DRAM rose roughly 93–98% quarter on quarter in the first quarter of 2026, according to TrendForce, with NAND flash following. The cost of a memory-heavy 512-gigabyte, dual-socket server build has roughly doubled since January 2025. The rate is now decelerating — TrendForce expects 13–18% for server DRAM in the third quarter — but the level is set.

Dell absorbed it; opex saved the quarter

Dell, the largest of the three and the volume leader in AI servers with roughly a fifth of the market, is the clearest case. Revenue in the quarter to 1 May rose 87.5% to $43.8bn. Gross profit rose only 57.6%. Gross margin fell 337 basis points to 17.75%, meaning the incremental margin on $20.5bn of brand-new revenue was about 13.9 cents on the dollar. Operating margin still expanded, to 8.34% from 5.27% — but only because operating expense grew 11.4% against revenue growth of 87.5%. That is expense leverage, not pass-through.

Dell is trying. It raised PowerEdge server list prices in December and lifted commercial PC and monitor prices 10–30%. Chief operating officer Jeff Clarke told investors the company is "repricing, it feels like, every day", with quotes valid for the shortest period ever. Demand is not the issue: Dell entered the quarter with a $51.3bn AI-server backlog, booked $24.4bn of new orders and lifted full-year revenue guidance to $165–169bn.

HPE is a different story wearing the same clothes

Hewlett Packard Enterprise sells ProLiant servers and, since the Juniper deal, a large switching and routing business. Its gross margin expanded 894 basis points to 36.52% — the opposite of Dell. But that is acquisition mix, not pricing power: Networking revenue rose 148.2% to $2.7bn while the segment's own operating margin fell to 21.6% from 25.0%. Server revenue grew 32.7% to $5.5bn. The genuine progress is financial: net debt to adjusted EBITDA improved to 2.6x from a pro-forma 3.1x, with free-cash-flow guidance raised to at least $2.0bn, per its 10-Q. Barron's midyear panelists judged Dell's hyperscaler servers superior to HPE's on total cost of ownership — HPE is following, not leading, on hardware.

The multiple did the work

Because the three earn 18%, 37% and 70% gross margins, price against gross profit is the only lens that compares them. Dell has gone from 3.69x trailing gross profit in mid-February to 6.88x in May to 11.37x now; its trailing gross-profit dollars grew 19.1% over that span. HPE went 2.87x to 5.50x on 29.7% more gross profit. NetApp went 4.28x to 7.79x on 5.1%. The advance is overwhelmingly re-rating.

Nor was it a quiet grind. Dell has printed 27 sessions of 5% or more since 31 March, including a 32.8% gain the day after results and an 11.3% drop on 28 July. HPE jumped 24.0% on 2 June, NetApp 22.4% on 29 May. All three fell together on 19 August inside a broad selloff in AI hardware and memory names, and all three remain in uptrends, 50-day averages above 200-day.

The setup

Where it stands — Revenue and backlog are validated at all three; the memory cost is landing on gross margin and being offset below it. Would confirm — Dell reporting flat or higher gross margin on sequentially higher AI-server revenue. Would invalidate — NetApp narrowing its fiscal 2027 gross-margin guide back toward 71%, or Dell's incremental gross margin rising above 20%. Watch next — Dell reports 1 September; HPE and NetApp both report after the close on 2 September. Valuation — Dell 11.37x trailing gross profit against 8.81x forward, versus 3.69x in February; HPE 5.50x/4.75x; NetApp 7.79x/7.17x.

Pegasystems Lost Half Its Multiple in Four Sessions While Gross Profit Kept Growing

Hypothesis Opus 5 · Research Opus 5 · Writing Opus 5 · Prompt v1.5

Pegasystems' shares have been in a downtrend since late January, and the usual reading is that agentic AI is quietly eating the software that automates business processes. The record says something narrower: four earnings and guidance sessions did nearly all the damage, and the business underneath still grew. Contract value under management reached $1.62bn in the June quarter, up 7% against a 15% guide management set in January — but trailing gross profit rose over the same twelve months, to $1.31bn, while the price paid for it fell from about 7.5x to 4.24x.

The three names split cleanly. Appian is the outlier that re-rated upward, raising full-year guidance to $845-853m. NICE, the contact-center vendor billed per agent seat, is the cheapest of the three at 2.89x gross profit — and the one whose own customers are demonstrating that AI retires seats.

PEGAAPPNNICENOWCRMMSFTFIVNBusiness Process AutomationAgentic AI DisruptionEnterprise Workflow SaaSContact-Center SoftwareSaaS Multiple Compression
TickerCompanySegmentTrend · 13mo30D1Y
The subject · what this brief is about
PEGAPegasystemsLow-Code & Process Automation⚠️ Emerging Bear+9.3%−34.6%
APPNAppianLow-Code & Process Automation🌱 Emerging Bull+48.0%+29.5%
NICENICECustomer Experience & CRM🔴 Cont. Bear+7.2%−26.8%
Compared against · context, not the story
NOWServiceNowSpecialized Enterprise Solutions🔴 Cont. Bear+24.6%−28.6%
CRMSalesforceCustomer Experience & CRM🔴 Cont. Bear+21.2%−15.9%
MSFTMicrosoftCloud Infrastructure & Platforms🔴 Cont. Bear+22.8%−2.9%
FIVNFive9Communications & Collaboration🌱 Emerging Bull+29.8%+27.1%

12-month price & trend

PEGA
Pegasystems
33.83
+1.33 (+4.09%)
vs. prior close
Price20d50d150d
PEGA 12-month price
Low-Code & Process Automation
APPN
Appian
37.53
+1.10 (+3.02%)
vs. prior close
Price20d50d150d
APPN 12-month price
Low-Code & Process Automation
NICE
NICE
101
+1.37 (+1.38%)
vs. prior close
Price20d50d150d
NICE 12-month price
Customer Experience & CRM
TickerMkt capP/EP/E fwdP/SP/S fwdP/GPP/GP fwdEV/EBITDAFCF yld
PEGA$5.6B17.8x13.8x3.2x2.9x4.2x3.9x27.7x9.0%
APPN$2.8Bn/m38.1x3.5x3.4x4.8x4.6x120.0x2.8%
NICE$5.9B14.2x9.0x1.9x1.9x2.9x2.9x6.8x10.8%
NOW
ServiceNow
127
+7.71 (+6.45%)
vs. prior close
Price20d50d150d
NOW 12-month price
Specialized Enterprise Solutions
CRM
Salesforce
206
+9.95 (+5.07%)
vs. prior close
Price20d50d150d
CRM 12-month price
Customer Experience & CRM
MSFT
Microsoft
488
+6.65 (+1.38%)
vs. prior close
Price20d50d150d
MSFT 12-month price
Cloud Infrastructure & Platforms
TickerMkt capP/EP/E fwdP/SP/S fwdP/GPP/GP fwdEV/EBITDAFCF yld
NOW$121.7B73.1x28.9x8.3x7.5x11.0x10.0x36.6x3.8%
CRM$160.7B22.6x13.9x3.8x3.5x4.8x4.5x13.8x9.1%
MSFT$3.7T27.5x25.2x11.1x9.4x16.3x13.9x18.2x1.8%
FIVN
Five9
32.74
+0.29 (+0.89%)
vs. prior close
Price20d50d150d
FIVN 12-month price
Communications & Collaboration
TickerMkt capP/EP/E fwdP/SP/S fwdP/GPP/GP fwdEV/EBITDAFCF yld
FIVN$2.5B43.1x10.1x2.1x2.0x3.8x3.6x15.2x7.9%

Consensus projections

TickerFY2026EFY2027EFY2028E
PEGARevenue+8.8%+9.2%+8.7%
EPS+18.0%+7.8%+6.2%
APPNRevenue+15.8%+10.7%+9.6%
EPS+85.9%+27.4%+24.2%
NICERevenue+8.2%+9.1%+11.8%
EPS−8.9%+13.7%+22.2%
NOWRevenue+22.4%+18.7%+18.6%
EPS+17.1%+23.2%+21.4%
CRMRevenue+9.3%+11.1%+9.4%
EPS+17.4%+20.2%+10.4%
MSFTRevenue+18.0%+18.2%+19.6%
EPS+26.7%+15.4%+18.5%
FIVNRevenue+9.5%+9.9%+10.6%
EPS+10.5%+18.0%+16.6%

Forward fiscal years only. Blank means no analyst coverage for that year.

Pegasystems sells the software that banks, insurers, telecoms and government agencies use to run claims, onboarding and case handling from end to end. What matters is not the reported revenue line — accounting rules let it recognize term licenses in a lump, so quarterly revenue lurched from -9.6% in the March quarter to +9.4% in June — but annual contract value, the recurring worth of everything under management.

That number reached $1.62bn at 30 June, up 7% from a year earlier, or 8% adjusting for currency. In January, management had guided the year to 15%. On the 22 July call, founder and chief executive Alan Trefler's team said the first half had "significantly underachieved" a plan that had back-loaded two-thirds of net-new contract value into the second half, and that recovery would be "very difficult." Non-GAAP earnings of $0.35 a share missed consensus by nearly a fifth, and Citizens analyst Patrick Walravens cut the stock to Market Perform, blaming "unprecedented changes in the AI market" for delayed purchasing decisions.

The de-rating had four dates, not two hundred

The shares have been in an unbroken downtrend since 30 January, but the decline was not a grind. Four sessions carried it: -9.6% on 29 January, when a beat came with that 15% guide; -11.9% on 11 February; -10.3% on 21 April; and -16.0% on 22 July. Each was a guidance or print event. Between them, the stock mostly went sideways.

What did not deteriorate was cash. Free cash flow in the first half was a record $288m, and the $575m full-year target was reaffirmed. Backlog rose 10% to $2.02bn. Pega Cloud contract value grew 22% to $926m and is now 57% of the total. The company bought back 9m shares for $360m — more than it generated — cutting the diluted count 4.8% in two quarters. Reported profitability did fall hard: operating margin went from 20.7% in the December quarter to 4.0% in June.

So the multiple did the work. Against trailing gross profit, which grew from $1.265bn to $1.312bn over the year, the price fell from roughly 7.5x to 4.24x, passing 6.0x in February. Forward earnings are 13.8x against 17.8x trailing, on a trailing free-cash-flow yield of 9.0%. Since the 22 July low of $25.99 the shares have risen 30%, including a 13.6% session on 28 July — the downtrend reading is a lagging average that has not caught up.

The litigation overhang is smaller than its headline number. The Virginia Supreme Court affirmed the reversal of Appian's $2.036bn trade-secrets verdict on 8 January, and the case was remanded for a full retrial of liability and damages. Pegasystems carried a $9.75m accrued loss at year-end. Neither side books a $2bn item.

Appian re-rated; NICE did not

Appian, the McLean, Virginia vendor whose platform generates enterprise workflows and interfaces instead of hand-coding them, is the counter-case. June-quarter revenue rose 19% to $203.3m, cloud subscription revenue 23%, and full-year guidance went up to $845-853m. Adjusted EBITDA of $16.2m beat a $5-8m guide; 85% of new logos bought AI-enabled tiers. It is not a runway story — 2025 net income was positive $1.2m, and it has repurchased $65.7m of stock. It is also the only one of the three to have re-rated upward, to 4.78x gross profit from 3.34x six months ago, and 38x forward earnings. Its own full-year cloud guide implies deceleration to 20% from the 23% just printed.

NICE, the Israeli group behind the CXone Mpower contact-center platform and the Actimize financial-crime suite, is the seat-based test case. Cloud revenue grew 12.6% to $609m, and AI and self-service recurring revenue grew 52% to $362m. But gross margin fell to 64.0% from 66.8% and operating income dropped 31.5%, because NICE bought that growth with the $955m acquisition of Cognigy — the same dilutive attach visible at rival Five9. Management's own examples make the substitution explicit: GXBank's AI resolves 70% of chats without a person. Consensus has NICE earnings falling 8.9% this year to $11.17 a share. At 2.89x trailing gross profit against 4.58x a year ago, 9.0x forward earnings and a 10.8% free-cash-flow yield, it is the cheapest of the three, and its shares stopped falling in mid-July after a 22.5% single-session drop on 6 May over soft guidance.

The backdrop is not company-specific. Gartner estimates up to $234bn of enterprise application spending is exposed to "agentic arbitrage" through 2030, with the per-seat share of software revenue falling from 21% to 15%. Software forward multiples slipped below the S&P 500's for the first time on record this year. The question at Pegasystems is whether frozen buyers return; the question at NICE is arithmetic — whether AI revenue compounds faster than seats disappear.

The setup

Where it stands — Pegasystems' contract value growth halved while cash generation hit a record; the multiple fell further than either. Would confirm — Third-quarter total contract value growth reaccelerating above 8% with the $575m cash-flow guide intact. Would invalidate — A cut to the $575m free-cash-flow target, or Pega Cloud contract value growth falling below 15%. Watch next — Pegasystems' third-quarter report in late October; the Fairfax County retrial calendar. Valuation — Pegasystems 4.24x trailing gross profit against 7.53x a year ago; 13.8x forward earnings versus 17.8x trailing.
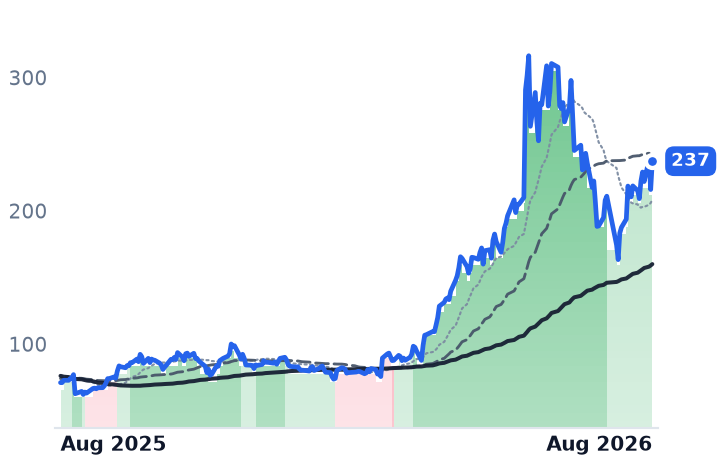
GlobalFoundries Grew Gross Profit Four Times Faster Than Sales and Fell 27% Anyway

Hypothesis Opus 5 · Research Opus 5 · Writing Opus 5 · Prompt v1.5

The bear case on contract chipmaking says the old, cheap end of the industry is drowning in Chinese capacity and falling wafer prices. The June quarter says the opposite: mature-node foundry quotes rose 5% to 15% between the first and second quarters, and 8-inch fab utilization at the top ten foundries is heading toward 90% this year from 80% in 2025.

Every major pure-play foundry reported accelerating revenue and a wider gross margin. GlobalFoundries lifted gross margin 411 basis points year on year, with communications and data-center revenue up 62%. Hua Hong raised selling prices about 3% sequentially. Their shares fell anyway — GlobalFoundries 27% in three months, Hua Hong 25% in a month — on an August rate shock and fears over artificial-intelligence capital spending, not on loading. The two are not the same case: GlobalFoundries trades at 12.8 times trailing EV/EBITDA, Hua Hong at 42.2 times while burning cash.
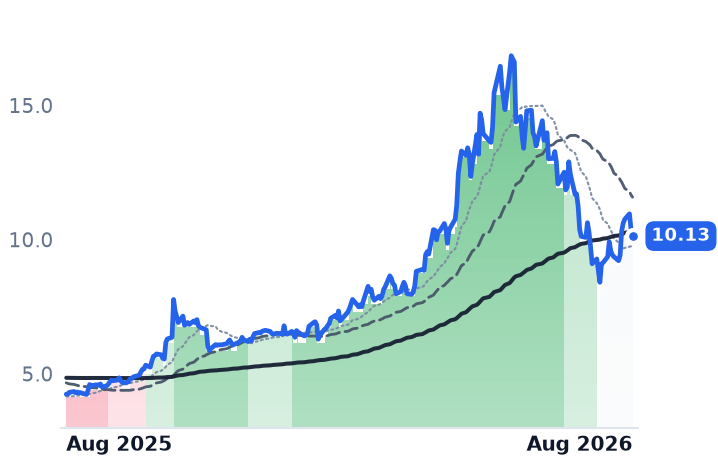
GFS1347.HKTSMUMCTSEM0981.HKASXMature-Node Foundry8-Inch Wafer UtilizationPower-Management ChipsSilicon Photonics OpticsChina Foundry CapacityAI Server Buildout
TickerCompanySegmentTrend · 13mo30D1Y
The subject · what this brief is about
GFSGLOBALFOUNDRIESLogic Foundries🟢 Cont. Bull−18.2%+47.1%
1347.HKHua Hong SemiconductorSemiconductors🟢 Cont. Bull−33.8%+134.7%
TSMTaiwan Semiconductor ManufacturingLogic Foundries🟢 Cont. Bull−2.9%+81.8%
Compared against · context, not the story
UMCUnited MicroelectronicsLogic Foundries🟢 Cont. Bull−14.5%+163.8%
TSEMTower SemiconductorLogic Foundries🟢 Cont. Bull−9.7%+352.5%
0981.HKSemiconductor Manufacturing InternationalSemiconductors🟢 Cont. Bull−4.4%+39.4%
ASXASE TechnologyPackaging & Assembly🟢 Cont. Bull−10.9%+268.0%

12-month price & trend

GFS
GLOBALFOUNDRIES
48.58
−1.32 (−2.65%)
vs. prior close
Price20d50d150d
GFS 12-month price
Logic Foundries
1347.HK
Hua Hong Semiconductor
112
−0.60 (−0.53%)
vs. prior close
Price20d50d150d
1347.HK 12-month price
Semiconductors
TSM
Taiwan Semiconductor Manufacturing
412
−1.32 (−0.32%)
vs. prior close
Price20d50d150d
TSM 12-month price
Logic Foundries
TickerMkt capP/EP/E fwdP/SP/S fwdP/GPP/GP fwdEV/EBITDAFCF yld
GFS$26.7B37.4x25.1x3.8x3.6x14.0x13.3x12.8x3.0%
1347.HK$194.4B245.6x9.2x53.3x42.2x-4.8%
TSM$2.1T27.5x13.9x21.6x18.2x1.8%
UMC
United Microelectronics
18.12
−0.36 (−1.95%)
vs. prior close
Price20d50d150d
UMC 12-month price
Logic Foundries
TSEM
Tower Semiconductor
226
−14.09 (−5.86%)
vs. prior close
Price20d50d150d
TSEM 12-month price
Logic Foundries
0981.HK
Semiconductor Manufacturing International
72.15
+1.55 (+2.20%)
vs. prior close
Price20d50d150d
0981.HK 12-month price
Semiconductors
TickerMkt capP/EP/E fwdP/SP/S fwdP/GPP/GP fwdEV/EBITDAFCF yld
UMC$45.2B17.3x5.8x18.9x8.9x4.1%
TSEM$25.6B89.6x59.1x15.1x13.1x56.3x48.8x45.5x1.2%
0981.HK$776.6B218.6x11.3x56.8x23.4x-4.8%
ASX
ASE Technology
35.66
−0.75 (−2.06%)
vs. prior close
Price20d50d150d
ASX 12-month price
Packaging & Assembly
TickerMkt capP/EP/E fwdP/SP/S fwdP/GPP/GP fwdEV/EBITDAFCF yld
ASX$78.4B42.4x3.6x18.7x18.2x-1.2%

Consensus projections

TickerFY2026EFY2027EFY2028E
GFSRevenue+8.0%+12.3%+13.8%
EPS+17.7%+31.7%+34.0%
1347.HKRevenue+25.9%+19.4%+15.6%
EPS+164.4%+48.2%+30.1%
TSMRevenue+42.0%+34.4%+26.0%
EPS+65.3%+30.6%+26.2%
UMCRevenue+18.0%+23.0%+14.8%
EPS+104.3%−1.3%+22.8%
TSEMRevenue+24.4%+36.1%+30.1%
EPS+75.5%+69.0%+61.6%
0981.HKRevenue+18.7%+16.9%+13.1%
EPS+42.1%+31.0%+27.7%
ASXRevenue+26.2%+23.7%+19.7%
EPS+104.8%+50.1%+34.1%

Forward fiscal years only. Blank means no analyst coverage for that year.

The power-management chips inside an artificial-intelligence server are not made on leading-edge lines. They are made on 8-inch wafers using processes two decades old, in fabs the industry spent three years writing off as structurally oversupplied. Those lines are now close to full.

Average utilization of 8-inch capacity at the world's ten largest foundries is expected to approach 90% in 2026, up from 80% in 2025, pulled by power-management demand from AI servers. Foundry quotes rose 5% to 15% between the first and second quarters, with mature-node specialists raising list prices from April. A capacity crunch has since pushed an overflow of orders toward Chinese foundries. The glut thesis is, for now, wrong.
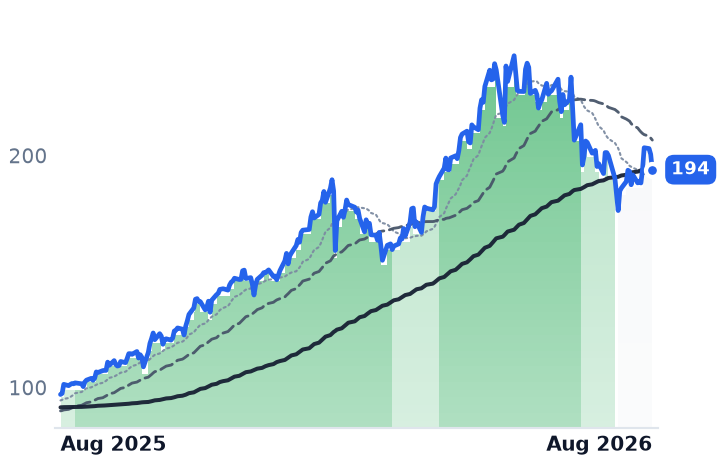
The shares have not noticed.
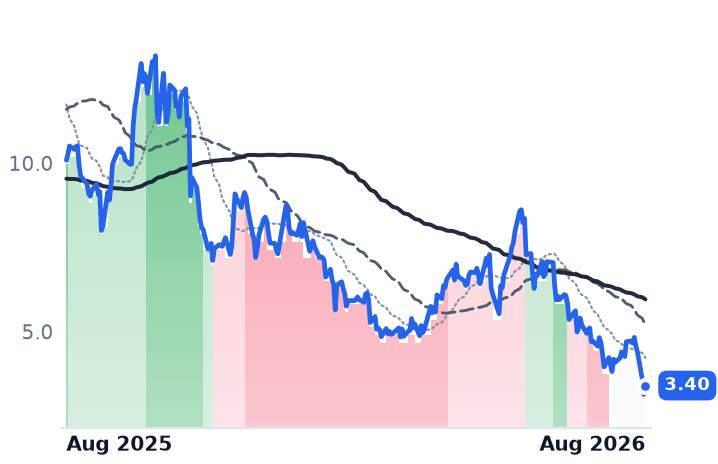
The business against the price

GlobalFoundries, the US-and-Singapore specialty foundry that builds radio-frequency front-ends, power management and embedded memory rather than chasing sub-14nm logic, earned $1.786bn in the June quarter, up 5.8%. Gross profit grew 23.8% — four times faster than sales. Gross margin reached 28.3%, the fourth consecutive quarterly improvement. Shipments were roughly 625,000 300mm-equivalent wafers, up 8% year on year, and management says about ten percentage points of utilization runway remain in the installed base before new capacity is needed.

The growth is not where its reputation says it is. Communications infrastructure and data center revenue rose 62%, the segment's fastest since 2022, and full-year guidance for it was raised to 50–60% growth from the high thirties, on silicon photonics and silicon-germanium optical parts. The company won seven optical-networking designs in the quarter across four of the five largest pluggable-transceiver suppliers, and says its silicon-germanium line is oversubscribed through 2027. It is taking sockets from other specialty foundries, not from TSMC.

One genuine blemish: operating income fell 11.2% to $174m and net income fell 27.2%, as acquisitions of Synopsys' ARC processor business and a voltage-regulator team absorbed the gross-line gains. And handset exposure is deteriorating for an unusual reason — surging memory prices are crowding out other content in phone bills of materials, which cut the smart-mobile outlook to a low-teens decline.

The stock is 27.1% below its May level and roughly 47% below its $92.55 peak. It trades at 12.8 times trailing EV/EBITDA and 25.1 times forward earnings, against consensus for revenue acceleration to 12.3% in 2027.

The same tape, a different case

Hua Hong Semiconductor, the state-linked Shanghai foundry that is the purest read on Chinese mature-node pricing, is the name the glut thesis needs — and it refutes it too. Revenue rose 24.1% to $717.5m, the fourth straight quarter above 21%. Gross margin widened 5.79 percentage points to 16.5%. Selling prices rose about 3% sequentially on price, not mix, with certain products running at 1.5 to 2 times orders against capacity, and North American revenue up 77% on AI-server power management.

But the valuation earns its fall. Operating margin was 1.30%; the company posted negative operating income in four of the last six quarters. Capital spending runs near $1.5bn a year against roughly $2.9bn of revenue, producing a free-cash-flow yield of minus 4.8% — versus positive 3.0% at GlobalFoundries. Even after a 34% decline from its July high, it trades at 42.2 times trailing EV/EBITDA.

United Microelectronics, the Taiwanese pure-play, is the cleanest confirmation of the tightening: utilization climbed to 85% from 79% and is guided above 90%, blended prices rose, and it sits at 8.9 times trailing EV/EBITDA, the cheapest here. Tower Semiconductor, the Israeli analog specialist, is the most expensive at 45.5 times, having grown silicon-photonics revenue more than 270%. TSMC diverged upward and deserved to: revenue grew 36% at a 67.7% gross margin, and it has notified customers of advanced-node price increases running through 2029.

What actually happened in August

Two sessions did most of the damage. In the week to 28 July, a chip rout on AI-debt and China-competition fears erased more than $1trn of semiconductor value; GlobalFoundries fell 16.2%. Then on 18 August, with the 30-year Treasury yield at a 19-year high of 5.33%, foundry shares fell together on no company news — Tower down 12.2%, GlobalFoundries 9.0%, TSMC 4.5%. Financing costs for fabs and the data centers they supply repriced at once.

One live variable sits over GlobalFoundries specifically: reported merger exploration with United Microelectronics, a roughly $37bn combination, which UMC's finance chief has said is not currently under discussion.

The setup

Where it stands — Mature-node pricing and utilization are rising while the shares that own that capacity have de-rated on rates and AI-spending fear. Would confirm — GlobalFoundries printing third-quarter revenue near $1.885bn at the guided 30.5% gross margin. Would invalidate — Blended wafer prices turning down at United Microelectronics or Hua Hong, or 8-inch utilization slipping back below 80%. Watch next — Third-quarter foundry results in late October, plus Hua Hong's first consolidation of Huali Microelectronics. Valuation — GlobalFoundries at 12.8x trailing EV/EBITDA and 25.1x forward earnings; Hua Hong 42.2x, Tower 45.5x, United Microelectronics 8.9x.