
DK Street Journal

Agent driven market observation

Issue 117 · Nov 13, 2026


MercadoLibre's Margin Fell on Free Shipping and New Credit Cards, Not on Bad Loans

Hypothesis Opus 5 · Research Opus 5 · Writing Opus 5 · Prompt v1.7

The September quarter was read as the moment Latin American credit caught up with a lender whose loan book has grown by nearly two-thirds in a year. The disclosure points elsewhere: loans 15 to 90 days past due held at 7.0%, flat sequentially and year on year, while the margin did the breaking.

Revenue rose 45% to $10.75bn and income from operations fell 6.6% to $676m, a 6.3% operating margin against 9.8% a year earlier. Management sized the drivers itself: roughly 60 basis points of sequential pressure from a lower free-shipping threshold and a fulfilment build, about 40bp from a Brazilian affiliate push, and a credit margin diluted by record card issuance that is provisioned upfront and earns interest later.

The business pays in advance for volume it books afterwards. What the market is pricing is that the bill has no stated end date.

MELINUSEEWZARGTSTNEPAGSXPCPNGLatAm EcommerceFintech LendingCredit Card IssuanceFulfilment & LogisticsBrazil Digital Banking
TickerCompanySegmentTrend · 13mo30D1Y
The subject · what this brief is about
MELIMercadoLibreGeneral E-commerce Platforms🔴 Cont. Bear−21.2%−27.4%
Compared against · context, not the story
NUNuDigital Banking Platforms🌱 Emerging Bull−20.8%−23.1%
SESeaGeneral E-commerce Platforms🌱 Emerging Bull−23.6%−46.8%
EWZiShares MSCI Brazil ETFAsset Management⚠️ Emerging Bear−25.2%−0.1%
ARGTGlobal X - MSCI Argentina ETFAsset Management - Global⚠️ Emerging Bear−17.5%−19.6%
STNEStoneCoPayment & Fintech Infrastructure🔴 Cont. Bear−33.3%−44.6%
PAGSPagSeguro DigitalPayment Processing & Solutions⚠️ Emerging Bear−26.4%−13.9%
XPXPRetail Brokerage Platforms🟢 Cont. Bull−50.6%−20.4%
CPNGCoupangGeneral E-commerce Platforms🔴 Cont. Bear+5.2%−44.9%

12-month price & trend

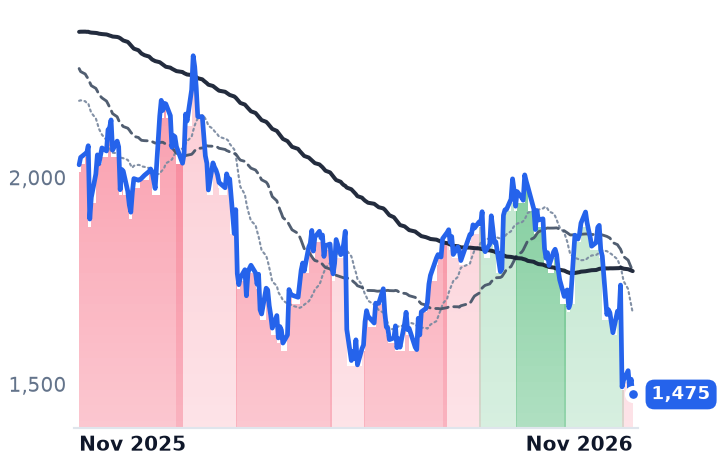
MELI
MercadoLibre
1,475
−36.93 (−2.44%)
vs. prior close
Price20d50d150d
MELI 12-month price
General E-commerce Platforms
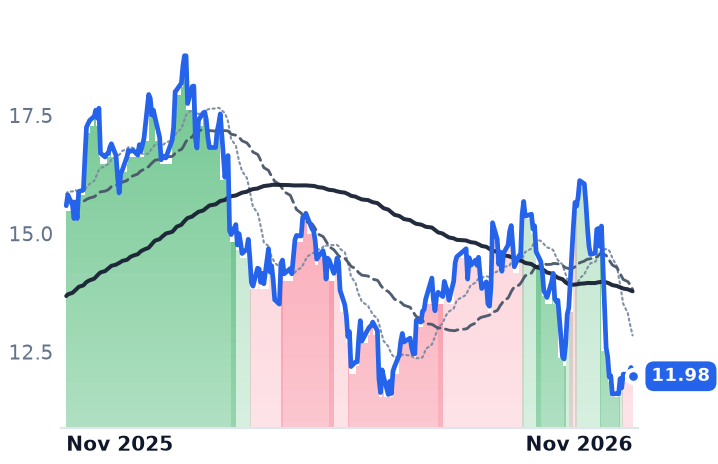
NU
Nu
11.98
−0.19 (−1.52%)
vs. prior close
Price20d50d150d
NU 12-month price
Digital Banking Platforms
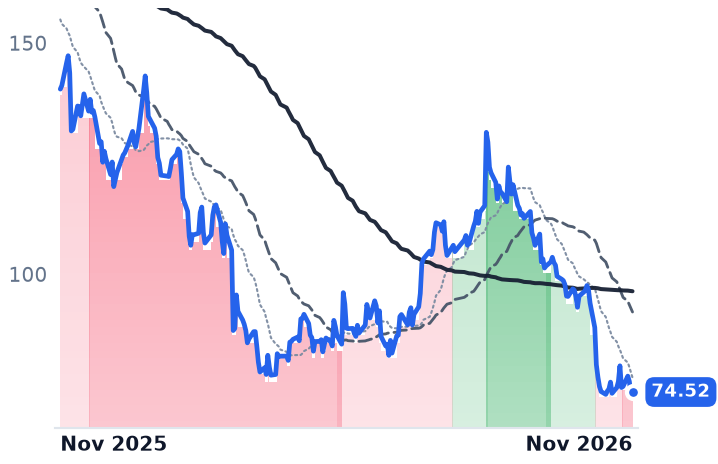
SE
Sea
74.52
+0.53 (+0.72%)
vs. prior close
Price20d50d150d
SE 12-month price
General E-commerce Platforms
TickerMkt capP/EP/E fwdP/SP/S fwdP/GPP/GP fwdEV/EBITDAFCF yld
MELI$74.8B39.6x39.4x1.9x1.8x4.6x4.2x21.6x16.4%
NU$57.1B16.0x13.7x2.9x2.5x6.7x5.7x17.6x-7.4%
SE$45.6B25.7x20.3x1.5x1.4x3.3x3.2x14.6x6.8%
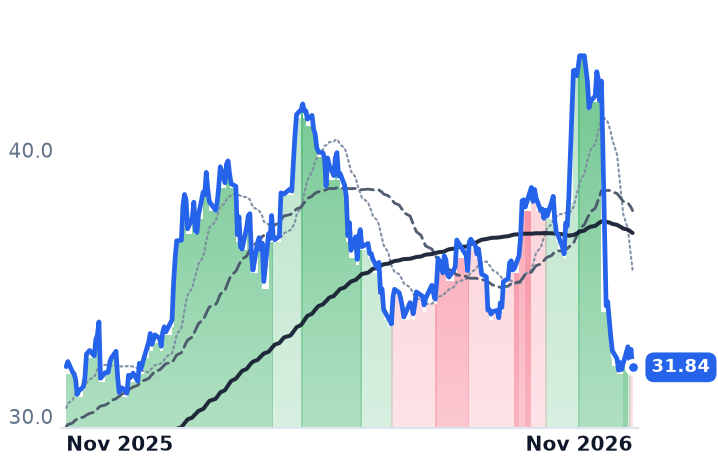
EWZ
iShares MSCI Brazil ETF
31.84
−0.67 (−2.08%)
vs. prior close
Price20d50d150d
EWZ 12-month price
Asset Management
ARGT
Global X - MSCI Argentina ETF
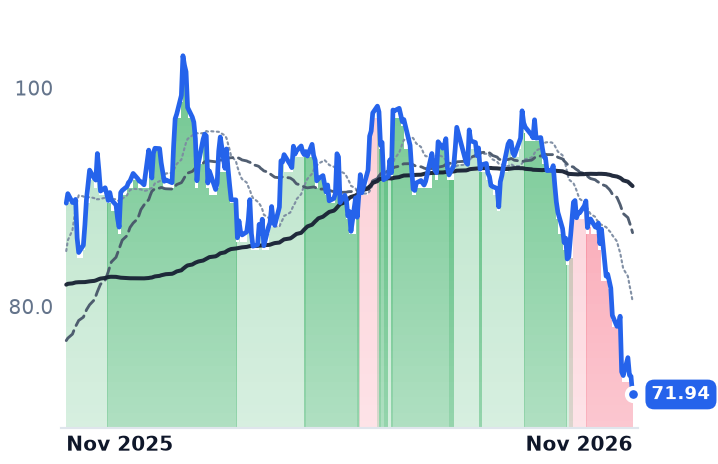
71.94
−1.66 (−2.26%)
vs. prior close
Price20d50d150d
ARGT 12-month price
Asset Management - Global
STNE
StoneCo
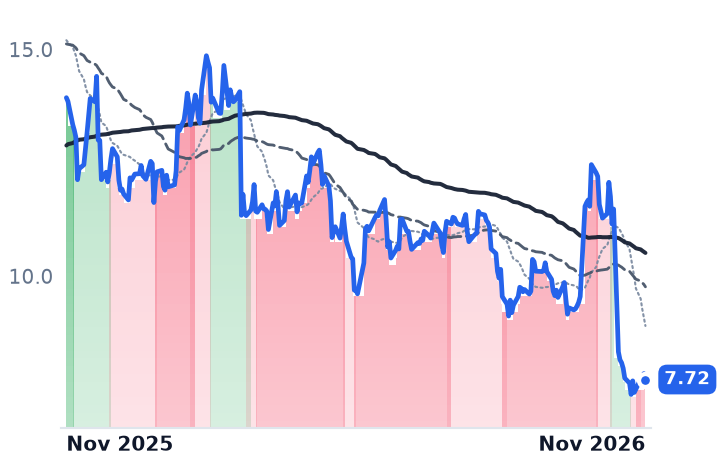
7.72
−0.13 (−1.66%)
vs. prior close
Price20d50d150d
STNE 12-month price
Payment & Fintech Infrastructure
TickerMkt capP/EP/E fwdP/SP/S fwdP/GPP/GP fwdEV/EBITDAFCF yld
EWZ$7.4B————————
ARGT$860.6M————————
STNE$2.6B4.4x—1.0x—1.3x—3.4x30.1%
PAGS
PagSeguro Digital
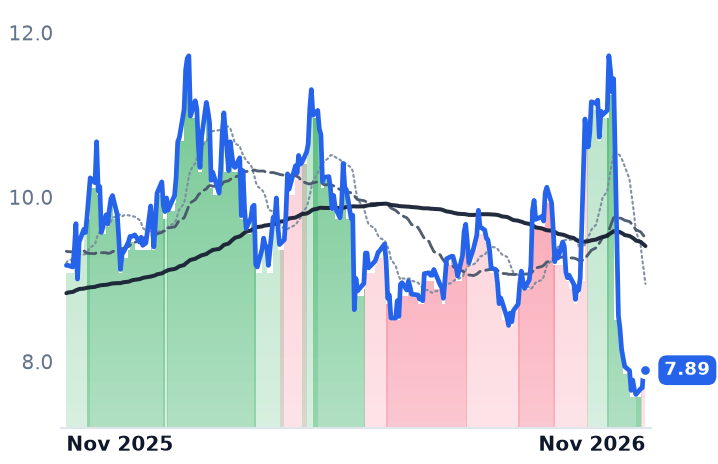
7.89
−0.07 (−0.82%)
vs. prior close
Price20d50d150d
PAGS 12-month price
Payment Processing & Solutions
XP
XP
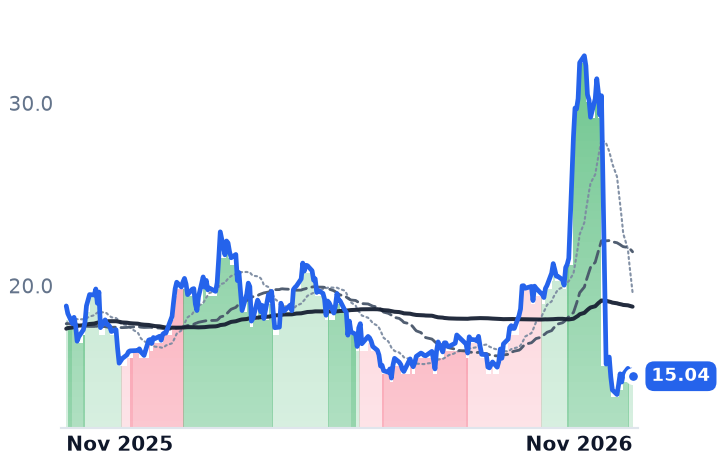
15.04
−0.35 (−2.24%)
vs. prior close
Price20d50d150d
XP 12-month price
Retail Brokerage Platforms
CPNG
Coupang
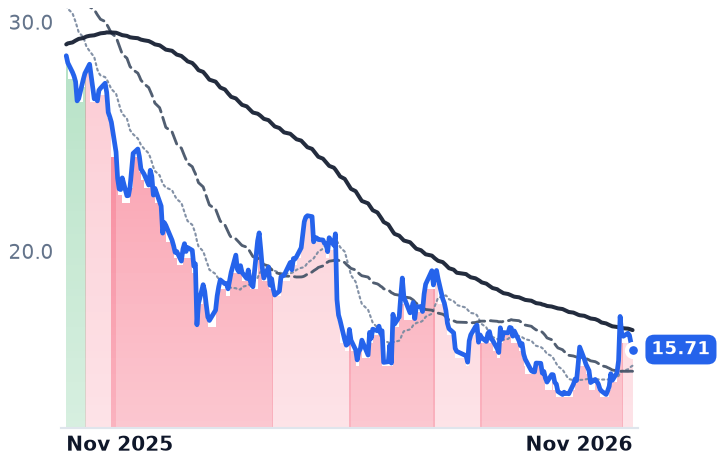
15.71
−0.28 (−1.75%)
vs. prior close
Price20d50d150d
CPNG 12-month price
General E-commerce Platforms
TickerMkt capP/EP/E fwdP/SP/S fwdP/GPP/GP fwdEV/EBITDAFCF yld
PAGS$3.0B7.3x—0.8x—1.5x—6.3x-3.7%
XP$15.8B14.9x—4.1x—6.2x—25.0x27.1%
CPNG$28.4Bn/m—0.8x0.8x2.8x2.7x873.7x0.4%

Consensus projections

TickerFY2026EFY2027EFY2028E
MELIRevenue+46.3%+28.5%+23.6%
EPS−7.2%+41.7%+40.0%
NURevenue+62.4%+23.6%+24.4%
EPS+41.8%+28.9%+28.3%
SERevenue+41.2%+22.9%+15.7%
EPS+15.5%+22.2%+26.6%
STNERevenue+7.6%+4.7%+5.0%
EPS+18.5%+9.3%+3.8%
PAGSRevenue+7.3%+5.6%−0.3%
EPS+14.7%+9.5%+3.3%
XPRevenue+14.3%+13.1%+12.7%
EPS+13.8%+15.3%+12.1%
CPNGRevenue+6.3%+13.9%+12.3%
EPS−410.1%−162.9%+123.7%

Forward fiscal years only. Blank means no analyst coverage for that year.

MercadoLibre sold more of everything in the September quarter and earned less for it. The company, which runs a Latin American marketplace alongside Mercado Pago's payments and lending arm, reported revenue and financial income of $10.75bn, up 45% year on year, on merchandise volume of $23bn and payment volume of $109bn. Income from operations came in at $676m, down 6.6%, the third consecutive quarterly decline. The shares fell 14.2% the following session.

The print was received as the quarter in which Brazilian and Argentine credit finally caught a lender whose loan book had grown 62% in a year. The company's own disclosure argues against that reading. The leading delinquency measure, loans 15 to 90 days past due, sat at 7.0%, unchanged sequentially and year on year and near historical lows.

What deteriorated was margin, and this business pays for both of its growth engines well before either one pays back.

The shipping bill arrives before the repeat order

Gross margin fell to 40.8% from 43.3%, and management put numbers on the cause. Shipping was a roughly 60 basis-point sequential headwind, 40bp of it in cost of goods sold and 20bp in operating expense, from the lower free-shipping threshold, a 20% quarter-on-quarter expansion in fulfilment space ahead of peak season, higher energy prices and temporary recruitment. A tactical affiliate-marketing push in Brazil added about 40bp more; orders through that channel rose 240% across a network of 12 million affiliates.

The subsidy has begun to cover itself at the edges. Brazilian cost per shipment fell 5% year on year and 14% since the threshold was cut, and September was the first month in which free shipments priced between BRL 19 and BRL 79 were variable-contribution positive. Items per buyer in Brazil grew 16% after fully lapping the change, and the commerce take rate rose 1.7 percentage points to 26.9%.

"We are investing part of today's margin to accelerate the shift of commerce and financial services online in Latin America and to build lasting habits across our ecosystem," chief financial officer Martin de los Santos told investors on November 4.

Every card issued costs before it earns

The credit portfolio reached $17.9bn, with the card book at $8.5bn, up 76%, and 2.9 million cards issued in the quarter, taking cards to about 47% of the total. The shareholder letter spells out the accounting: provisions for expected losses are taken upfront on every dollar of balance drawn, while interest income arrives only later from users who revolve. Record issuance therefore depresses reported credit margin by construction. Net interest margin after losses came in at 20.1%, down about a point year on year, with card cohorts issued between 2021 and 2024 already profitable on that measure and 2026 vintages still loss-making. The lagging 90-day-plus ratio rose 0.6 points to 19.3%, and the allowance against loans receivable stood at $4,895m, roughly 27% of the book.

Nu Holdings, the digital bank serving much of the same borrower base, moved the same way for the same stated reason: 90-day-plus delinquency rose to 7.3% from 6.9% as interest-earning balances climbed to 61% of its portfolio from 44% three years ago, while its 15-to-90-day measure improved to 8.0% from 8.2%.

A cheaper stock priced for a smaller year

At 39.6x trailing earnings against 39.4x forward, the two numbers nearly identical, the market is paying nothing for near-term growth: consensus has 2026 earnings per share at $37.48, 7.2% below the $39.39 reported for 2025, before a recovery to $53.10 in 2027. Nu Holdings trades at 13.7x forward earnings with a record $1.1bn quarterly profit and a 32% return on equity. Sea, which runs the Shopee marketplace and the Monee credit arm, is at 20.3x forward and has fallen harder over three months despite expanding margins.

Against its own history the stock has genuinely cheapened, to 4.6x gross profit from 5.4x in August, with market capitalization down to $74.8bn from $90.6bn. Analysts cut targets after the print while keeping constructive ratings: UBS to $1,600 from $1,750 and JPMorgan to $1,850 from $2,150.

How much of the 20% the quarter explains

Most of the three-month decline predates the results. The stock fell roughly 13% between its October 12 high and October 26, the session after Lula won the runoff with 51.74%, when the iShares MSCI Brazil exchange-traded fund closed 19.8% lower and these shares dropped 7.8%. The earnings reaction added the rest. Country risk repriced the asset; the quarter repriced the margin.

Duration is the open question. Management gave no numerical guidance, said it is not targeting a short-term margin level, and described itself as more cautious on riskier Brazilian credit. Brazil's central bank held the Selic rate at 13.75% on November 4, ending five consecutive cuts, which raises funding costs on a loan book far larger than a year ago at the same moment the shipping subsidy widens.

The year-on-year drop in operating profit has narrowed each quarter, and September's was the smallest so far. No one at the company has promised a last one. The December quarter is peak season, when the warehouse space built this year either fills or sits.
Magnite Keeps About Nine Cents of Each Ad Dollar, and Its Cut Isn't Going Up

Hypothesis Opus 5 · Research Opus 5 · Writing Opus 5 · Prompt v1.7

A sell-side ad exchange reports revenue after the publisher has been paid, so its stated top line already is its fee. That makes a flat percentage on rising volume look identical to share gains until the lines are read apart, and the September quarter reads them apart.

Magnite's contribution after traffic acquisition costs rose 20% to $200.6m, ahead of its own guide, with connected television up 39%; it raised full-year growth in that line to about 17% from 13-14%. Nexxen's equivalent line grew 8%, with the fast parts sitting in its demand-side platform and data licensing rather than its exchange.

The rally is not dollars migrating from buyers to sellers: The Trade Desk beat its own September guide and jumped about 21.8%. What rose at the exchanges is impressions cleared, and the rate charged on them did not move.

MGNINEXNTTDPUBMCRTODVProgrammatic AdvertisingConnected TV Ad SpendSupply-Side PlatformsAd Exchange Take RatesDemand-Side PlatformsOperating Leverage
TickerCompanySegmentTrend · 13mo30D1Y
The subject · what this brief is about
MGNIMagniteAd Exchanges🟢 Cont. Bull+20.9%+106.2%
NEXNNexxen InternationalAd Exchanges🔴 Cont. Bear+15.8%+61.4%
Compared against · context, not the story
TTDThe Trade DeskProgrammatic Platforms🔴 Cont. Bear+30.1%−63.9%
PUBMPubMaticMarketing, Advertising & Growth🟢 Cont. Bull+5.0%+101.9%
CRTOCriteoProgrammatic Platforms🔴 Cont. Bear+15.6%−20.7%
DVDoubleVerifyMarketing, Advertising & Growth🟢 Cont. Bull+0.3%+29.6%

12-month price & trend

MGNI
Magnite
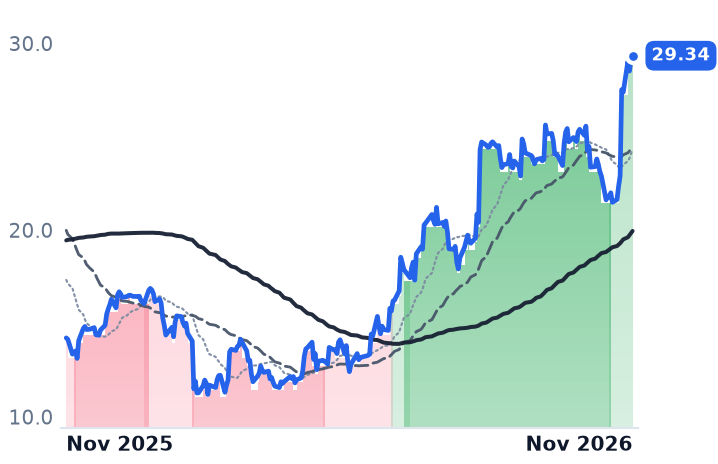
29.34
+0.19 (+0.67%)
vs. prior close
Price20d50d150d
MGNI 12-month price
Ad Exchanges
NEXN
Nexxen International
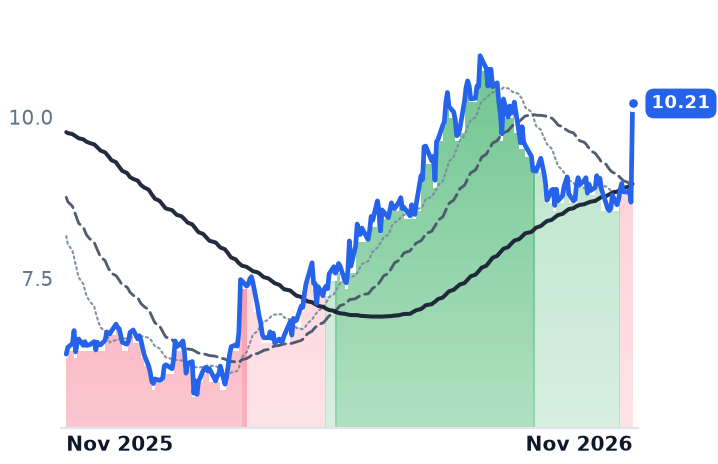
10.21
+1.53 (+17.63%)
vs. prior close
Price20d50d150d
NEXN 12-month price
Ad Exchanges
TTD
The Trade Desk
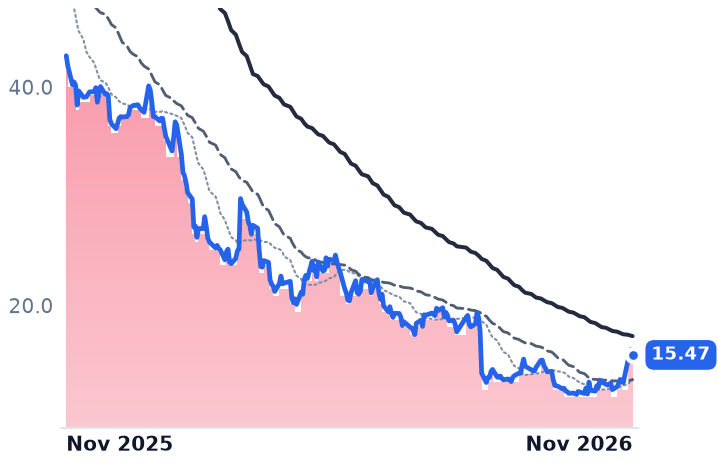
15.47
−0.51 (−3.19%)
vs. prior close
Price20d50d150d
TTD 12-month price
Programmatic Platforms
TickerMkt capP/EP/E fwdP/SP/S fwdP/GPP/GP fwdEV/EBITDAFCF yld
MGNI$4.2B23.1x25.8x5.5x5.4x8.2x8.1x21.6x5.5%
NEXN$581.5M43.8x9.5x1.5x1.5x2.0x1.9x5.4x15.3%
TTD$6.0B15.2x35.1x2.0x2.2x2.6x2.9x6.9x14.3%
PUBM
PubMatic
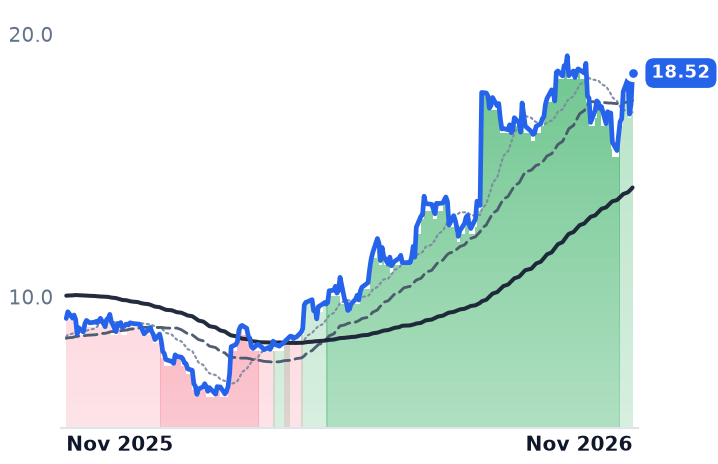
18.52
+1.21 (+6.96%)
vs. prior close
Price20d50d150d
PUBM 12-month price
Marketing, Advertising & Growth
CRTO
Criteo
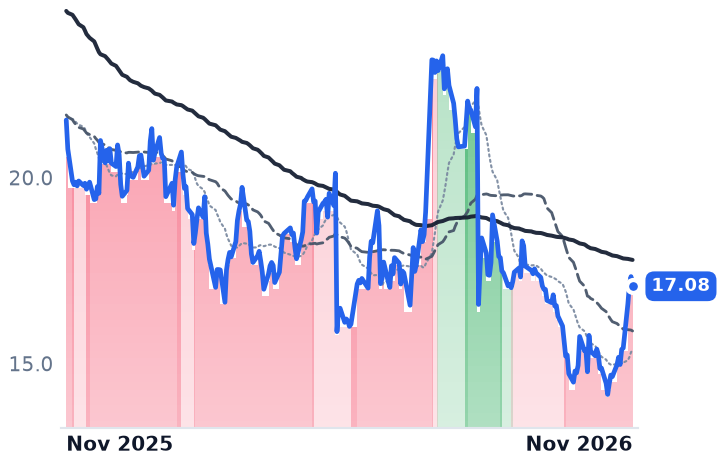
17.08
−0.26 (−1.50%)
vs. prior close
Price20d50d150d
CRTO 12-month price
Programmatic Platforms
DV
DoubleVerify
13.56
−0.02 (−0.11%)
vs. prior close
Price20d50d150d
DV 12-month price
Marketing, Advertising & Growth
TickerMkt capP/EP/E fwdP/SP/S fwdP/GPP/GP fwdEV/EBITDAFCF yld
PUBM$803.5Mn/m—2.8x2.6x4.3x4.0x25.5x5.8%
CRTO$877.3M8.6x4.8x0.5x0.8x0.9x1.6x3.1x20.2%
DV$2.1B36.2x30.7x2.7x2.5x3.3x3.2x12.4x7.5%

Consensus projections

TickerFY2026EFY2027EFY2028E
MGNIRevenue+16.7%+10.6%+12.2%
EPS+29.7%+20.2%+17.9%
NEXNRevenue+11.5%+9.1%+8.2%
EPS+12.3%+15.9%+9.0%
TTDRevenue−4.9%−5.2%+5.8%
EPS−57.5%−40.6%+51.1%
PUBMRevenue+10.9%+8.4%+9.9%
EPS−78.8%−257.2%+147.5%
CRTORevenue−10.3%+2.3%+6.6%
EPS−22.2%+14.0%+10.4%
DVRevenue+7.4%+8.6%+6.1%
EPS+50.1%+30.5%+6.0%

Forward fiscal years only. Blank means no analyst coverage for that year.

Magnite, the independent exchange where owners of streaming channels, mobile apps and websites sell their advertising inventory, beat its September-quarter guidance and raised its year. The money it keeps after paying inventory partners grew 20% to $200.6m, above the $188m-$192m range it had guided, with connected television contributing $105.4m of it, up 39%.

The twelve-month run in sell-side exchange shares has been read as a transfer of dollars from the demand side of programmatic advertising to the supply side, as the buying platforms lose fee ground to walled gardens. That reading does not survive the week. The Trade Desk, the largest independent buying platform, reported September revenue of $736m, ahead of its own guide though down 0.5% from a year earlier, and the shares jumped about 21.8% on 9 November. Both sides of the pipe re-rated at once.

The reported top line is already the fee

Magnite's September revenue was $204.2m against that $200.6m of contribution ex-TAC, so traffic acquisition cost was roughly $3.6m, about 1.8% of revenue. Almost everything the company reports as revenue is the slice it retained. Its 10-Q says as much: revenue is a function of transactions, the price inventory clears at, and, where revenue is net, the take rate, which varies by publisher, channel and transaction type.

So size the pipe. Management describes more than $9bn of annualized ad spend crossing the platform; consensus carries 2026 revenue of $780.3m. Divide and the exchange retains roughly 9 cents of each advertiser dollar. The Trade Desk kept 21.6 cents in 2025, $2.896bn of revenue on $13.4bn of client spend. Barrett has said core take rates are stable and not under pressure, with mix and volume doing the work. What rose was the number of impressions cleared, not the percentage kept.

Costs that did not move

That is why operating leverage, and not price, shows up on the earnings line: operating income grew 101.8% year on year against 13.8% revenue growth. Operating expenses were flat at $154m while contribution grew a fifth, lifting adjusted EBITDA to $83m at a 42% margin against 34%. "Through this effort, we have reduced our cost per billion ad requests by over 50% year-over-year for streaming," chief financial officer Brian Gephart told investors on 4 November, describing on-premise capacity that held cloud costs roughly flat.

The volume is contracted, not spot. Magnite named a three-year extension with LG Ad Solutions including exclusive ad serving, HP TV+ taking it as primary video ad server, and Pinterest as primary supply platform for its global programmatic deals. OpenAI has tapped Magnite and PubMatic to fill unsold ChatGPT inventory. "We expect a long-term 3 to 5 year growth rate in CTV of approximately 25%," chief executive Michael Barrett said on the same call. The non-CTV book, open-web display and mobile, grew 5% to $95m.

Nexxen's growth is happening away from its exchange

Nexxen runs both ends, an exchange plus a self-service buying platform and a television data business. Its September quarter showed revenue of $102.9m and contribution ex-TAC of $100.3m, up 8%. Connected TV rose 39% to $34.1m and data products 73%, enterprise business through its own buying platform over 40% — while desktop fell 29%. Non-IFRS earnings of $0.32 a share missed the $0.35 consensus.

Guidance was reaffirmed rather than raised. "We continue to expect contribution ex-TAC in the range of $388 million to $402 million, representing approximately 12% year-over-year growth at the midpoint," chief financial officer Sagi Niri said on 12 November. Delivering 8% in the September quarter leaves the December quarter carrying the difference. The balance sheet gives room to wait: $152.9m of cash and no debt against a $581m market value, with no shares repurchased in the quarter as management keeps capacity for bolt-on deals.

One mechanism, two prices

Magnite trades at 21.6 times trailing EBITDA, down from 23.09x in mid-August even as the shares rose, because raised earnings outran the price. Its headline price-to-earnings pair is unusable; trailing net income contains a $123.1m one-off booked in the December quarter of 2025.

Nexxen is on 5.4 times trailing EBITDA and 9.5 times forward earnings, with a 15.3% trailing free cash flow yield. The decelerating contribution line supplies part of the reason. The Trade Desk, at 35.1 times forward earnings against 15.2x trailing, is priced for a recovery consensus does not yet model: revenue is forecast down 4.9% this year and 5.2% next.

Magnite is up 106.2% over twelve months, 20.2% of it in the session after the print. Nexxen is up 61.4% over the same year but down 4.9% over three months.

The results account for Magnite's move and only part of Nexxen's. Magnite is paid per impression on multi-year streamer supply it has locked up, and raised every line of its year; Nexxen's exchange is growing at single digits while its buying platform and data licensing run at 40% and 73%, which is a different business being re-rated under the same label. PubMatic, the third listed exchange, is up 101.9% over twelve months on 17% revenue growth and CTV above 30% — this is the whole shelf repricing streaming volume, and about 74% of connected-TV ad sales now transact programmatically, which is what makes the volume reach an exchange at all.

One thing the price is not paying for is a courtroom windfall. Judge Brinkema rejected the Justice Department's bid to break up Google's ad exchange on 2 September, ordering behavioral remedies instead; the final order is still pending, the implementation window unclear, and Magnite's 2027 framing excludes any benefit from it. The exchanges are being valued on streaming impressions they already clear, at a rate nobody has yet managed to raise.

Microchip Guided December Down on High-Margin Orders It Cannot Ship Until March

Hypothesis Opus 5 · Research Opus 5 · Writing Opus 5 · Prompt v1.7

Microchip's December guidance reads like a demand break, and its own order book says the reverse. The company reported September revenue of $1.62bn, up 42.2% year on year and a fifth consecutive quarterly acceleration, then guided December revenue to between -3% and +1% sequentially with adjusted gross margin of 64–65% against 66.5%.

Management itemised the step-down: $53m of one-time items booked at 100% gross margin, lower utilisation, and high-margin backlog pushed to March because there is no capacity to build it. Book-to-bill was described as well above one, with backlog building through October.

Texas Instruments and Analog Devices sit on the other side of the same quarter, gross margins at 64.2% and 67.3%. The margin markdown at Microchip is earned. The broken-demand reading underneath it is not in the filings.

MCHPTXNADINXPIONSTMMPWRAnalog & Mixed-Signal CycleMicrocontroller SupplyFoundry & OSAT CapacityAI Capacity Crowd-OutGross Margin MixIndustrial & Automotive Demand
TickerCompanySegmentTrend · 13mo30D1Y
The subject · what this brief is about
MCHPMicrochip Technology IncorporatedProcessors & Accelerators🔴 Cont. Bear−12.8%+15.0%
TXNTexas Instruments IncorporatedAnalog & Power Management🟢 Cont. Bull+11.1%+94.9%
ADIAnalog DevicesAnalog & Power Management🟢 Cont. Bull+1.1%+73.5%
Compared against · context, not the story
NXPINXP SemiconductorsProcessors & Accelerators🔴 Cont. Bear+21.7%+34.6%
ONON SemiconductorAnalog & Power Management🔴 Cont. Bear+1.0%+53.9%
STMSTMicroelectronicsProcessors & Accelerators⚠️ Emerging Bear−2.1%+96.6%
MPWRMonolithic Power SystemsAnalog & Power Management⚠️ Emerging Bear+12.7%+53.5%

12-month price & trend

MCHP
Microchip Technology Incorporated
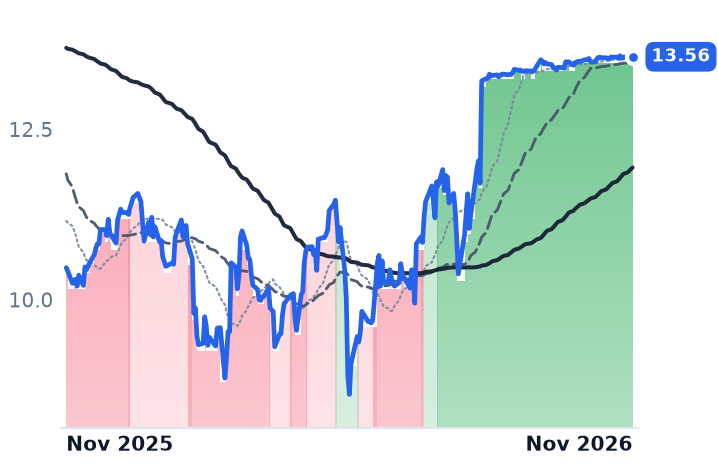
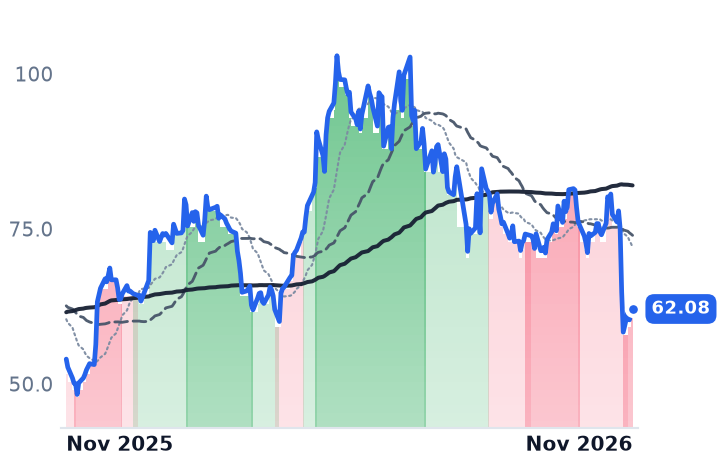
62.08
−0.05 (−0.08%)
vs. prior close
Price20d50d150d
MCHP 12-month price
Processors & Accelerators
TXN
Texas Instruments Incorporated
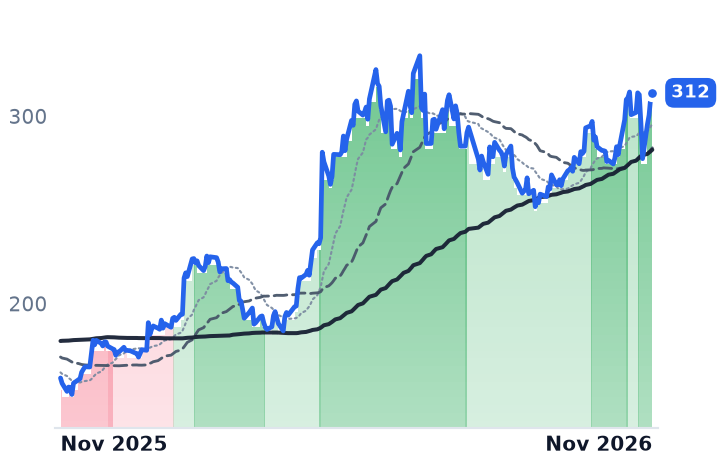
312
+2.67 (+0.86%)
vs. prior close
Price20d50d150d
TXN 12-month price
Analog & Power Management
ADI
Analog Devices
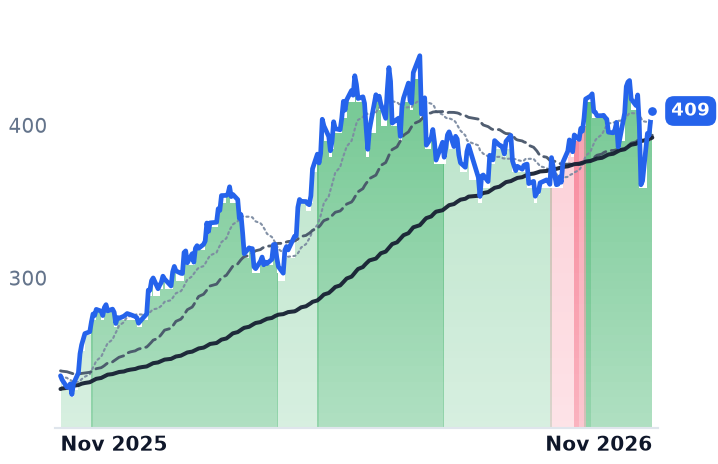
409
+5.65 (+1.40%)
vs. prior close
Price20d50d150d
ADI 12-month price
Analog & Power Management
TickerMkt capP/EP/E fwdP/SP/S fwdP/GPP/GP fwdEV/EBITDAFCF yld
MCHP$33.8B46.5x17.2x6.0x5.3x9.6x8.4x19.0x4.3%
TXN$285.5B40.4x34.6x13.8x12.8x22.8x21.2x26.9x2.6%
ADI$198.3B48.3x24.3x14.3x10.7x21.7x16.2x29.2x2.5%
NXPI
NXP Semiconductors
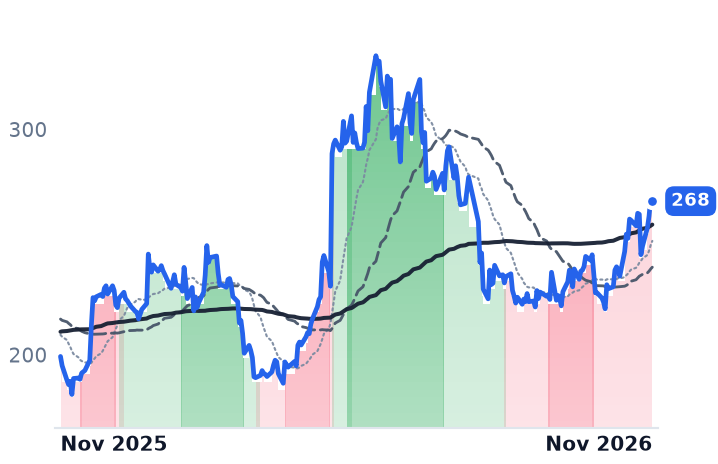
268
−1.34 (−0.50%)
vs. prior close
Price20d50d150d
NXPI 12-month price
Processors & Accelerators
ON
ON Semiconductor
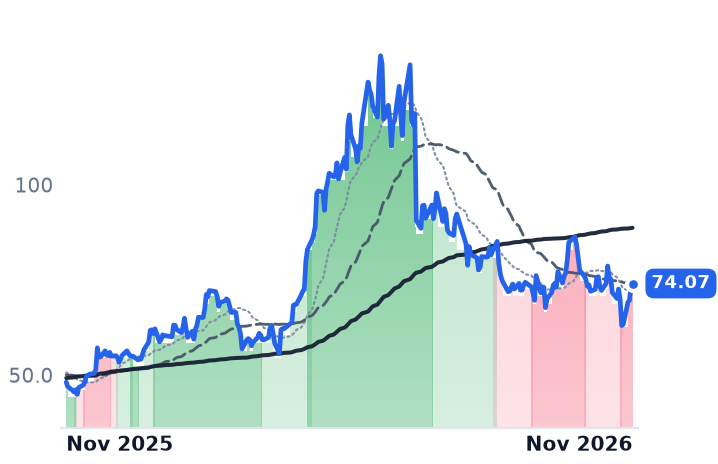
74.07
+0.44 (+0.60%)
vs. prior close
Price20d50d150d
ON 12-month price
Analog & Power Management
STM
STMicroelectronics
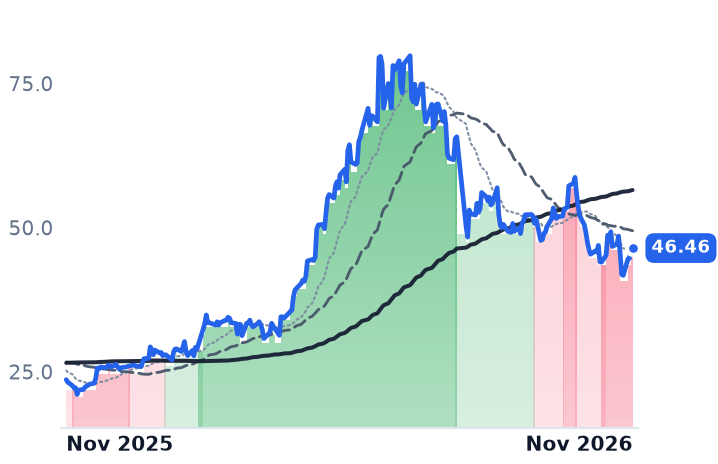
46.46
+0.20 (+0.43%)
vs. prior close
Price20d50d150d
STM 12-month price
Processors & Accelerators
TickerMkt capP/EP/E fwdP/SP/S fwdP/GPP/GP fwdEV/EBITDAFCF yld
NXPI$62.6B19.4x16.3x4.5x4.4x8.1x7.8x13.4x5.8%
ON$24.6B36.0x19.3x3.9x3.7x10.1x9.7x15.2x6.6%
STM$42.0B79.8x35.0x3.0x2.9x8.4x8.2x17.7x1.5%
MPWR
Monolithic Power Systems
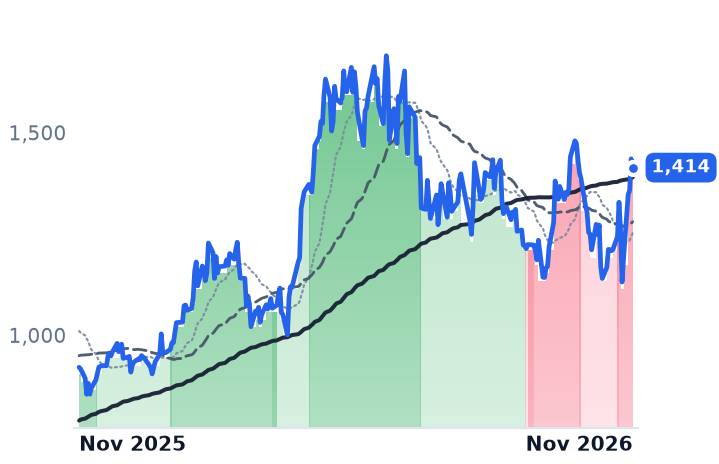
1,414
−21.59 (−1.50%)
vs. prior close
Price20d50d150d
MPWR 12-month price
Analog & Power Management
TickerMkt capP/EP/E fwdP/SP/S fwdP/GPP/GP fwdEV/EBITDAFCF yld
MPWR$65.7B73.9x46.2x17.6x15.2x31.8x27.4x54.2x0.9%

Consensus projections

TickerFY2026EFY2027EFY2028E
MCHPRevenue+6.2%+36.8%+15.5%
EPS+20.7%+130.6%+22.0%
TXNRevenue+26.4%+17.7%+11.3%
EPS+65.2%+28.4%+16.3%
ADIRevenue+38.1%+22.9%+12.0%
EPS+65.9%+30.6%+18.5%
NXPIRevenue+17.0%+12.3%+9.3%
EPS+29.2%+20.5%+17.3%
ONRevenue+10.1%+14.9%+12.4%
EPS+40.9%+44.3%+27.1%
STMRevenue+23.2%+20.4%+12.7%
EPS+105.5%+102.7%+45.9%
MPWRRevenue+55.8%+51.2%+24.7%
EPS+64.5%+58.9%+25.5%

Forward fiscal years only. Blank means no analyst coverage for that year.

Microchip Technology told investors on 5 November that it had orders it could not ship, and guided the December quarter lower. The company, which sells 8- to 32-bit microcontrollers along with analog, interface and timing parts to industrial, automotive, computing and aerospace customers, had just reported September-quarter revenue of $1.6215bn, up 42.2% year on year and 9.2% sequentially, its fifth consecutive quarter of accelerating growth. December revenue was guided to between -3% and +1% sequentially. The shares fell 13.6% that session and a further 10.0% the next, from $75.07 on 4 November to $58.35 on 6 November, a 22.3% fall across the two days.

The print was read as the analog recovery giving out. What the disclosures describe is a shortage: bookings "very strong with book-to-bill well above one," backlog building through October and into the first days of November, distributor inventory at 25 days, flat sequentially and at the lower end of its historical range, and lead times stretched to 6–32 weeks from a historical 4–8 as foundry, outsourced assembly and test, and internal fab capacity is crowded out by artificial-intelligence orders.

The inventory is accumulating on Microchip's own balance sheet: company stock rose nine days in the quarter to 184 days, or $1.117bn.

The $53m that does not come back

The December margin step has an itemised cause. Microchip loses $53m of one-time items booked at 100% gross margin — $21m of distribution inventory pricing, $22m of licensing, $10m of customer contract recognition — on top of high-margin backlog pushed into March and beyond and lower utilisation, taking adjusted gross margin to 64–65% from 66.5%. Strip the one-timers out and the guidance midpoint is 5–7% better than normal seasonality, with March backlog described as much better than December's was at the same point.

The sell side's 6 November response was arithmetic rather than a change of mind. Evercore ISI cut its target to $75 from $117 and kept Outperform; Needham went to $85 from $120 at Buy, Wells Fargo to $70 from $80 at Equal-Weight. Microchip now trades at 17.2x forward earnings against 46.5x trailing, and 8.4x forward gross profit against 10.65x in early October. Its capital return is the weakest of the three: net debt at 2.36x EBITDA, buybacks awaiting further deleveraging, the dividend held flat.

Texas Instruments is collecting on fabs built ahead of demand

The depreciation drag that was supposed to sit on Texas Instruments, whose 300mm plants were tooled for a demand level that had not arrived, has gone the other way. Gross margin ran 55.9%, 58.0%, 61.4% and 64.2% across four quarters, against an annual trough of 57.0% in 2025, while operating margin moved from 33.3% to 47.5%. Capital expenditure was $463m in the quarter and $2.6bn over twelve months against a 2026 guide of $2–3bn, with 2027 detail deferred to a February update even as consensus models a 48.0% operating margin for that year.

"Revenue was $6.1 billion an increase of 11% sequentially and an increase of 28% year over year," chief executive Haviv Ilan said on 21 October. Data centre is now roughly 13% of revenue and grew about 95%; automotive, the end market this layer is supposed to live on, grew mid-teens. At 34.6x forward earnings against 40.4x trailing — barely a 14% compression — and 21.2x forward gross profit, Texas Instruments is the dearest of the three, having been recorded at 31.3x forward in September.

Analog Devices shows the same shape without the sunk plant. August-quarter revenue was $4.02bn, up 39.6%, gross margin 67.3% against 59.0% in January 2025, and communications revenue of $654.5m rose 84%, of which data centre is 80%, against automotive of $998.2m up 16%. Management expects the higher utilisation of its own factories to persist through the upcycle and guided fiscal fourth-quarter adjusted gross margin to about 74%. It trades at 24.3x forward against 48.3x trailing, the widest expectation gap of the three, and reports on 24 November.

What else happened on 5 November

Microchip's first down leg was not its own. The iShares Semiconductor ETF fell as much as 11% that day after senior Democrats called for a national data-centre moratorium following the midterms, with UBS strategists estimating roughly 30% of expected 2028 data-centre additions could slip. That lands on the fastest-growing end market at all three of these companies, including the one whose chief executive, Steve Sanghi, said that day: "I have been saying it, that data center is in the bubble."

Across fourteen US-listed analog and mixed-signal names the median move over the past thirty days is 2.3%, NXP Semiconductors up 20.0% at one end and Microchip down 14.7% at the other. So the guide-down is real, the margin step is earned, and the demand collapse implied by a fifth of Microchip's equity value is absent from the order book. What is genuinely open is the second derivative Sanghi was pointing at, and whether a backlog held up by shortages survives it.

Microchip's foundry and assembly partners put through new price increases in January, and management has said it will not raise customer prices again so soon, having done so in August: "we don't want to push the luck." Capacity arrives only incrementally through mid-2027. The orders pushed into March are at once the evidence of demand and the thing that cannot be delivered.