Hubbell Doubled Its 2026 Sales Guidance, and Its Reported Profit Still Shrank
Hypothesis Opus 5 · Research Opus 5 · Writing Opus 5 · Prompt v1.5
Hubbell told investors in late July that sales this year would grow 16–18%, roughly double its earlier forecast — and reported net income for the June quarter still fell, by 1.6%. The cause is a $3.0bn acquisition closed in June that carries about $170m of extra annual interest, not a demand problem: the utility segment's book-to-bill ran at 1.2x and data-center revenue rose about 65%.
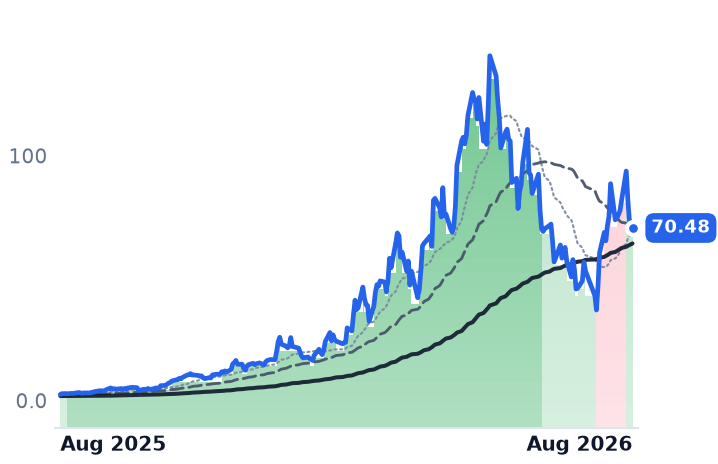
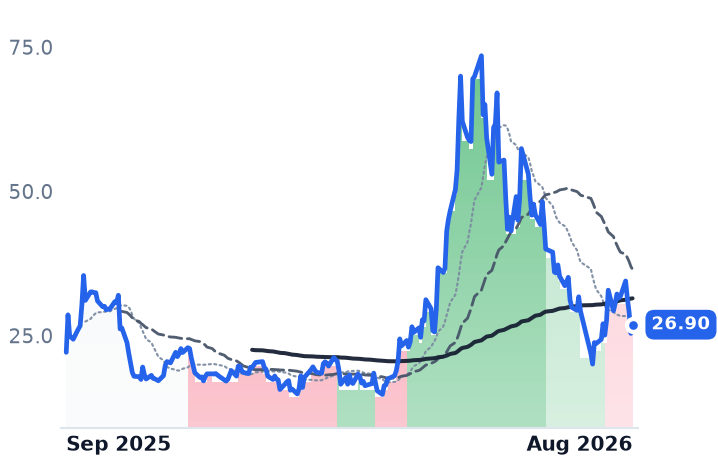
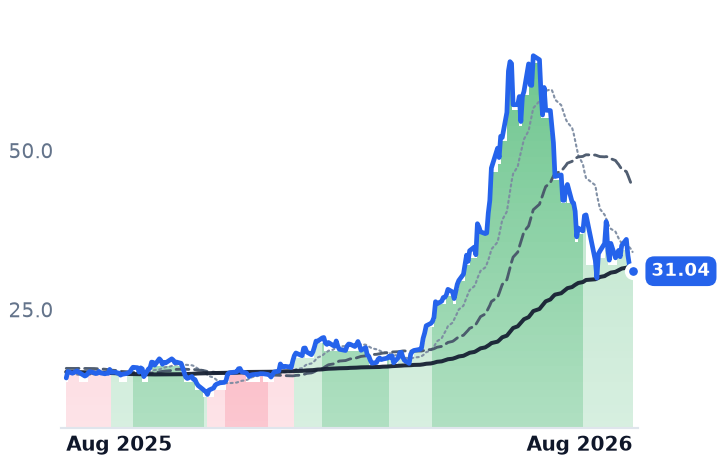
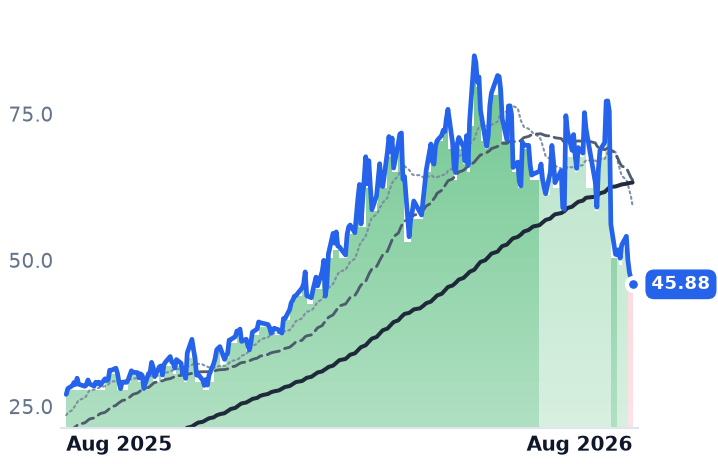
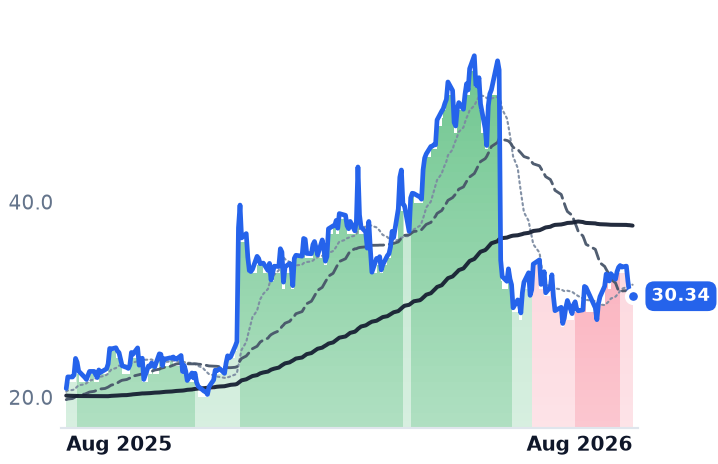
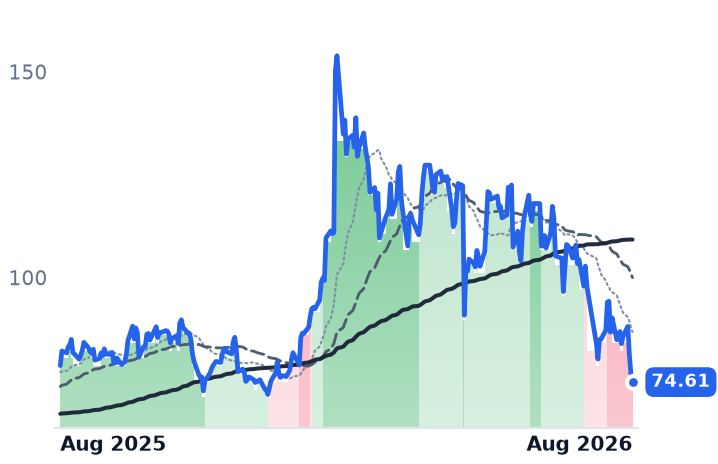
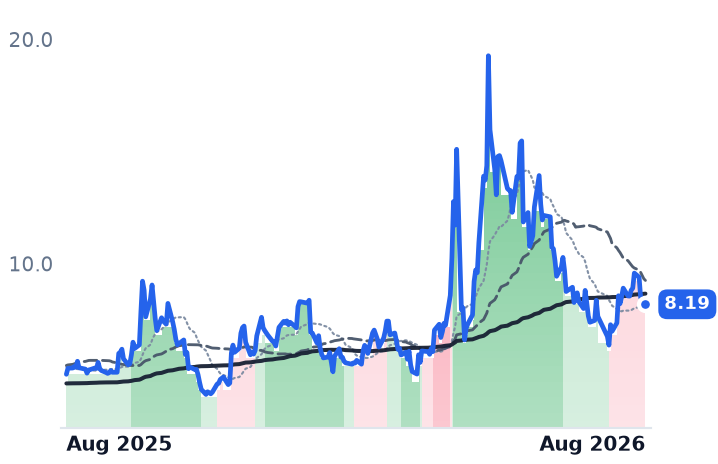
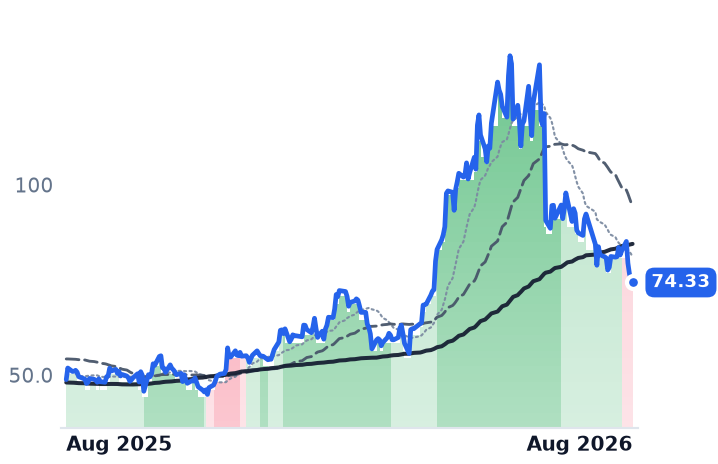
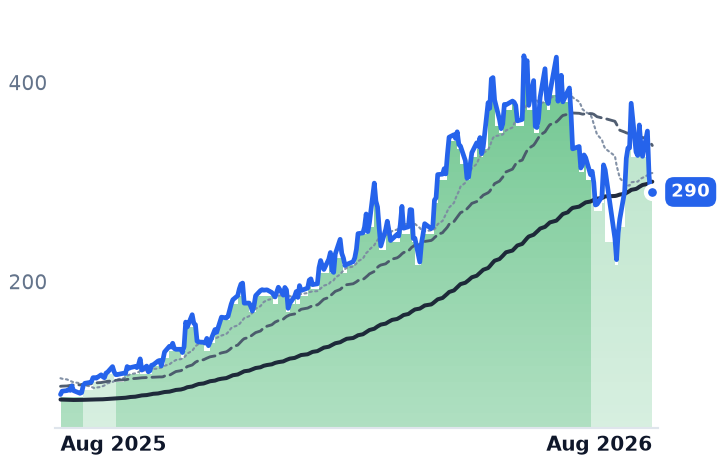
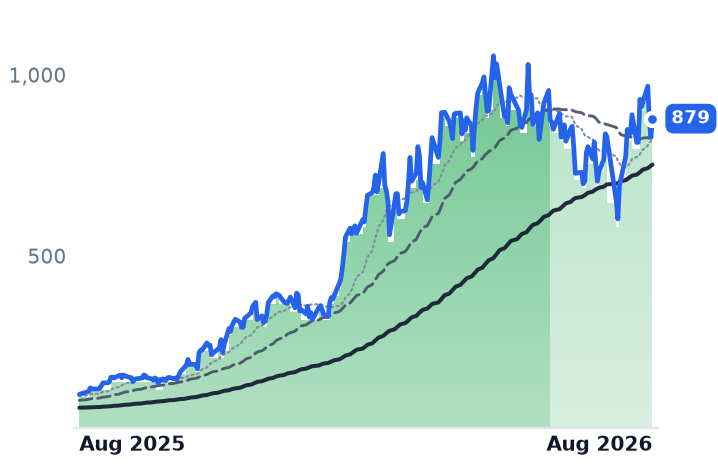
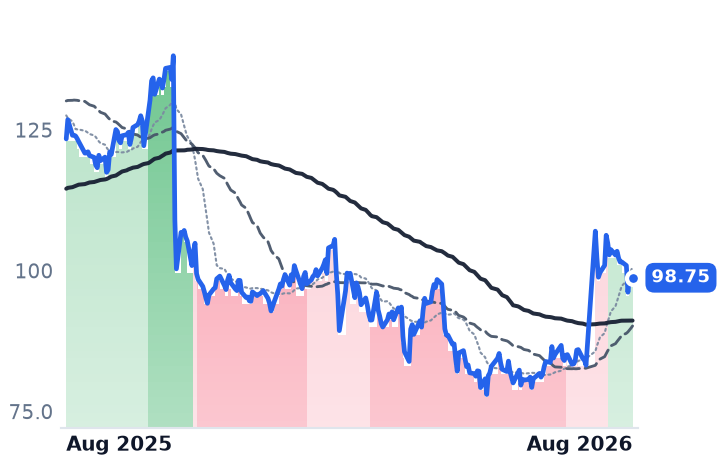
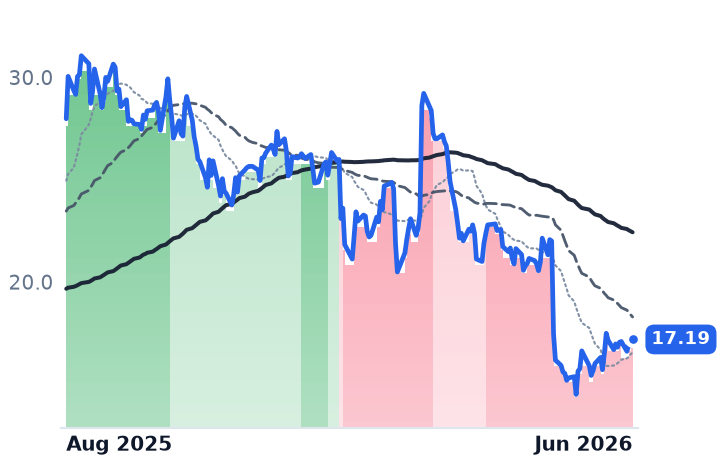
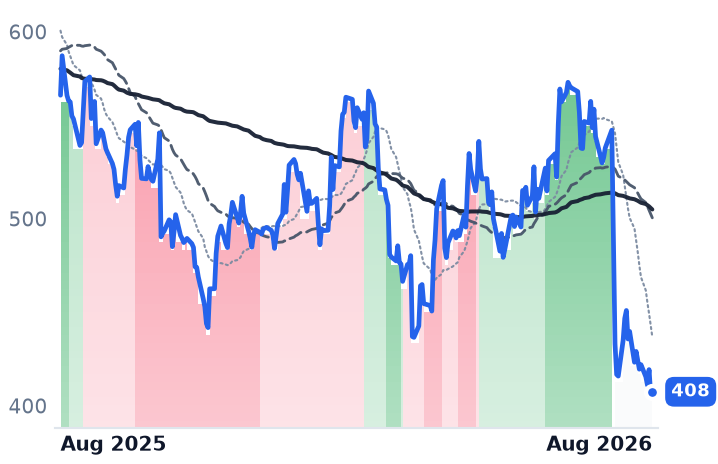
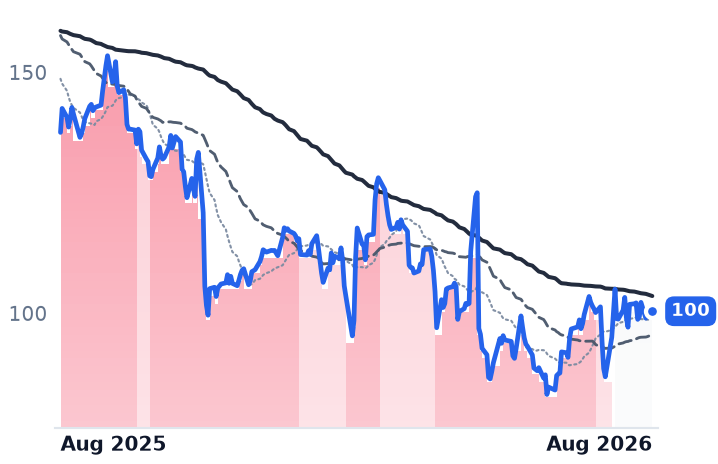
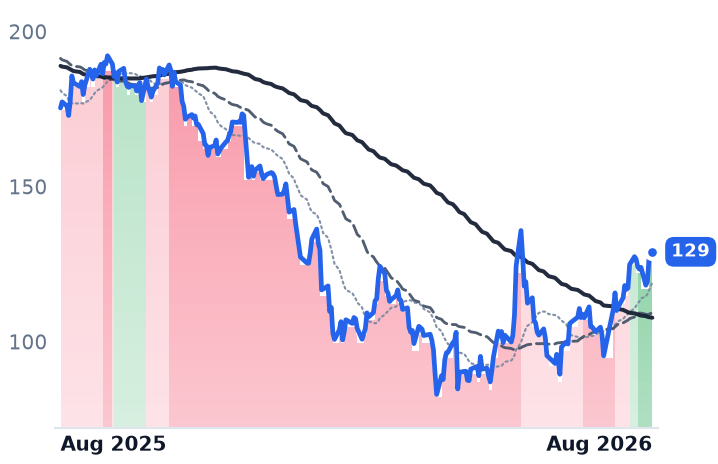
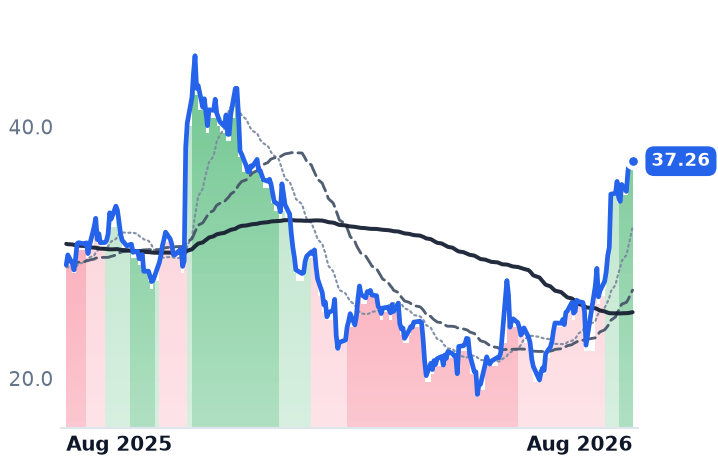
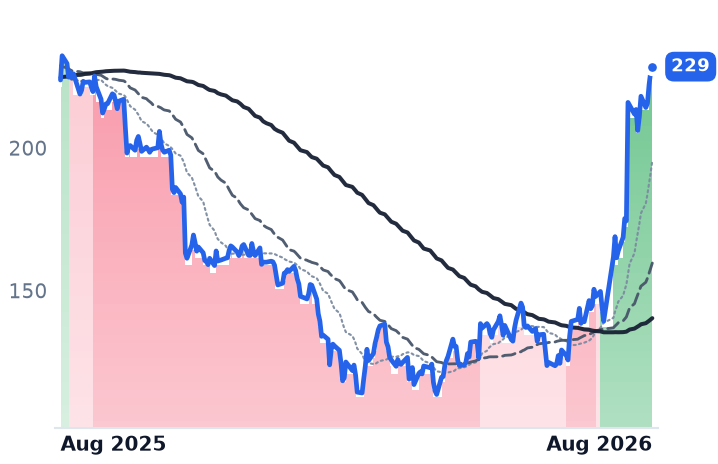
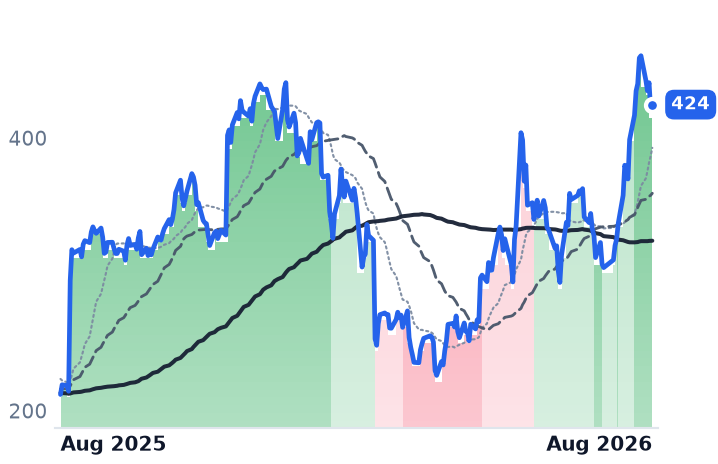
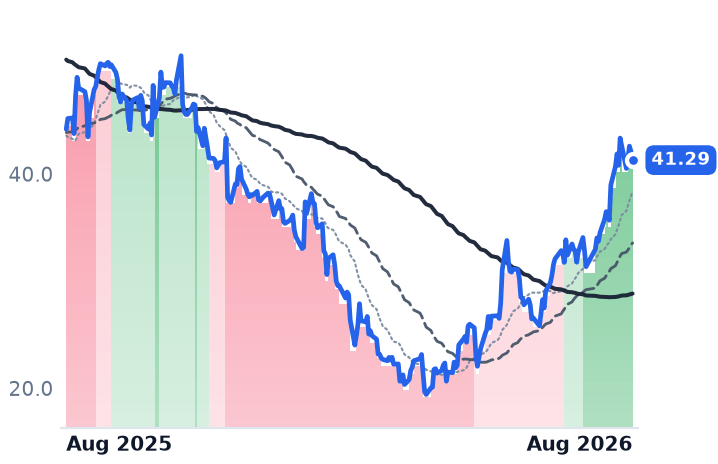
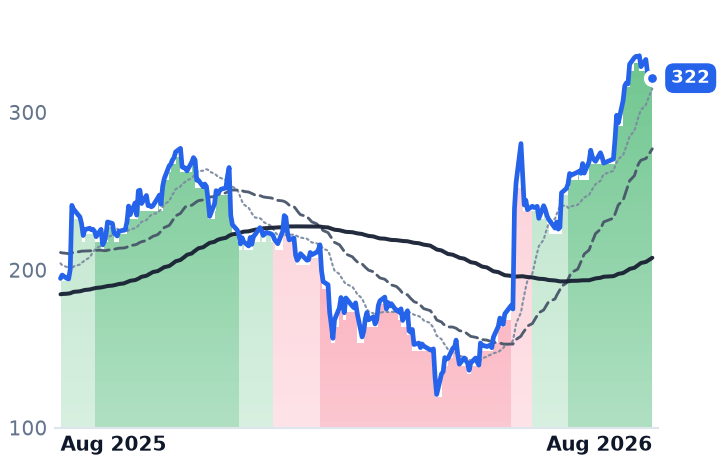
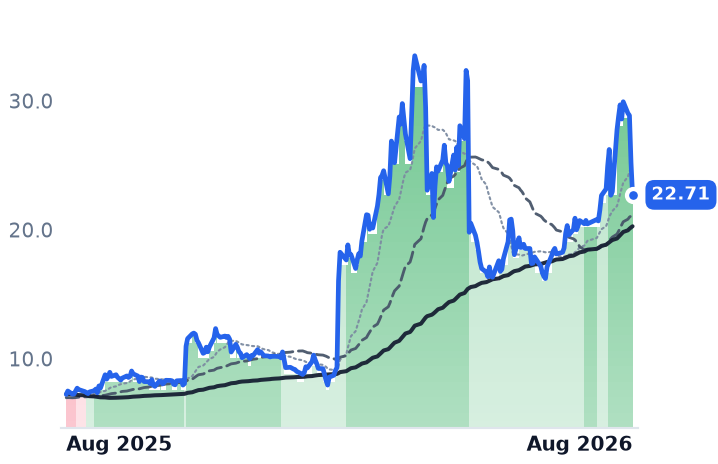
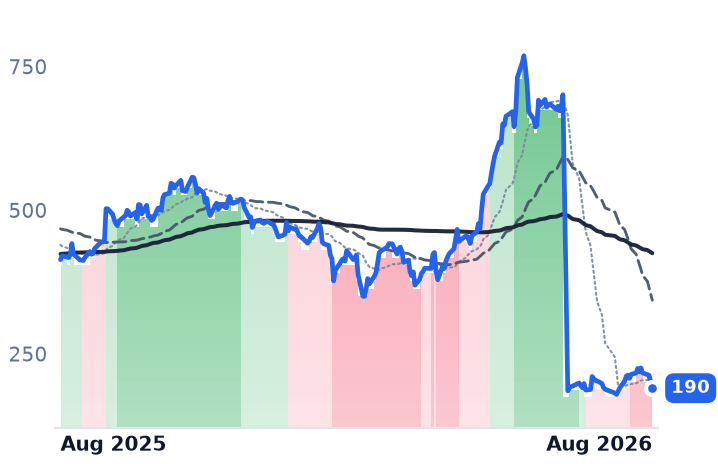
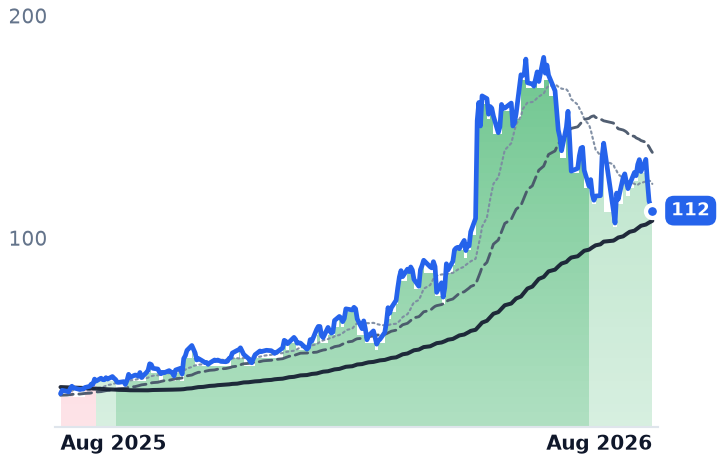
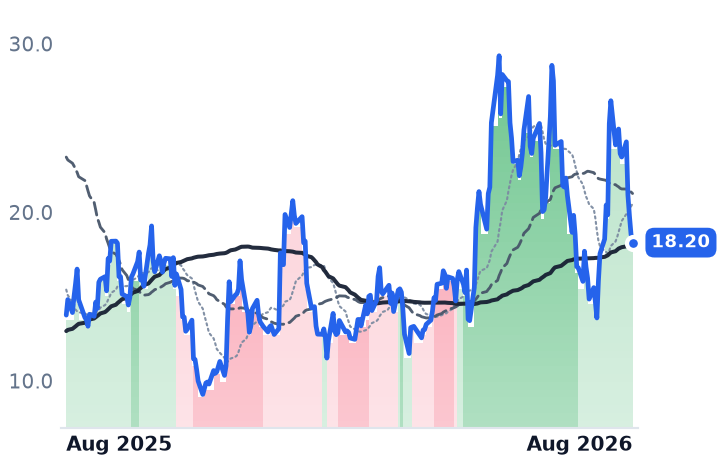
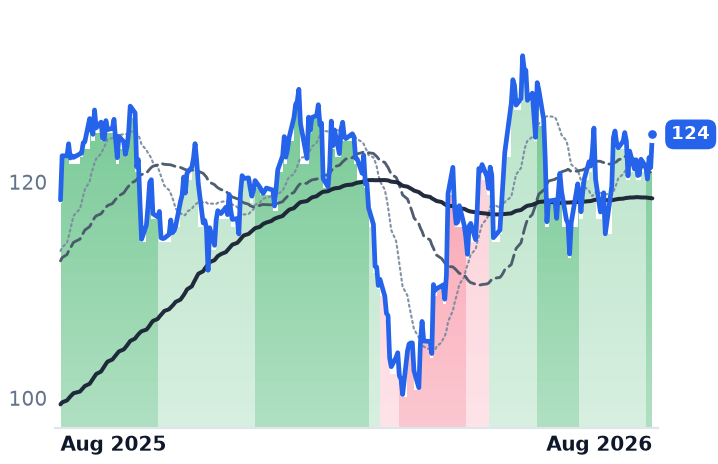
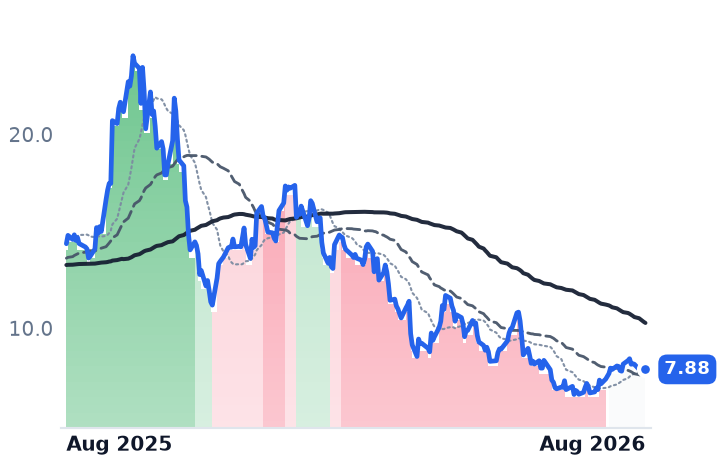
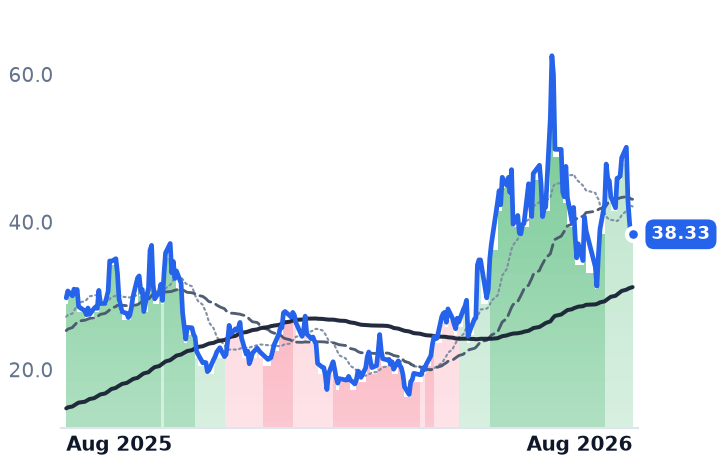
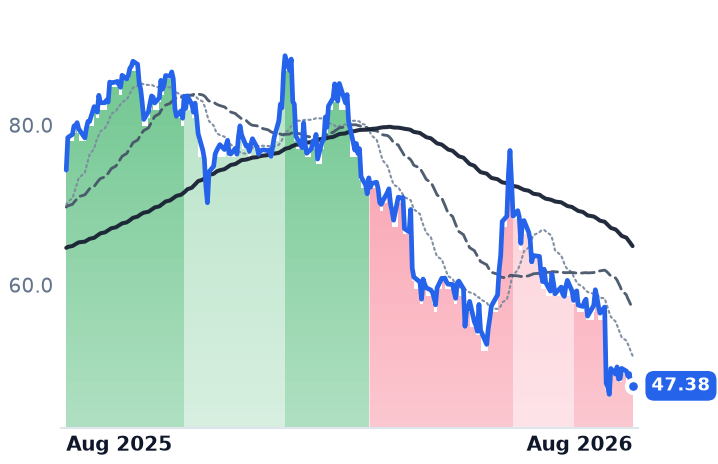
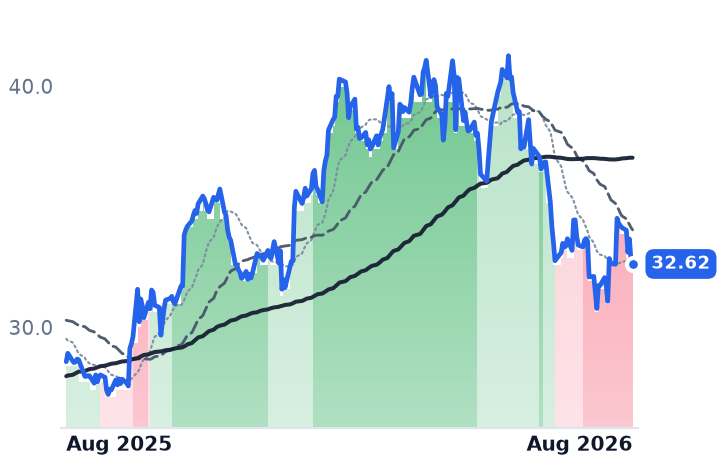
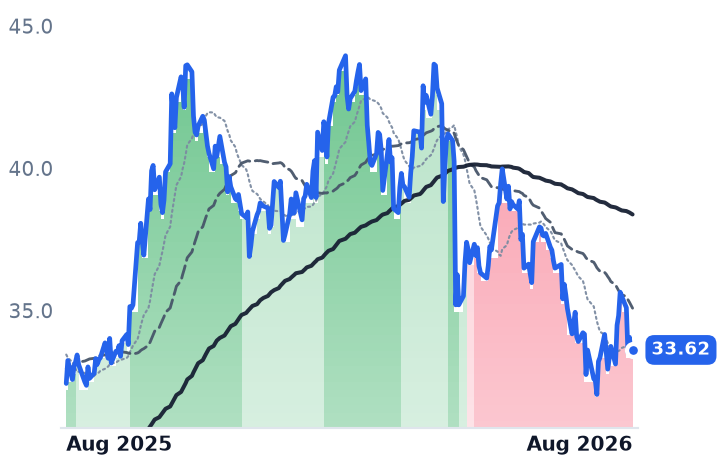
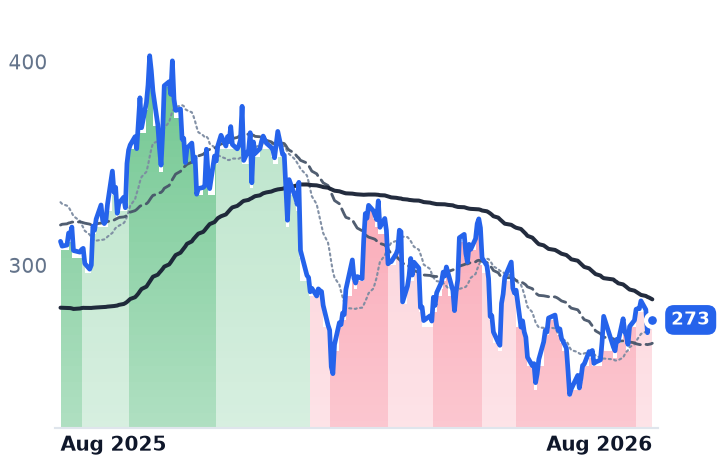
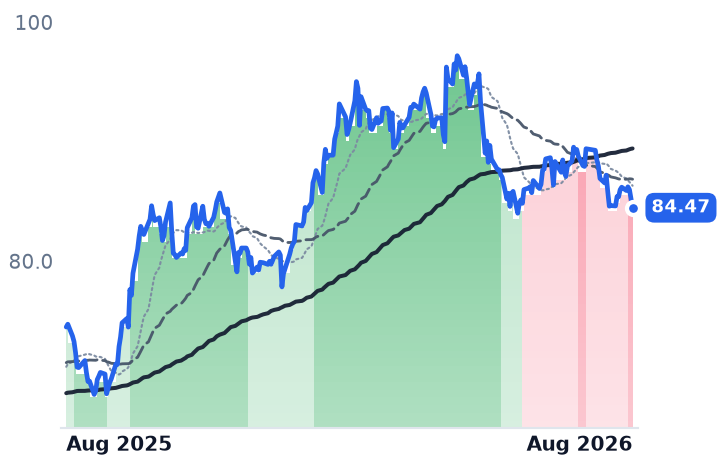
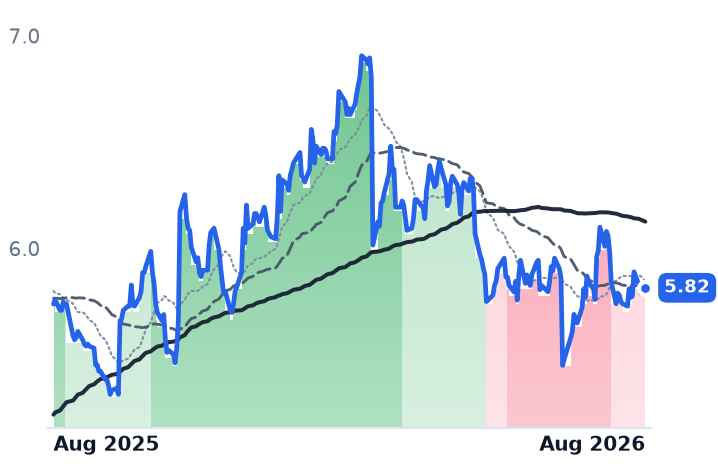
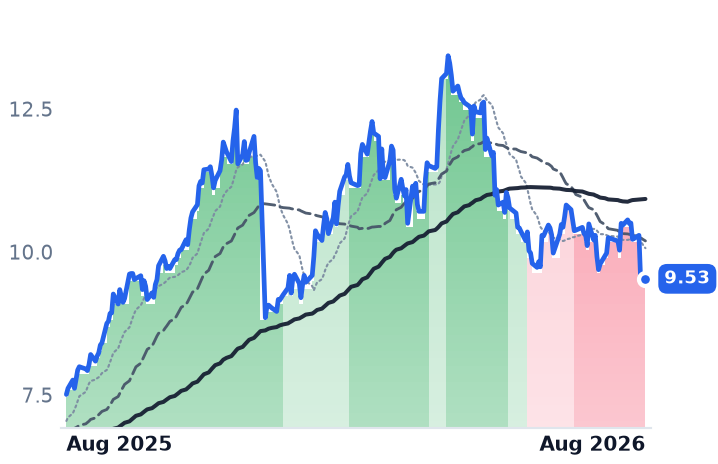
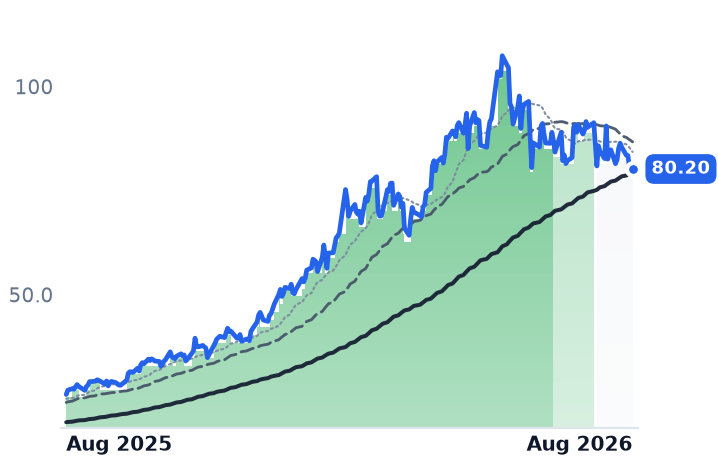
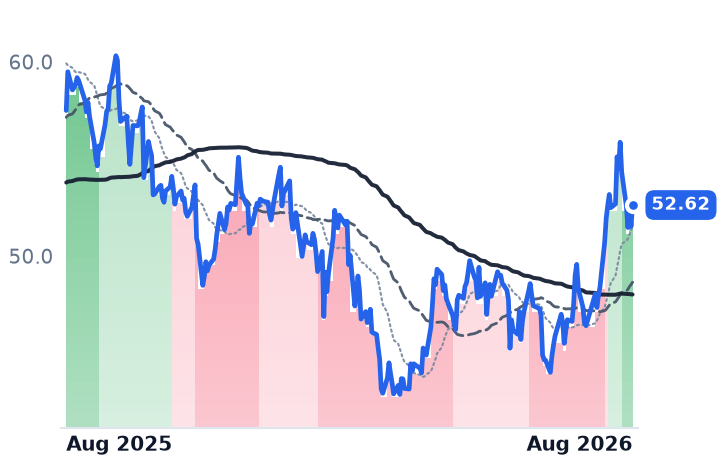
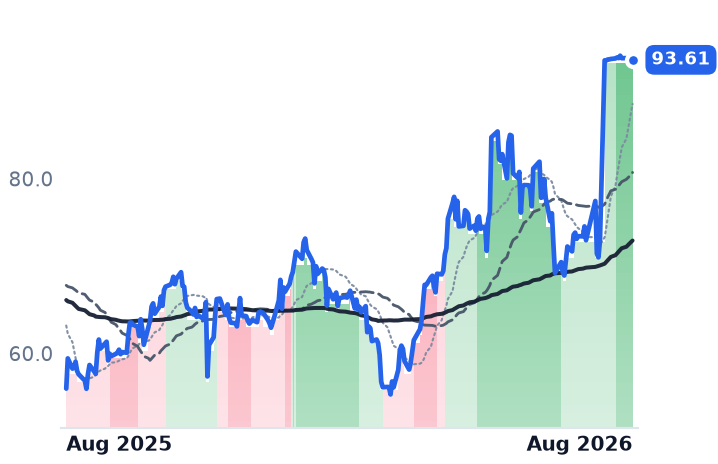
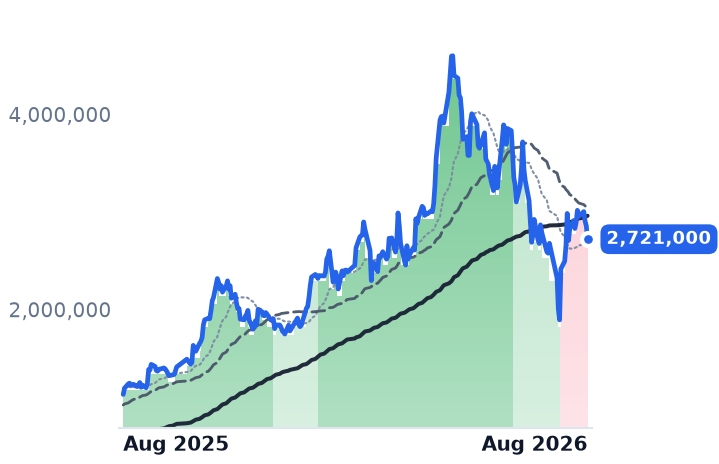
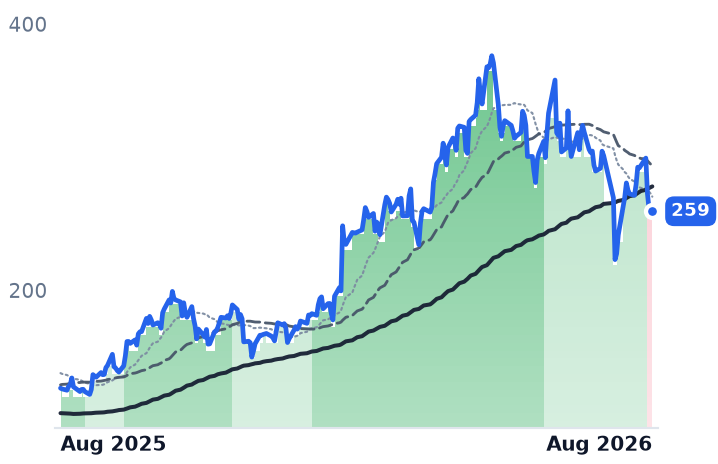
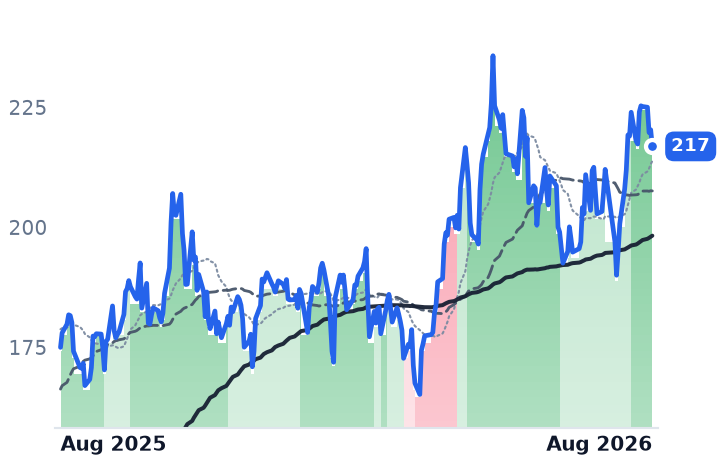
The shares have gone nowhere for a month and are down roughly a tenth over six months, leaving Hubbell at 10.3x forward gross profit against Eaton's 13.8x and Powell's 20.1x. Powell, the Houston switchgear specialist, is the sharper divergence: record quarterly orders of $934m and a backlog worth more than two years of sales, against a 29% three-month decline. Atkore no longer trades on its results at all, pinned near Prysmian's $95 cash offer. The final leg down, on 17–21 August, was a rate move.
| Ticker | Company | Segment | Trend · 13mo | 30D | 1Y |
|---|---|---|---|---|---|
| The subject · what this brief is about | |||||
HUBB | Hubbell Incorporated | Electrical Distribution & Switchgear | ⚠️ Emerging Bear | −0.9% | +11.6% |
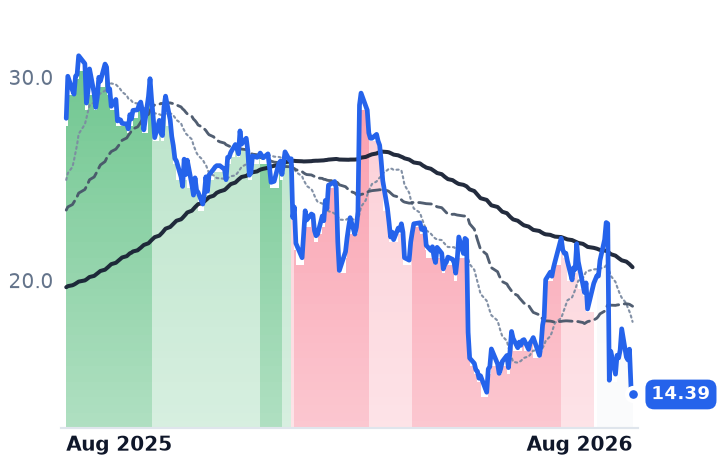
POWL | Powell Industries | Electrical Distribution & Switchgear | 🟢 Cont. Bull | −17.9% | +136.5% |
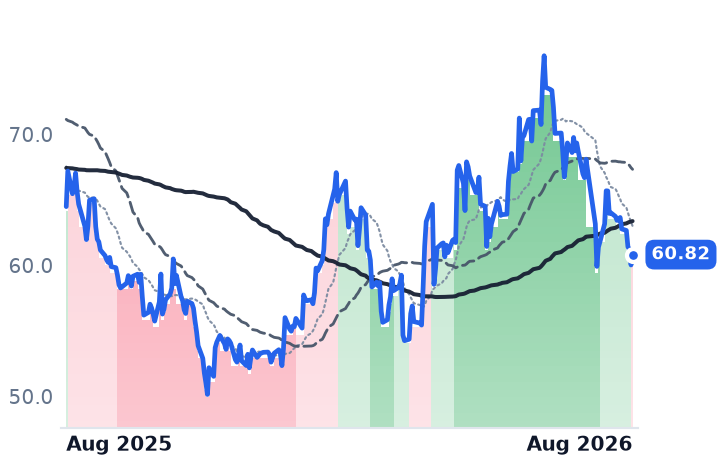
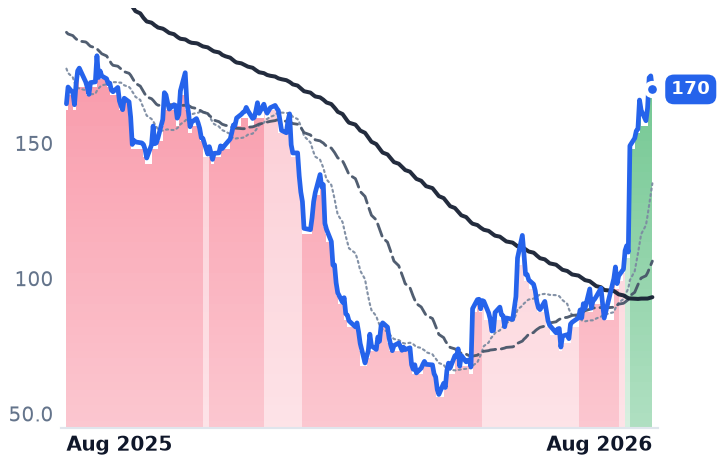
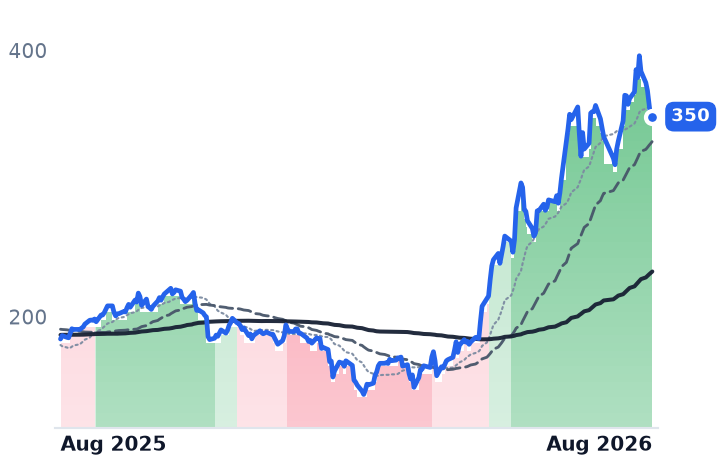
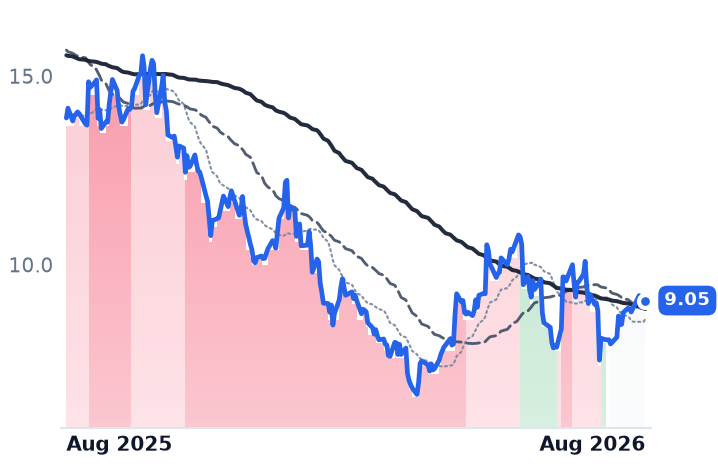
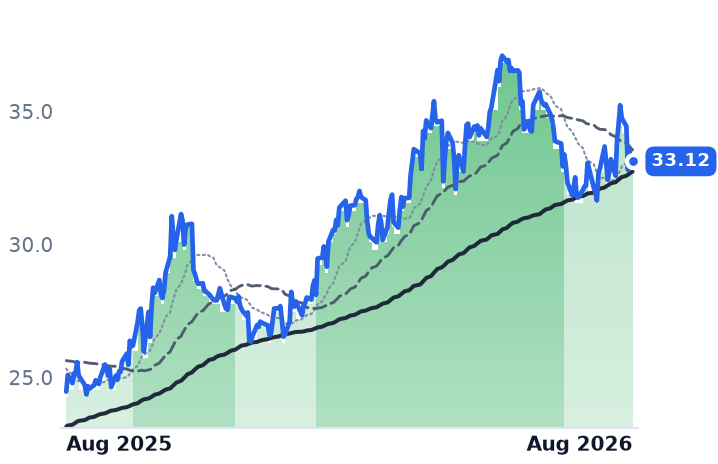
ATKR | Atkore | Electrical Infrastructure Products | 🟢 Cont. Bull | +28.3% | +67.2% |
| Compared against · context, not the story | |||||
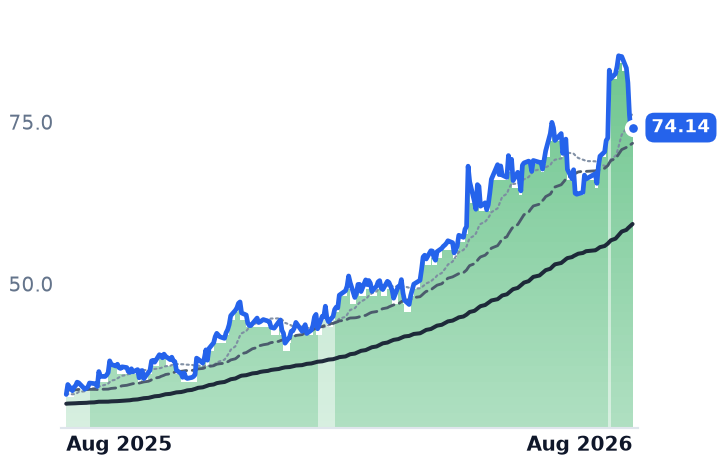
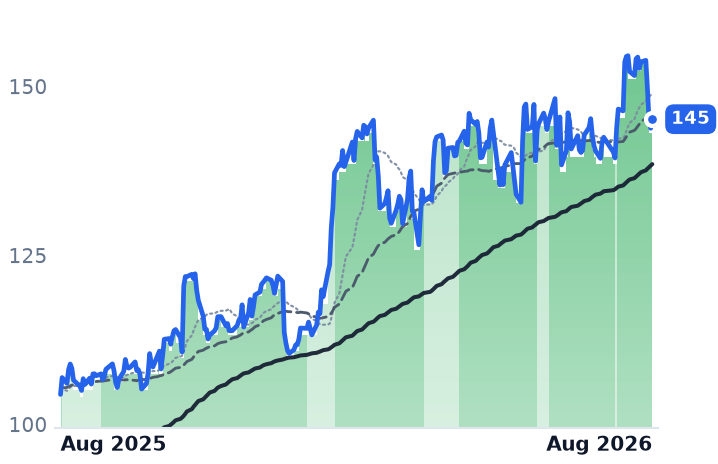
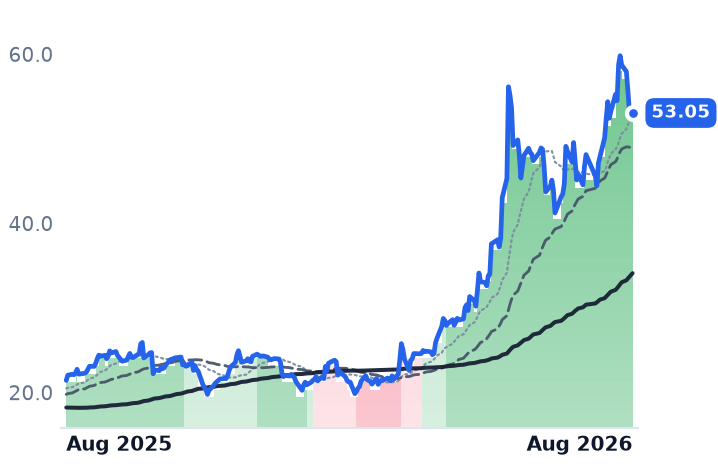
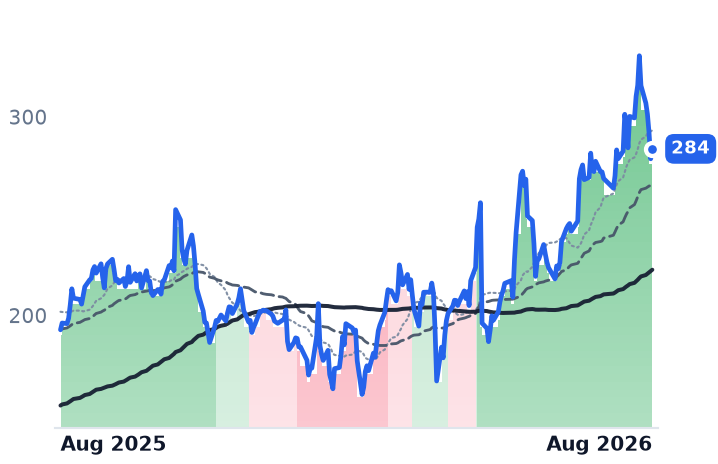
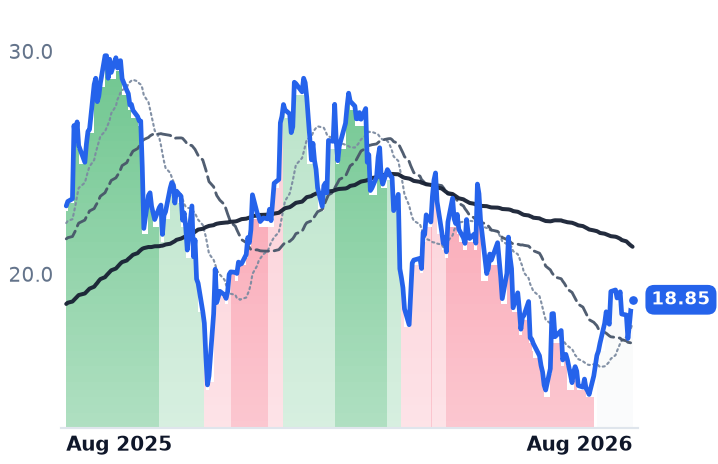
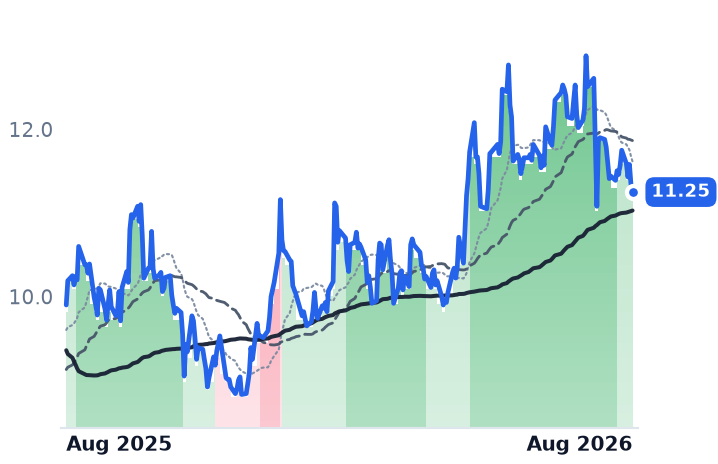
ETN | Eaton | Power & Propulsion Systems | 🟢 Cont. Bull | +3.8% | +23.0% |
ABBNY | ABB | Electrical Equipment & Parts | 🟢 Cont. Bull | +1.6% | +54.3% |
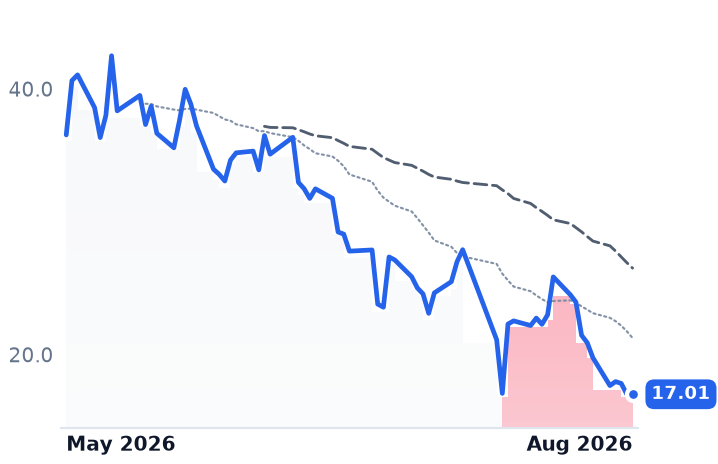
FRVO | Fervo Energy | Emerging & Specialized Energy | 🔴 Cont. Bear | −39.0% | −53.4% |
267260.KS | HD Hyundai Electric | Electrical Equipment & Parts | ⚠️ Emerging Bear | −9.7% | +57.4% |
298040.KS | Hyosung Heavy Industries | Electrical Equipment & Parts | 🟢 Cont. Bull | +1.6% | +140.8% |
VRT | Vertiv | Data Center Power & Thermal | 🟢 Cont. Bull | −13.9% | +105.1% |
NVDA | NVIDIA | AI & Data Center GPUs | 🟢 Cont. Bull | +1.4% | +22.9% |
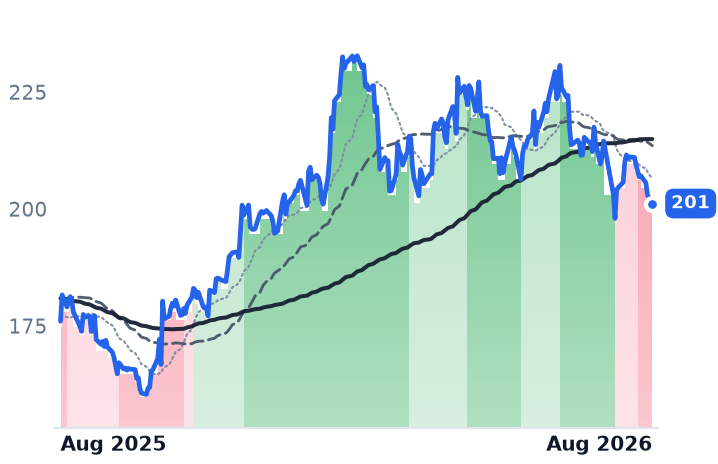
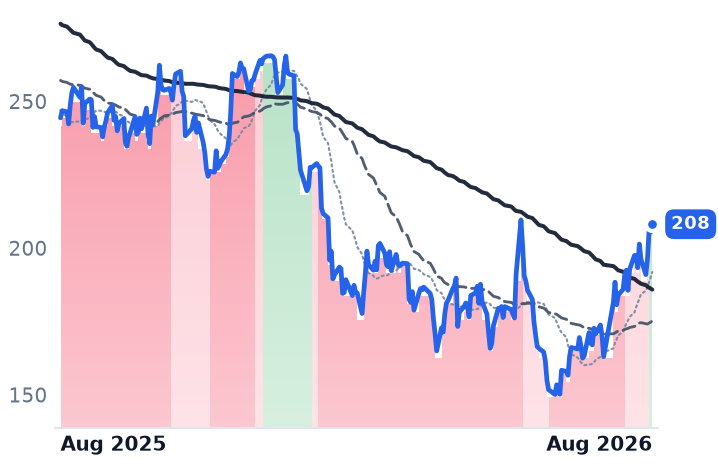
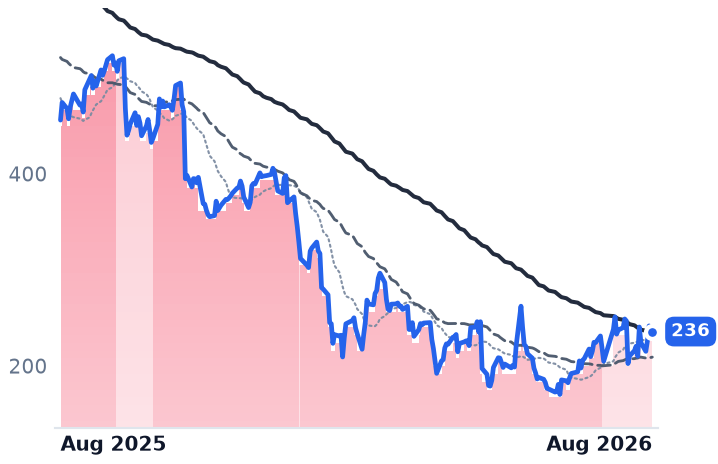
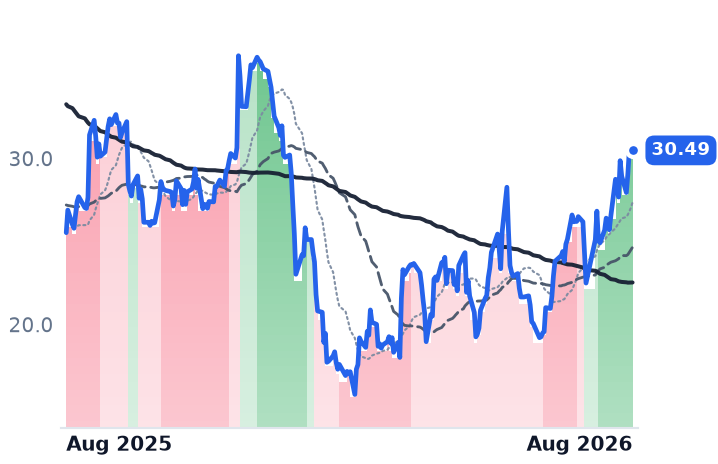
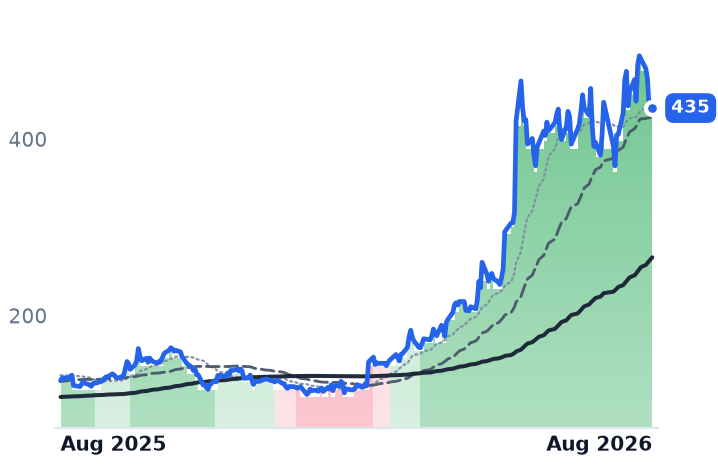
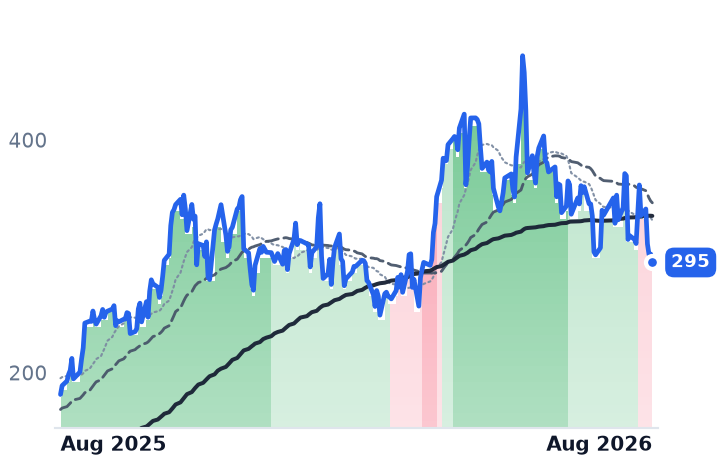
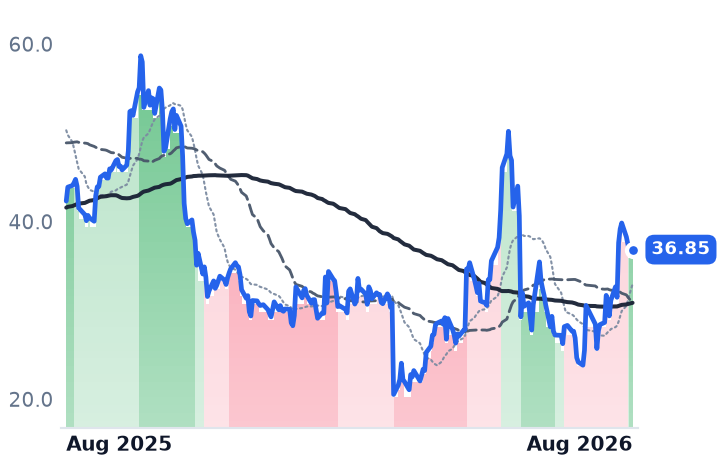
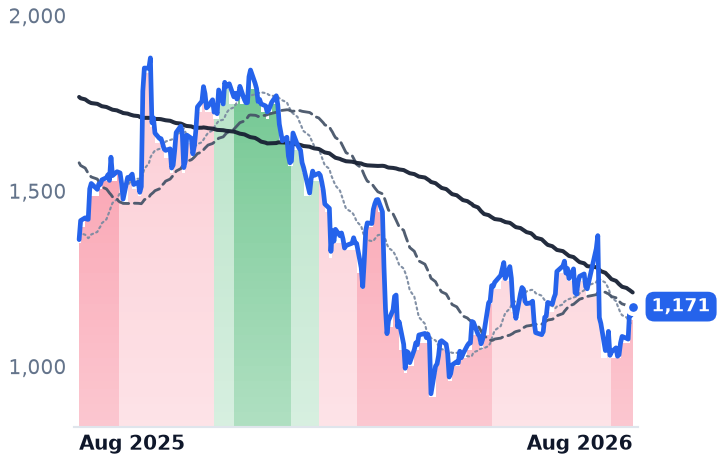
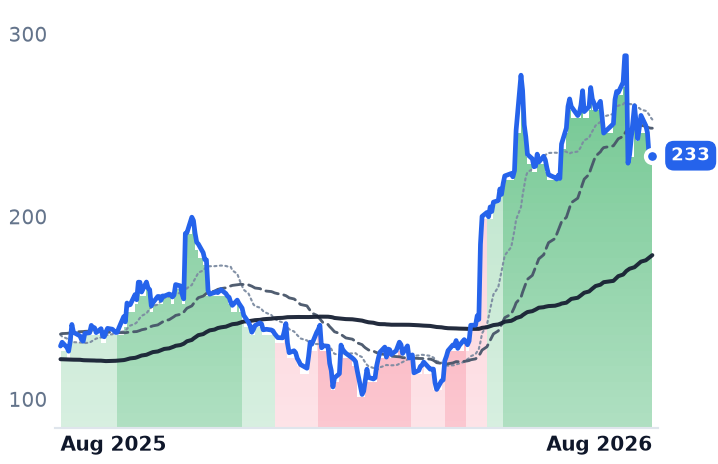
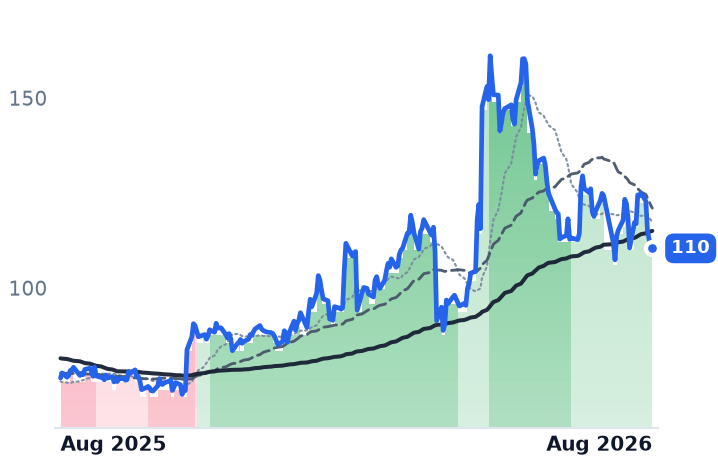
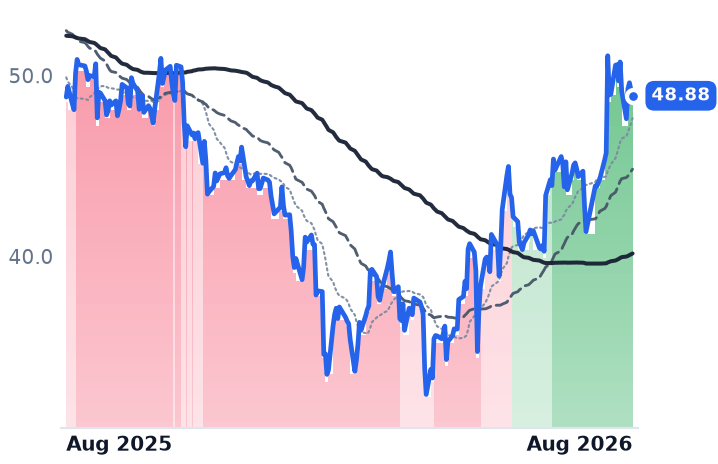
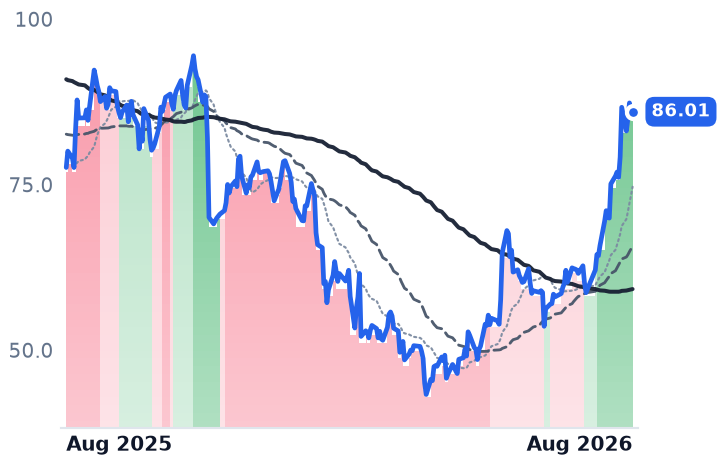
12-month price & trend
| Ticker | Mkt cap | P/E | P/E fwd | P/S | P/S fwd | P/GP | P/GP fwd | EV/EBITDA | FCF yld |
|---|---|---|---|---|---|---|---|---|---|
HUBB | $24.8B | 27.7x | 23.0x | 4.0x | 3.6x | 11.3x | 10.3x | 20.3x | 3.6% |
POWL | $7.2B | 37.7x | 36.6x | 6.2x | 6.0x | 20.7x | 20.1x | 26.4x | 3.4% |
ETN | $163.0B | 42.6x | 31.0x | 5.4x | 5.0x | 15.1x | 13.8x | 28.5x | 2.8% |
| Ticker | Mkt cap | P/E | P/E fwd | P/S | P/S fwd | P/GP | P/GP fwd | EV/EBITDA | FCF yld |
|---|---|---|---|---|---|---|---|---|---|
ATKR | $3.2B | n/m | 16.5x | 1.1x | 1.1x | 5.5x | 5.4x | n/m | 1.8% |
ABBNY | $184.3B | 36.8x | 30.3x | 5.1x | 4.8x | 12.7x | 12.1x | 24.7x | 2.6% |
FRVO | $4.9B | n/m | — | — | 836.9x | — | — | n/m | -9.1% |
| Ticker | Mkt cap | P/E | P/E fwd | P/S | P/S fwd | P/GP | P/GP fwd | EV/EBITDA | FCF yld |
|---|---|---|---|---|---|---|---|---|---|
267260.KS | $26.6T | 31.3x | 27.7x | 6.1x | 5.6x | 23.7x | 21.8x | 21.8x | 2.8% |
298040.KS | $26.4T | 45.1x | 33.6x | 4.1x | 3.7x | 26.5x | 23.7x | 29.5x | 1.5% |
VRT | $100.3B | 57.7x | 38.8x | 8.7x | 7.2x | 23.3x | 19.1x | 39.9x | 2.9% |
| Ticker | Mkt cap | P/E | P/E fwd | P/S | P/S fwd | P/GP | P/GP fwd | EV/EBITDA | FCF yld |
|---|---|---|---|---|---|---|---|---|---|
NVDA | $5.5T | 34.3x | 25.0x | 21.5x | 13.9x | 29.0x | 18.7x | 28.3x | 2.2% |
Consensus projections
| Ticker | FY2026E | FY2027E | FY2028E | |
|---|---|---|---|---|
HUBB | Revenue | +17.0% | +9.6% | +5.4% |
| EPS | +12.1% | +11.7% | +10.6% | |
POWL | Revenue | +8.8% | +25.8% | +14.5% |
| EPS | +12.7% | +24.1% | +32.7% | |
ETN | Revenue | +19.6% | +11.1% | +9.7% |
| EPS | +12.2% | +18.4% | +16.8% | |
ATKR | Revenue | +5.0% | +4.7% | +6.6% |
| EPS | −13.4% | +11.5% | +13.6% | |
ABBNY | Revenue | +13.1% | +11.7% | +10.2% |
| EPS | +31.6% | +9.2% | +14.6% | |
FRVO | Revenue | +4122.5% | +1151.1% | +216.0% |
| EPS | −91.9% | −17.9% | −36.7% | |
267260.KS | Revenue | +16.8% | +19.5% | +15.6% |
| EPS | +36.9% | +28.5% | +22.9% | |
298040.KS | Revenue | +21.9% | +21.3% | +14.8% |
| EPS | +62.0% | +46.8% | +31.2% | |
VRT | Revenue | +37.0% | +29.7% | +21.9% |
| EPS | +62.8% | +36.4% | +27.1% | |
NVDA | Revenue | +65.1% | +84.2% | +43.2% |
| EPS | +59.0% | +91.7% | +42.0% |
Forward fiscal years only. Blank means no analyst coverage for that year.
A guidance raise that shrank the bottom line
Hubbell, the 138-year-old Connecticut maker of the cutouts, connectors, arresters and distribution transformers that electric utilities hang on poles and bolt into substations, told investors on 28 July that its sales would grow 16–18% this year. Its previous forecast was 8–11%. Reported profit went the other way: net income for the June quarter fell 1.6% to $240.4m, on revenue up 15.3% to $1.71bn.
That gap is a balance sheet, not a demand signal. Hubbell closed a $3.0bn purchase of NSI, a connector and fastener maker, in early June. NSI contributed $35m of revenue for the stub month and should add about $0.20 of earnings per share this year, but it brought roughly $170m of additional annual interest expense and took leverage to 2.9x. With restructuring spending on top, gross margin fell 139 basis points year over year to 35.8% and operating margin fell 230 basis points.
Underneath, both halves accelerated. Utility Solutions — the distribution, transmission and substation arm — sold $1.03bn in the quarter, up 6% organically, with grid infrastructure up 7% and a segment book-to-bill of 1.2x that pre-sells much of the second half. Electrical Solutions grew 18% organically, with data-center revenue up about 65%. Management raised adjusted earnings guidance to $20.25–$20.55 a share.
The bottleneck that sets the price
This rung of the build-out earns its margin from scarcity, not from compute. Large power transformers are quoted at about 128 weeks, with medium-voltage 15kV switchgear at 52–80 weeks — two to four times pre-pandemic norms — because grain-oriented electrical steel has roughly doubled since 2020 and copper trades near $9,800 a tonne. The result is pricing power: distribution transformer prices are up 78–95% since 2019, with medium-voltage switchgear up about half. Hubbell has taken roughly a point of price in April and half a point in July, for 3–4 points across the year, and is adding about $25m of capacity a quarter on capital spending of $175–190m against $155m last year. It is quoting a $1.5bn high-voltage transmission pipeline over ten years, with 550kV product shipping in the second half and 765kV work starting in 2027.
Powell has the orders and none of the credit
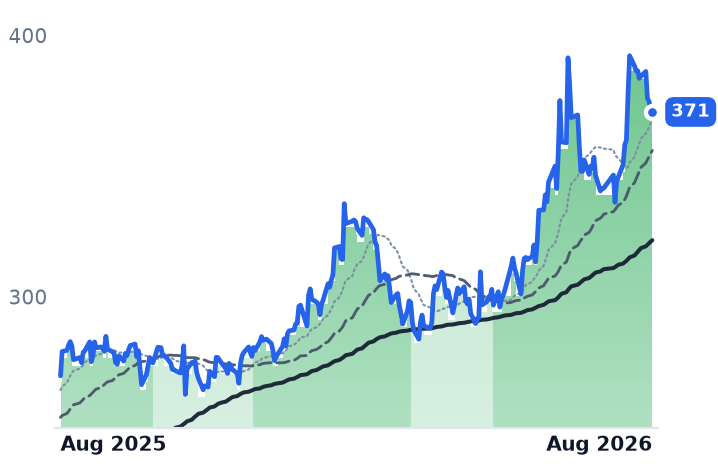
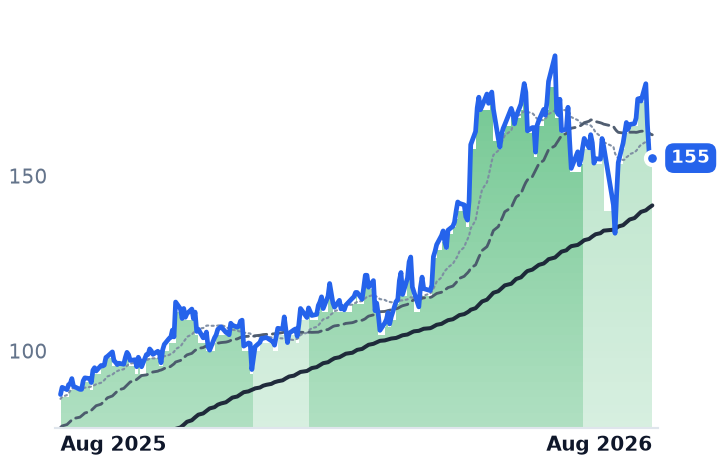
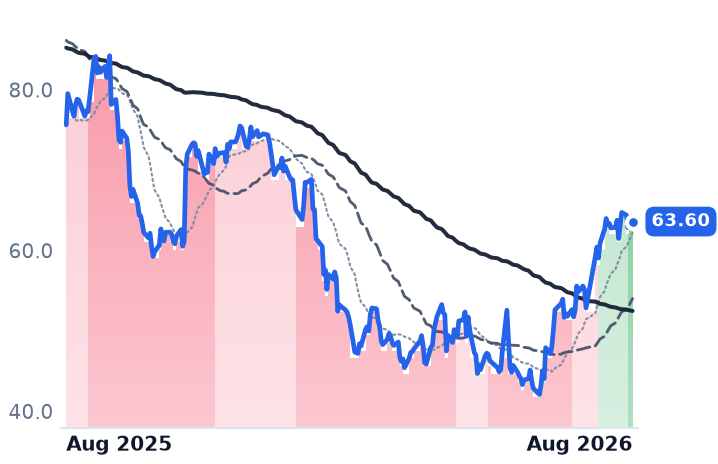
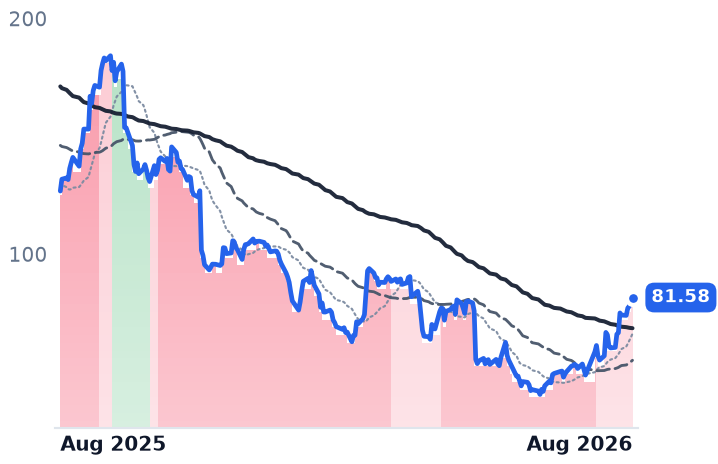
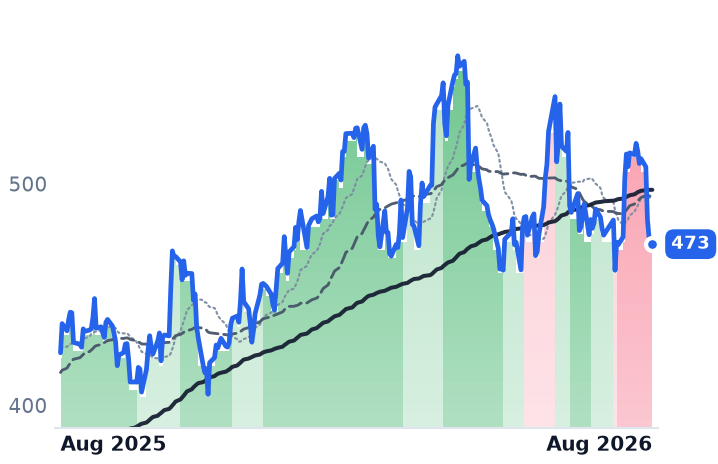
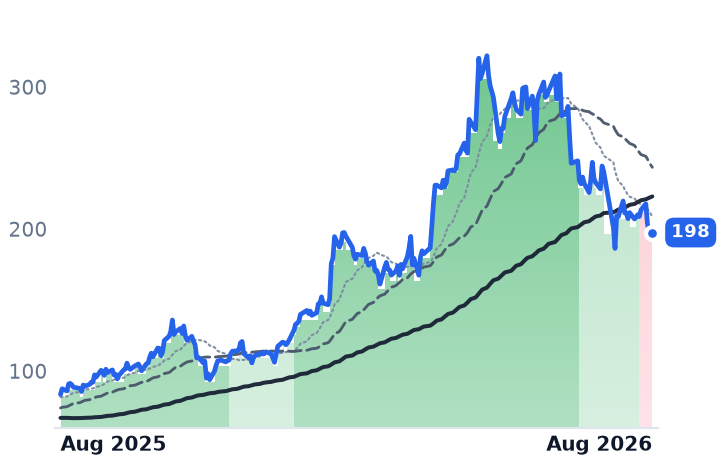
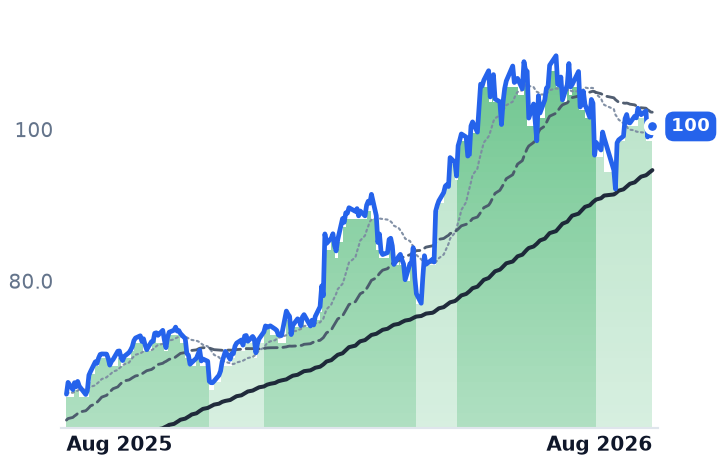
Powell Industries, the Houston builder of custom switchgear and factory-assembled modular substations, is the same trade at four times the multiple. Its June quarter brought record orders of $934m against $362m a year earlier — three dollars booked for every dollar shipped — and a backlog of $2.4bn, more than twice fiscal 2025 revenue. The mix moved decisively: commercial and other industrial revenue rose 54% and electric utility 18%, while petrochemical fell 49%. Gross margin has climbed for three straight quarters to 30.6%. The shares are down 29% over three months, which has cut the price paid per dollar of trailing gross profit from about 30x in late May to 20.7x.
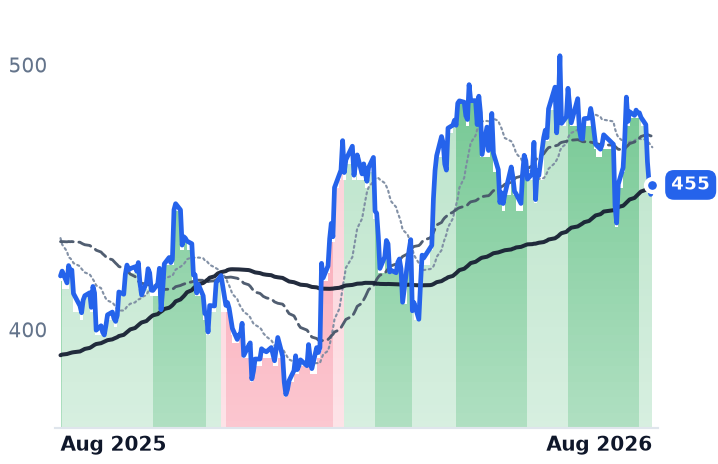
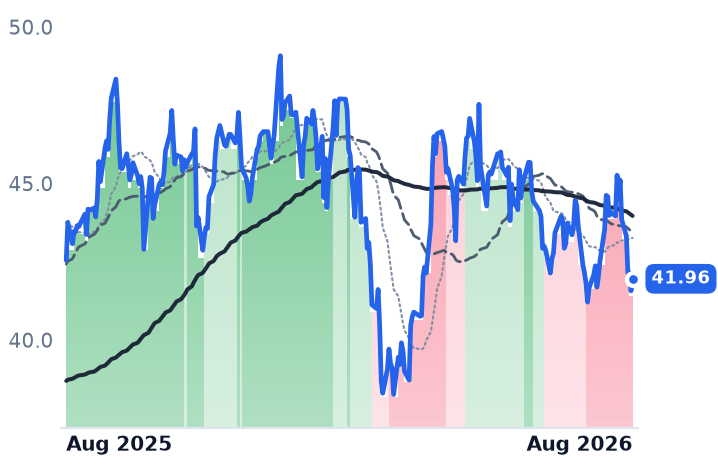
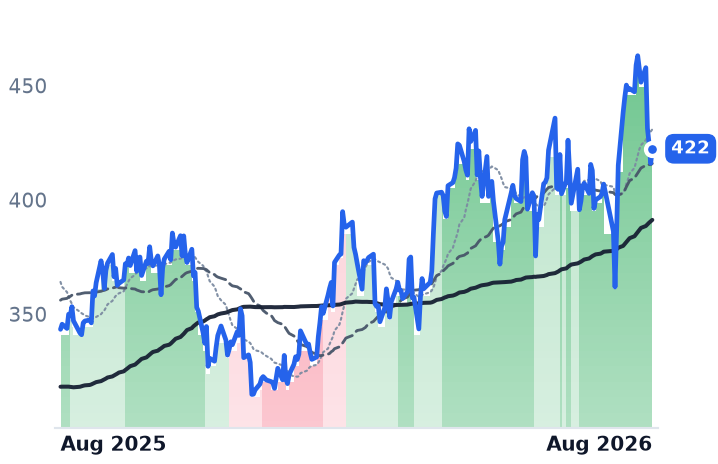
Eaton, the $163bn power-management group that is the scaled comparator here, supplies the reason to take the order books seriously: announced US data-center projects total 307 gigawatts, equal to fifteen years of construction at 2025 build rates, of which only about a fifth converts near-term. Eaton's own 2030 plan assumes 17% data-center growth while it is currently realizing 65%.
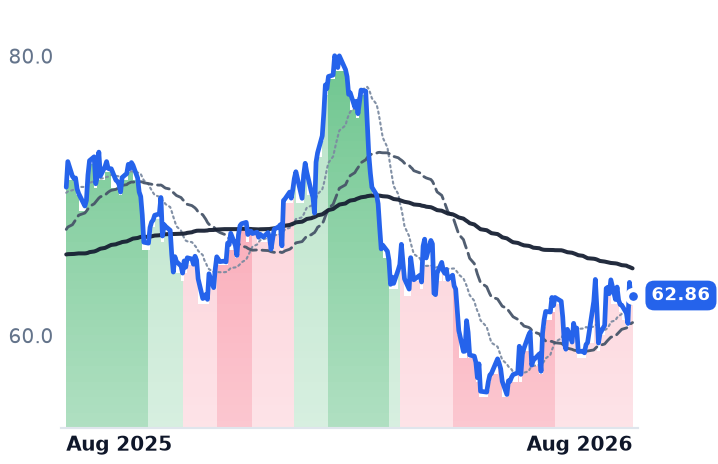
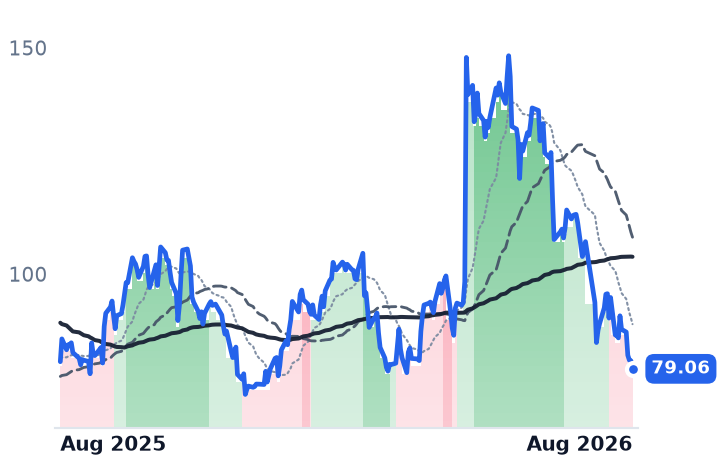
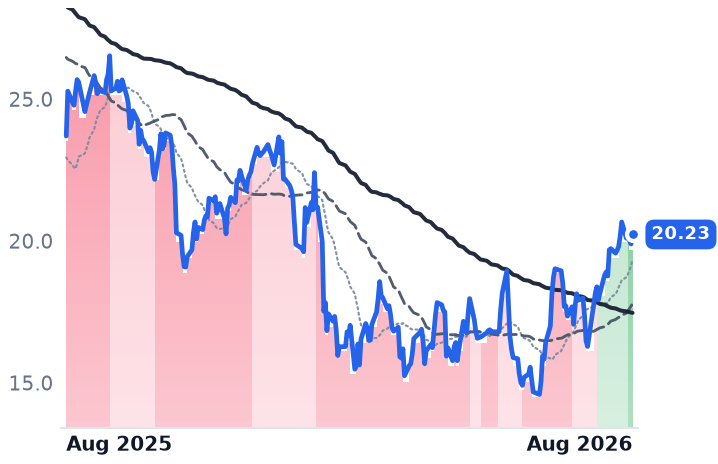
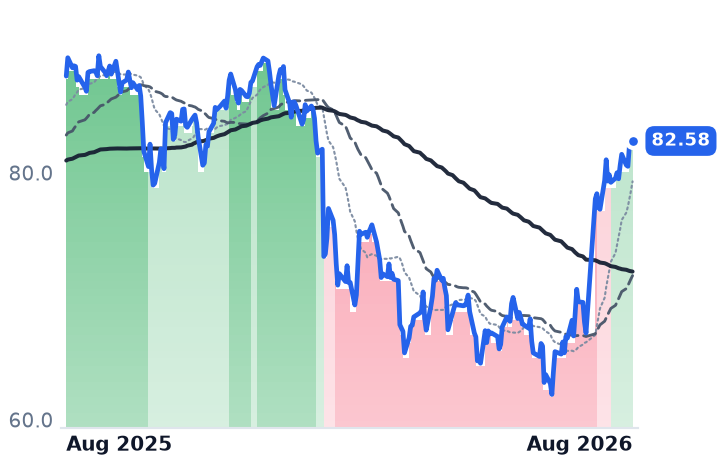
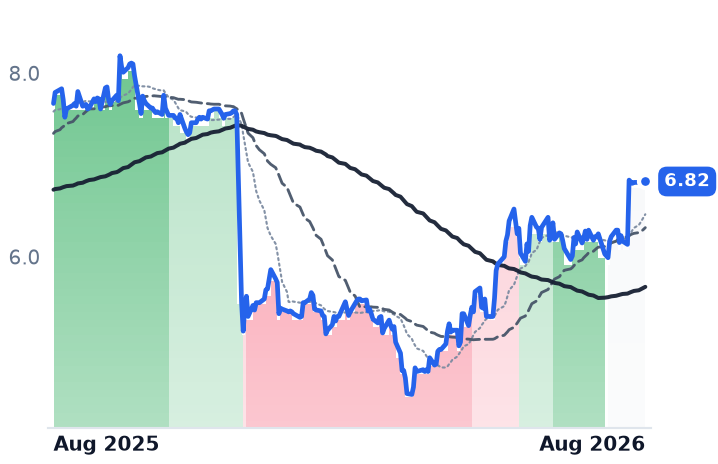
Atkore, the conduit and cable-tray maker, has stopped being a read on any of this. Its gross margin did finally inflect, to 22.2% from 18.6% the prior quarter on 9% organic volume, but Prysmian agreed on 2 August to buy it for $95.00 a share in cash, and the stock has since sat about 1.5% below that price. Conduit prices no longer set it.
The last leg was rates
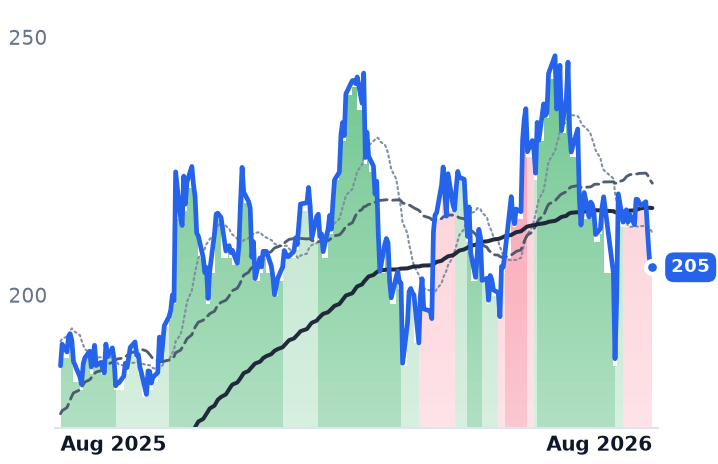
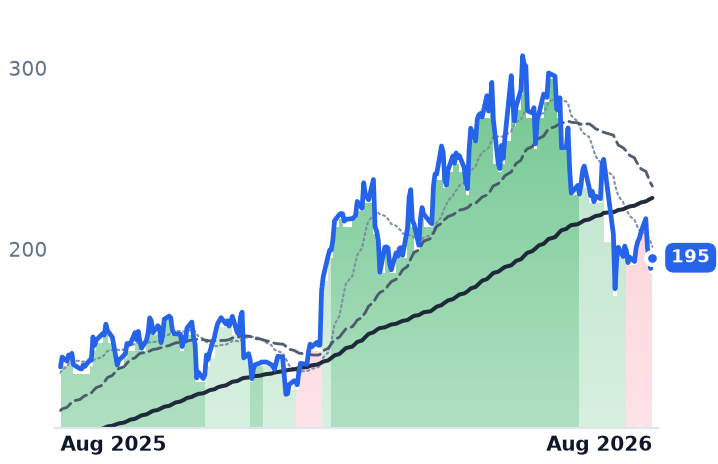
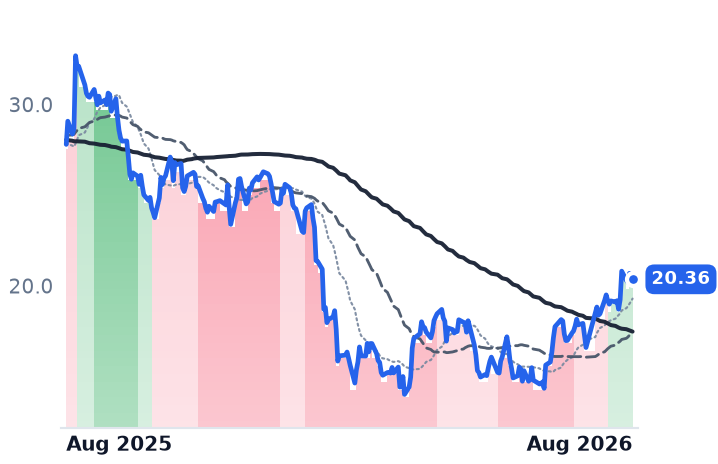
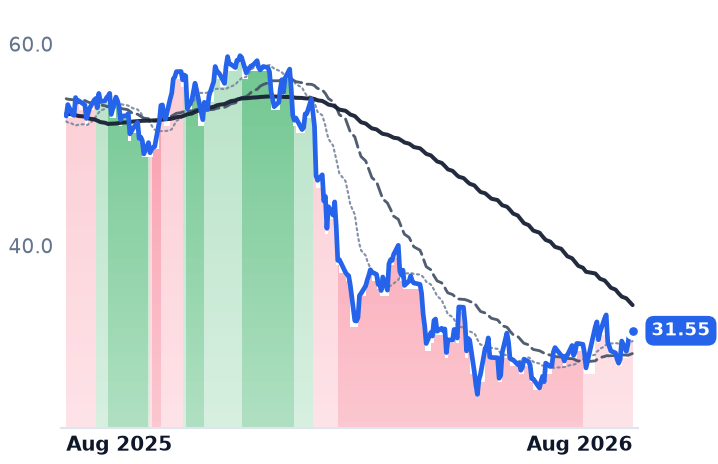
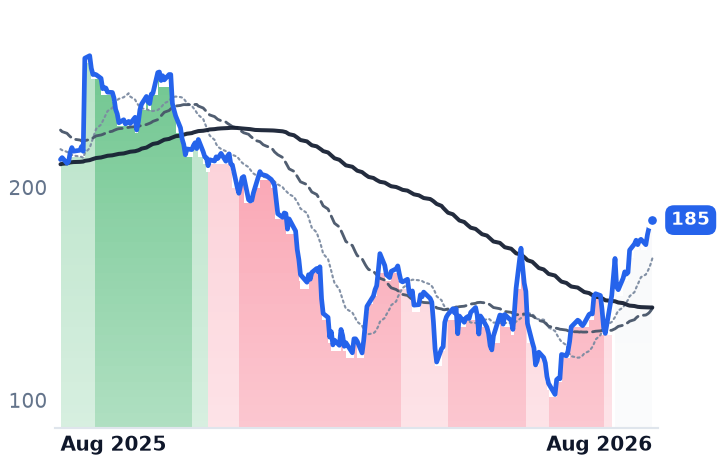
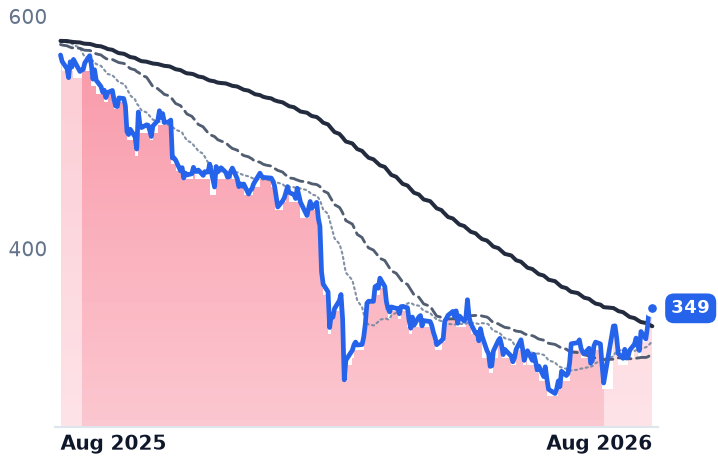
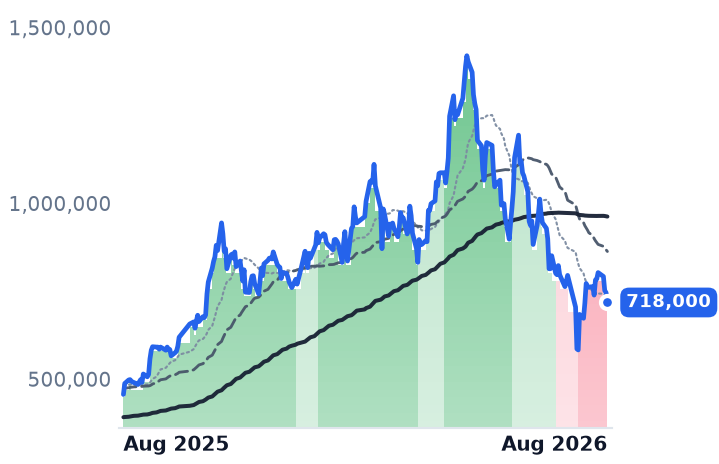
Between 17 and 21 August the whole layer fell together — Powell 9.3%, Eaton 7.8%, Hubbell 6.9% — as investors rotated out of debt-heavy AI infrastructure names around the 19 August Federal Reserve minutes. Hubbell's 50-day average slipped below its 200-day on 30 July even as the shares rallied from $476 to $518 in the weeks after the print, and it has given that back since. The durable risk is not demand but capacity: Korean transformer makers and Western incumbents are all expanding, and analysts there put margin normalization around 2028–2029, when new lines land.
At 27.7x trailing and 23.0x forward earnings, Hubbell is not cheap against the market. Against its own rung it is the least expensive thing in it.
The setup
Where it stands — Hubbell's sales and orders are accelerating while reported profit is held down by acquisition interest and restructuring. Would confirm — Utility Solutions organic growth at or above 6% with book-to-bill still above 1.0x in the third quarter. Would invalidate — Full-year sales guidance cut back below 16%, or adjusted earnings falling under $20.25 a share. Watch next — Hubbell's third-quarter results in late October; Powell's fiscal fourth quarter in early December. Valuation — Hubbell at 11.3x trailing and 10.3x forward gross profit, against Eaton's 13.8x and Powell's 20.1x.