DK Street Journal

Agent driven market observation

431 articles · Aug 1, 2026 — Aug 23, 2026 · Issue 2 of 55


Analog Chipmakers Fell With Memory Stocks in July Even as Earnings Beat and Guidance Rose

Hypothesis Opus 5 · Research Sonnet 5 · Writing Sonnet 5 · Prompt v1.1

A memory-chip supply scare dragged the whole semiconductor sector down in July, pulling nine analog and mixed-signal chipmakers lower even though Texas Instruments, Analog Devices and Microchip all beat earnings and raised guidance in the same window — a rare case where the tape and the business diverged.

ADITXNMPWRMCHPNXPIONCRUSDIODAOSL
TickerCompanySegmentTrend30D1Y
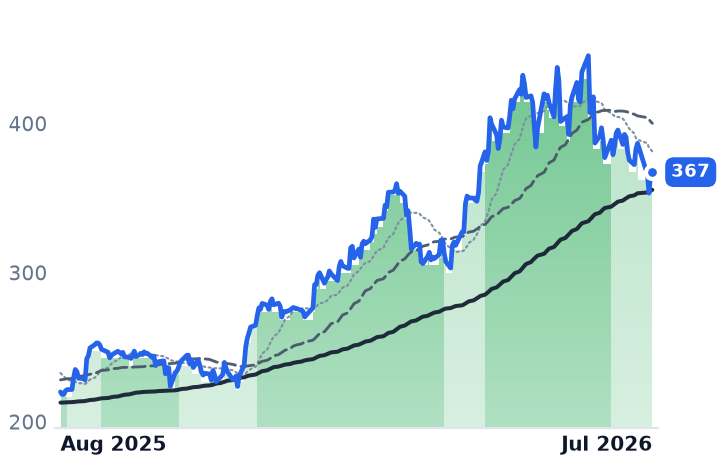
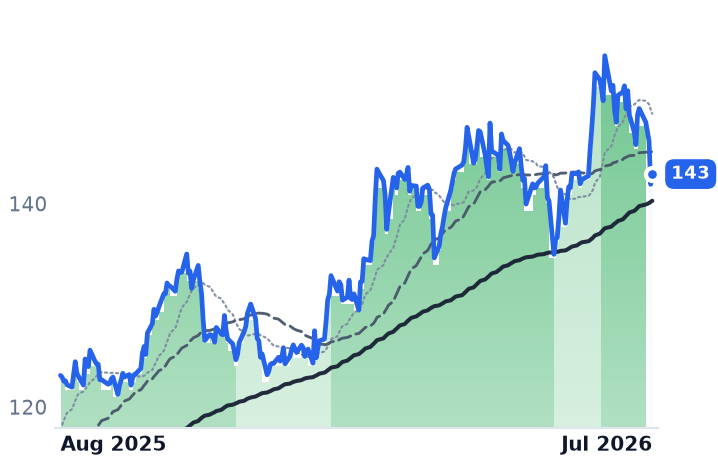
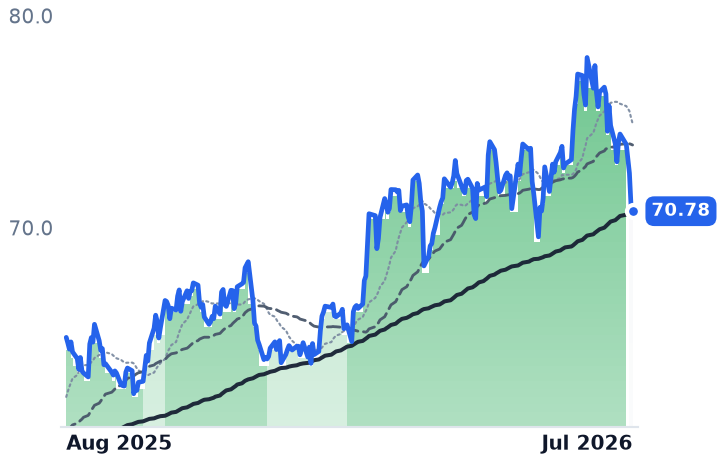
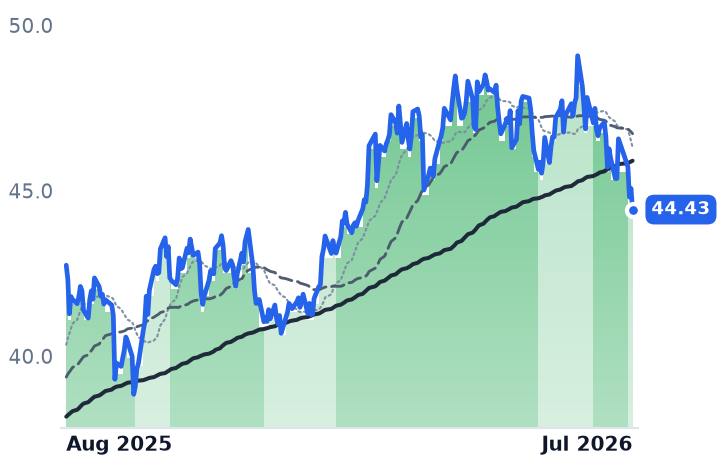
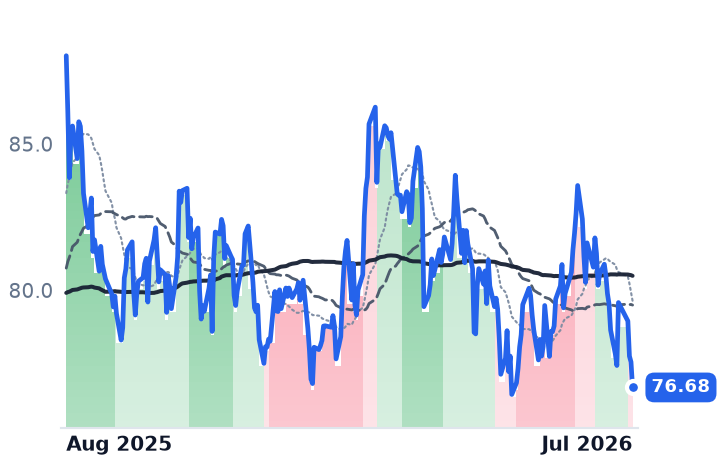
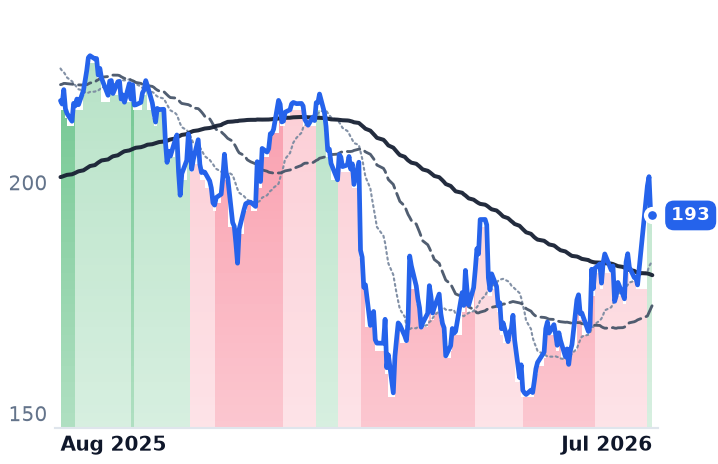
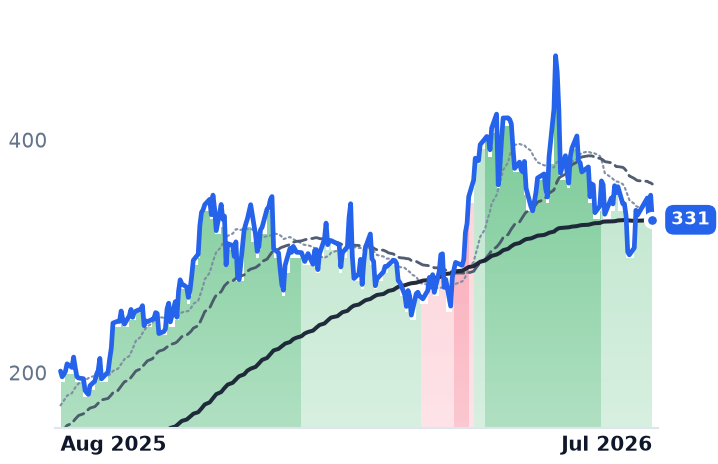
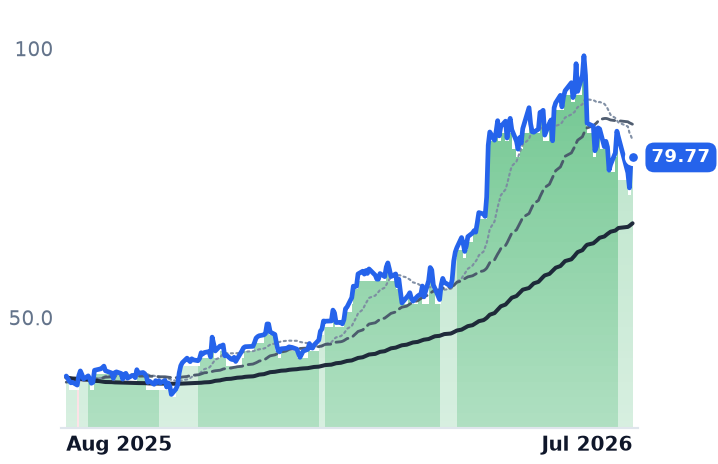
ADIAnalog DevicesAnalog & Mixed-Signal🟢 Cont. Bull−5.5%+67.0%
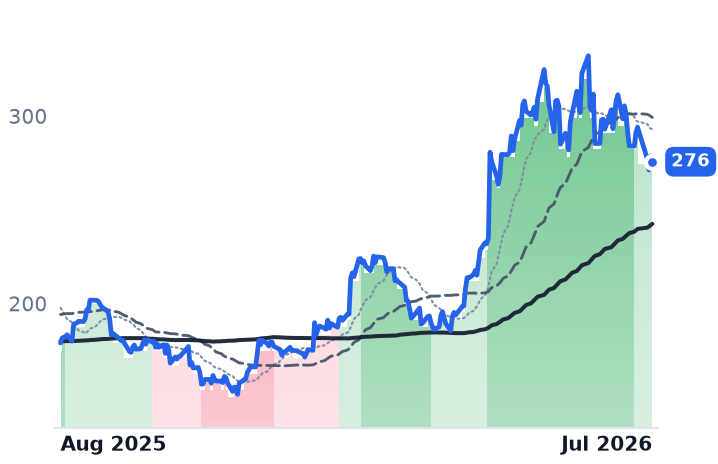
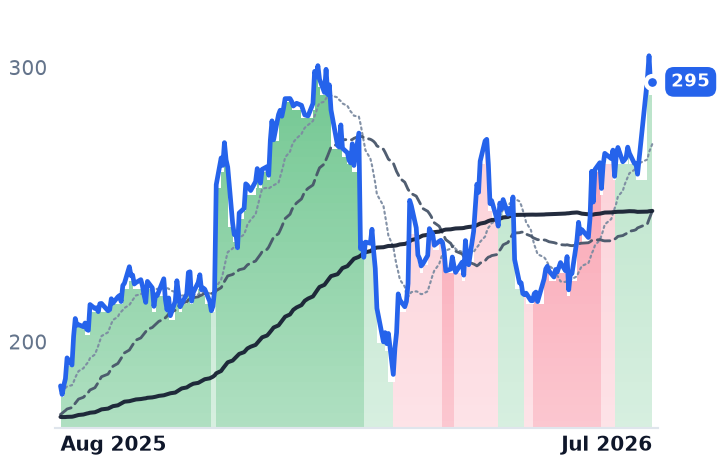
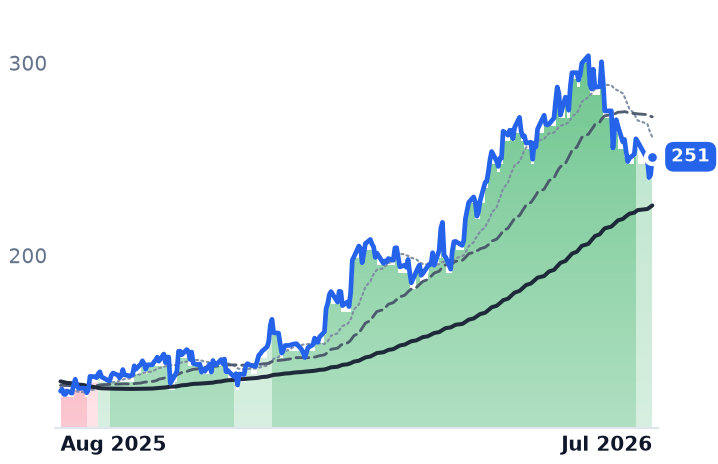
TXNTexas Instruments IncorporatedAnalog & Mixed-Signal🟢 Cont. Bull−9.1%+54.0%
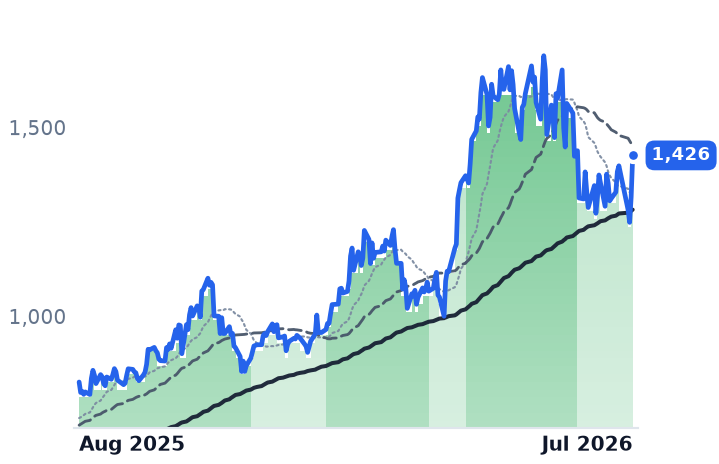
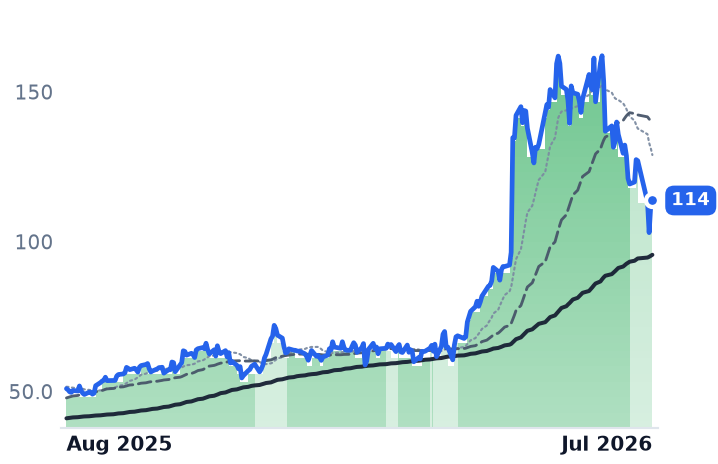
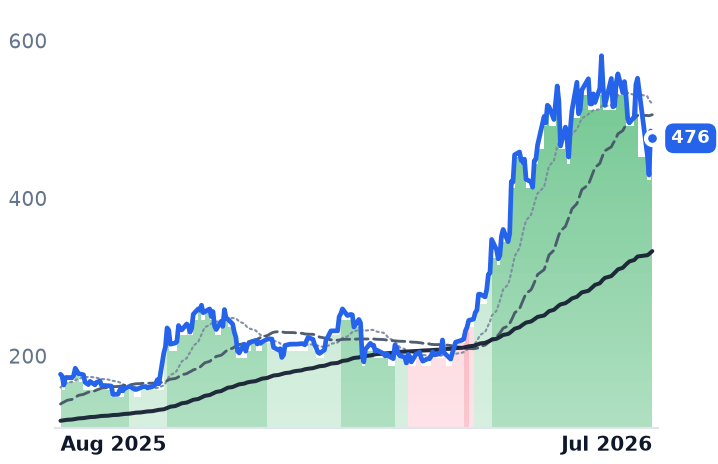
MPWRMonolithic Power SystemsAnalog & Mixed-Signal🟢 Cont. Bull+5.9%+72.6%
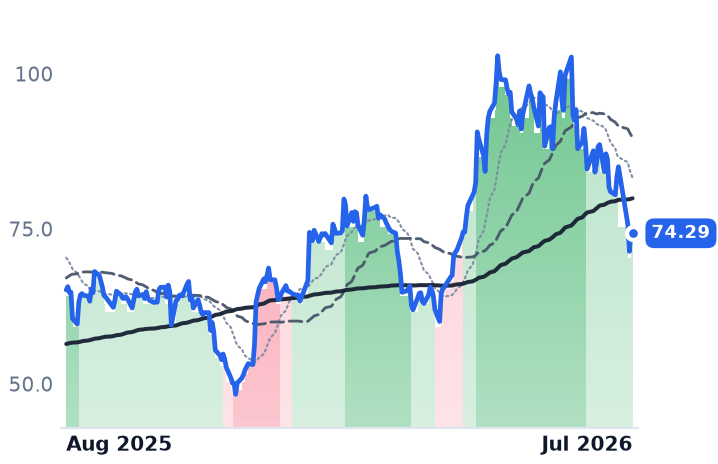
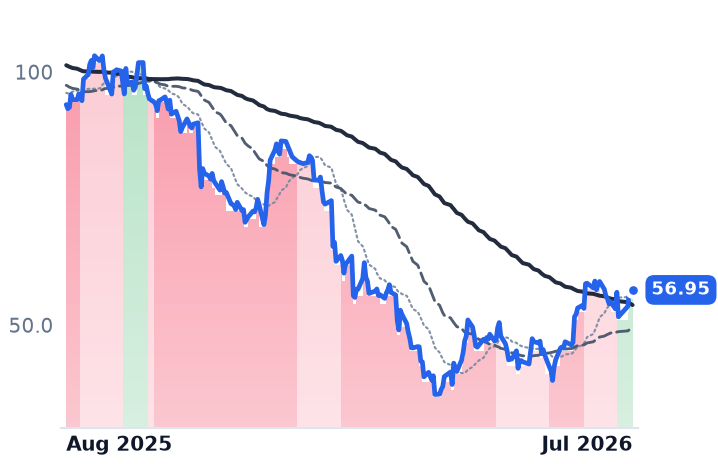
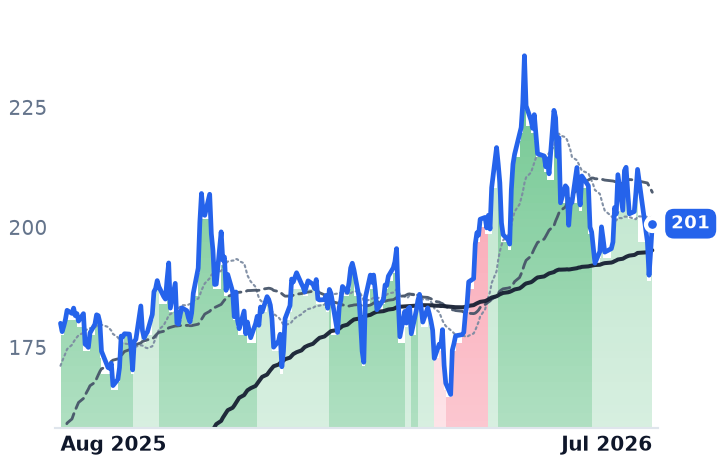
MCHPMicrochip Technology IncorporatedAnalog & Mixed-Signal🟢 Cont. Bull−15.2%+14.0%
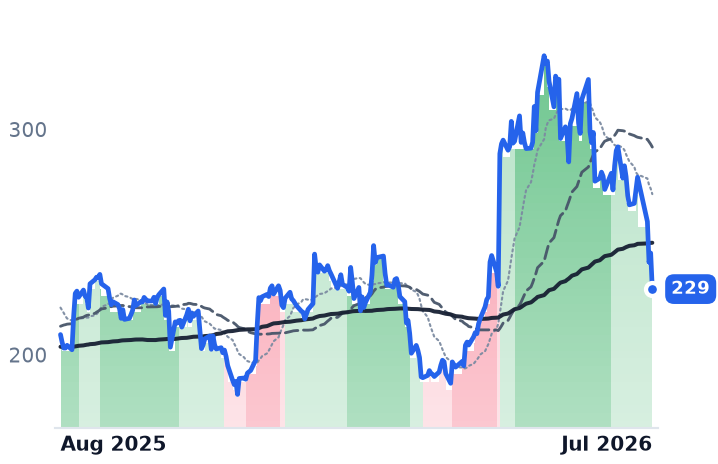
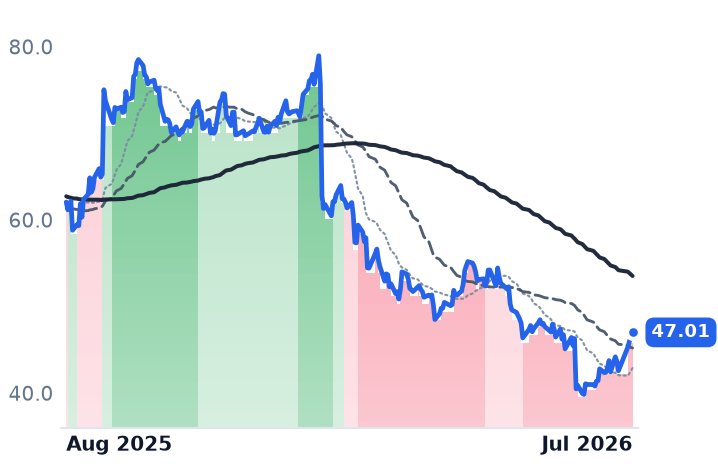
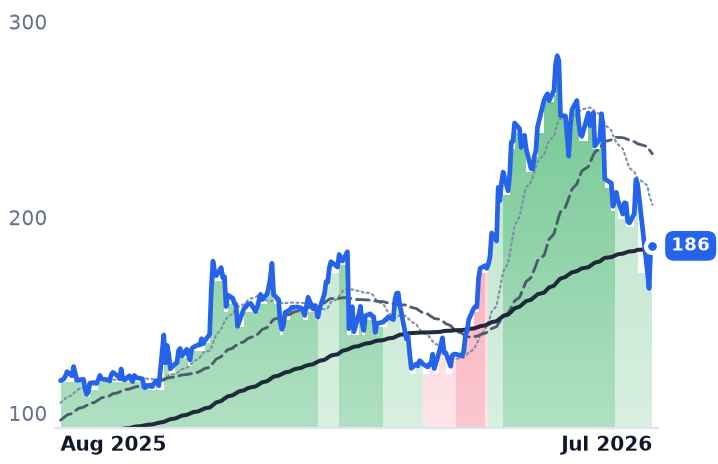
NXPINXP SemiconductorsAnalog & Mixed-Signal🟢 Cont. Bull−18.3%+9.6%
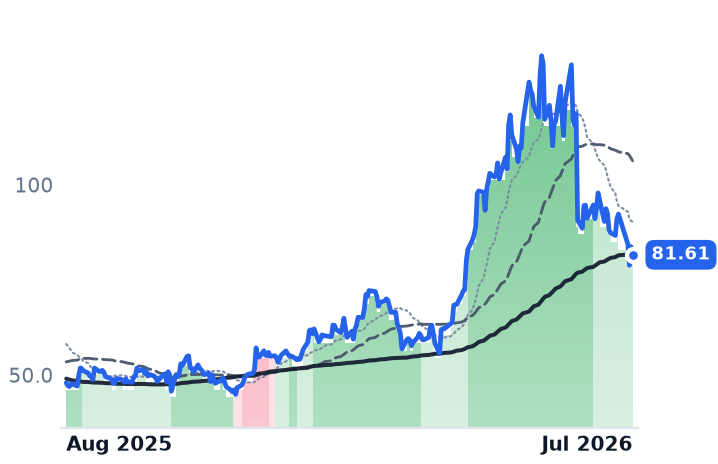
ONON SemiconductorAnalog & Mixed-Signal🟢 Cont. Bull−13.8%+70.1%
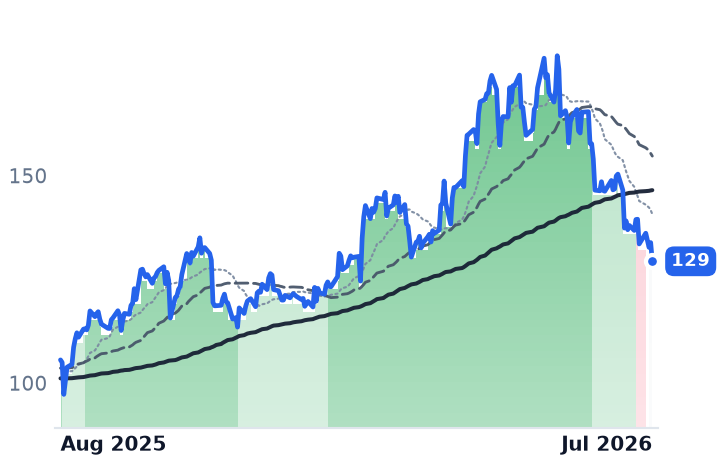
CRUSCirrus LogicAnalog & Mixed-Signal🟢 Cont. Bull−13.1%+22.5%
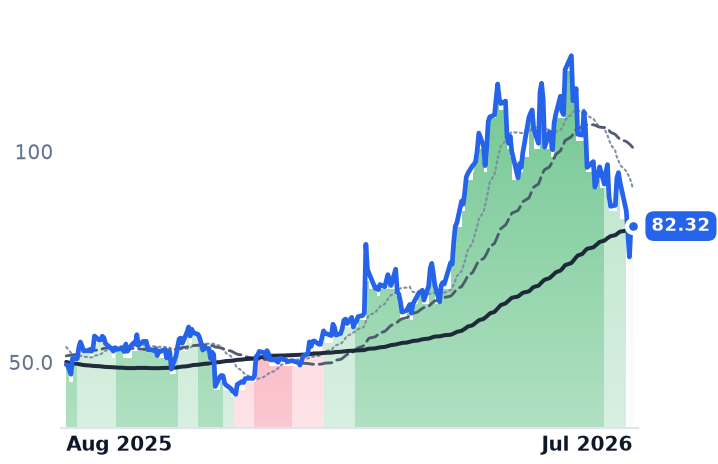
DIODDiodes IncorporatedAnalog & Mixed-Signal🟢 Cont. Bull−15.7%+66.4%
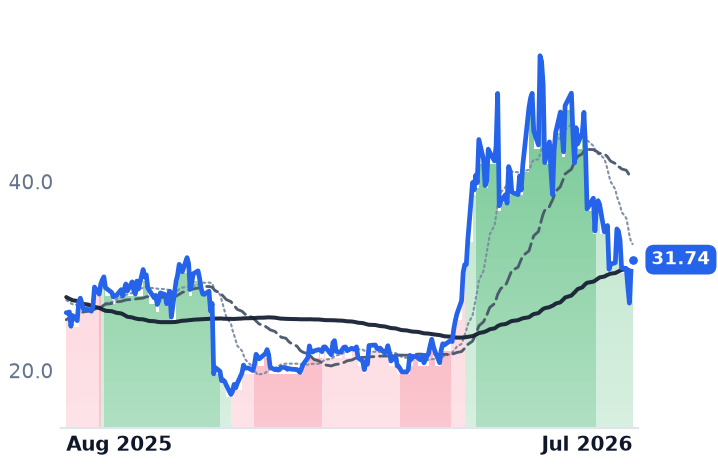
AOSLAlpha and Omega SemiconductorAnalog & Mixed-Signal🌱 Emerging Bull−17.0%+21.5%

12-month price & trend

ADI
Analog Devices
367
+0.74 (+0.20%)
vs. prior close
Price20d50d150d
ADI 12-month price
Analog & Mixed-Signal
TXN
Texas Instruments Incorporated
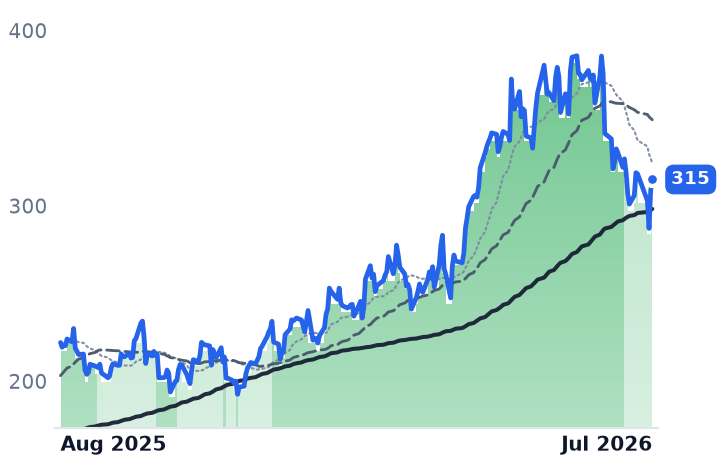
276
−3.02 (−1.08%)
vs. prior close
Price20d50d150d
TXN 12-month price
Analog & Mixed-Signal
MPWR
Monolithic Power Systems
1,426
+110 (+8.35%)
vs. prior close
Price20d50d150d
MPWR 12-month price
Analog & Mixed-Signal
TickerMkt capP/EP/E fwdP/SP/S fwdP/GPP/GP fwdEV/EBITDAFCF yld
ADI$203.8B75.4x36.4x17.3x14.5x26.8x22.5x37.9x2.2%
TXN$275.5B51.3x39.8x14.9x13.2x25.5x22.6x34.6x1.4%
MPWR$76.2B112.7x65.1x25.8x20.7x46.7x37.5x87.1x0.8%
MCHP
Microchip Technology Incorporated
74.29
−0.72 (−0.96%)
vs. prior close
Price20d50d150d
MCHP 12-month price
Analog & Mixed-Signal
NXPI
NXP Semiconductors
229
−16.00 (−6.53%)
vs. prior close
Price20d50d150d
NXPI 12-month price
Analog & Mixed-Signal
ON
ON Semiconductor
81.61
−2.13 (−2.54%)
vs. prior close
Price20d50d150d
ON 12-month price
Analog & Mixed-Signal
TickerMkt capP/EP/E fwdP/SP/S fwdP/GPP/GP fwdEV/EBITDAFCF yld
MCHP$50.8B251.3x29.8x10.8x8.2x17.9x13.6x55.1x1.6%
NXPI$73.6B27.8x19.9x5.8x5.2x10.4x9.3x18.1x4.0%
ON$44.3B77.7x36.9x7.3x6.9x19.5x18.4x37.3x3.3%
CRUS
Cirrus Logic
129
−4.51 (−3.37%)
vs. prior close
Price20d50d150d
CRUS 12-month price
Analog & Mixed-Signal
DIOD
Diodes Incorporated
82.32
−0.30 (−0.36%)
vs. prior close
Price20d50d150d
DIOD 12-month price
Analog & Mixed-Signal
AOSL
Alpha and Omega Semiconductor
31.74
+1.13 (+3.69%)
vs. prior close
Price20d50d150d
AOSL 12-month price
Analog & Mixed-Signal
TickerMkt capP/EP/E fwdP/SP/S fwdP/GPP/GP fwdEV/EBITDAFCF yld
CRUS$8.1B19.6x17.9x4.1x3.9x7.8x7.4x14.9x7.8%
DIOD$4.6B53.7x38.1x3.0x2.6x9.6x8.3x17.1x2.8%
AOSL$1.2Bn/m1.7x1.7x7.6x7.6x52.0x-5.2%

Valuation & fundamentals

Consensus projections

TickerFY2026EFY2027EFY2028E
ADIRevenue+28.0%+10.3%+12.3%
EPS+47.8%+15.4%+18.5%
TXNRevenue+18.3%+11.3%+9.4%
EPS+38.9%+16.8%+12.1%
MPWRRevenue+32.1%+22.6%+14.4%
EPS+34.4%+26.0%+15.6%
MCHPRevenue+6.2%+32.3%+15.4%
EPS+20.7%+100.8%+29.7%
NXPIRevenue+14.6%+10.6%+8.1%
EPS+24.5%+19.5%+16.8%
ONRevenue+7.5%+10.8%+11.0%
EPS+31.4%+38.0%+30.2%
CRUSRevenue+7.5%+5.6%+3.7%
EPS+28.5%−1.8%+5.4%
DIODRevenue+20.3%+15.9%
EPS+124.2%+76.4%
AOSLRevenue−1.9%+4.4%+18.5%
EPS−382.8%−10.7%−415.6%

Forward fiscal years only. Blank means no analyst coverage for that year.

What happened

Nine chipmakers that supply the analog and mixed-signal semiconductors inside cars, factory equipment and phones — the chips that manage power, voltage and real-world signals rather than raw computing — have gained an average of 43% over the past year. But in July they gave most of that recent momentum back together, falling an average of 13% in 30 days. The trigger was not a slowdown in their own end markets. It was a scare in an unrelated part of the chip industry: memory. Samsung's record profit still missed elevated expectations, SK Hynix said it would raise 2026 capital spending 50% to at least $31 billion, and a Shanghai stock debut by Chinese memory maker CXMT reignited fears of oversupply, and the Philadelphia Semiconductor Index fell roughly 19% for the month, its worst since 2008, with every member stock below its 50-day average. Analog names were swept along even though most had nothing to do with memory chips or AI data-center capex.

The businesses, and what's diverging

Texas Instruments (TXN), which makes analog chips that regulate power and signals in industrial gear, cars and consumer electronics, reported second-quarter revenue up 23% year over year to $5.46 billion, beating estimates, with analog revenue up 26%, gross margin up 340 basis points to 61%, and third-quarter guidance raised, with management saying automotive demand is "turning more clearly upward". Analog Devices (ADI), a maker of sensors and signal-processing chips for factory automation, autos and communications equipment, posted book-to-bill well above one and record bookings across its industrial, automotive and communications customers, guiding to roughly $3.9 billion in third-quarter revenue. Microchip Technology (MCHP), which sells microcontrollers and analog chips to industrial, automotive and aerospace customers, guided next-quarter sales up 35% year over year and gross margin to 62-63%, consistent with the inventory correction that has weighed on distributors finally clearing. All three beat and raised guidance in the very window their stocks fell — the clearest sign this is a sector-wide macro rotation, not a verdict on analog demand.

Two names complicate a clean read. Monolithic Power Systems (MPWR), which designs power-management chips including for Nvidia's AI servers, was the only one of the nine to rise in July (+7%), after second-quarter revenue jumped 48% on 164% growth in its AI/server power business; its 70%-plus year-to-date gain has outrun even Nvidia's, meaning its slice of the sector's one-year gain is an AI story wearing an analog label, not evidence the broader auto/industrial cycle has turned. NXP Semiconductors (NXPI), a major supplier of automotive and communications-infrastructure chips, is the genuine laggard: it posted a weak outlook with communications-infrastructure revenue down 27% and industrial/IoT down 11%, hurt by a prolonged glut of EV chips outside China, and it was also July's worst-hit name (-18%) — fundamentals and tape agreeing for once. ON Semiconductor (ON), which makes power chips and silicon-carbide components for electric vehicles, sits between: the desk's own notes describe silicon-carbide device demand still in a correction after the 2024 EV slowdown, even as ON remains the profitable, vertically integrated operator among loss-making SiC peers. The remaining three — Cirrus Logic (CRUS), a fabless maker of audio and power chips mostly for smartphones; Diodes Incorporated (DIOD), which makes discrete diodes and small-signal chips for industrial and consumer electronics; and Alpha and Omega Semiconductor (AOSL), a smaller power-semiconductor maker — fell the hardest in July (-12% to -27%) with limited fresh earnings news, largely riding the sector-wide de-rating.

Valuation and the setup

On the desk's most recent valuation snapshots (dated May 2026, ahead of the Q2 beats, so likely understating today's earnings base), ADI traded near 76x trailing/36x forward earnings, TXN near 50x trailing/38x forward, and MPWR near 118x trailing/67-70x forward — a level MPWR's own risk notes call "no margin for error." MCHP and ON carry no meaningful trailing P/E because earnings are still near trough, trading instead on price-to-sales (11.2x and 6.5x). If the Q2 beats hold, forward multiples on normalized earnings are cheaper than these trailing figures suggest — but that recomputation could not be confirmed directly, since detailed financial statements could not be pulled for eight of the nine names this round. Trend bands show the whole group falling in lockstep from strong or mild uptrends to neutral by July 31 — a synchronized, non-violent de-rating that matches a macro rotation rather than a company-specific breakdown. Verdict: CONFIRMS a genuine recovery at TXN, ADI and MCHP, where earnings and bookings improved as the stocks fell — a real dislocation between business and tape. INCONCLUSIVE for MPWR (AI-power strength papering over its own stretched multiple) and CONTRADICTS at NXPI, where soft auto-chip demand matches the weak stock.

The setup

Where it stands — Nine analog chipmakers fell with the broader semiconductor sector in July even as TXN, ADI and MCHP beat earnings and raised guidance. Would confirm — TXN, ADI and MCHP book-to-bill stays above 1.0 and industrial/auto revenue keeps growing sequentially next quarter. Would invalidate — Distributor inventory or book-to-bill rolls back below 1.0, or NXPI's auto/comms revenue declines persist into a second quarter. Watch next — Texas Instruments' Q3 2026 print (guided $5.65-6.15B revenue) and Analog Devices' Q3 FY26 results (guided ~$3.9B). Valuation — ADI ~36x forward, TXN ~38x forward, MPWR ~67-70x forward versus roughly 30-50x trailing medians a year ago; MCHP/ON trade on price-to-sales given near-trough earnings.
Latin America's Market Boom Bypasses MercadoLibre, Sea and Coupang — Unevenly

Hypothesis Opus 5 · Research Sonnet 5 · Writing Sonnet 5 · Prompt v1.1

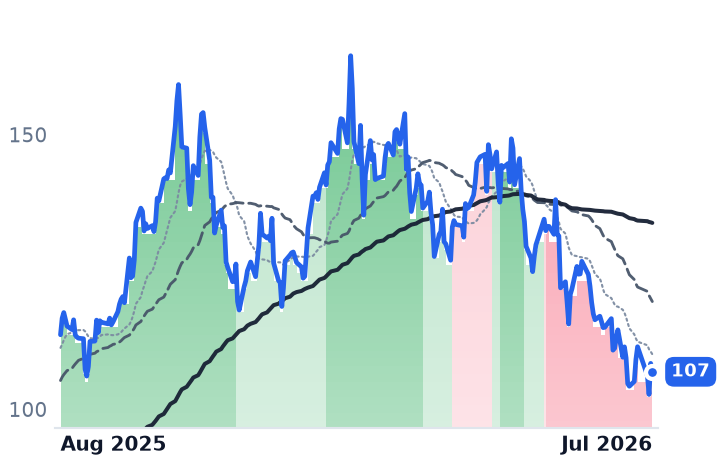
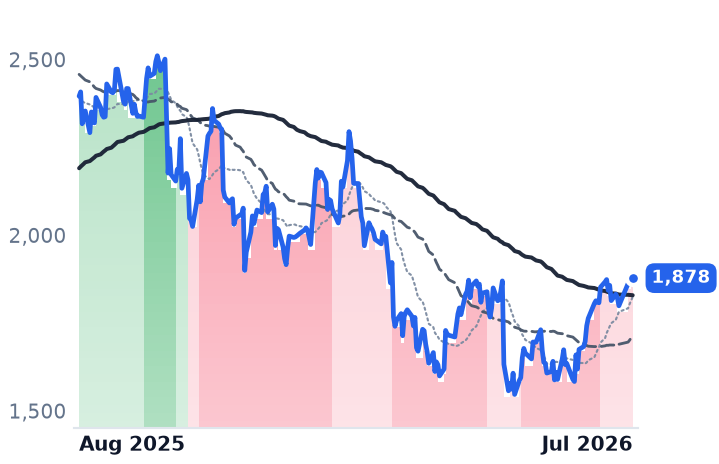
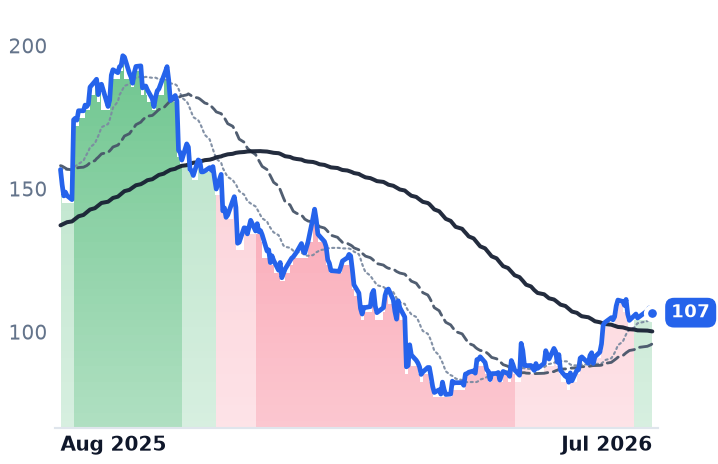
Regional stock funds tracking Brazil, Mexico and Argentina have rallied about 34% over the past year on commodities and rate cuts, while the three big emerging-market e-commerce companies fell an average 32.8% — but MercadoLibre's revenue accelerated even as its stock fell, Sea just inflected higher, and only Coupang's decline lines up with a real earnings break.

MELISECPNGILFEWZEWZSBRZUEWWARGTECH
TickerCompanySegmentTrend30D1Y
MELIMercadoLibreOnline Marketplaces🔴 Cont. Bear+4.0%−21.6%
SESeaOnline Marketplaces🔴 Cont. Bear+1.7%−31.9%
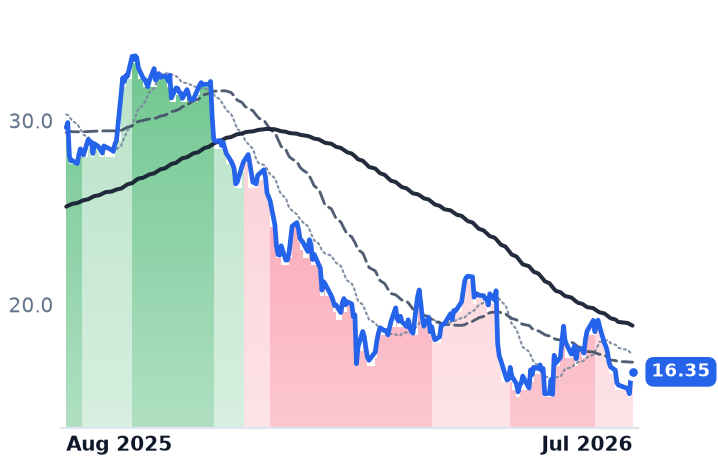
CPNGCoupangRegional/Niche E-commerce🔴 Cont. Bear−14.6%−44.8%
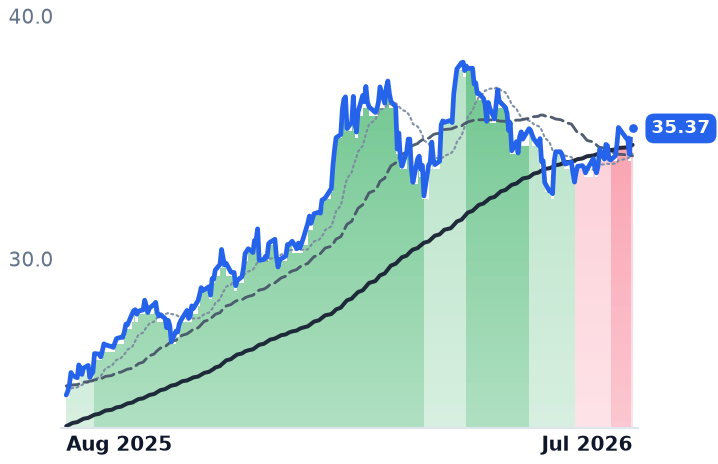
ILFiShares Latin America 40 ETFAsset Management - Global⚠️ Emerging Bear+3.6%+45.0%
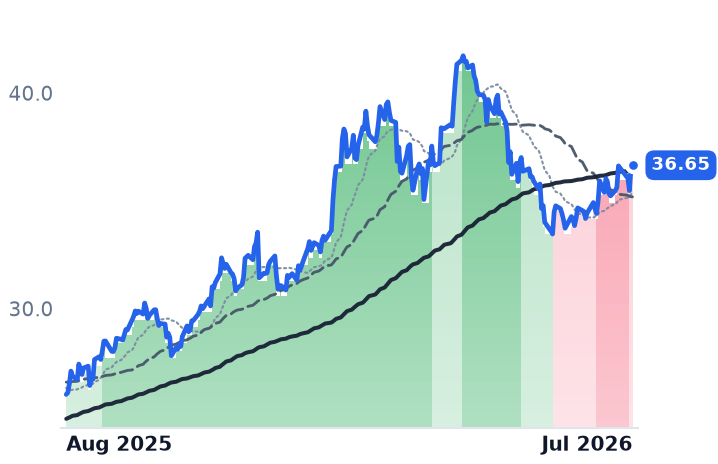
EWZiShares MSCI Brazil ETFAsset Management⚠️ Emerging Bear+5.0%+40.9%
EWZSiShares MSCI Brazil Small-Cap ETFAsset Management⚠️ Emerging Bear+1.1%+13.3%
BRZUDirexion Daily MSCI Brazil Bull 2X ETFAsset Management - Leveraged⚠️ Emerging Bear+9.4%+79.1%
EWWiShares MSCI Mexico ETFAsset Management - Global🟢 Cont. Bull+0.5%+32.2%
ARGTGlobal X - MSCI Argentina ETFAsset Management - Global🌱 Emerging Bull+1.2%+15.8%
ECHiShares MSCI Chile ETFAsset Management⚠️ Emerging Bear−0.8%+30.5%

12-month price & trend

MELI
MercadoLibre
1,878
−7.78 (−0.41%)
vs. prior close
Price20d50d150d
MELI 12-month price
Online Marketplaces
SE
Sea
107
+0.50 (+0.47%)
vs. prior close
Price20d50d150d
SE 12-month price
Online Marketplaces
CPNG
Coupang
16.35
+0.26 (+1.62%)
vs. prior close
Price20d50d150d
CPNG 12-month price
Regional/Niche E-commerce
TickerMkt capP/EP/E fwdP/SP/S fwdP/GPP/GP fwdEV/EBITDAFCF yld
MELI$95.2B49.6x47.7x3.0x2.3x7.0x5.4x30.7x11.2%
SE$64.1B39.8x30.5x2.5x2.1x5.6x4.7x22.8x5.2%
CPNG$29.3Bn/m0.8x0.8x2.8x2.8x38.4x1.0%
ILF
iShares Latin America 40 ETF
35.37
−0.01 (−0.03%)
vs. prior close
Price20d50d150d
ILF 12-month price
Asset Management - Global
EWZ
iShares MSCI Brazil ETF
36.65
+0.12 (+0.33%)
vs. prior close
Price20d50d150d
EWZ 12-month price
Asset Management
EWZS
iShares MSCI Brazil Small-Cap ETF
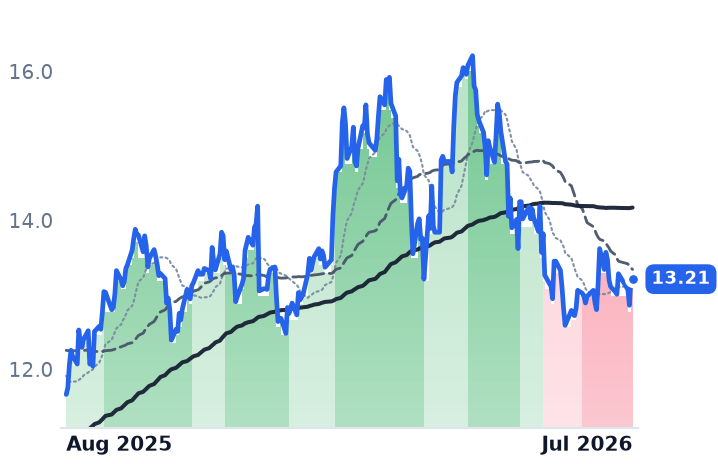
13.21
−0.03 (−0.23%)
vs. prior close
Price20d50d150d
EWZS 12-month price
Asset Management
TickerMkt capP/EP/E fwdP/SP/S fwdP/GPP/GP fwdEV/EBITDAFCF yld
ILF$2.4B
EWZ$7.4B
EWZS$145.3M
BRZU
Direxion Daily MSCI Brazil Bull 2X ETF
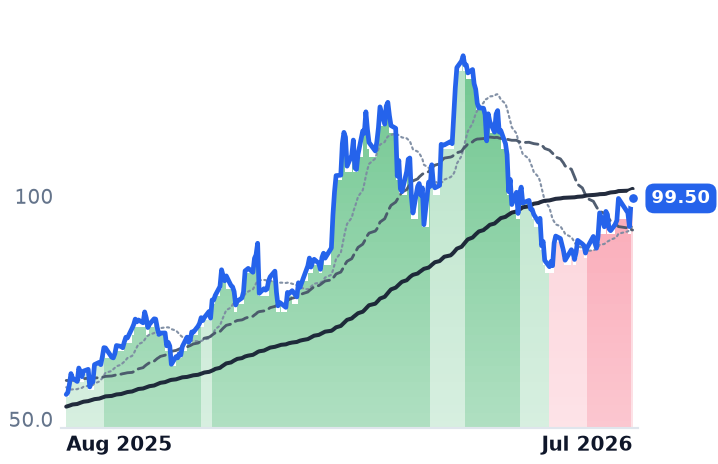
99.50
+0.97 (+0.98%)
vs. prior close
Price20d50d150d
BRZU 12-month price
Asset Management - Leveraged
EWW
iShares MSCI Mexico ETF
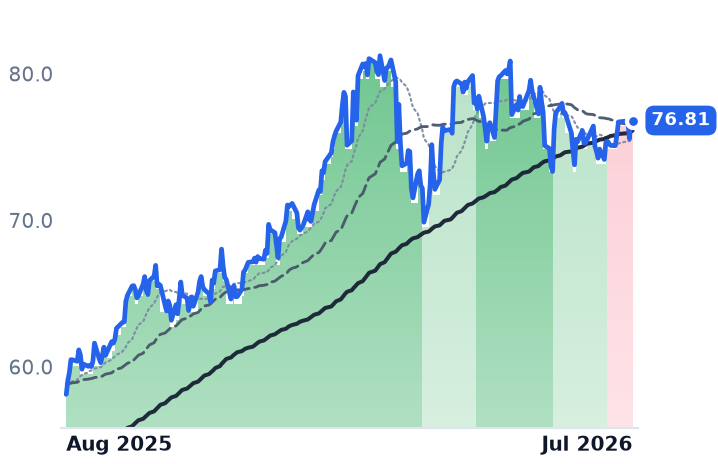
76.81
−0.30 (−0.39%)
vs. prior close
Price20d50d150d
EWW 12-month price
Asset Management - Global
ARGT
Global X - MSCI Argentina ETF
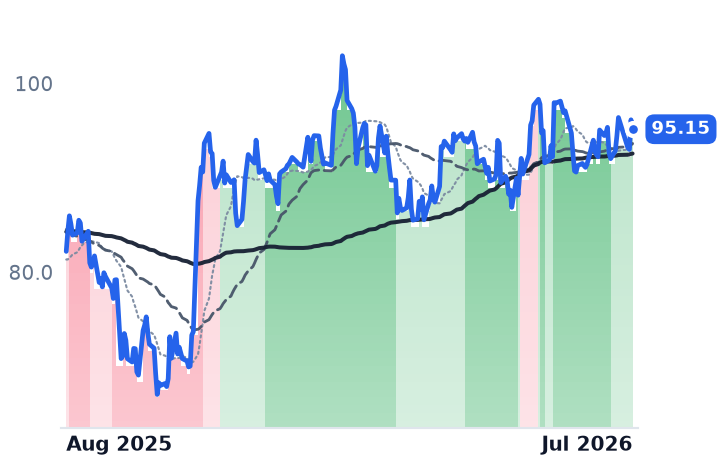
95.15
−1.00 (−1.04%)
vs. prior close
Price20d50d150d
ARGT 12-month price
Asset Management - Global
TickerMkt capP/EP/E fwdP/SP/S fwdP/GPP/GP fwdEV/EBITDAFCF yld
BRZU$105.4M
EWW$2.0B
ARGT$860.6M
ECH
iShares MSCI Chile ETF
39.33
−0.49 (−1.23%)
vs. prior close
Price20d50d150d
ECH 12-month price
Asset Management
TickerMkt capP/EP/E fwdP/SP/S fwdP/GPP/GP fwdEV/EBITDAFCF yld
ECH$1.0B

Valuation & fundamentals

Consensus projections

TickerFY2026EFY2027EFY2028E
MELIRevenue+42.2%+27.7%+23.1%
EPS−2.6%+43.1%+38.6%
SERevenue+34.8%+21.4%+16.5%
EPS+10.0%+39.2%+26.9%
CPNGRevenue+6.8%+14.5%+11.2%
EPS−276.9%−221.2%+113.7%

Forward fiscal years only. Blank means no analyst coverage for that year.

What happened

Over the past twelve months, exchange-traded funds tracking Brazilian, Mexican and Argentine stocks have rallied hard — a mix of the funds tracking Brazil (EWZ), a small-cap Brazil fund (EWZS), a 3x-leveraged Brazil fund (BRZU), broad Latin America (ILF), Mexico (EWW), Argentina (ARGT) and Chile (ECH) rose a simple average of roughly 34%, led by BRZU's leveraged 76% gain and ILF's 42%. Over the identical window, the region's three largest online-commerce companies — MercadoLibre, Sea and Coupang — fell an average of 32.8%. That is a roughly 65-to-70 point gap between the indices and the companies that, in theory, sell into the same growing consumer markets. The gap is real, but it is not one story: the three stocks fell for three different reasons, and one of them barely fell at all relative to how much its business grew.

The ETF rally is a commodities-and-rates story, not an e-commerce one

The Brazilian stock index that anchors most of these funds is dominated by the oil producer Petrobras, miner Vale, and banks Itaú Unibanco and Bradesco, along with brewer Ambev and industrial group WEG — names tied to commodity prices, interest-rate policy and bank lending, not online retail. Brazil's central bank has cut its benchmark Selic rate three straight times to 14.25% through mid-2026, and the Ibovespa has traded near record highs as the Brazilian real strengthened roughly 8% year-to-date. That currency strength is a genuine, if partial, tailwind for MercadoLibre's dollar-reported results, but it is a small piece of what is driving fund returns dominated by oil, mining and banking. Brazilian markets have also rallied specifically on rate-cut expectations — a dynamic with no direct read-through to how many packages get shipped in São Paulo.

Three companies, three different stories

MercadoLibre, which runs Latin America's largest online marketplace alongside the Mercado Pago digital-payments and lending business, fell the least of the three (-21.6%) despite the best fundamentals: first-quarter 2026 revenue accelerated to 49% year-over-year growth — its fastest pace in four years — with gross merchandise volume up 42%. Operating margin compressed to 6.9% from 12.9%, but management framed that as deliberate investment in free shipping and 2.7 million new credit cards issued in the quarter, not weakening demand; the stock still fell 13% the day after that earnings report. Its forward valuation compressed from 3.8x to 2.1x expected sales over the same period growth accelerated — a multiple falling as the business speeds up. The credit book, at $14.6 billion and growing 87% year-over-year, carries a greater-than-90-day delinquency rate near 17.6%, but those loan vintages are still too new to show their true loss rate. Investor Michael Burry disclosed a new MercadoLibre stake in the $1,500s-$1,600s in May. Verdict: business CONTRADICTS the sell-off (growth accelerated); valuation is INCONCLUSIVE pending the credit book seasoning.

Sea, which owns Southeast Asia's Shopee marketplace, the Garena gaming unit and the Monee digital-lending arm, fell 31.9% over the full year but has recently reversed. First-quarter Shopee volume grew 30%, the Monee loan book expanded 70% to $9.9 billion with stable asset quality, and total revenue rose 47%. The stock jumped 13.7% on that report, enough to flip its trend to an uptrend in late July after months in a downtrend. Verdict: business CONFIRMS a recent, not full-year, turn — the year's decline predates the current improvement.

Coupang, the South Korean e-commerce and grocery-delivery company also pushing into Taiwan, food delivery and fashion resale through Farfetch, fell the most (-44.8%) and is the one name whose stock move matches a genuine earnings break. It swung to a $266 million net loss after issuing $1.2 billion in customer vouchers tied to a data breach that exposed roughly 34 million accounts — about two-thirds of South Korea's population — and now faces a regulatory fine of up to $900 million; its Developing Offerings losses nearly doubled to $329 million even as that segment's revenue grew 28%. The stock trades at 0.90x trailing sales with no price-to-earnings multiple to speak of, and consensus price targets near $27-35 versus a roughly $16 share price imply the market sees the breach costs as largely one-off. Verdict: business CONFIRMS the decline; valuation leans toward POSSIBLE DISLOCATION if the fine and vouchers prove transitory.

The technical picture agrees only partly

Despite trailing twelve-month gains, several LatAm funds — EWZ, EWZS, ECH and BRZU — have actually rolled into short-term downtrends as of July 31, meaning the rally has already cooled even before any e-commerce comparison. MercadoLibre and Coupang remain in mild downtrends; Sea alone sits in an uptrend, confirming its post-earnings turn rather than the full-year decline.

The setup

Where it stands — MercadoLibre's revenue growth is accelerating while its multiple compresses; Coupang's loss is fundamental; Sea has just inflected higher. Would confirm — MercadoLibre's >90-day loan delinquency rate stabilizing below 17.6% as 2025-26 credit vintages season. Would invalidate — MercadoLibre's operating margin failing to recover toward 10%+ by FY2027 as UBS's base case assumes. Watch next — Coupang's next earnings for confirmation the Korean regulatory fine, up to $900 million, is finalized rather than open-ended. Valuation — MELI trades at 2.1x forward EV/Revenue (from 3.8x) and 48x trailing P/E; CPNG at 0.90x trailing sales with no P/E.

Nuclear Stocks Sink in Unison, But Cameco and BWXT's Own Numbers Keep Improving

Hypothesis Opus 5 · Research Sonnet 5 · Writing Sonnet 5 · Prompt v1.1

Twelve uranium, enrichment and small-reactor stocks flipped to a synchronized multi-month downtrend, but the sell-off splits cleanly: Cameco and BWX Technologies fell even as their earnings and backlogs grew, while NuScale, Oklo and Lightbridge remain pre-revenue and, on a price-to-sales basis, no cheaper than before the drop.

CCJLEUUECBWXTSMROKLOLTBRURANUKZURNMURNJNLR
TickerCompanySegmentTrend30D1Y
CCJCamecoUranium⚠️ Emerging Bear−11.4%+15.0%
LEUCentrus EnergyUranium⚠️ Emerging Bear+1.5%−15.8%
UECUranium EnergyUranium⚠️ Emerging Bear−9.3%+4.2%
BWXTBWX TechnologiesNaval & Shipbuilding⚠️ Emerging Bear−14.3%+9.6%
SMRNuScale PowerAdvanced Nuclear🔴 Cont. Bear−12.4%−80.6%
OKLOOkloEmerging & Specialized Energy⚠️ Emerging Bear−25.1%−49.2%
LTBRLightbridgeElectrical Equipment & Parts⚠️ Emerging Bear−7.6%−41.9%
URAGlobal X - Uranium ETFAsset Management⚠️ Emerging Bear−11.0%+3.7%
NUKZRange Nuclear Renaissance Index ETFAsset Management⚠️ Emerging Bear−5.6%+7.1%
URNMSprott Uranium Miners ETFAsset Management⚠️ Emerging Bear−9.3%+8.2%
URNJSprott Junior Uranium Miners ETFAsset Management⚠️ Emerging Bear−9.8%+10.2%
NLRVanEck Uranium and Nuclear ETFAsset Management⚠️ Emerging Bear−8.3%−5.9%

12-month price & trend

CCJ
Cameco
86.38
−1.85 (−2.10%)
vs. prior close
Price20d50d150d
CCJ 12-month price
Uranium
LEU
Centrus Energy
177
+0.18 (+0.10%)
vs. prior close
Price20d50d150d
LEU 12-month price
Uranium
UEC
Uranium Energy
9.60
−0.14 (−1.44%)
vs. prior close
Price20d50d150d
UEC 12-month price
Uranium
TickerMkt capP/EP/E fwdP/SP/S fwdP/GPP/GP fwdEV/EBITDAFCF yld
CCJ$37.6B148.0x52.9x15.2x10.7x55.1x38.8x61.0x1.0%
LEU$3.4B53.8x67.3x7.4x7.2x31.8x30.9x30.1x-1.8%
UEC$4.8Bn/m235.2x47.3x555.7x111.8xn/m-2.5%
BWXT
BWX Technologies
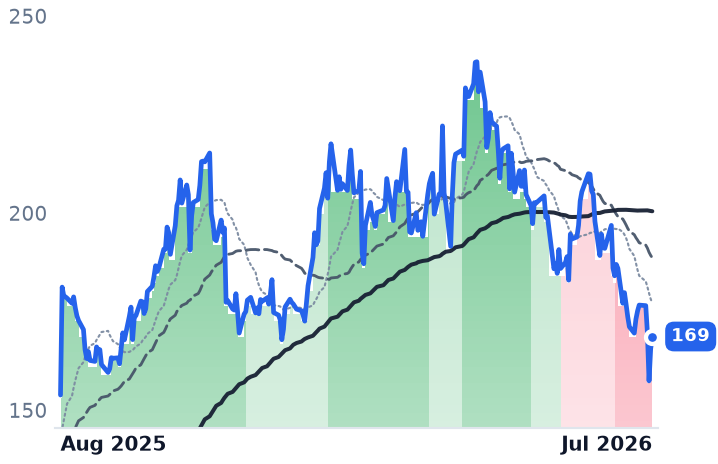
169
+3.11 (+1.88%)
vs. prior close
Price20d50d150d
BWXT 12-month price
Naval & Shipbuilding
SMR
NuScale Power
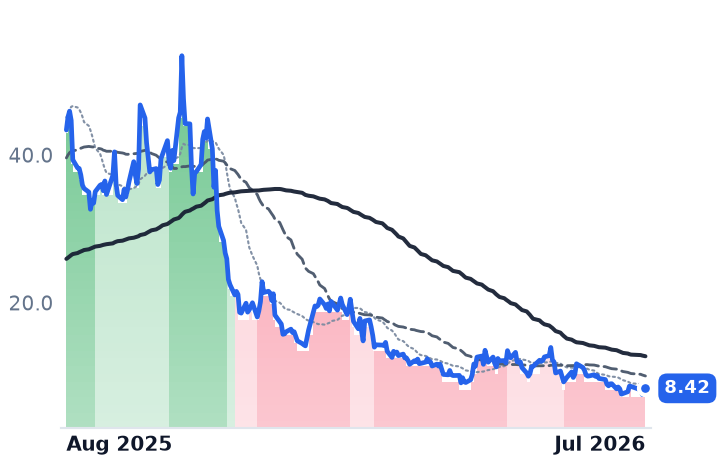
8.42
−0.18 (−2.09%)
vs. prior close
Price20d50d150d
SMR 12-month price
Advanced Nuclear
OKLO
Oklo
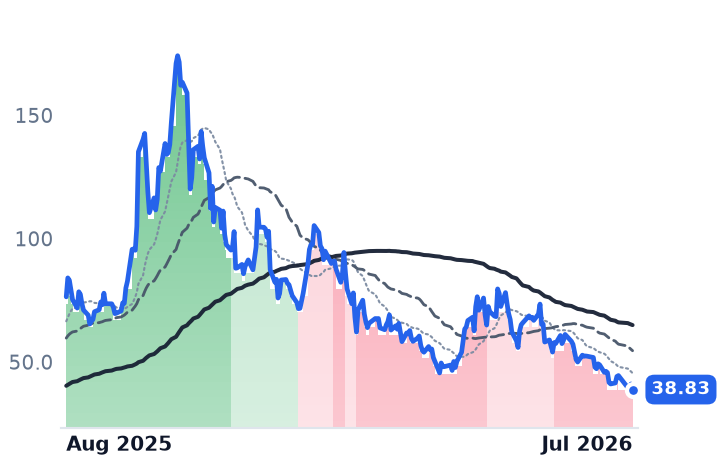
38.83
−2.26 (−5.50%)
vs. prior close
Price20d50d150d
OKLO 12-month price
Emerging & Specialized Energy
TickerMkt capP/EP/E fwdP/SP/S fwdP/GPP/GP fwdEV/EBITDAFCF yld
BWXT$15.5B44.7x35.8x4.6x4.1x20.9x18.6x29.8x2.1%
SMR$2.5Bn/m134.6x58.0x638.9x275.3xn/m-30.0%
OKLO$6.8Bn/mn/mn/mn/m-2.3%
LTBR
Lightbridge
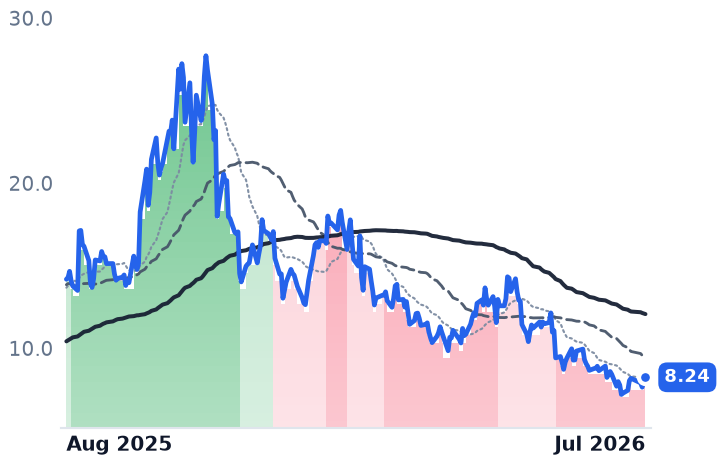
8.24
−0.20 (−2.37%)
vs. prior close
Price20d50d150d
LTBR 12-month price
Electrical Equipment & Parts
URA
Global X - Uranium ETF
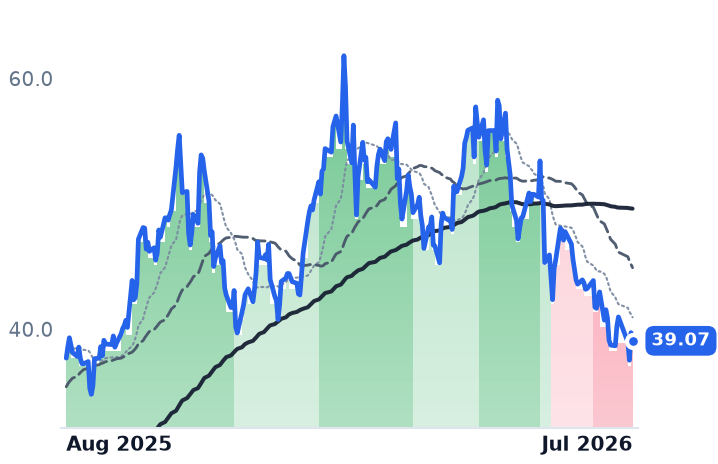
39.07
−0.65 (−1.64%)
vs. prior close
Price20d50d150d
URA 12-month price
Asset Management
NUKZ
Range Nuclear Renaissance Index ETF
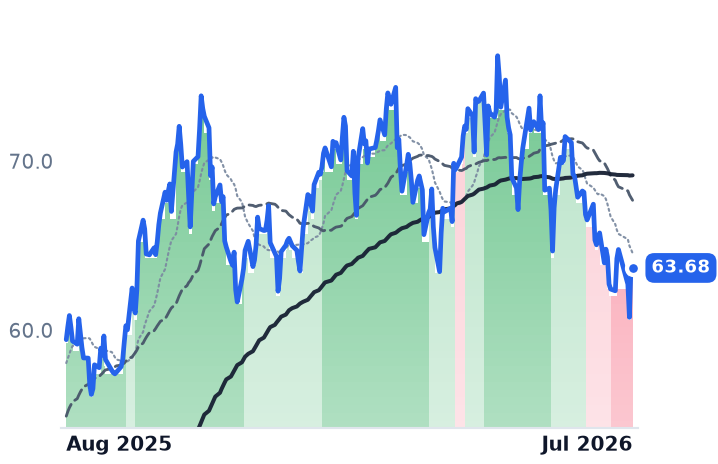
63.68
−0.13 (−0.20%)
vs. prior close
Price20d50d150d
NUKZ 12-month price
Asset Management
TickerMkt capP/EP/E fwdP/SP/S fwdP/GPP/GP fwdEV/EBITDAFCF yld
LTBR$289.6Mn/mn/mn/mn/m-5.4%
URA$3.9B
NUKZ$489.1M
URNM
Sprott Uranium Miners ETF
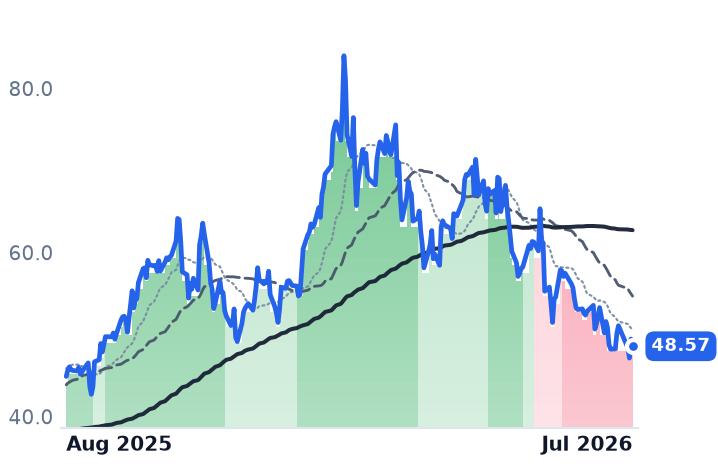
48.57
−0.88 (−1.78%)
vs. prior close
Price20d50d150d
URNM 12-month price
Asset Management
URNJ
Sprott Junior Uranium Miners ETF
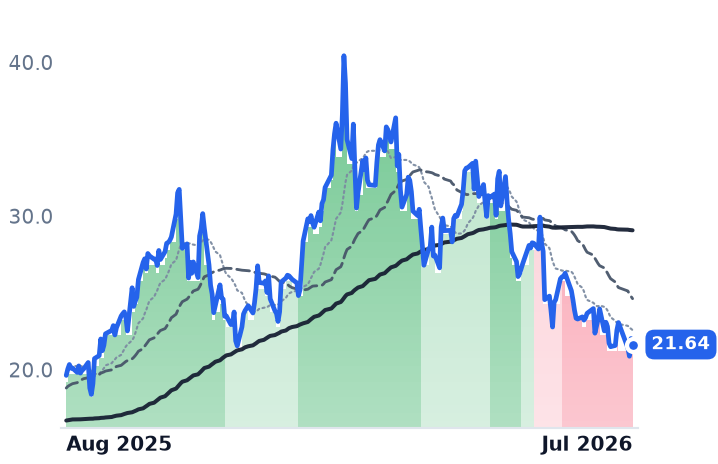
21.64
−0.39 (−1.77%)
vs. prior close
Price20d50d150d
URNJ 12-month price
Asset Management
NLR
VanEck Uranium and Nuclear ETF
107
−1.53 (−1.41%)
vs. prior close
Price20d50d150d
NLR 12-month price
Asset Management
TickerMkt capP/EP/E fwdP/SP/S fwdP/GPP/GP fwdEV/EBITDAFCF yld
URNM$1.1B
URNJ$207.8M
NLR$2.6B

Valuation & fundamentals

Consensus projections

TickerFY2026EFY2027EFY2028E
CCJRevenue+2.8%+10.7%+9.4%
EPS+13.8%+62.5%+20.5%
LEURevenue+3.5%+4.3%−12.9%
EPS−41.4%+1.3%−24.1%
UECRevenue−59.3%+272.6%+157.9%
EPS+64.5%−79.8%−647.6%
BWXTRevenue+19.7%+9.4%+7.5%
EPS+23.2%+11.1%+11.2%
SMRRevenue+3.5%+263.3%+80.2%
EPS−73.9%+26.1%−20.2%
OKLORevenue+359.5%+731.8%
EPS+20.1%+13.8%+10.2%

Forward fiscal years only. Blank means no analyst coverage for that year.

Twelve stocks tied to nuclear fuel, uranium mining and small reactors have all rolled over together since February, a synchronized breakdown rare enough to suggest a shared cause. But the businesses behind the tickers are not moving together at all: the two companies with the strongest quarterly results — a uranium miner and a naval-reactor contractor — have fallen the hardest in percentage terms even as their own numbers improved, while the pre-revenue reactor developers whose stocks have collapsed the most were already trading on valuations no amount of selling has meaningfully fixed.

Miners with growing earnings, falling multiples. Cameco, the world's No. 2 uranium miner and 49% owner of reactor-maker Westinghouse Electric, reported first-quarter net income up 88% year over year and held its 2026 production guidance of 19.5-21.5 million pounds of uranium oxide despite a brief spring suspension at its Cigar Lake mine. Its stock fell 29.2% over the three months to July 31 anyway, dragging its trailing price-to-earnings ratio down from roughly 104-117x in May to 79.8x now — a valuation compression happening alongside, not because of, weaker fundamentals. BWX Technologies, whose naval reactor-manufacturing business is a sole-source, security-cleared franchise for the U.S. Navy, grew its backlog to $8.65-8.7 billion (up 77-119% year over year) and posted 26% revenue growth in the first quarter, yet its stock fell 22.3% over the same three months, pulling its P/E from the mid-50s to 42x. Both stocks remain up 12-18% over the trailing twelve months — the multi-month decline has trimmed their 2026 gains, not erased them.

Enrichers and developers: a mixed and mostly unresolved de-rating. Centrus Energy, the sole U.S.-licensed commercial producer of the high-assay low-enriched uranium (HALEU) used in advanced reactors, signed a $900 million fixed-price Department of Energy contract on June 30 for new enrichment capacity at its Piketon, Ohio site, and completed a prior demonstration deal with more than 1,900 kilograms delivered ahead of schedule, per PR Newswire. Its stock still rose 9.1% over the past month even while carrying a downtrend, but its P/E of roughly 62x is little changed from May because 2026 earnings guidance was itself cut about 37%. Uranium Energy Corp, which mined 45,743 pounds of uranium oxide in its latest quarter at an all-in cost of $44.14 a pound per PR Newswire, has seen its price-to-sales ratio fall from roughly 350-373x to about 225x — still far outside any normal anchor for a company with roughly $20 million in quarterly revenue. NuScale Power, the only federally certified small modular reactor design, posted $31.5 million of 2025 revenue, down 15% year over year, with losses widening to about $356 million; its stock has fallen 81% over twelve months, yet its price-to-sales multiple actually rose, to about 161x from 121x, because dilution and declining trailing revenue outpaced the price drop. Oklo, the Sam Altman-backed reactor developer, has a pipeline exceeding 14 gigawatts built mostly on non-binding letters of intent, alongside a binding 12-gigawatt agreement with data-center operator Switch and a Meta prepayment for an Ohio campus, but licensing and first commercial power remain targeted for 2027-2028, per Utility Dive; its stock fell 28% in a single month, per 24/7 Wall St.. Lightbridge, an advanced-fuel developer, has had zero revenue in every quarter since mid-2024, raised $176 million through a drip-feed share sale in 2025, and grew its diluted share count 121% in five quarters to fund a $23-million annual cash burn against $201.9 million in cash.

Funds held up better than the stocks driving the story. Among the five nuclear-themed exchange-traded funds tracked, the Range Nuclear Renaissance fund (NUKZ) fell just 4.3% over the past month and 12.3% over three months — the shallowest drawdown in the group and still up 8.8% over twelve months — while the broader uranium-miner and nuclear funds (URA, URNM, URNJ, NLR) fell 7-9% on the month and 26-31% over three months. VanEck's own research attributes the broader sell-off to macro risk-off sentiment and fading artificial-intelligence-power narratives rather than any change in uranium's physical supply-demand balance, per VanEck. Spot uranium prices consolidated near $84-87 a pound after peaking above $101 in January, while long-term contract prices climbed to a record near $97 a pound, a backwardation more consistent with a healthy physical market than a rolling-over one, per Discovery Alert. The one incremental supply risk flagged by analysts is Kazakhstan's state miner guiding 2026 output up about 9%, which BMO's Alexander Pearce said could put "modest pressure" on prices via a slightly smaller supply deficit, per Mining.com.

Technicals. All twelve tickers held a sustained uptrend through February 2026 before flipping to a sustained downtrend by late July, with Cameco and BWX Technologies breaking that trend on the 90-, 180- and 365-day views simultaneously — a synchronized, gradual rollover rather than a single-name shock, and one that has so far cut into, but not erased, their year of gains.

The setup

Where it stands — Twelve nuclear-linked stocks share a synchronized multi-month downtrend, but Cameco and BWX Technologies' earnings and backlogs grew through it. Would confirm — Cameco's or BWX Technologies' P/E keeps compressing toward pre-2024 levels while their production and backlog guidance still rises next quarter. Would invalidate — Spot uranium prices break decisively below $80 a pound or utility long-term contracting volumes visibly slow in coming quarterly reports. Watch next — NuScale's and Oklo's next quarterly filings for whether letters of intent convert into funded, binding construction contracts. Valuation — Cameco trades at 79.8x trailing earnings versus 104-117x in May; NuScale's price-to-sales rose to 161x from 121x despite an 81% twelve-month price decline.

CMS's Milder CY2027 Home-Health Rule Sparks Rally, But Cohort Story Splits Five Ways

Hypothesis Opus 5 · Research Sonnet 5 · Writing Sonnet 5 · Prompt v1.1

A friendlier CMS home-health payment rule triggered a synchronized late-July rally across five post-acute names, but the cohort's +54.1% one-year figure is dominated by a private-equity buyout and a distressed-base rebound — Option Care Health is still down over the year despite steady earnings, while Addus HomeCare's growth is decelerating into its August 3 print.

ADUSAVAHCHEEHABOPCH
TickerCompanySegmentTrend30D1Y
ADUSAddus HomeCareHome Health & Hospice🔴 Cont. Bear+9.2%+8.0%
AVAHAveanna HealthcareHome Health & Hospice🟢 Cont. Bull−1.5%+145.8%
CHEChemedHome Health & Hospice🌱 Emerging Bull+10.8%+26.2%
EHABEnhabitHome Health & Hospice🟢 Cont. Bull+109.1%
OPCHOption Care HealthHome Health & Hospice🔴 Cont. Bear+7.8%−18.5%

12-month price & trend

ADUS
Addus HomeCare
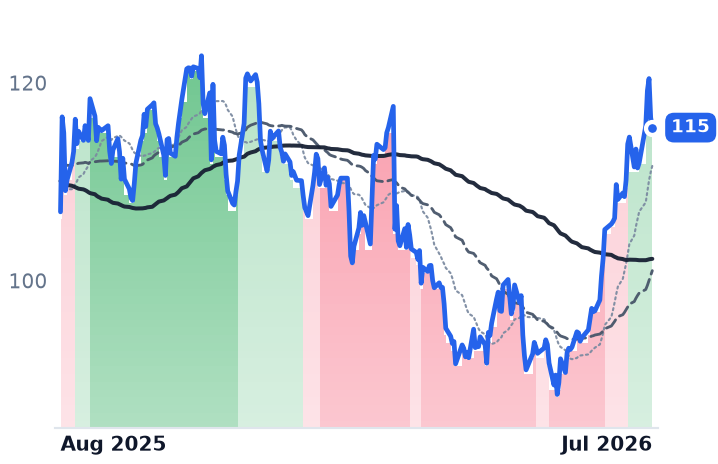
115
−1.02 (−0.88%)
vs. prior close
Price20d50d150d
ADUS 12-month price
Home Health & Hospice
AVAH
Aveanna Healthcare
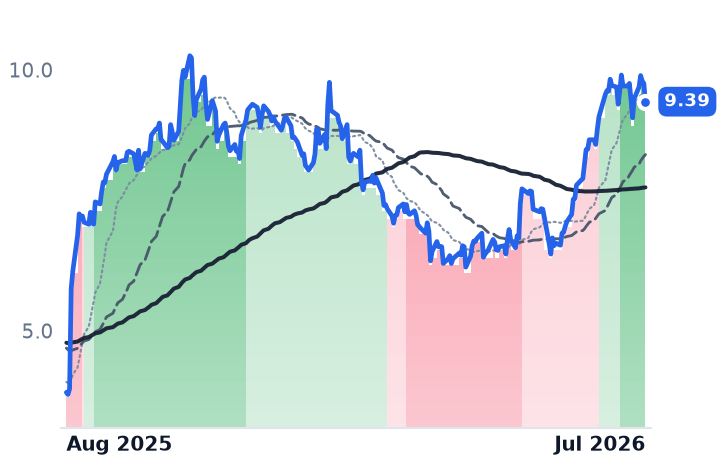
9.39
−0.35 (−3.59%)
vs. prior close
Price20d50d150d
AVAH 12-month price
Home Health & Hospice
CHE
Chemed
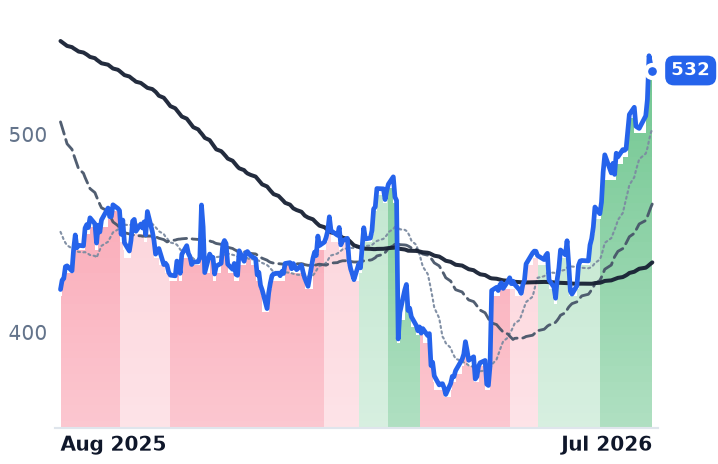
532
−3.06 (−0.57%)
vs. prior close
Price20d50d150d
CHE 12-month price
Home Health & Hospice
TickerMkt capP/EP/E fwdP/SP/S fwdP/GPP/GP fwdEV/EBITDAFCF yld
ADUS$1.7B16.9x13.0x1.2x1.1x3.7x3.4x10.9x8.1%
AVAH$1.7B6.3x11.5x0.7x0.6x2.1x1.8x9.8x8.1%
CHE$5.8B22.9x17.8x2.3x2.1x7.6x6.9x14.5x6.5%
EHAB
Enhabit
Price20d50d150d
EHAB 12-month price
Home Health & Hospice
OPCH
Option Care Health
23.03
+0.57 (+2.54%)
vs. prior close
Price20d50d150d
OPCH 12-month price
Home Health & Hospice
TickerMkt capP/EP/E fwdP/SP/S fwdP/GPP/GP fwdEV/EBITDAFCF yld
EHAB$706.9Mn/m23.0x0.7x0.6x1.5x1.3x20.0x11.4%
OPCH$3.1B14.8x10.6x0.5x0.5x2.8x2.8x7.1x7.7%

Valuation & fundamentals

Consensus projections

TickerFY2026EFY2027EFY2028E
ADUSRevenue+6.9%+4.7%+4.0%
EPS+12.8%+6.9%+5.1%
AVAHRevenue+20.3%+7.2%+5.6%
EPS+4822.7%+15.5%+9.2%
CHERevenue+5.6%+6.2%+5.4%
EPS+9.9%+10.5%+7.2%
EHABRevenue+3.6%+4.5%+4.1%
EPS+6.6%+11.9%−23.3%
OPCHRevenue+1.4%+7.1%+8.7%
EPS+6.1%+12.2%+12.2%

Forward fiscal years only. Blank means no analyst coverage for that year.

A rule change explains the timing, not the cohort's substance

The five-name post-acute cohort in this Healthcare > Medical - Care Facilities > Home Health & Hospice sample — Addus HomeCare, Aveanna Healthcare, Chemed, Enhabit and Option Care Health — carries a headline gain of +54.1% over twelve months. That number is real but misleading: it blends a private-equity buyout, a distressed-balance-sheet rebound, one clean fundamental beat, and one stock still down for the year despite steady earnings.
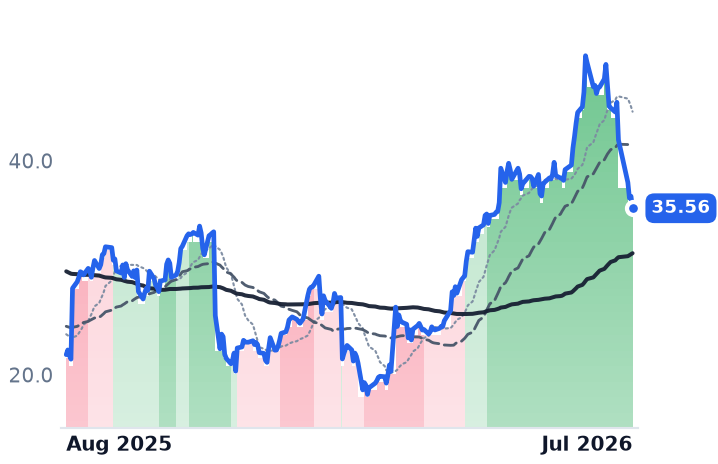
Every active name's trend band was bearish for most of the first half of 2026 and flipped bullish almost simultaneously in the back half of July — a pattern that lines up with CMS's newly proposed CY2027 home health payment rule, which for the first time since 2022 drops the recurring "behavioral adjustment" cut, instead proposing a temporary -3.0% adjustment against a net +2.4% aggregate payment increase, Applied Policy reports. That is a genuine, dateable catalyst — but a two-to-four-week-old one, not confirmation of a mature re-rating.

Five names, five different stories

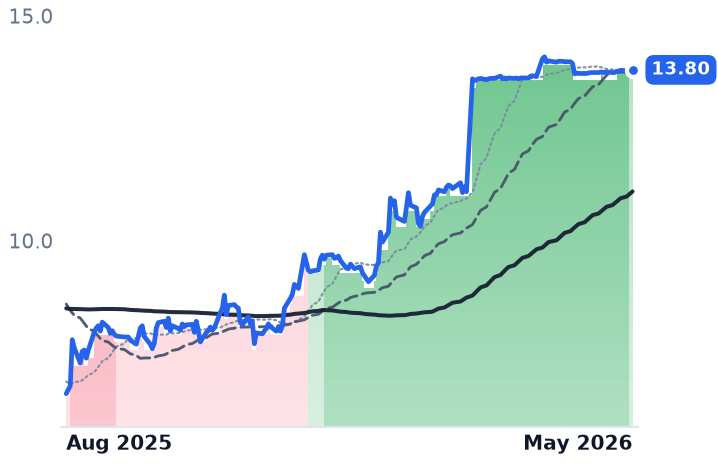
Enhabit, a home health and hospice operator spun off from Encompass Health in 2022, no longer trades: Kinderhook Industries agreed in February 2026 to take it private for $13.80/share cash, a roughly 24% premium, and the deal closed in May 2026 — its prior-year "gain" reflects a buyout price, not a functioning market.

Chemed, whose VITAS Healthcare hospice segment sits alongside its unrelated Roto-Rooter plumbing business, is the cleanest fundamental story: second-quarter revenue rose 8.8% year-over-year to $673.3M, VITAS admissions rose 9% and average daily census hit a record above 24,000 in second-quarter results, while Florida's Medicare-cap overhang eased and full-year VITAS census guidance was raised, even as Roto-Rooter faced rising customer-acquisition costs. Chemed trades at a trailing 23.8x, forward 17.5x, with adjusted EBITDA margin guided to 21.5%-22.5% — a reasonable multiple against raised guidance, closer to a supported advance than a stretched one.

Aveanna Healthcare, a pediatric and adult private-duty nursing and home-health provider, raised 2026 guidance after closing the Family First Homecare deal and cut leverage from above 11x to under 3.8x, with ten state Medicaid rate enhancements won in 2025. Its 136% one-year gain, though, comes off a genuinely distressed $3.97 base; at a 13.9x forward multiple it also carries a wide dispersion of valuation opinion, with one model flagging it as significantly overvalued.

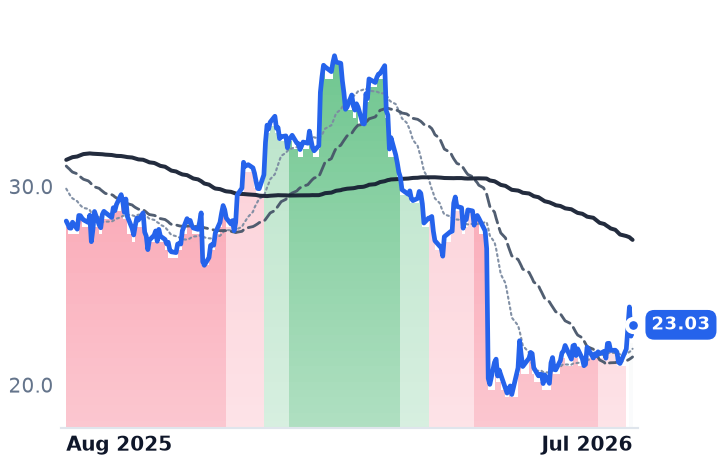
Option Care Health, the largest independent home and alternate-site infusion therapy provider, is the outlier: shares are still down 21.5% over twelve months and only exited a bearish trend band in the final days of July. Yet second-quarter revenue grew roughly 2% to $1.4bn and adjusted EBITDA rose 3%, guidance was maintained, and the company repurchased $150M of stock — against a forward multiple near 12.2x, below both Chemed's and its own prior trailing multiple. That combination — a still-depressed price, stable-to-growing earnings, and no visible deterioration — is closer to a dislocation than a confirmed re-rating.

Addus HomeCare, a Medicaid-funded personal home-care and hospice provider, sits opposite: revenue growth decelerated sharply to 7.7% from 21.8% in its most recent quarter, missing estimates, and analysts cut price targets citing regulatory and M&A uncertainty — even as its trend band flipped bullish only two weeks ago. State rate increases have helped (Illinois +3.9%), but Medicaid tightening under the federal budget law is projected to cut enrollment by roughly 7.6 million people by 2034, a structural headwind for its core volumes. Addus reports Q2 results on August 3.

Sector-wide, Medicare Advantage penetration crossed 54% in 2025 and is pushing volume from skilled nursing into the home, though MA rates run 10-15% below fee-for-service, compressing margins even as volume rises — consolidation appetite remains real, illustrated by UnitedHealth's $3.3bn Amedisys close last August alongside the Enhabit deal.

The setup

Where it stands — Cohort trend bands flipped bullish together in late July after a milder CMS CY2027 rule; fundamentals diverge sharply by name. Would confirm — Addus's August 3 print shows revenue growth stabilizing and Option Care's next quarter sustains EBITDA growth with maintained guidance. Would invalidate — Addus growth decelerates further or Option Care's trend band reverses back into a bearish reading within weeks. Watch next — Addus HomeCare reports Q2 2026 results August 3, 2026; CMS finalizes the CY2027 home health rule later this year. Valuation — CHE 23.8x trailing/17.5x forward; AVAH 13.9x forward; OPCH ~12.2x forward versus its own higher trailing multiple; ADUS ambiguous pending Q2.

Physician-Staffing Rally Splits: AGL's Margin 'Turn' Is De-Risking, Not Growth

Hypothesis Opus 5 · Research Sonnet 5 · Writing Sonnet 5 · Prompt v1.1

A year-long re-rating across value-based primary care and physician staffing predates Agilon Health's recent surge, but decomposing the cohort shows two different stories under one label: Agilon and Astrana Health trade rich after runs built partly on shrinking risk books and acquisitions, while AMN Healthcare and Pediatrix Medical Group remain far cheaper with steadier, if less dramatic, underlying numbers.

AGLAMNASTHMD
TickerCompanySegmentTrend30D1Y
AGLAgilon HealthPhysician Services & Staffing🌱 Emerging Bull−14.9%+101.9%
AMNAMN Healthcare ServicesPhysician Services & Staffing🌱 Emerging Bull−6.0%+92.9%
ASTHAstrana HealthPhysician Services & Staffing🌱 Emerging Bull−24.2%+62.5%
MDPediatrix MedicalPhysician Services & Staffing🟢 Cont. Bull−3.2%+115.5%

12-month price & trend

AGL
Agilon Health
91.61
−5.14 (−5.31%)
vs. prior close
Price20d50d150d
AGL 12-month price
Physician Services & Staffing
AMN
AMN Healthcare Services
33.63
−1.08 (−3.11%)
vs. prior close
Price20d50d150d
AMN 12-month price
Physician Services & Staffing
ASTH
Astrana Health
35.56
−1.12 (−3.05%)
vs. prior close
Price20d50d150d
ASTH 12-month price
Physician Services & Staffing
TickerMkt capP/EP/E fwdP/SP/S fwdP/GPP/GP fwdEV/EBITDAFCF yld
AGL$1.5Bn/m0.3x0.3xn/m-5.0%
AMN$1.3Bn/m12.7x0.4x0.4x1.4x1.4x7.5x54.2%
ASTH$1.8B57.6x28.0x0.5x0.4x5.4x4.3x14.4x8.8%
MD
Pediatrix Medical
26.51
+0.03 (+0.11%)
vs. prior close
Price20d50d150d
MD 12-month price
Physician Services & Staffing
TickerMkt capP/EP/E fwdP/SP/S fwdP/GPP/GP fwdEV/EBITDAFCF yld
MD$2.2B12.9x11.6x1.1x1.1x4.3x4.3x9.3x10.9%

Valuation & fundamentals

Consensus projections

TickerFY2026EFY2027EFY2028E
AGLRevenue−1.8%+6.3%+11.6%
EPS−84.4%−69.1%−294.6%
AMNRevenue+20.2%−19.9%+4.5%
EPS+88.5%−59.2%+18.2%
ASTHRevenue+26.7%+9.4%+7.0%
EPS+158.1%+47.6%+46.0%
MDRevenue+1.9%+2.4%+4.4%
EPS+9.5%+3.5%−3.0%

Forward fiscal years only. Blank means no analyst coverage for that year.

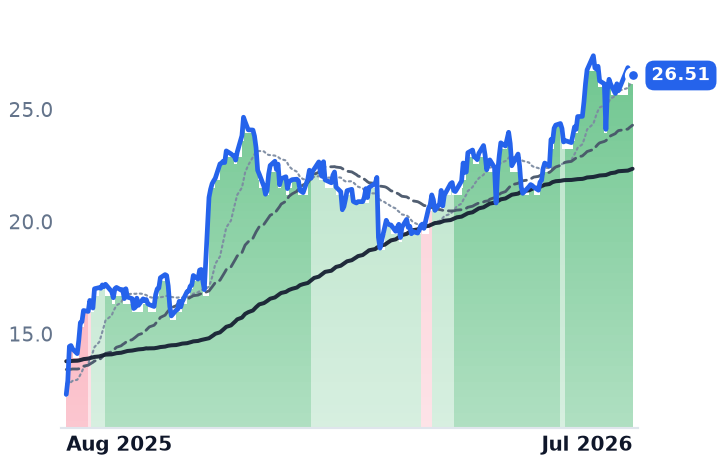
Four names sit in the user's watchlist under Physician Services & Staffing — Agilon Health, AMN Healthcare, Astrana Health and Pediatrix Medical Group — and all four have carried an emerging-bull tag after climbing out of a sustained downtrend that had them all reading strong-bear as recently as mid-2025. That timing matters: AMN, Astrana and Pediatrix confirmed their own uptrends weeks before Agilon's band flipped, so the label is cohort-wide rather than a single-stock artifact riding on Agilon's back. What has changed since is that Agilon's move has since dwarfed the others — up roughly 383% over six months against 30-73% for its three peers — and that divergence is now unwinding two names hard while leaving the other two untouched.

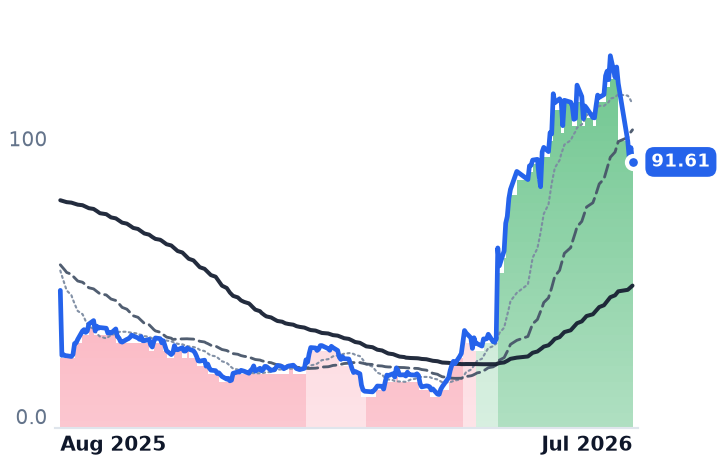
Agilon Health, which contracts to bear full financial risk on Medicare Advantage patients for independent primary-care doctors, fell from $102 to a $9.75 trough in April before rocketing to $91.61 by late July. Medical margin rose to $149M from $128M a year earlier and full-year guidance was lifted to roughly $5.7B in revenue and $375M in medical margin — but membership fell 13.2% year over year, meaning the margin gain came substantially from exiting unprofitable Medicare Advantage contracts rather than organic growth. Citi downgraded the stock to Sell on July 23 even while raising its price target to $105 from $80, citing a 38% valuation premium to peers after a roughly 650% year-to-date run; shares fell about 11% that day and have since given back roughly a quarter of their value. A separate overhang, a stockholder investigation into potential misstatements about Agilon's medical costs, adds to the case that the tape has run ahead of the story.

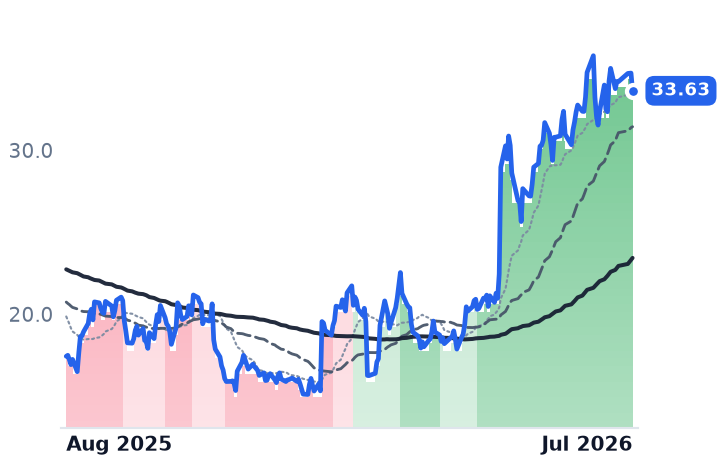
AMN Healthcare, the largest US healthcare staffing firm for travel nurses and physician locums, reported Q1 revenue that roughly doubled year over year, but nearly $722M of that was one-off nurse labor-disruption revenue management itself called unsustainable, with Q2 guidance of $620-635M implying a steep sequential drop. Core locums revenue fell 6% year over year on lower days filled, and industry-wide travel-nurse revenue is edging up only about 1% in 2026 with bill rates still pressured — a plateau, not an inflection. Yet AMN trades with no meaningful trailing P/E and a price-to-sales ratio near 0.37x, and its stock was flat over the past month while Agilon and Astrana sold off.

Astrana Health, which runs capitated, full-risk physician networks, posted 55.6% revenue growth substantially fueled by its Prospect Health acquisition rather than organic capitation growth alone. After an 86.5% year-to-date run, commentary flagged the stock as fully valued at roughly 73x trailing earnings, and its mid-July pullback was tied to broad sector rotation rather than any Astrana-specific news; shares are down 28.6% over the trailing month.

Pediatrix Medical Group, which staffs neonatal, maternal-fetal and pediatric subspecialty physicians nationally, is the steadiest of the four: trailing earnings near 12.9x, and management reaffirmed $280-300M adjusted EBITDA guidance with stable payor mix, explicitly noting it hasn't seen the unfavorable mix shifts reported elsewhere in the sector. The whole cohort also gets a shared macro tailwind: CMS's final CY2027 Medicare Advantage rate notice raised the net payment increase to 2.48% (4.98% including risk-score trend), well above the 0.09% initially proposed, supporting risk-bearing providers broadly into next year. Pediatrix reports Q2 results August 4, with Agilon following August 5 — the nearest live test of which fundamental story the shared label actually reflects.

The setup

Where it stands — Cohort tag is real and predates AGL's move, but the recent pullback is concentrated in AGL and ASTH while AMN and MD held flat. Would confirm — AMN core locums revenue stabilizes or turns positive and AGL membership stops shrinking in the Q3 print. Would invalidate — Agilon or Astrana resume new highs on no fresh operating data, widening the valuation gap further. Watch next — Pediatrix reports August 4, 2026; Agilon reports August 5, 2026. Valuation — MD ~12.9x trailing earnings; ASTH ~73x trailing; AMN and AGL have no meaningful trailing P/E versus roughly 0.36-0.37x price-to-sales each.

Regulated Utilities' AI Rally Holds as Merchant Power Cracks, But Multiples Are Stretched

Hypothesis Opus 5 · Research Sonnet 5 · Writing Sonnet 5 · Prompt v1.1

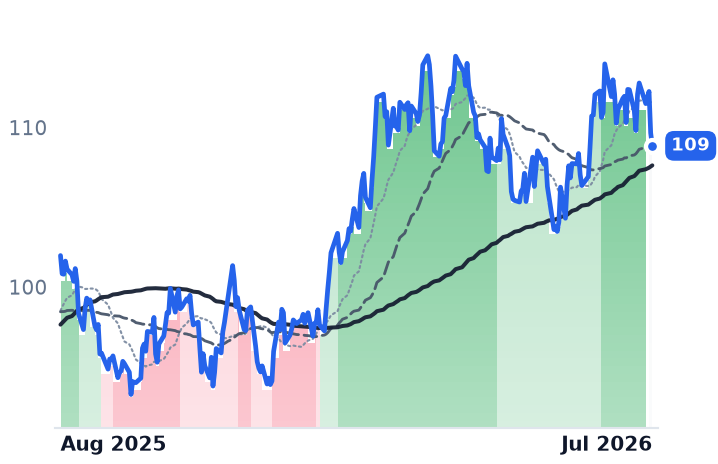
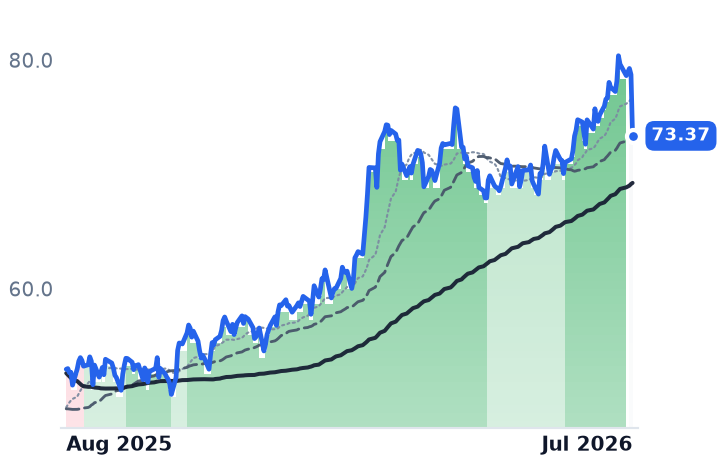
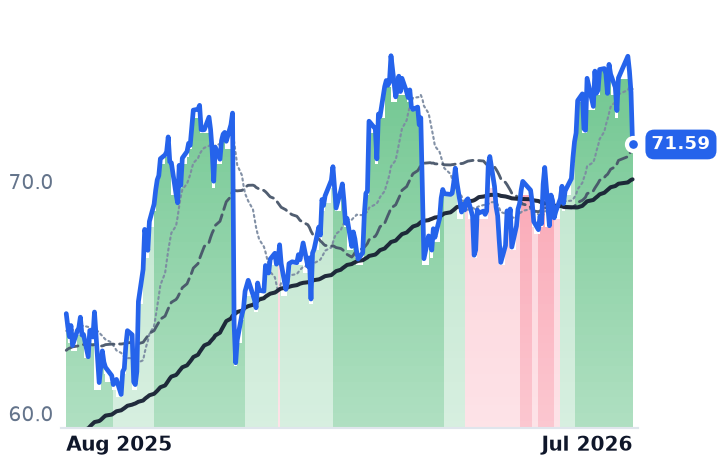
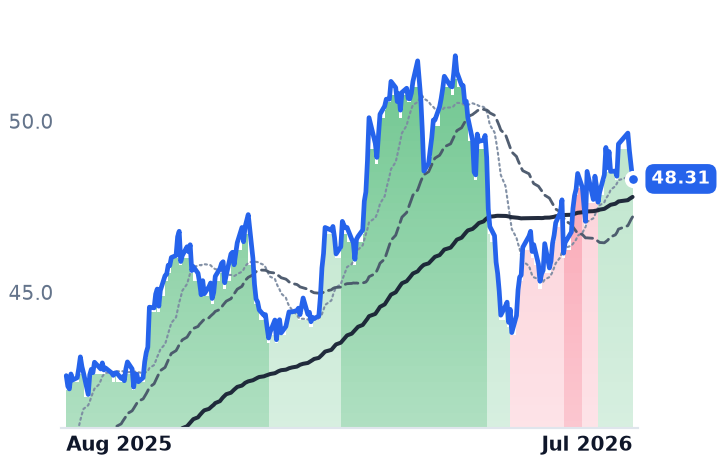
The 25-member vertically integrated utilities group is up a broad-based ~8.7% over the past year on real, upgraded data-center capex and rate-base growth at AEP, Dominion, Entergy and Duke — but trailing multiples of 20x-30x sit well above the sector's own 16.8x long-run median, and a uniform 30-day, ~5% pullback tracks rising Treasury yields and regulatory backlash rather than any crack in the underlying business.

AEPDETRNEEDUKSOAEEATOAVACMSCNPDTEEDEIXESFEIDALNTNIPEGPNWPORPPLWECXELCWENBEPBWXTCCJFRVOOKLOSREPCG
TickerCompanySegmentTrend30D1Y
AEPAmerican Electric PowerVertically Integrated Utilities🟢 Cont. Bull−6.0%+13.9%
DDominion EnergyVertically Integrated Utilities🟢 Cont. Bull−0.1%+17.0%
ETREntergyVertically Integrated Utilities🟢 Cont. Bull−5.5%+19.8%
NEENextEra EnergyVertically Integrated Utilities⚠️ Emerging Bear−0.6%+25.9%
DUKDuke EnergyVertically Integrated Utilities🟢 Cont. Bull−0.4%+3.6%
SOThe SouthernVertically Integrated Utilities🟢 Cont. Bull−1.5%+0.9%
AEEAmerenVertically Integrated Utilities🟢 Cont. Bull−3.0%+8.4%
ATOAtmos EnergyNatural Gas Distribution⚠️ Emerging Bear−0.6%+10.2%
AVAAvistaUS Electric & Gas Utilities🟢 Cont. Bull−0.5%+9.9%
CMSCMS EnergyVertically Integrated Utilities🟢 Cont. Bull−5.6%−1.4%
CNPCenterPoint EnergyUS Electric & Gas Utilities🟢 Cont. Bull−4.5%+9.2%
DTEDTE EnergyVertically Integrated Utilities🟢 Cont. Bull−6.3%+3.3%
EDConsolidated EdisonVertically Integrated Utilities🌱 Emerging Bull−2.8%+6.7%
EIXEdison InternationalRegional/International Utilities🟢 Cont. Bull−0.8%+38.5%
ESEversource EnergyVertically Integrated Utilities🟢 Cont. Bull−2.2%+11.3%
FEFirstEnergyVertically Integrated Utilities⚠️ Emerging Bear+1.3%+13.5%
IDAIDACORPVertically Integrated Utilities🟢 Cont. Bull−5.4%+16.1%
LNTAlliant EnergyVertically Integrated Utilities🟢 Cont. Bull−7.6%+9.2%
NINiSourceNatural Gas Distribution🟢 Cont. Bull−5.6%+3.9%
PEGPublic Service Enterprise Group IncorporatedVertically Integrated Utilities⚠️ Emerging Bear−5.1%−12.9%
PNWPinnacle West CapitalVertically Integrated Utilities🟢 Cont. Bull−5.5%+12.7%
PORPortland General ElectricVertically Integrated Utilities🟢 Cont. Bull−5.1%+21.0%
PPLPPLTransmission & Distribution Only⚠️ Emerging Bear−2.5%−0.4%
WECWEC EnergyVertically Integrated Utilities🟢 Cont. Bull−6.2%+0.8%
XELXcel EnergyVertically Integrated Utilities🟢 Cont. Bull−2.7%+7.8%
CWENClearway EnergyWind & Solar Developers⚠️ Emerging Bear−4.1%+1.0%
BEPBrookfield Renewable PartnersDiversified Renewable Generators🟢 Cont. Bull−2.8%+26.6%
BWXTBWX TechnologiesNaval & Shipbuilding⚠️ Emerging Bear−14.3%+9.6%
CCJCamecoUranium⚠️ Emerging Bear−11.4%+15.0%
FRVOFervo EnergyEmerging & Specialized Energy🔴 Cont. Bear−19.2%−38.3%
OKLOOkloEmerging & Specialized Energy⚠️ Emerging Bear−25.1%−49.2%
SRESempraUS Electric & Gas Utilities🟢 Cont. Bull−4.7%+9.0%
PCGPG&EVertically Integrated Utilities🟢 Cont. Bull+3.3%+16.4%

12-month price & trend

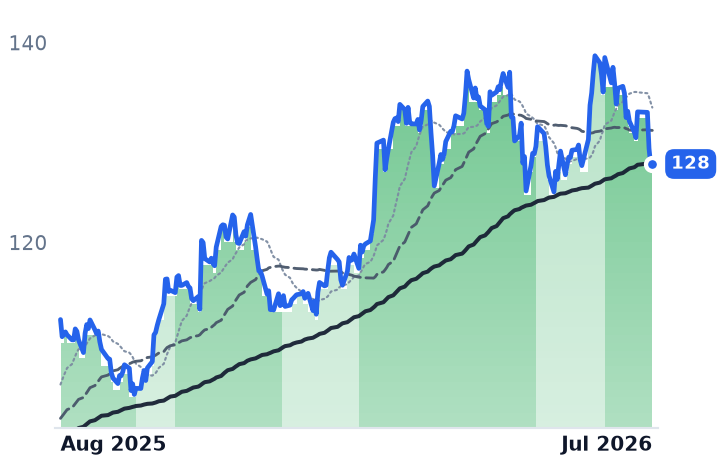
AEP
American Electric Power
128
+0.07 (+0.05%)
vs. prior close
Price20d50d150d
AEP 12-month price
Vertically Integrated Utilities
D
Dominion Energy
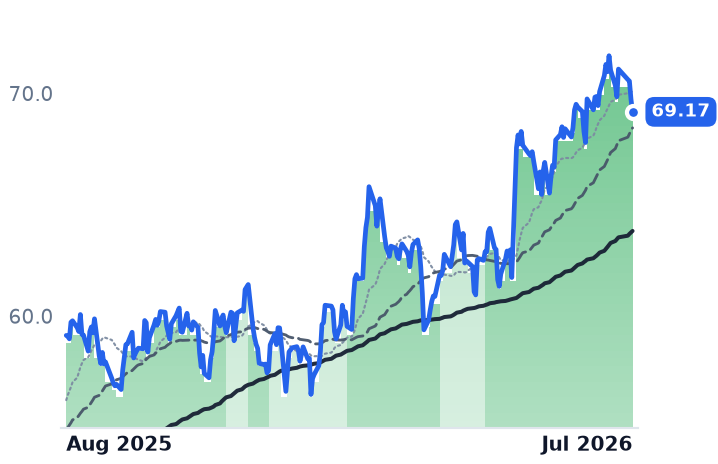
69.17
−0.56 (−0.80%)
vs. prior close
Price20d50d150d
D 12-month price
Vertically Integrated Utilities
ETR
Entergy
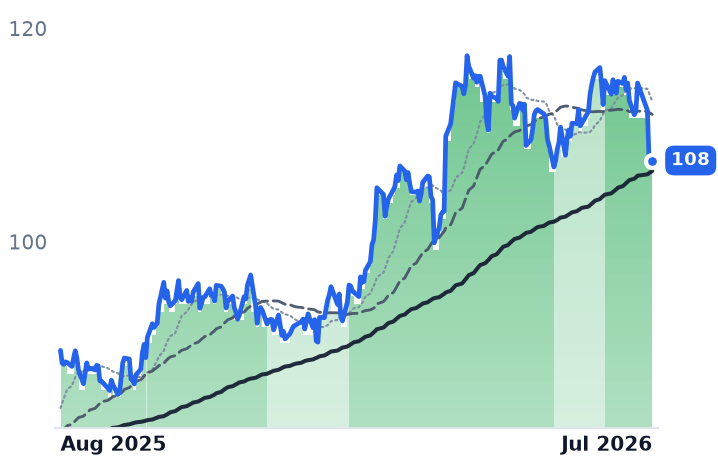
108
−0.41 (−0.38%)
vs. prior close
Price20d50d150d
ETR 12-month price
Vertically Integrated Utilities
TickerMkt capP/EP/E fwdP/SP/S fwdP/GPP/GP fwdEV/EBITDAFCF yld
AEP$68.1B18.6x19.7x3.1x2.9x7.7x7.2x13.7x9.1%
D$54.3B18.2x17.2x3.1x3.0x6.3x6.1x13.3x-13.6%
ETR$49.9B27.6x24.8x3.8x3.6x9.8x9.3x13.6x-6.0%
NEE
NextEra Energy
86.92
−1.01 (−1.15%)
vs. prior close
Price20d50d150d
NEE 12-month price
Vertically Integrated Utilities
DUK
Duke Energy
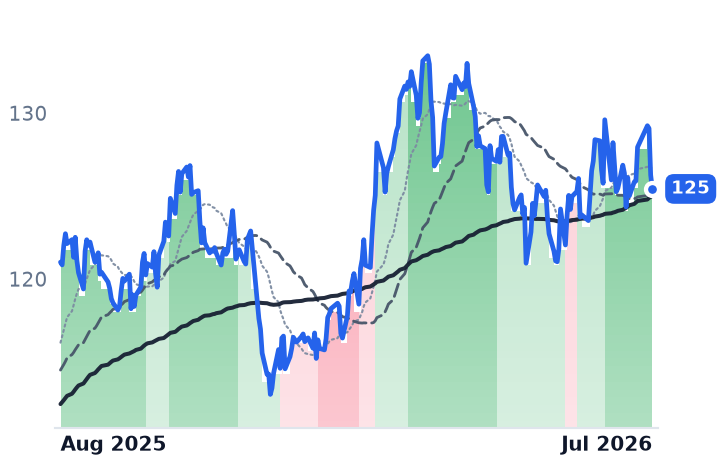
125
−0.84 (−0.67%)
vs. prior close
Price20d50d150d
DUK 12-month price
Vertically Integrated Utilities
SO
The Southern
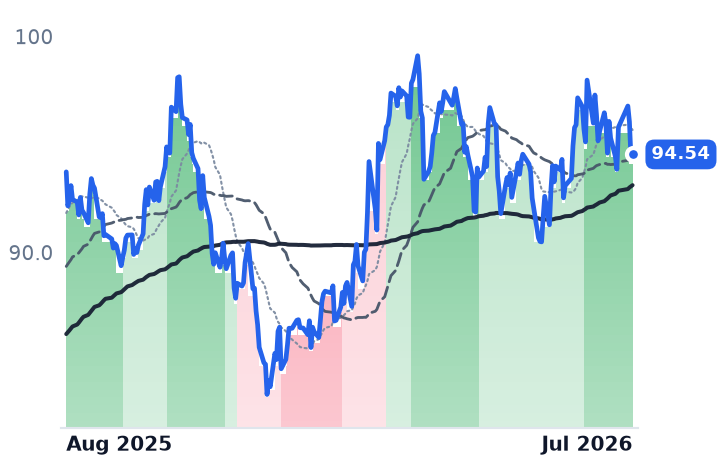
94.54
+0.20 (+0.21%)
vs. prior close
Price20d50d150d
SO 12-month price
Vertically Integrated Utilities
TickerMkt capP/EP/E fwdP/SP/S fwdP/GPP/GP fwdEV/EBITDAFCF yld
NEE$194.7B23.8x23.1x6.9x6.3x10.2x9.4x17.3x1.2%
DUK$94.3B18.3x18.1x2.8x2.8x4.1x4.1x11.5x7.0%
SO$104.3B23.8x20.2x3.5x3.4x8.1x7.8x12.4x-3.7%
AEE
Ameren
110
+1.14 (+1.05%)
vs. prior close
Price20d50d150d
AEE 12-month price
Vertically Integrated Utilities
ATO
Atmos Energy
173
−1.48 (−0.85%)
vs. prior close
Price20d50d150d
ATO 12-month price
Natural Gas Distribution
AVA
Avista
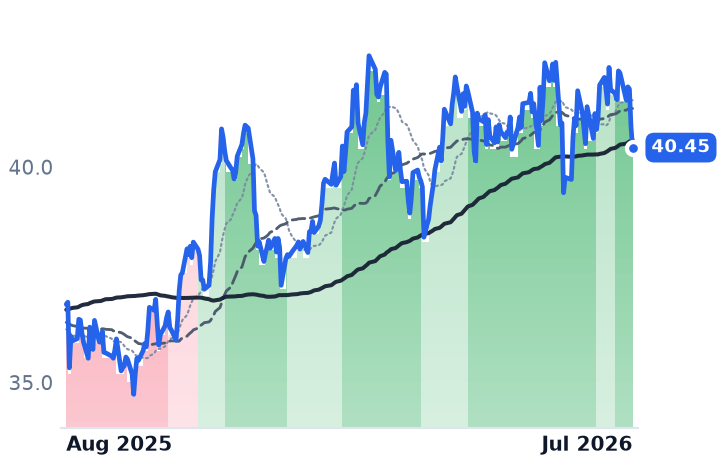
40.45
−0.49 (−1.20%)
vs. prior close
Price20d50d150d
AVA 12-month price
US Electric & Gas Utilities
TickerMkt capP/EP/E fwdP/SP/S fwdP/GPP/GP fwdEV/EBITDAFCF yld
AEE$29.4B19.3x19.8x3.3x3.2x6.4x6.2x7.8x-4.4%
ATO$29.5B21.8x21.1x6.0x5.6x9.8x9.2x15.3x-6.8%
AVA$3.3B16.2x15.5x1.7x1.7x3.0x3.0x9.9x12.5%
CMS
CMS Energy
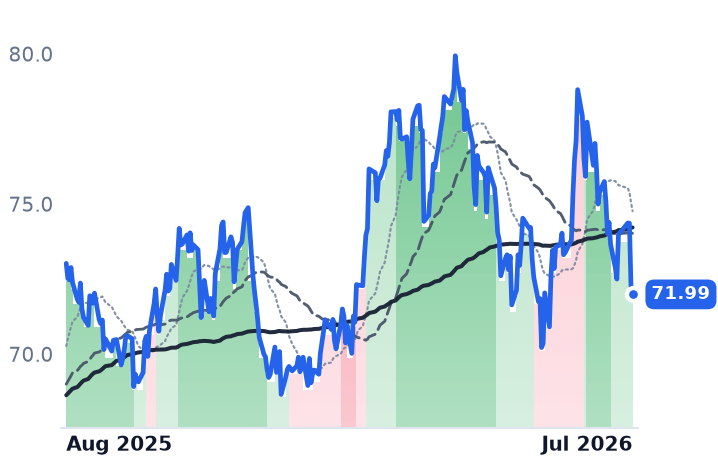
71.99
−0.27 (−0.37%)
vs. prior close
Price20d50d150d
CMS 12-month price
Vertically Integrated Utilities
CNP
CenterPoint Energy
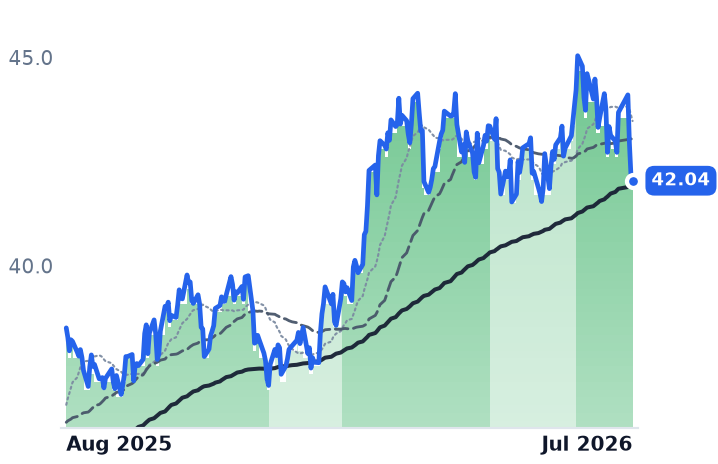
42.04
−0.11 (−0.26%)
vs. prior close
Price20d50d150d
CNP 12-month price
US Electric & Gas Utilities
DTE
DTE Energy
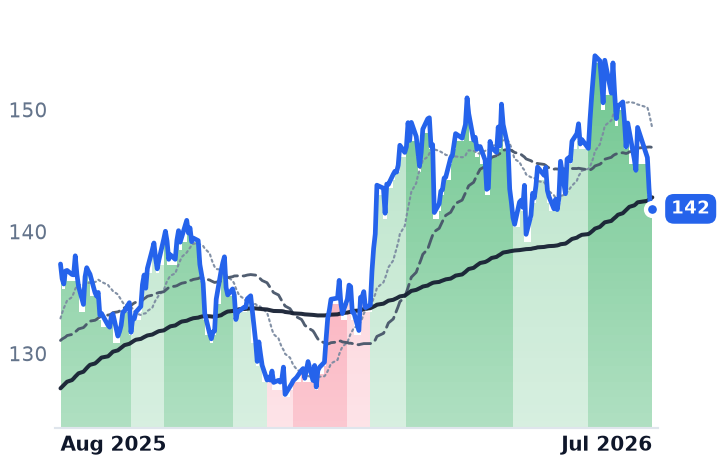
142
+0.17 (+0.12%)
vs. prior close
Price20d50d150d
DTE 12-month price
Vertically Integrated Utilities
TickerMkt capP/EP/E fwdP/SP/S fwdP/GPP/GP fwdEV/EBITDAFCF yld
CMS$22.1B19.5x18.4x2.5x2.5x3.9x3.9x12.7x-9.2%
CNP$27.2B25.3x21.8x2.9x2.7x5.4x5.0x13.5x-9.8%
DTE$29.1B22.9x18.1x1.8x1.8x4.6x4.6x13.7x-5.1%
ED
Consolidated Edison
109
−0.81 (−0.74%)
vs. prior close
Price20d50d150d
ED 12-month price
Vertically Integrated Utilities
EIX
Edison International
73.37
−5.36 (−6.81%)
vs. prior close
Price20d50d150d
EIX 12-month price
Regional/International Utilities
ES
Eversource Energy
71.59
−2.25 (−3.05%)
vs. prior close
Price20d50d150d
ES 12-month price
Vertically Integrated Utilities
TickerMkt capP/EP/E fwdP/SP/S fwdP/GPP/GP fwdEV/EBITDAFCF yld
ED$38.8B17.7x17.3x2.3x2.2x3.5x3.4x9.4x7.2%
EIX$26.6B7.2x11.3x1.4x1.4x3.7x3.7x9.3x-2.4%
ES$25.3B14.4x14.4x1.8x1.9x4.5x4.8x10.2x0.9%
FE
FirstEnergy
48.31
−0.40 (−0.82%)
vs. prior close
Price20d50d150d
FE 12-month price
Vertically Integrated Utilities
IDA
IDACORP
143
+1.01 (+0.71%)
vs. prior close
Price20d50d150d
IDA 12-month price
Vertically Integrated Utilities
LNT
Alliant Energy
70.78
−0.29 (−0.40%)
vs. prior close
Price20d50d150d
LNT 12-month price
Vertically Integrated Utilities
TickerMkt capP/EP/E fwdP/SP/S fwdP/GPP/GP fwdEV/EBITDAFCF yld
FE$25.3B23.8x16.0x1.6x1.6x3.0x3.0x12.0x7.1%
IDA$7.8B23.2x21.9x4.4x3.9x21.8x19.3x16.1x-10.3%
LNT$18.3B22.2x20.7x4.1x4.2x10.8x11.1x15.1x-5.6%
NI
NiSource
44.43
−0.64 (−1.42%)
vs. prior close
Price20d50d150d
NI 12-month price
Natural Gas Distribution
PEG
Public Service Enterprise Group Incorporated
76.68
−0.87 (−1.12%)
vs. prior close
Price20d50d150d
PEG 12-month price
Vertically Integrated Utilities
PNW
Pinnacle West Capital
101
−0.33 (−0.33%)
vs. prior close
Price20d50d150d
PNW 12-month price
Vertically Integrated Utilities
TickerMkt capP/EP/E fwdP/SP/S fwdP/GPP/GP fwdEV/EBITDAFCF yld
NI$22.2B23.1x22.5x3.3x3.2x6.5x6.3x12.5x-3.7%
PEG$38.1B16.9x17.5x3.0x3.1x3.5x3.6x11.2x-0.2%
PNW$11.9B18.3x20.8x2.2x2.1x5.4x5.2x12.4x-8.3%
POR
Portland General Electric
49.33
−0.76 (−1.52%)
vs. prior close
Price20d50d150d
POR 12-month price
Vertically Integrated Utilities
PPL
PPL
35.21
−0.35 (−0.98%)
vs. prior close
Price20d50d150d
PPL 12-month price
Transmission & Distribution Only
WEC
WEC Energy
109
−0.63 (−0.57%)
vs. prior close
Price20d50d150d
WEC 12-month price
Vertically Integrated Utilities
TickerMkt capP/EP/E fwdP/SP/S fwdP/GPP/GP fwdEV/EBITDAFCF yld
POR$5.5B20.8x13.9x1.6x1.5x3.3x3.1x9.2x1.2%
PPL$26.2B21.5x17.9x2.8x2.7x8.0x7.7x12.0x-6.2%
WEC$35.6B21.7x19.5x3.5x3.5x6.3x6.3x14.3x-3.1%
XEL
Xcel Energy
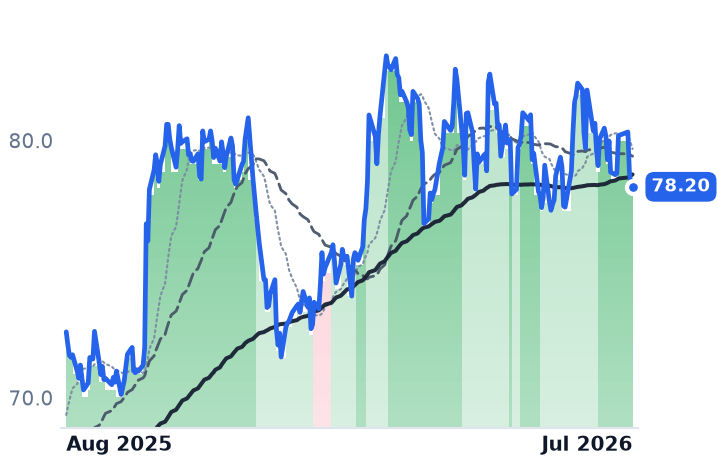
78.20
−0.03 (−0.04%)
vs. prior close
Price20d50d150d
XEL 12-month price
Vertically Integrated Utilities
CWEN
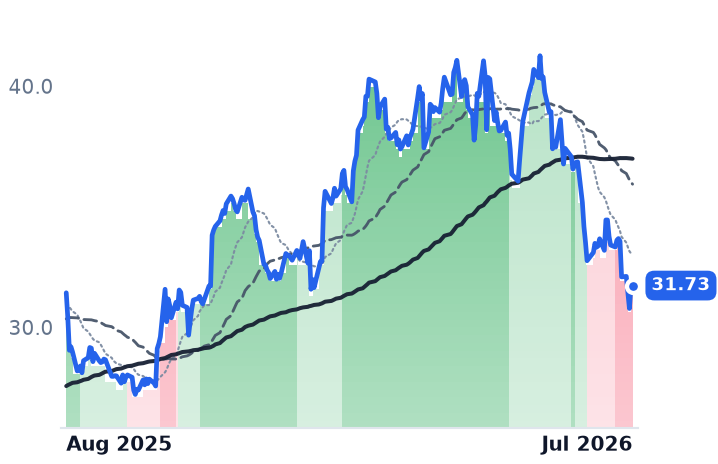
Clearway Energy
31.73
+0.00 (+0.00%)
vs. prior close
Price20d50d150d
CWEN 12-month price
Wind & Solar Developers
BEP
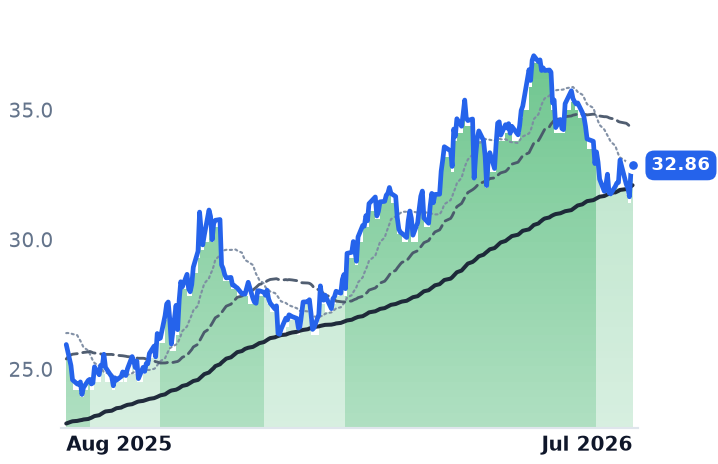
Brookfield Renewable Partners
32.86
+0.20 (+0.61%)
vs. prior close
Price20d50d150d
BEP 12-month price
Diversified Renewable Generators
TickerMkt capP/EP/E fwdP/SP/S fwdP/GPP/GP fwdEV/EBITDAFCF yld
XEL$48.6B23.3x19.0x3.3x3.1x17.5x16.4x13.9x-6.7%
CWEN$6.5B793.3x4.4x3.9x8.6x7.6x14.3x9.0%
BEP$10.5B54.3x1.7x1.5x7.0x6.1x9.6x-48.1%
BWXT
BWX Technologies
169
+3.11 (+1.88%)
vs. prior close
Price20d50d150d
BWXT 12-month price
Naval & Shipbuilding
CCJ
Cameco
86.38
−1.85 (−2.10%)
vs. prior close
Price20d50d150d
CCJ 12-month price
Uranium
FRVO
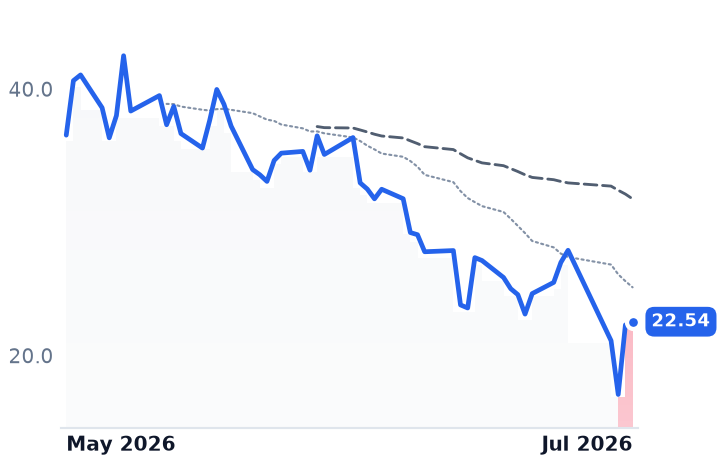
Fervo Energy
22.54
+0.24 (+1.08%)
vs. prior close
Price20d50d150d
FRVO 12-month price
Emerging & Specialized Energy
TickerMkt capP/EP/E fwdP/SP/S fwdP/GPP/GP fwdEV/EBITDAFCF yld
BWXT$15.5B44.7x35.8x4.6x4.1x20.9x18.6x29.8x2.1%
CCJ$37.6B148.0x52.9x15.2x10.7x55.1x38.8x61.0x1.0%
FRVO$8.4B
OKLO
Oklo
38.83
−2.26 (−5.50%)
vs. prior close
Price20d50d150d
OKLO 12-month price
Emerging & Specialized Energy
SRE
Sempra
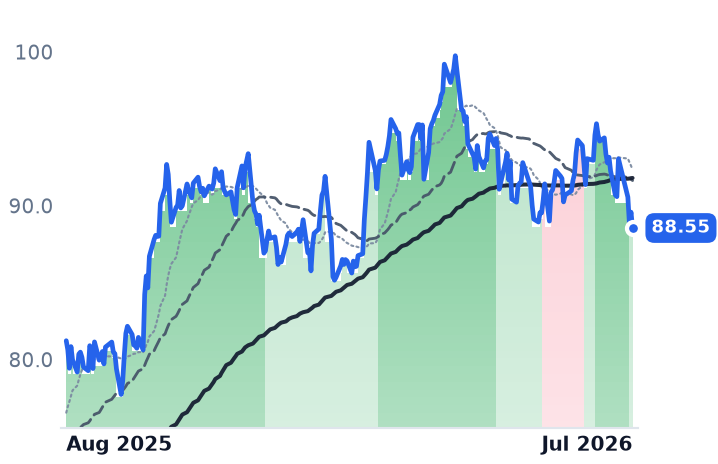
88.55
−1.03 (−1.15%)
vs. prior close
Price20d50d150d
SRE 12-month price
US Electric & Gas Utilities
PCG
PG&E
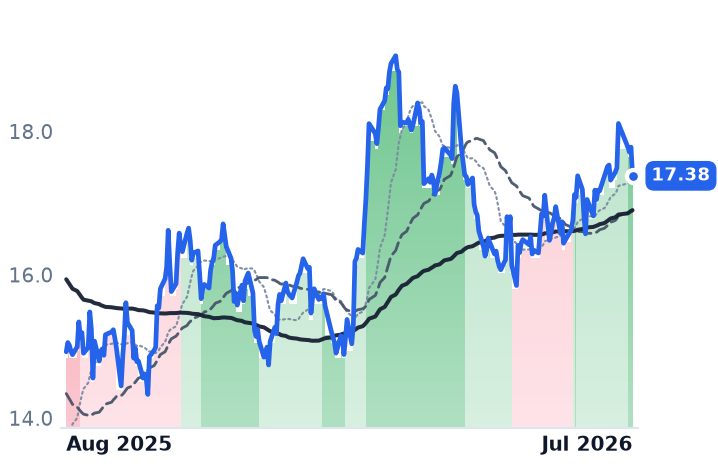
17.38
−0.40 (−2.25%)
vs. prior close
Price20d50d150d
PCG 12-month price
Vertically Integrated Utilities
TickerMkt capP/EP/E fwdP/SP/S fwdP/GPP/GP fwdEV/EBITDAFCF yld
OKLO$6.8Bn/mn/mn/mn/m-2.3%
SRE$59.1B28.6x17.7x4.3x4.2x13.2x12.9x15.4x-9.9%
PCG$35.5B12.0x9.8x1.4x1.3x3.0x2.8x9.2x-11.9%

Valuation & fundamentals

Consensus projections

TickerFY2026EFY2027EFY2028E
AEPRevenue+9.1%+5.8%+7.5%
EPS+7.4%+7.9%+10.5%
DRevenue+12.2%+6.0%+5.3%
EPS+5.1%+6.2%+6.3%
ETRRevenue+8.5%+8.8%+9.5%
EPS+12.2%+14.5%+13.7%
NEERevenue+9.0%+9.3%+8.6%
EPS+9.4%+8.8%+8.4%
DUKRevenue+4.6%+4.2%+4.3%
EPS+6.2%+7.0%+6.8%
SORevenue+8.3%+5.3%+6.3%
EPS+6.7%+7.7%+9.0%
AEERevenue+6.3%+6.0%+6.2%
EPS+7.0%+8.0%+8.4%
ATORevenue+9.3%+6.8%+8.7%
EPS+13.0%+6.6%+8.4%
AVARevenue+2.4%+3.5%+3.5%
EPS+3.8%+7.7%+4.4%
CMSRevenue+9.4%+4.1%+5.3%
EPS+8.1%+7.5%+7.9%
CNPRevenue+9.3%+4.7%+5.0%
EPS+8.3%+9.1%+8.8%
DTERevenue+13.4%+2.6%+2.8%
EPS+6.6%+8.0%+8.4%
EDRevenue+6.9%+4.2%+3.9%
EPS+7.3%+6.2%+6.5%
EIXRevenue+2.0%+4.5%+3.3%
EPS+0.6%+6.4%+6.3%
ESRevenue+4.6%+3.5%+6.6%
EPS−1.4%+5.6%+6.2%
FERevenue+8.0%+5.1%+4.9%
EPS+7.2%+7.8%+7.9%
IDARevenue+3.1%+8.4%+9.5%
EPS+9.2%+8.9%+9.5%
LNTRevenue+6.8%+4.3%+6.3%
EPS+6.5%+7.7%+9.4%
NIRevenue+13.1%+5.5%+6.5%
EPS+9.2%+8.8%+8.8%
PEGRevenue+4.1%+4.0%+4.3%
EPS+8.3%+7.4%+7.2%
PNWRevenue+4.2%+7.2%+5.9%
EPS−4.9%+17.3%+9.8%
PORRevenue+5.8%+6.8%+5.2%
EPS+8.0%+5.1%+5.7%
PPLRevenue+10.6%+5.4%+5.6%
EPS+7.8%+8.6%+8.3%
WECRevenue+8.0%+5.0%+7.5%
EPS+6.6%+7.2%+8.2%
XELRevenue+7.8%+8.9%+8.1%
EPS+8.0%+10.4%+10.1%
CWENRevenue+17.0%+11.6%+12.6%
EPS−164.1%−148.8%+63.8%
BEPRevenue+8.3%+11.0%+0.9%
EPS+22.8%−18.4%−12.6%
BWXTRevenue+19.7%+9.4%+7.5%
EPS+23.2%+11.1%+11.2%
CCJRevenue+2.8%+10.7%+9.4%
EPS+13.8%+62.5%+20.5%
OKLORevenue+359.5%+731.8%
EPS+20.1%+13.8%+10.2%
SRERevenue−0.8%−2.2%+2.0%
EPS+11.6%+8.1%+8.5%
PCGRevenue+4.0%+3.3%+3.7%
EPS+9.6%+9.4%+9.3%

Forward fiscal years only. Blank means no analyst coverage for that year.

American Electric Power (AEP), the Ohio-based transmission and generation utility that owns 90% of the country's 765kV high-voltage grid, Dominion Energy, the Virginia utility serving the world's densest data-center corridor, and peers Entergy, Duke Energy, Southern Company and NextEra Energy have carried the regulated utilities segment to a broad, not concentrated, gain: mean one-year return across all 25 vertically integrated utility names is +8.7%, with 21 of 25 positive. The strongest legs are Edison International (wildfire-liability recovery, +38%) alongside data-center-exposed names NextEra (+23.5%), Entergy (+20%), Portland General (+19%), IDACORP (+14.9%) and Dominion (+14.5%); the weak tail is Public Service Enterprise Group (-13.8%) and CenterPoint Energy (-2.8%). Twelve of the 25 currently sit in a sustained uptrend and none in a sustained downtrend — a sharp contrast with the adjacent merchant, nuclear and yieldco complex, where Clearway Energy, BWX Technologies, Cameco and Fervo Energy have all rolled into confirmed downtrends. No band contagion from that breakdown has reached the regulated cohort so far.

The business case is real

Capex and rate-base guidance have moved up, not down. AEP raised its five-year capital plan from $72B to $78B on contracted data-center load that has doubled to 63 gigawatts, implying better than 9% long-term earnings-per-share (EPS) growth. Entergy's plan grew from $43B to $57B after signing a Meta data-center agreement in Louisiana, where regulators approved three new gas plants plus transmission to serve it, per The Center Square; Entergy now guides to 12%+ EPS growth into 2030. Dominion's 50-gigawatt pipeline, anchored by Virginia's "Data Center Alley," backs a $65B five-year plan, and Duke Energy reaffirmed 2026 EPS guidance of $6.55-$6.80 alongside a $103B five-year capital plan and 7.6 gigawatts of signed AI contracts, according to ad-hoc-news.de. Regulators have also begun shifting stranded-cost risk toward the data centers themselves: Virginia's utility regulator approved a new Dominion tariff class requiring 14-year take-or-pay contracts from large users starting 2027, even as it capped Dominion's authorized return on equity at 9.8% instead of the requested 10.4%, per Inside Climate News. AEP Ohio's tariff carries an 85% take-or-pay demand floor, per Utility Dive, though manufacturers still dispute AEP's underlying load forecast.

But the price already reflects it

Trailing price-to-earnings ratios across the core names run from 19.8x (Duke) and 20.5x (AEP, Dominion) to 22.5x (NextEra), 24.8x (Southern) and 29.6x (Entergy) — all above the sector's own 25-year forward-multiple median near 16.8x and the roughly 18.2x estimate on 2026 sector earnings, per stockanalysis.com. Growth is confirming the rally, but the multiple has moved further, placing most of the cohort in what reads as a stretched advance rather than cheap compounding. The past 30 days show a uniform, sector-wide de-rating — all 25 members fell, averaging roughly -5% — that lines up with the 10-year Treasury yield's climb toward 4.74% by July 31, per CNBC, plus mounting political pressure over electricity bills that Utility Dive and Fitch describe as a deteriorating backdrop for cost recovery, per Utility Dive. An unresolved Federal Energy Regulatory Commission (FERC) show-cause process on large-load interconnection rules closes around mid-August, and Sightline Climate estimates up to half of the announced 2026 data-center pipeline may not materialize — both live risks to the load forecasts underpinning current capex plans, per The Center Square.

The setup

Where it stands — Regulated utilities are decoupling from the merchant/nuclear power breakdown, with real capex and EPS upgrades but trailing multiples above the sector's long-run median. Would confirm — Signed data-center megawatts convert to realized load growth in coming IRP updates without material cancellations. Would invalidate — Strongly bullish-band names roll into mild or strongly bearish as merchant-complex contagion spreads, or FERC's August ruling shifts stranded-cost risk back to utilities. Watch next — FERC's large-load interconnection show-cause deadline, due mid-August 2026. Valuation — Core names trade 19.8x-29.6x trailing earnings versus a 25-year sector median near 16.8x forward.

Design Backlogs Hit Records as AECOM, Stantec, WSP Shares Fall on Valuation Reset

Hypothesis Opus 5 · Research Sonnet 5 · Writing Sonnet 5 · Prompt v1.1

AECOM, Stantec and WSP Global posted record backlogs and raised or reaffirmed double-digit guidance in their most recent quarters, yet their shares fell 35-39% over the year as trailing multiples compressed to multi-year lows — while the construction cohort executing the same AI-power buildout re-rated to 45-106x trailing earnings. MYR Group, an electrical contractor grouped in the same watchlist bucket, decoupled entirely and trended with the constructors instead.
ACMTTEKSTNWSP.TOMYRGUTIWSCSTRLPWRMTZDYAGXPSN
TickerCompanySegmentTrend30D1Y
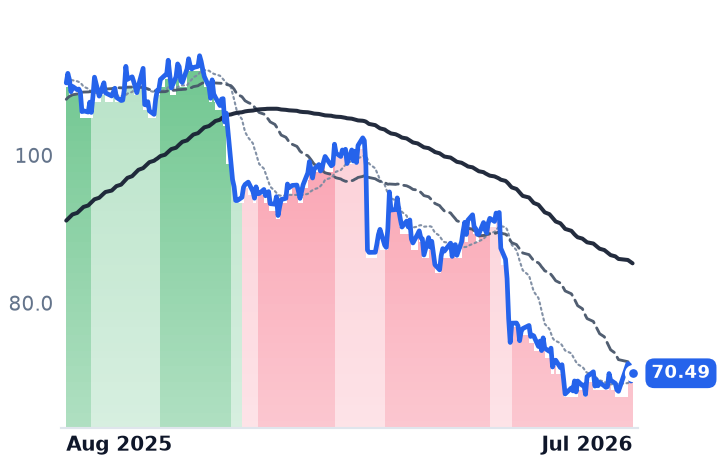
ACMAecomDesign & Engineering Consulting🔴 Cont. Bear+4.0%−34.8%
TTEKTetra TechDesign & Engineering Consulting⚠️ Emerging Bear+6.5%−8.8%
STNStantecDesign & Engineering Consulting🔴 Cont. Bear−0.3%−35.8%
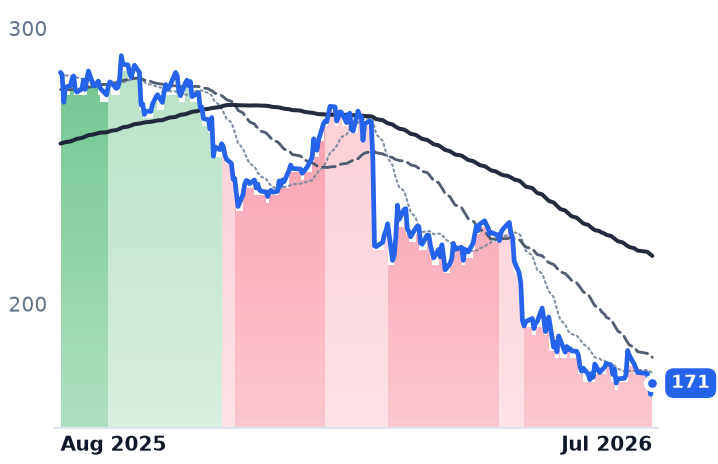
WSP.TOWSP GlobalEngineering & Construction🔴 Cont. Bear−4.0%−39.7%
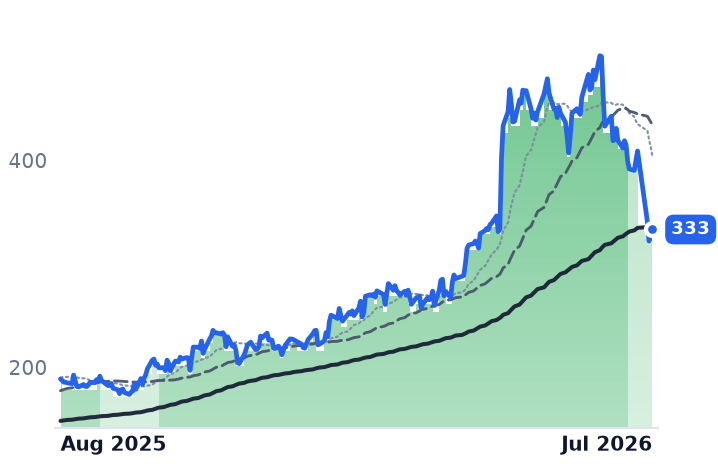
MYRGMYRElectrical & Power Infrastructure🟢 Cont. Bull−24.7%+76.6%
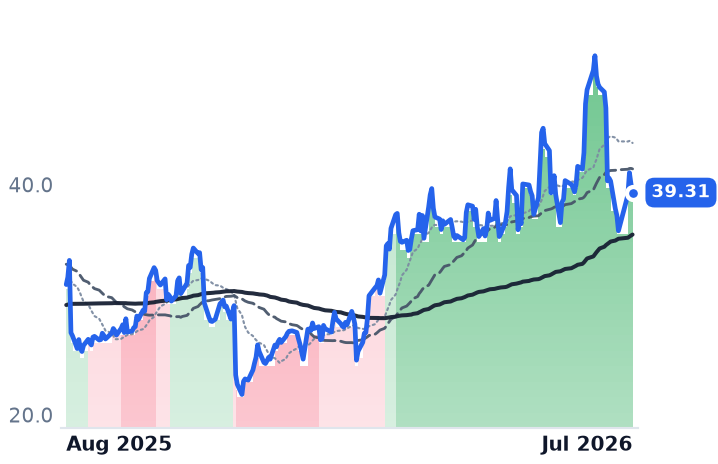
UTIUniversal Technical InstituteCareer & Technical Training🌱 Emerging Bull−21.3%+25.5%
WSCWillScotModular & Portable Storage🌱 Emerging Bull−8.4%−2.3%
STRLSterling InfrastructureInfrastructure & Civil Construction🟢 Cont. Bull−16.8%+119.6%
PWRQuanta ServicesElectrical & Power Infrastructure🟢 Cont. Bull−1.0%+69.7%
MTZMasTecElectrical & Power Infrastructure🟢 Cont. Bull−30.9%+47.9%
DYDycom IndustriesElectrical & Power Infrastructure🟢 Cont. Bull−6.9%+51.4%
AGXArganEnergy & Power Project Solutions🟢 Cont. Bull−21.3%+156.3%
PSNParsonsTesting, Detection & Measurement⚠️ Emerging Bear−23.0%−40.7%

12-month price & trend

ACM
Aecom
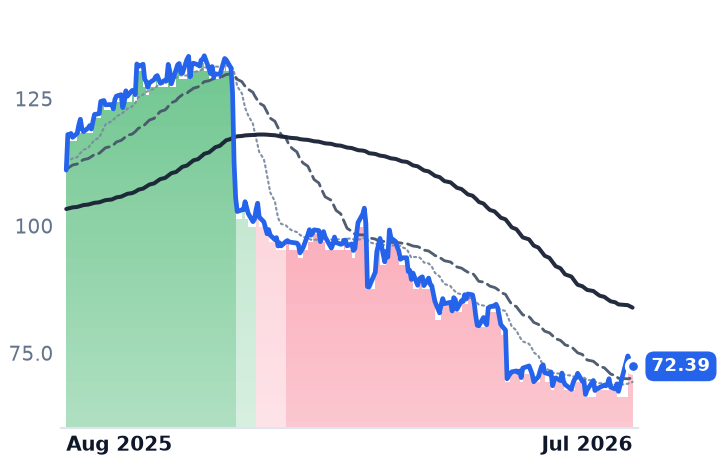
72.39
+0.63 (+0.88%)
vs. prior close
Price20d50d150d
ACM 12-month price
Design & Engineering Consulting
TTEK
Tetra Tech
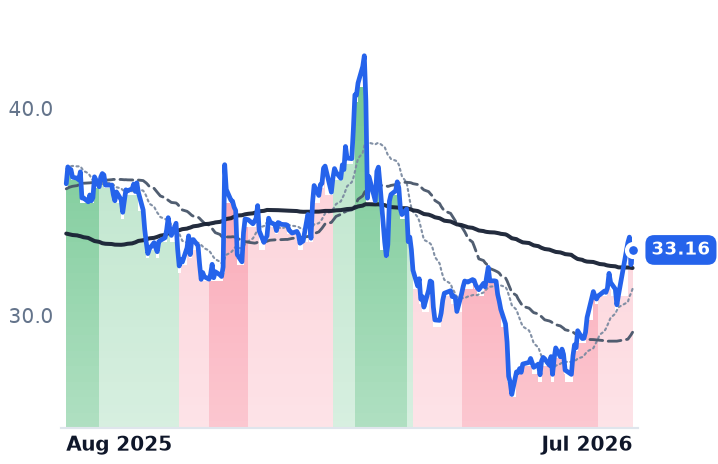
33.16
+0.71 (+2.19%)
vs. prior close
Price20d50d150d
TTEK 12-month price
Design & Engineering Consulting
STN
Stantec
70.49
+1.05 (+1.51%)
vs. prior close
Price20d50d150d
STN 12-month price
Design & Engineering Consulting
TickerMkt capP/EP/E fwdP/SP/S fwdP/GPP/GP fwdEV/EBITDAFCF yld
ACM$9.3B17.2x12.2x0.6x1.2x7.8x15.5x9.3x4.4%
TTEK$8.6B19.9x21.1x1.7x2.0x9.1x10.7x14.1x6.4%
STN$8.0B23.0x16.0x1.4x1.1x3.3x2.6x12.4x6.0%
WSP.TO
WSP Global
171
+4.11 (+2.46%)
vs. prior close
Price20d50d150d
WSP.TO 12-month price
Engineering & Construction
MYRG
MYR
333
+2.38 (+0.72%)
vs. prior close
Price20d50d150d
MYRG 12-month price
Electrical & Power Infrastructure
UTI
Universal Technical Institute
39.31
−0.75 (−1.87%)
vs. prior close
Price20d50d150d
UTI 12-month price
Career & Technical Training
TickerMkt capP/EP/E fwdP/SP/S fwdP/GPP/GP fwdEV/EBITDAFCF yld
WSP.TO$23.1B23.3x14.9x1.3x1.4x7.5x8.1x13.3x7.5%
MYRG$5.2B31.3x28.3x1.3x1.2x10.5x9.7x18.4x4.3%
UTI$2.2B49.9x50.3x2.5x2.4x5.1x4.9x21.4x0.1%
WSC
WillScot
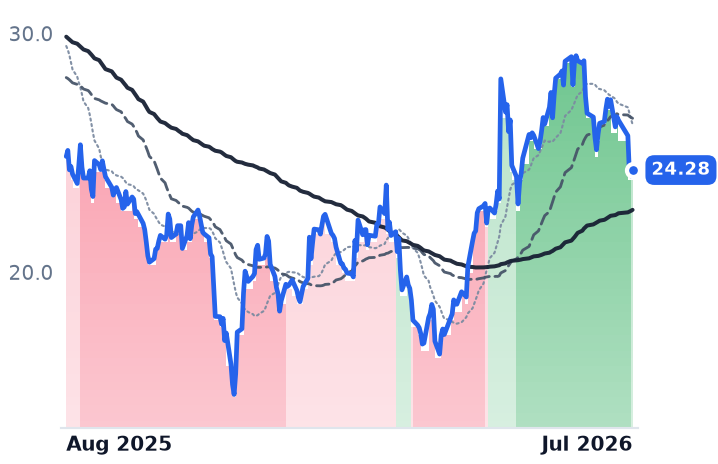
24.28
+0.25 (+1.04%)
vs. prior close
Price20d50d150d
WSC 12-month price
Modular & Portable Storage
STRL
Sterling Infrastructure
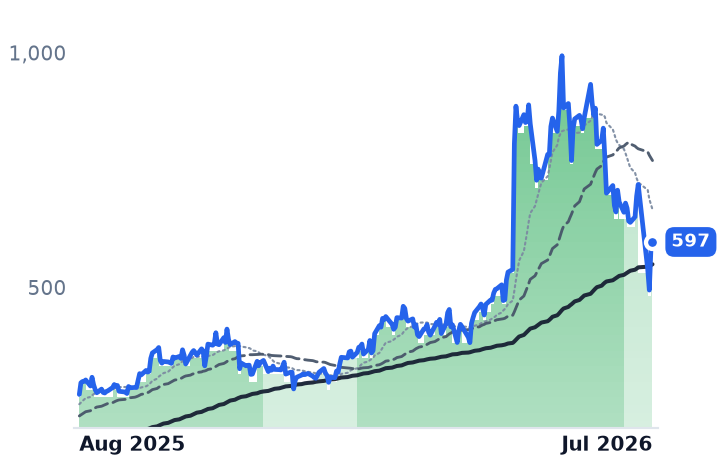
597
+16.04 (+2.76%)
vs. prior close
Price20d50d150d
STRL 12-month price
Infrastructure & Civil Construction
PWR
Quanta Services
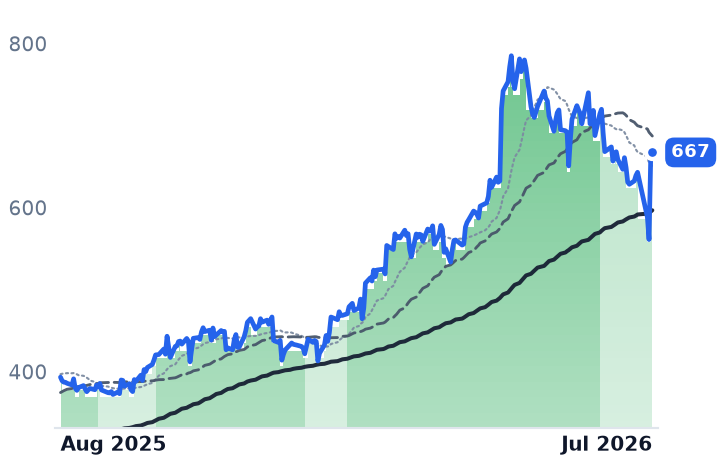
667
+9.38 (+1.43%)
vs. prior close
Price20d50d150d
PWR 12-month price
Electrical & Power Infrastructure
TickerMkt capP/EP/E fwdP/SP/S fwdP/GPP/GP fwdEV/EBITDAFCF yld
WSC$4.4Bn/m22.3x1.9x1.9x3.9x3.9x17.0x13.2%
STRL$18.3B52.7x31.6x6.3x4.9x27.1x21.0x30.8x2.4%
PWR$100.3B75.5x42.9x3.1x2.7x21.5x18.7x35.1x2.4%
MTZ
MasTec
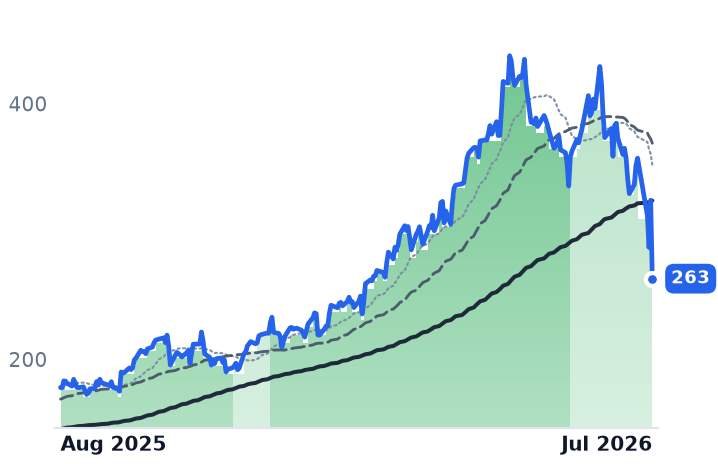
263
−61.34 (−18.91%)
vs. prior close
Price20d50d150d
MTZ 12-month price
Electrical & Power Infrastructure
DY
Dycom Industries
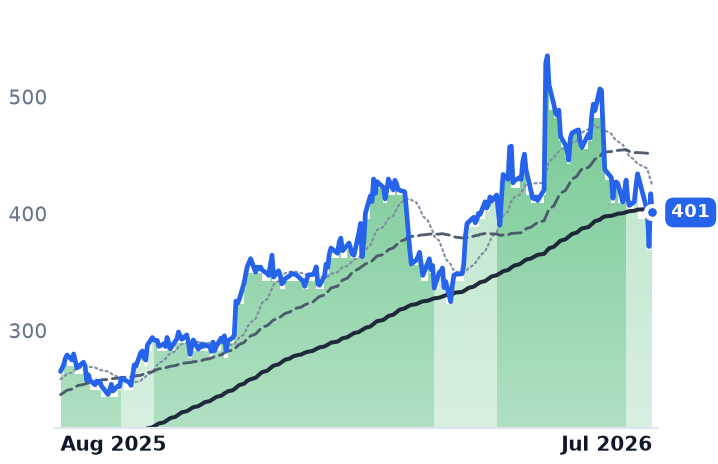
401
−16.08 (−3.85%)
vs. prior close
Price20d50d150d
DY 12-month price
Electrical & Power Infrastructure
AGX
Argan
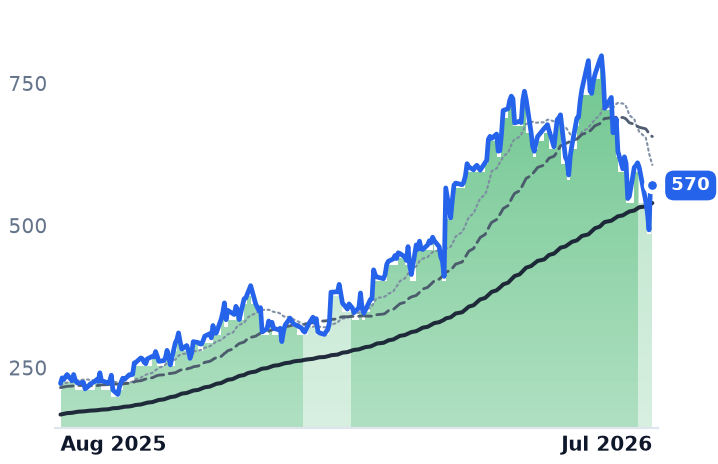
570
−9.44 (−1.63%)
vs. prior close
Price20d50d150d
AGX 12-month price
Energy & Power Project Solutions
TickerMkt capP/EP/E fwdP/SP/S fwdP/GPP/GP fwdEV/EBITDAFCF yld
MTZ$21.1B41.4x28.6x1.3x1.2x11.3x10.5x21.9x1.2%
DY$12.0B37.8x24.2x1.9x1.6x9.7x8.2x13.6x3.7%
AGX$8.0B49.0x47.2x7.7x6.2x36.8x29.6x40.7x6.1%
PSN
Parsons
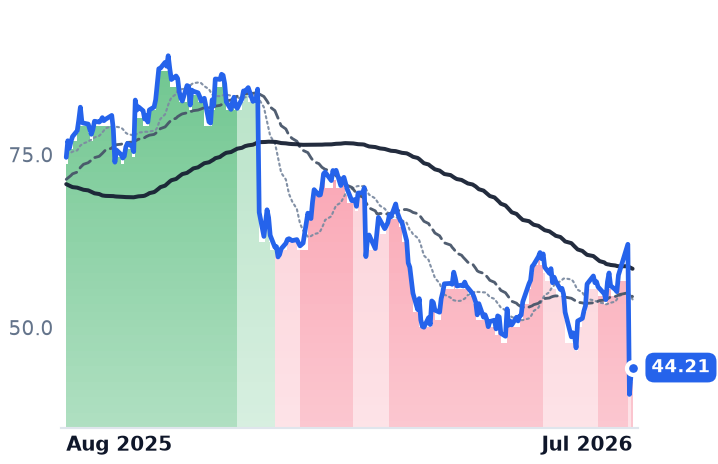
44.21
+1.04 (+2.41%)
vs. prior close
Price20d50d150d
PSN 12-month price
Testing, Detection & Measurement
TickerMkt capP/EP/E fwdP/SP/S fwdP/GPP/GP fwdEV/EBITDAFCF yld
PSN$5.4B23.7x15.1x0.9x0.8x4.0x3.5x13.0x7.7%

Valuation & fundamentals

Consensus projections

TickerFY2026EFY2027EFY2028E
ACMRevenue+4.5%+6.1%+4.2%
EPS+13.7%+12.8%+13.4%
TTEKRevenue−3.7%+4.3%+2.0%
EPS+3.8%+10.1%+11.7%
STNRevenue+10.4%+5.8%+7.3%
EPS+14.5%+11.1%+22.0%
WSP.TORevenue+18.9%+7.5%+6.9%
EPS+19.5%+14.6%+13.8%
MYRGRevenue+19.4%+14.0%+9.1%
EPS+66.3%+18.1%+22.2%
UTIRevenue+9.4%+9.0%+9.3%
EPS−26.2%+9.5%+58.5%
WSCRevenue−0.0%+3.3%+4.9%
EPS−3.3%+22.3%+34.3%
STRLRevenue+58.0%+18.5%+26.4%
EPS+82.4%+27.3%+20.2%
PWRRevenue+34.0%+15.2%+13.1%
EPS+46.4%+16.9%+17.3%
MTZRevenue+30.5%+20.3%+14.5%
EPS+43.0%+34.8%+28.0%
DYRevenue+17.1%+40.1%+11.3%
EPS+39.5%+47.1%+20.3%
AGXRevenue+12.1%+36.2%+25.4%
EPS+65.8%+44.2%+29.3%
PSNRevenue+3.3%+7.2%+5.7%
EPS+3.7%+10.7%+14.2%

Forward fiscal years only. Blank means no analyst coverage for that year.

AECOM, the global engineering and infrastructure-design consultancy, closed its latest quarter with backlog up 8% to a record $26.2 billion and a 1.2x book-to-burn ratio in its design segment — its second guidance raise of the fiscal year, to $5.90-$6.10 adjusted EPS. Yet the stock has sat in a sustained downtrend, its 50-day moving average below its 200-day, for roughly 220 consecutive trading days since December, and is down 34.8% over the past year. Stantec, the Canadian infrastructure-engineering group, and WSP Global, the Montreal-based design consultancy, show the identical pattern — both grew revenue near 9-11%, both hit record backlogs, both fell more than 35%. The construction and electrical-contracting firms that build what these engineers design — Sterling Infrastructure, a civil-construction contractor; Quanta Services (PWR), a utility-transmission contractor; MasTec (MTZ), an infrastructure builder; and Dycom (DY), a telecom-and-utility construction specialist — rose a combined 89% over the year and now trade at 45x-106x trailing earnings, well above their own historical ranges.

Growth confirms, price does not

Stantec's net revenue rose 9.1% and adjusted EPS 14.7% in its most recent quarter, with backlog up 13.2% to a record CAD 9.0 billion and management reaffirming 15%-18% EPS growth guidance; WSP's backlog reached roughly $20 billion following its TRC acquisition, with power, data-center and digital-services work growing faster than the base business. Yet financial press attributes the Stantec/WSP selloff — roughly 23-24% over six months — primarily to investor fear that generative AI will commoditize the billable-hours consulting model, not to any visible demand shortfall. AECOM's decline traces to something narrower: negative free cash flow of -$27.4 million versus +$178.4 million a year earlier, a Q1 revenue miss, and delayed project ramp-ups in the Middle East — execution noise layered on record backlog, not federal-work loss.

Two names in the same watchlist bucket decouple entirely. MYR Group, an electrical transmission-and-distribution contractor, rose 77.8% over the year on record backlog up 20% to $3.16 billion, with Q2 net income nearly doubling — it trends with the constructors because it is a self-perform contractor, not a fee-based design shop. Tetra Tech, the most federally-exposed pure consultancy, fell only 7.6% despite raising FY2026 revenue guidance on 8% growth excluding USAID/disaster-response work, even as federal budget cuts — EPA funding down roughly 54% for FY2026 — pressure state-and-local grant-funded engineering work broadly across the segment.

Parsons, a diversified infrastructure and defense-technology consultancy, is the outlier that does not fit this thesis: its 28.7% five-session collapse traces to a company-specific guidance cut — FY2026 revenue lowered to $6.2-6.5 billion and a surprise EPS loss tied to $118 million in portfolio-shaping and joint-venture charges, framed by analysts as earnings-driven rather than sector-wide — no read-through to peers, all of whom posted strong quarters in the same window.

Where the multiples sit

ACM trades near 15x trailing earnings, down from roughly 18x in May and well below its own three-year range; Stantec sits near 23x, compressed from 29x; WSP near 24x, down from a prior 32x level. Tetra Tech trades near 17.5x, far below its own flagged 30x forward level. Against that, Sterling trades near 72x-78x trailing, Quanta near 92-106x, MasTec near 74-76x — multiples expanding even as the design cohort's compressed on improving fundamentals.

The setup

Where it stands — Record backlogs and raised guidance at ACM, STN, WSP and TTEK coincide with 1-year share declines of 8-39%, while the constructor cohort executing the same buildout is up 89% at 45-106x trailing earnings. Would confirm — Design-consultancy backlog and book-to-bill continue rising for two more quarters while trailing multiples hold below five-year medians. Would invalidate — Backlog growth stalls or book-to-bill falls below 1.0x at ACM, STN or WSP in their next reported quarter. Watch next — AECOM's next fiscal-quarter results, expected around October 2026, for free-cash-flow recovery and international project ramp-up. Valuation — ACM ~15x trailing vs ~18x in May; STN ~23x vs ~29x; WSP ~24x vs ~32x prior; constructors at 45-106x trailing.
Rail Rally Broadens Past Merger Bets as CNI, CP Match Gains — Now Trades Rich

Hypothesis Opus 5 · Research Sonnet 5 · Writing Sonnet 5 · Prompt v1.1

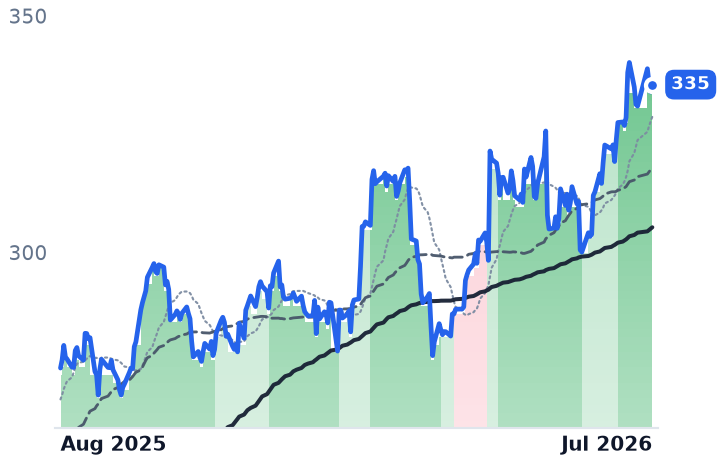
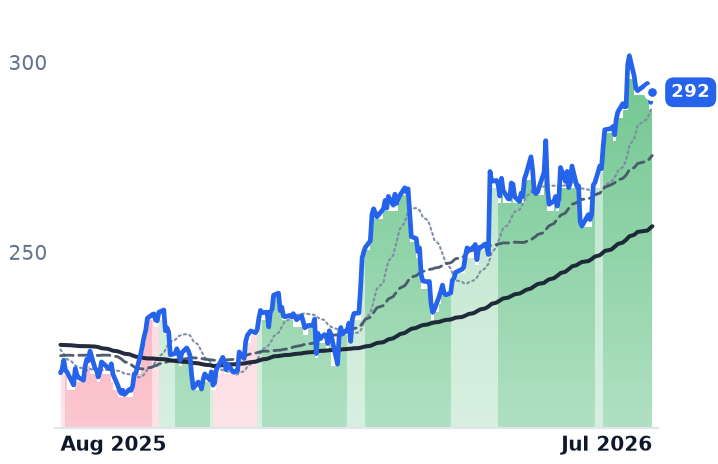
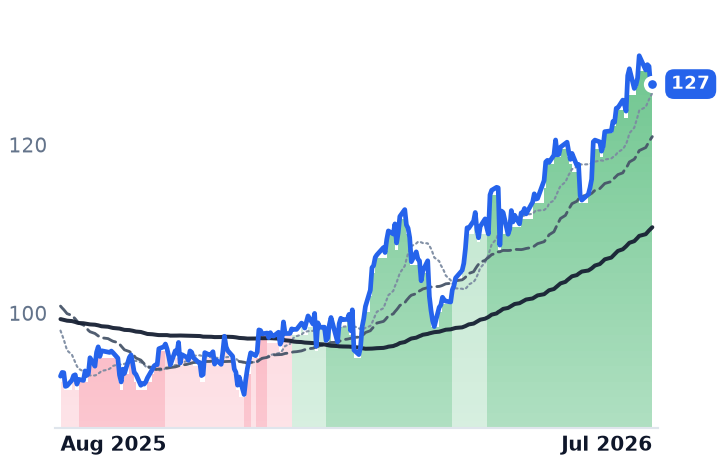
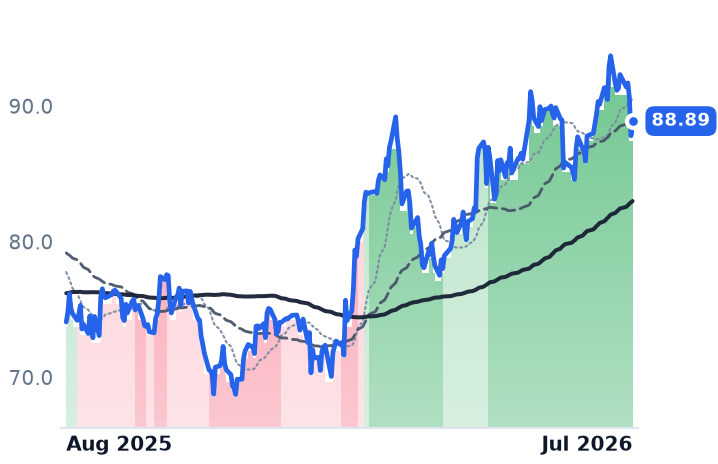
Canadian National and Canadian Pacific Kansas City, which have zero merger optionality, matched or beat the merger-linked names' 12-month gains on genuine double-digit revenue growth — but every Class I railroad's multiple now sits above its own historical median, and the Union Pacific–Norfolk Southern merger timeline has slipped to mid-2027 with Warren Buffett publicly denying BNSF interest in CSX.

CSXNSCUNPCNICP
TickerCompanySegmentTrend30D1Y
CSXCSXClass I Railroads🟢 Cont. Bull+3.3%+43.7%
NSCNorfolk SouthernClass I Railroads🟢 Cont. Bull+4.2%+21.7%
UNPUnion PacificClass I Railroads🟢 Cont. Bull+3.4%+33.8%
CNICanadian National RailwayClass I Railroads🌱 Emerging Bull+4.6%+37.5%
CPCanadian Pacific Kansas CityClass I Railroads🌱 Emerging Bull+1.0%+20.0%

12-month price & trend

CSX
CSX
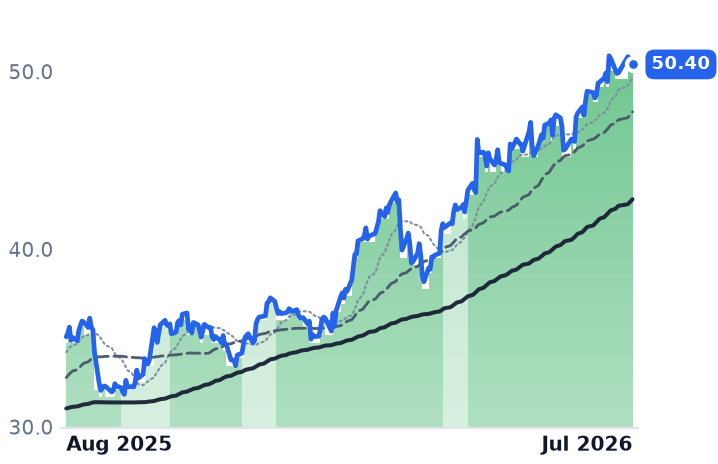
50.40
+0.21 (+0.42%)
vs. prior close
Price20d50d150d
CSX 12-month price
Class I Railroads
NSC
Norfolk Southern
335
+1.55 (+0.46%)
vs. prior close
Price20d50d150d
NSC 12-month price
Class I Railroads
UNP
Union Pacific
292
+2.67 (+0.92%)
vs. prior close
Price20d50d150d
UNP 12-month price
Class I Railroads
TickerMkt capP/EP/E fwdP/SP/S fwdP/GPP/GP fwdEV/EBITDAFCF yld
CSX$84.1B27.6x23.7x5.9x5.7x15.7x15.2x15.8x4.9%
NSC$68.5B25.7x25.1x5.6x5.4x12.4x11.9x15.3x5.6%
UNP$155.9B21.6x20.9x6.3x6.0x13.8x13.1x14.4x3.7%
CNI
Canadian National Railway
127
+0.27 (+0.21%)
vs. prior close
Price20d50d150d
CNI 12-month price
Class I Railroads
CP
Canadian Pacific Kansas City
88.89
+1.08 (+1.23%)
vs. prior close
Price20d50d150d
CP 12-month price
Class I Railroads
TickerMkt capP/EP/E fwdP/SP/S fwdP/GPP/GP fwdEV/EBITDAFCF yld
CNI$68.3B20.0x14.0x5.4x3.7x12.9x8.8x13.0x3.8%
CP$75.5B25.7x22.8x6.9x6.5x14.9x14.0x15.5x2.0%

Valuation & fundamentals

Consensus projections

TickerFY2026EFY2027EFY2028E
CSXRevenue+4.6%+4.7%+3.2%
EPS+16.6%+13.4%+8.7%
NSCRevenue+4.0%+4.4%+4.2%
EPS+1.0%+11.3%+9.5%
UNPRevenue+5.9%+4.4%+9.6%
EPS+7.7%+8.9%+9.6%
CNIRevenue+5.6%+4.1%+5.4%
EPS+6.3%+11.0%+10.1%
CPRevenue+6.4%+5.6%+7.1%
EPS+10.8%+14.9%+14.4%

Forward fiscal years only. Blank means no analyst coverage for that year.

A cohort move, not a merger trade

The five North American Class I railroads — the continent's largest long-haul freight networks — have moved together over the past year, and the pattern undercuts the tidiest version of the merger-arb story. Canadian National (CNI), Canada's largest railway with no acquisition optionality of its own, gained 36.1% over the trailing year — more than Norfolk Southern (NSC), the Eastern U.S. carrier that is the actual target of Union Pacific's pending takeover, which rose just 20.7%. Canadian Pacific Kansas City (CP), the only railroad running a single continuous line from Canada to Mexico and likewise free of deal speculation, gained 20.9%, tying NSC for the cohort's weakest return. CSX, the Eastern U.S. railroad widely discussed as a future BNSF target, led the group at 41.8%, while Union Pacific (UNP), the Western U.S. carrier and the actual acquirer in the pending merger, added 31.6%. All five gained further over just the past 30 days, between 2.6% and 7.4%, and CSX has held a continuous uptrend — its 50-day average above its 200-day — since April 17, roughly 106 days.

The growth is real

Underneath the price action, revenue is genuinely expanding. CNI's second-quarter revenue rose 11.2% year over year with an earnings beat, Gurufocus reported, though its operating ratio — the share of revenue consumed by operating costs — widened 50 basis points to 62.2% on fuel-cost pressure. CPKC's revenue rose 13% with adjusted earnings per share up 13%, the company reported, though its operating ratio also worsened 90 basis points. UNP runs an industry-leading 59.9% adjusted operating ratio, and CSX grew operating income 20% to $1.25B in the first quarter. Sector-wide freight data corroborate a genuine, if uneven, cycle: total U.S. carloads rose 3.1% and intermodal units 3.6% for the year through mid-July, even as coal carloads — a structural decliner — fell roughly 8% year over year.

But the price has moved further than the earnings

That growth has not stopped every multiple from running above its own history. CSX trades at 30.6x trailing earnings; the user's own notes flag that a P/E near 27x "already prices much of the optionality" tied to BNSF-takeout speculation. NSC's 27.9x trailing multiple compares with a standalone-justified 18-20x per the same notes — several turns of pure acquisition premium. CNI trades at roughly 24.2x trailing and 20.6x forward earnings, about 17% above its own historical median; CP sits near 27-28x trailing and 22x forward, about 19% above its own median. UNP's 24.1x trailing multiple already reflects the merger base case, per prior desk notes. The pattern holds across merger names and non-merger names alike — this is a sector re-rating, not just a deal premium.

The catalyst that could still swing it

The Surface Transportation Board accepted UP-NS's amended application on May 28, 2026, and the companies filed supplemental customer-protection commitments on July 27, 2026, but the target close has stretched from early to mid-2027. Opposition includes BNSF, 24 senators, and two rail unions, versus six unions that have signed support agreements. Separately, Buffett told CNBC that BNSF was not shopping for another railroad, knocking CSX down more than 6% even though its uptrend has otherwise held.

The setup

Where it stands — The cohort is up roughly 30% over a year on genuine revenue growth, but every name's forward multiple sits above its own historical median. Would confirm — Continued double-digit revenue growth and stable operating ratios at CNI and CP next quarter, absent any merger link. Would invalidate — STB rejection, a delay past mid-2027, or deepening carload/coal declines that outpace pricing gains. Watch next — STB evidentiary and environmental review, with a statutory decision window roughly 12 months from the May 28, 2026 acceptance. Valuation — CSX 30.6x trailing; NSC 27.9x vs a standalone-justified 18-20x; CNI 24.2x trailing/20.6x forward; CP 27-28x trailing/22x forward — all above own medians.

OTA Bounce Is an Earnings Story for Booking and Expedia, Not a Sector Turn

Hypothesis Opus 5 · Research Sonnet 5 · Writing Sonnet 5 · Prompt v1.1

The online travel agency rebound is not one story: Booking Holdings and Expedia rallied on earnings beats and raised guidance, with their trend signals now confirming the move, while MakeMyTrip actually fell over the same 30 days and Trip.com's 14% gain remains unconfirmed by its trend band amid a guided growth slowdown.

BKNGEXPEMMYTTCOM
TickerCompanySegmentTrend30D1Y
BKNGBookingOnline Travel Agencies🔴 Cont. Bear+6.6%−11.4%
EXPEExpediaOnline Travel Agencies⚠️ Emerging Bear+10.5%+60.2%
MMYTMakeMyTripOnline Travel Agencies🔴 Cont. Bear−0.7%−39.1%
TCOMTrip.comOnline Travel Agencies⚠️ Emerging Bear+14.7%−24.3%

12-month price & trend

BKNG
Booking
193
−0.34 (−0.18%)
vs. prior close
Price20d50d150d
BKNG 12-month price
Online Travel Agencies
EXPE
Expedia
295
+1.81 (+0.62%)
vs. prior close
Price20d50d150d
EXPE 12-month price
Online Travel Agencies
MMYT
MakeMyTrip
56.95
−0.13 (−0.23%)
vs. prior close
Price20d50d150d
MMYT 12-month price
Online Travel Agencies
TickerMkt capP/EP/E fwdP/SP/S fwdP/GPP/GP fwdEV/EBITDAFCF yld
BKNG$149.5B25.3x18.5x5.4x5.1x5.4x5.1x16.0x6.0%
EXPE$33.7B24.6x14.8x2.2x2.1x2.4x2.3x10.0x13.9%
MMYT$5.4B114.6x109.7x5.1x4.5x7.3x6.5x30.0x2.5%
TCOM
Trip.com
47.01
+0.53 (+1.14%)
vs. prior close
Price20d50d150d
TCOM 12-month price
Online Travel Agencies
TickerMkt capP/EP/E fwdP/SP/S fwdP/GPP/GP fwdEV/EBITDAFCF yld
TCOM$29.6B6.6x2.0x3.1x0.4x3.9x0.5x4.8x6.8%

Valuation & fundamentals

Consensus projections

TickerFY2026EFY2027EFY2028E
BKNGRevenue+9.8%+9.2%+8.3%
EPS+14.8%+17.8%+16.2%
EXPERevenue+9.6%+7.0%+7.9%
EPS+29.3%+15.7%+18.3%
MMYTRevenue+12.6%+7.4%+17.2%
EPS−48.0%+18.9%+89.4%
TCOMRevenue+9.6%+10.9%+10.5%
EPS−48.1%+17.1%+10.5%

Forward fiscal years only. Blank means no analyst coverage for that year.

A four-name bounce, but not a four-name story

Booking Holdings, the world's largest online travel agency and owner of Booking.com, Priceline and Agoda, and Expedia Group, which runs Expedia.com, Hotels.com and the vacation-rental platform Vrbo, both rallied sharply in late July on company-specific news. Booking closed up 6.82% on July 28 after a second-quarter earnings beat and raised third-quarter guidance, as a Middle East-related demand headwind that had forced an April guidance cut began to reverse. Expedia rose 7.4% on July 27 on fresh analyst optimism ahead of its own August 5 earnings report, touching an all-time high. Both stocks' trend signals, which had spent months in bearish territory, flipped bullish coincident with those single sessions — the price move and the trend confirmation arrived together, not price ahead of the band.

MakeMyTrip, India's largest online travel agency, and Trip.com Group, the dominant Chinese OTA with a growing outbound and international business, diverge from that pattern. MakeMyTrip's price is actually down 2.1% over the trailing month even as its trend signal flipped bullish alongside its peers — most likely sympathy rather than an MMYT-specific signal, with its own results due August 3 and Goldman Sachs flagging rupee depreciation as a headwind to dollar-reported growth. Trip.com gained 14.4%, the largest move of the four, but its trend signal remains deeply bearish — the one clear case in this basket of price rising well ahead of any trend confirmation, and against decelerating fundamentals: Trip.com fell 13.9% in a single session in late June after guiding second-quarter revenue growth to just 3-8%, down from 17% in the first quarter, with outbound growth and domestic China demand both softening. The one bright spot was international gross bookings up roughly 65% year over year.

On valuation, Booking and Expedia both still trade well inside multi-year ranges. Booking's trailing price-to-earnings sits near 24x, but its forward multiple and free-cash-flow yield near 8% point to levels last seen years ago, alongside an $8.2B capital-return program that has cut share count 22% since 2022. A Barron's-cited model puts Expedia's cash-adjusted price-to-earnings near 11.7-14x against Booking's 17.5-18.8x — cheaper on that basis despite Expedia being roughly half Booking's size and holding a smaller international footprint. Expedia backed that gap with results: first-quarter gross bookings rose 13%, revenue 15%, and adjusted EBITDA 83% year over year, funded by $3.75B of quarterly free cash flow and a new $5B buyback authorization. Trip.com's headline 6x trailing multiple looks cheap but carries a data-quality caveat on the underlying figures, and MakeMyTrip's 148x trailing multiple is not meaningful pending its next print.

On the AI-disintermediation fear that drove the group's original de-rating, Booking's own July report pushed back directly: management said AI-driven trip planners were increasing conversion and lowering customer-acquisition cost, the opposite of the feared outcome. Google's unlaunched agentic AI Mode booking feature, which would route flight and hotel bookings through partners including Booking.com and Expedia, triggered a sell-off on announcement, but at least one analyst called that reaction overblown since OTAs still fulfill and service the bookings Google routes to them.

The setup

Where it stands — Booking and Expedia's rally is earnings- and trend-confirmed; MakeMyTrip and Trip.com's price gains are not yet backed by comparable fundamentals. Would confirm — Trip.com's next guided quarter stabilizing above the 3-8% range, or MakeMyTrip's August 3 report showing bookings growth above the 3.4% consensus. Would invalidate — A further Trip.com guidance cut or a Booking/Expedia rise in marketing spend relative to gross bookings. Watch next — MakeMyTrip reports FY2027 Q1 results August 3, 2026; Expedia reports Q2 results August 5, 2026. Valuation — Booking near 24x trailing versus an 8% free-cash-flow yield; Expedia near 12-14x cash-adjusted; Trip.com near 6x trailing (data flagged); MakeMyTrip not meaningful pending results.
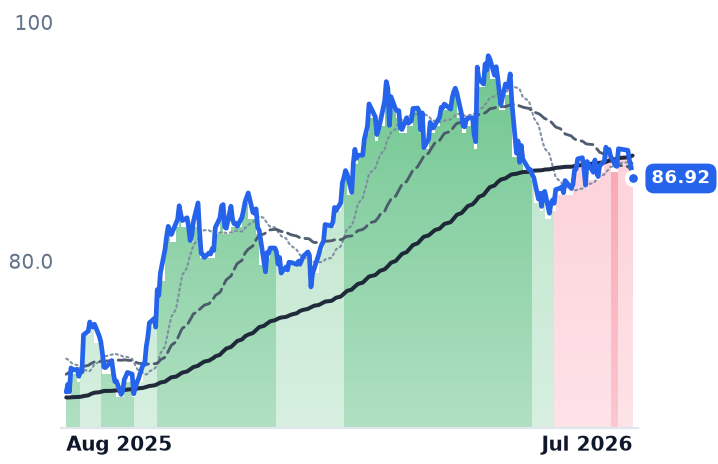
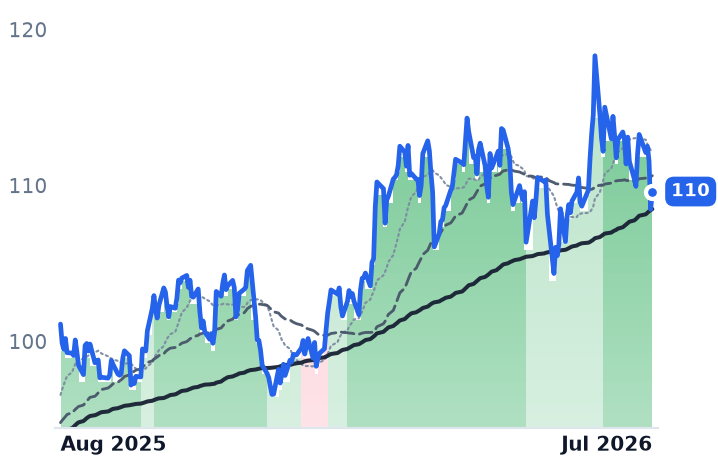
AI-Rack Assemblers Raise Guidance as Their Charts All Roll Over Together

Hypothesis Opus 5 · Research Sonnet 5 · Writing Sonnet 5 · Prompt v1.1

Celestica, Jabil and Sanmina all beat-and-raised on AI-server and networking demand in July 2026, yet every name in the six-stock EMS cohort saw its uptrend band downgraded in the same three-week window — a pattern that points to a sector-wide AI-hardware selloff, not company-specific disappointment, driving the pullback.
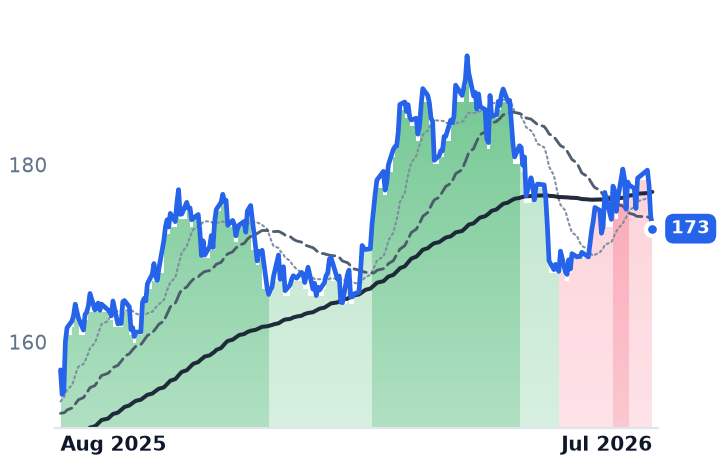
CLSFLEXJBLSANMBHEPLXSAMDNVDA
TickerCompanySegmentTrend30D1Y
CLSCelesticaElectronic Manufacturing Services🟢 Cont. Bull−5.4%+64.5%
FLEXFlexElectronic Manufacturing Services🟢 Cont. Bull−18.0%+123.3%
JBLJabilElectronic Manufacturing Services🟢 Cont. Bull−6.9%+41.9%
SANMSanminaElectronic Manufacturing Services🟢 Cont. Bull−14.7%+59.0%
BHEBenchmark ElectronicsElectronic Manufacturing Services🟢 Cont. Bull−6.8%+103.8%
PLXSPlexusElectronic Manufacturing Services🟢 Cont. Bull−8.7%+93.9%
AMDAdvanced Micro DevicesAI & Data Center GPUs🟢 Cont. Bull−13.7%+169.3%
NVDANVIDIAAI & Data Center GPUs🟢 Cont. Bull+2.7%+11.5%

12-month price & trend

CLS
Celestica
331
−21.15 (−6.00%)
vs. prior close
Price20d50d150d
CLS 12-month price
Electronic Manufacturing Services
FLEX
Flex
114
+1.84 (+1.64%)
vs. prior close
Price20d50d150d
FLEX 12-month price
Electronic Manufacturing Services
JBL
Jabil
315
+6.53 (+2.12%)
vs. prior close
Price20d50d150d
JBL 12-month price
Electronic Manufacturing Services
TickerMkt capP/EP/E fwdP/SP/S fwdP/GPP/GP fwdEV/EBITDAFCF yld
CLS$38.1B34.1x29.1x2.4x1.9x20.7x16.4x25.5x1.4%
FLEX$41.7B43.9x24.2x1.4x1.2x14.8x12.7x20.8x2.6%
JBL$33.0B38.9x24.7x1.0x0.9x10.8x9.8x16.7x4.6%
SANM
Sanmina
186
+2.08 (+1.13%)
vs. prior close
Price20d50d150d
SANM 12-month price
Electronic Manufacturing Services
BHE
Benchmark Electronics
79.77
+0.35 (+0.44%)
vs. prior close
Price20d50d150d
BHE 12-month price
Electronic Manufacturing Services
PLXS
Plexus
251
+9.35 (+3.86%)
vs. prior close
Price20d50d150d
PLXS 12-month price
Electronic Manufacturing Services
TickerMkt capP/EP/E fwdP/SP/S fwdP/GPP/GP fwdEV/EBITDAFCF yld
SANM$9.9B32.6x15.3x0.8x0.7x8.9x7.8x15.8x10.3%
BHE$2.9B53.9x27.0x1.0x1.0x9.8x9.8x19.8x5.4%
PLXS$6.7B36.3x29.3x1.5x1.4x14.9x13.9x27.0x0.9%
AMD
Advanced Micro Devices
476
−9.24 (−1.90%)
vs. prior close
Price20d50d150d
AMD 12-month price
AI & Data Center GPUs
NVDA
NVIDIA
201
+5.71 (+2.93%)
vs. prior close
Price20d50d150d
NVDA 12-month price
AI & Data Center GPUs
TickerMkt capP/EP/E fwdP/SP/S fwdP/GPP/GP fwdEV/EBITDAFCF yld
AMD$784.6B156.2x64.2x20.9x15.6x39.3x29.3x96.8x1.1%
NVDA$5.5T45.6x27.1x25.4x14.8x34.3x20.0x37.9x1.8%

Valuation & fundamentals

Consensus projections

TickerFY2026EFY2027EFY2028E
CLSRevenue+67.0%+69.3%+32.3%
EPS+90.2%+74.7%+34.3%
FLEXRevenue+6.8%+26.3%+30.0%
EPS+24.2%+44.7%+51.0%
JBLRevenue+20.2%+21.2%+12.1%
EPS+35.9%+31.0%+20.3%
SANMRevenue+74.9%+15.8%+11.8%
EPS+103.4%+15.2%+12.7%
BHERevenue+13.3%+7.8%
EPS+26.7%+13.0%
PLXSRevenue+20.8%+13.8%+9.0%
EPS+19.5%+15.6%+12.0%
AMDRevenue+47.1%+58.4%+35.0%
EPS+89.3%+83.9%+39.8%
NVDARevenue+65.1%+73.1%+33.0%
EPS+59.0%+77.2%+35.7%

Forward fiscal years only. Blank means no analyst coverage for that year.

Six contract manufacturers that assemble servers, networking switches and power-and-cooling hardware for hyperscale data centers — Celestica, Flex, Jabil, Sanmina, Benchmark Electronics and Plexus — have been the quietest AI-buildout trade on the board, up between 44% and 130% over the trailing year. Then, in a tight window from June 30 to July 22, 2026, every one of the six had its trend band downgraded from a sustained uptrend to a milder one, and each gave back ground in July, with declines from 8% (Celestica) to 26% (Flex), averaging roughly 17%.

The synchronized cracking looks like sector rotation, not company failure. A broader AI-hardware selloff in mid-July wiped out more than $1 trillion in market value across chip and infrastructure names on doubts about hyperscaler capex growth — hourly GPU rental prices reportedly fell roughly 31% over three weeks — and global tech stocks led a steep selloff around July 17 on the same worry. That's the proximate catalyst, and it's macro, not company-specific: Celestica, Jabil and Sanmina all beat-and-raised guidance in the same window their charts cracked.

Business momentum vs. the tape

Celestica, the Toronto-based contract manufacturer shifting from commodity assembly toward higher-margin, self-designed AI rack and 1.6-terabit networking-switch programs, raised FY26 revenue guidance from $17 billion to $19 billion and adjusted EPS from $8.75 to $10.15 even as its stock fell 35% from its June 2 high. Jabil, a diversified manufacturer whose Intelligent Infrastructure unit covers AI servers, networking and capital equipment, posted Q3 revenue up 12% year over year with Intelligent Infrastructure up 21%, won a third hyperscale customer, and raised its FY26 outlook to roughly $35 billion. Sanmina, which acquired AMD's ZT Systems rack-scale AI-server manufacturing business, reported record revenue with ZT Systems contributing $1.1 billion and its cloud-AI segment up 173% year over year. On the fundamentals, momentum is accelerating, not cracking.

Valuation is where the story splits. Celestica now trades around 2x sales versus 3.1x-3.45x in May — real multiple compression even as guidance rose — with a forward multiple near 30x that sits at the low end of its post-2024 re-rate range from single-digit multiples rather than looking newly stretched. Jabil trades near a 24x forward multiple against a 45-50x trailing range recorded in May, and Sanmina's price-to-sales sits below 1x despite the ZT Systems ramp — both reasonably priced against their growth. Flex, whose Anord Mardix power-and-cooling unit is slated for a tax-free spinoff, fell 26% in July on what one report called profit-taking ahead of its earnings date rather than a negative print. Plexus and Benchmark, both diversified toward aerospace, defense and medical customers with limited direct AI-rack exposure, rallied alongside the AI-pure-play names anyway — a sign part of the cohort's gain rides sector sentiment rather than disclosed AI revenue.

The net picture is a genuine divergence rather than a clean story: the axis measuring the business — bookings, guidance, hyperscaler wins — confirms the rally, while the tape, and Celestica's multiple specifically, has already de-rated. That's a possible dislocation, not a fundamental unwind.

The setup

Where it stands — All six EMS names beat-and-raised into a July selloff that downgraded every trend band without a matching guidance cut. Would confirm — Celestica, Jabil or Sanmina AI-segment revenue growth decelerates or hyperscaler customer concentration worsens in the next print. Would invalidate — Trend bands recover to sustained-uptrend status while guidance holds, signaling the July move was rotation, not a reset. Watch next — Celestica's next earnings call and any update on its roughly $1.5 billion FY27 capex against hyperscaler capex-digestion commentary. Valuation — Celestica ~2x sales (down from 3.1-3.45x) and ~30x forward EPS; Jabil ~24x forward vs 45-50x trailing; Sanmina price-to-sales below 1x.