

Food Deflation Left US Foods Earning 36 Cents More a Case While Sysco's Costs Caught Up
Hypothesis Opus 5 · Research Opus 5 · Writing Opus 5 · Prompt v1.7
The premise everyone carried into this week's results was a beef cost squeezing every operator in the chain. At the distributor's invoice it had inverted: Performance Food Group's foodservice inflation decelerated to 0.5%, Sysco printed deflation in poultry and dairy, and US Foods said center-of-plate inflation ran below its own plan.
With no price increase to pass along, growth has to come out of the gap between what a case earns and what it costs to move. US Foods widened it: adjusted gross profit per case up 4.3% against operating expense per case up 2.7%. Sysco did not, as a gross-margin gain of 18 basis points met an almost equal rise in operating expense.
The business improving fastest per case is also the dearest, at 15.4x trailing enterprise value to EBITDA against Sysco's 11.5x.
| Ticker | Company | Segment | Trend · 13mo | 30D | 1Y |
|---|---|---|---|---|---|
| The subject · what this brief is about | |||||
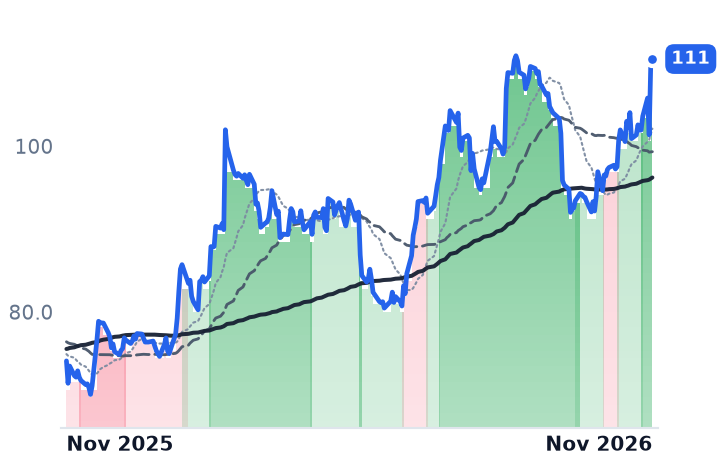
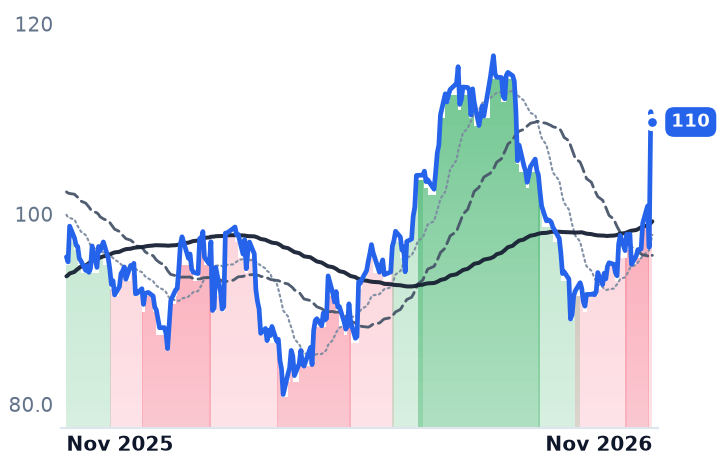
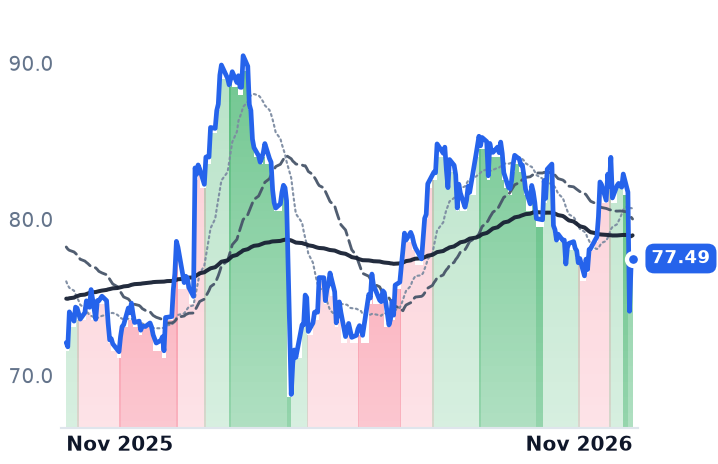
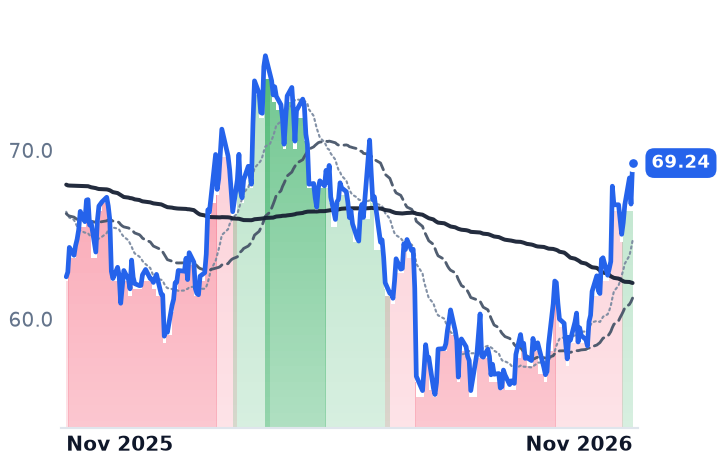
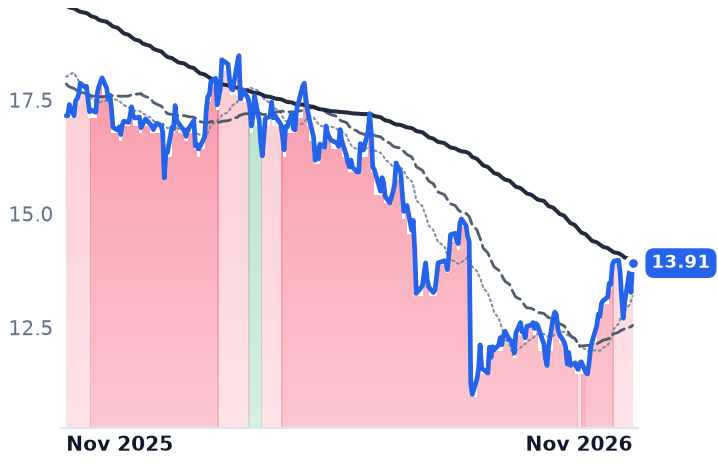
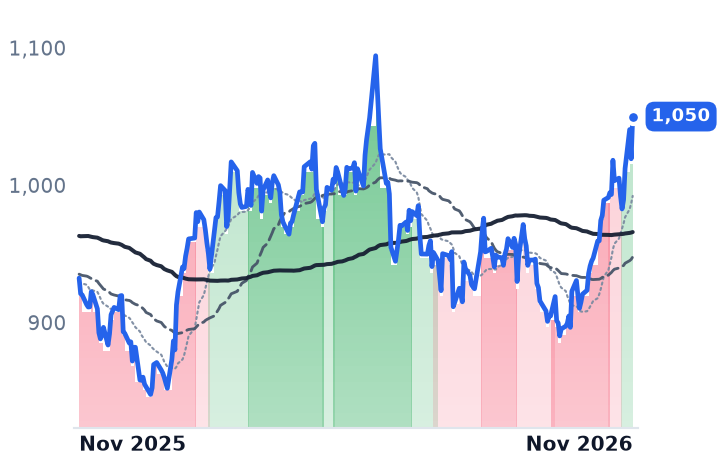
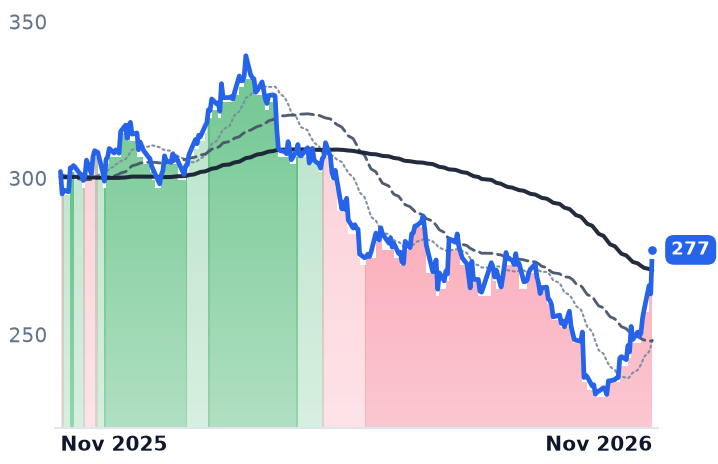
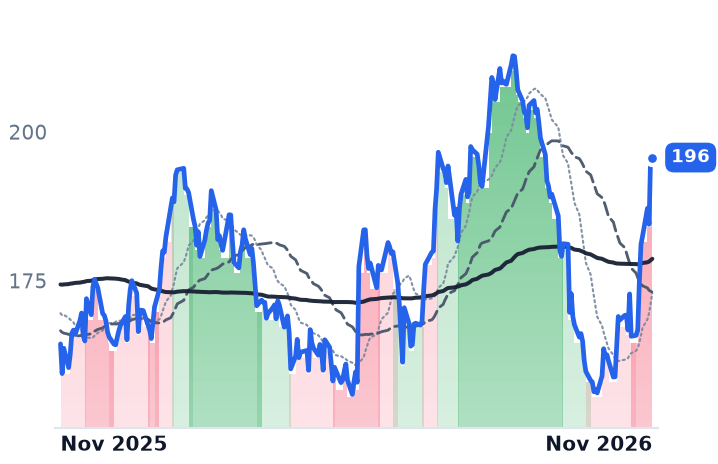
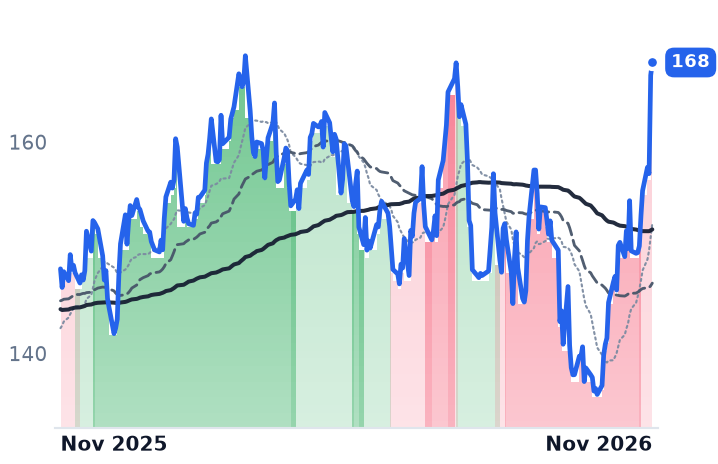
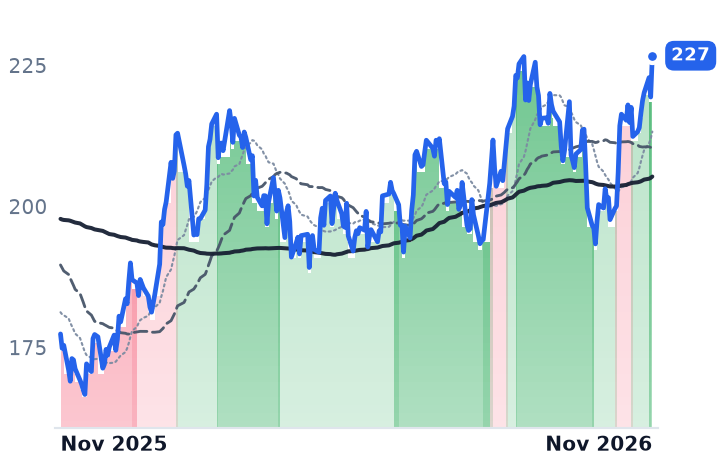
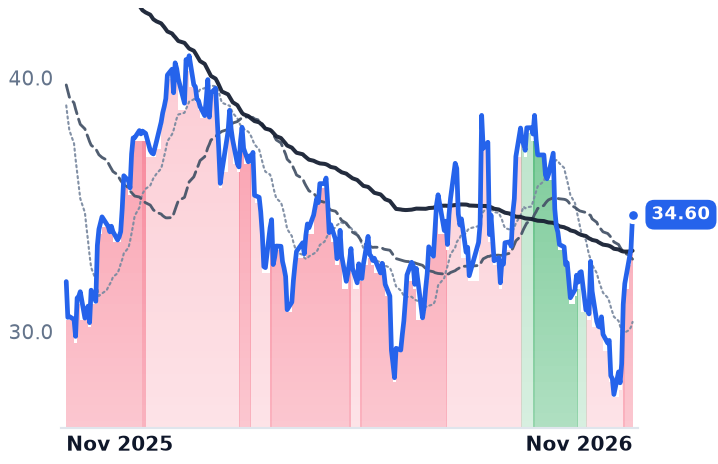
USFD | US Foods | Broadline Distributors | 🟢 Cont. Bull | +14.5% | +49.1% |
PFGC | Performance Food | Broadline Distributors | 🔴 Cont. Bear | +17.0% | +14.8% |
SYY | Sysco | Broadline Distributors | 🌱 Emerging Bull | +0.1% | +7.5% |
| Compared against · context, not the story | |||||
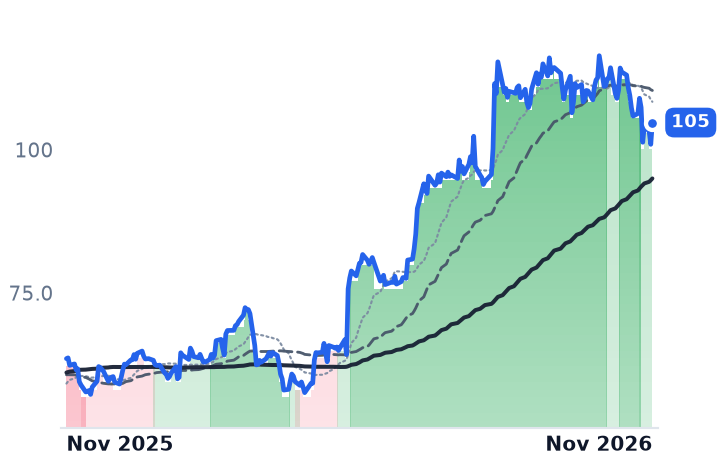
CHEF | The Chefs' Warehouse | Specialty Gourmet | 🟢 Cont. Bull | −5.8% | +64.9% |
SFM | Sprouts Farmers Market | Natural & Organic Grocers | 🔴 Cont. Bear | −17.1% | −32.3% |
UNFI | United Natural Foods | Organic & Natural | ⚠️ Emerging Bear | +10.3% | +32.3% |
SPY | State Street SPDR S&P 500 ETF Trust | Asset Management | 🟢 Cont. Bull | −3.3% | +11.8% |
WMT | Walmart | General Merchandise | ⚠️ Emerging Bear | +22.1% | +29.8% |
KR | The Kroger | National Supermarket Chains | 🔴 Cont. Bear | +18.5% | +10.8% |
ACI | Albertsons Companies | National Supermarket Chains | 🔴 Cont. Bear | +21.2% | −18.9% |
COST | Costco Wholesale | Warehouse Clubs | ⚠️ Emerging Bear | +12.2% | +12.6% |
MCD | McDonald's | Quick Service Restaurants | 🔴 Cont. Bear | +19.2% | −8.3% |
TXRH | Texas Roadhouse | Full-Service Casual Dining | 🔴 Cont. Bear | +19.6% | +19.1% |
YUM | Yum! Brands | Multi-Brand QSR Operators | 🔴 Cont. Bear | +19.8% | +13.2% |
DRI | Darden Restaurants | Full-Service Casual Dining | 🟢 Cont. Bull | +11.6% | +27.8% |
CMG | Chipotle Mexican Grill | Fast-Casual Restaurants | 🔴 Cont. Bear | +12.0% | +8.2% |
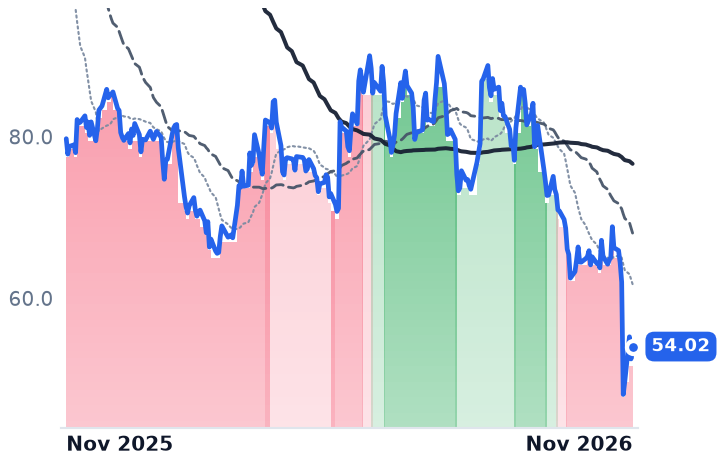
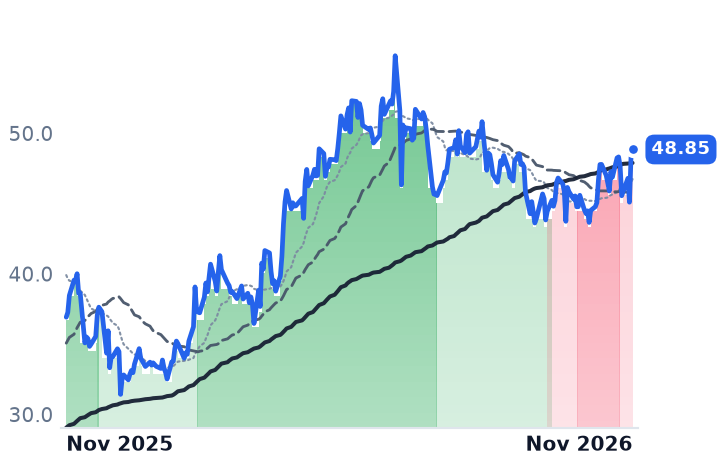
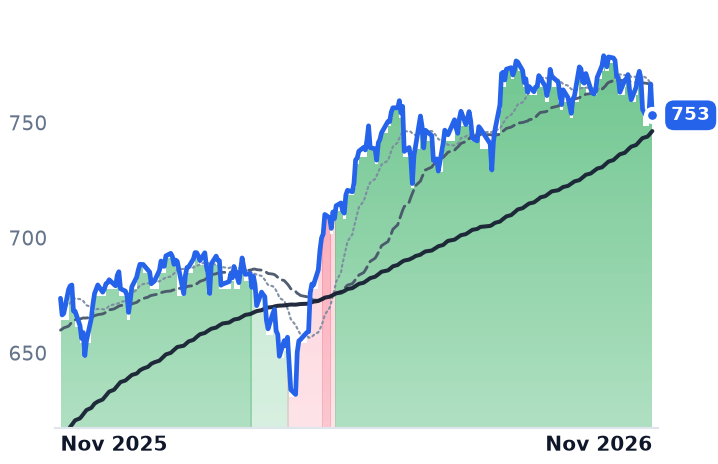
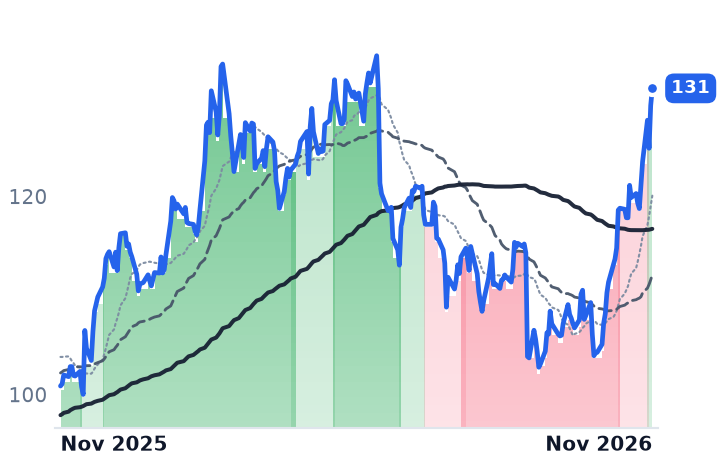
12-month price & trend
| Ticker | Mkt cap | P/E | P/E fwd | P/S | P/S fwd | P/GP | P/GP fwd | EV/EBITDA | FCF yld |
|---|---|---|---|---|---|---|---|---|---|
USFD | $23.1B | 29.4x | 22.4x | 0.6x | 0.6x | 3.2x | 3.1x | 15.4x | 4.6% |
PFGC | $17.3B | 43.4x | 19.5x | 0.3x | 0.2x | 2.1x | 2.0x | 14.2x | 6.4% |
SYY | $37.0B | 20.0x | 14.9x | 0.4x | 0.4x | 2.3x | 2.2x | 11.5x | 5.9% |
| Ticker | Mkt cap | P/E | P/E fwd | P/S | P/S fwd | P/GP | P/GP fwd | EV/EBITDA | FCF yld |
|---|---|---|---|---|---|---|---|---|---|
CHEF | $4.6B | 47.5x | 44.5x | 1.0x | 1.0x | 4.3x | 4.1x | 21.2x | 2.7% |
SFM | $6.0B | 12.3x | 11.7x | 0.7x | 0.6x | 1.8x | 1.7x | 7.9x | 5.9% |
UNFI | $2.9B | 34.4x | 14.3x | 0.1x | 0.1x | 0.7x | 0.7x | 11.2x | 11.2% |
| Ticker | Mkt cap | P/E | P/E fwd | P/S | P/S fwd | P/GP | P/GP fwd | EV/EBITDA | FCF yld |
|---|---|---|---|---|---|---|---|---|---|
SPY | $773.0B | — | — | — | — | — | — | — | — |
WMT | $924.4B | 41.9x | 40.2x | 1.3x | 1.2x | 5.0x | 4.9x | 21.1x | 1.5% |
KR | $38.7B | 33.9x | 12.2x | 0.3x | 0.3x | 1.1x | 1.1x | 11.0x | 5.9% |
| Ticker | Mkt cap | P/E | P/E fwd | P/S | P/S fwd | P/GP | P/GP fwd | EV/EBITDA | FCF yld |
|---|---|---|---|---|---|---|---|---|---|
ACI | $6.3B | n/m | 7.4x | 0.1x | 0.1x | 0.3x | 0.3x | 8.8x | 15.0% |
COST | $435.2B | 47.3x | 43.1x | 1.4x | 1.3x | 11.2x | 10.3x | 29.5x | 2.2% |
MCD | $168.0B | 19.2x | 18.3x | 6.1x | 6.0x | 10.6x | 10.4x | 14.8x | 4.6% |
| Ticker | Mkt cap | P/E | P/E fwd | P/S | P/S fwd | P/GP | P/GP fwd | EV/EBITDA | FCF yld |
|---|---|---|---|---|---|---|---|---|---|
TXRH | $11.9B | 28.9x | 27.4x | 1.9x | 1.8x | 12.5x | 11.9x | 16.7x | 3.4% |
YUM | $38.0B | 17.2x | 21.0x | 4.4x | 4.3x | 9.5x | 9.3x | 17.2x | 4.4% |
DRI | $25.8B | 21.5x | 20.0x | 2.0x | 1.9x | 2.8x | 2.7x | 13.5x | 4.3% |
| Ticker | Mkt cap | P/E | P/E fwd | P/S | P/S fwd | P/GP | P/GP fwd | EV/EBITDA | FCF yld |
|---|---|---|---|---|---|---|---|---|---|
CMG | $38.6B | 28.0x | 26.6x | 3.1x | 3.0x | 12.9x | 12.3x | 19.3x | 4.1% |
Consensus projections
| Ticker | FY2026E | FY2027E | FY2028E | |
|---|---|---|---|---|
USFD | Revenue | +5.0% | +4.1% | +5.4% |
| EPS | +21.1% | +16.3% | +17.9% | |
PFGC | Revenue | +8.0% | +7.2% | +2.7% |
| EPS | +5.1% | +21.7% | +19.6% | |
SYY | Revenue | +3.8% | +6.1% | +2.6% |
| EPS | +4.7% | +10.4% | +6.5% | |
CHEF | Revenue | +11.7% | +8.6% | +8.5% |
| EPS | +35.9% | +20.5% | +11.2% | |
SFM | Revenue | +7.6% | +7.7% | +9.1% |
| EPS | +5.3% | +7.5% | +9.2% | |
UNFI | Revenue | −1.6% | +1.1% | +2.3% |
| EPS | +300.0% | +30.7% | +21.4% | |
WMT | Revenue | +4.7% | +5.6% | +4.4% |
| EPS | +6.0% | +9.5% | +11.5% | |
KR | Revenue | +0.3% | +1.9% | +1.2% |
| EPS | +7.8% | +8.0% | +6.2% | |
ACI | Revenue | +3.9% | −1.7% | +0.2% |
| EPS | −6.9% | −17.2% | +0.9% | |
COST | Revenue | +10.0% | +8.9% | +7.5% |
| EPS | +13.4% | +11.2% | +9.9% | |
MCD | Revenue | +5.7% | +4.9% | +3.1% |
| EPS | +6.4% | +7.9% | +6.6% | |
TXRH | Revenue | +11.0% | +9.3% | +8.6% |
| EPS | +4.7% | +18.3% | +20.8% | |
YUM | Revenue | +9.4% | +3.2% | +5.8% |
| EPS | +8.1% | +10.2% | +11.0% | |
DRI | Revenue | +9.5% | +3.6% | +6.0% |
| EPS | +11.5% | +6.2% | +9.9% | |
CMG | Revenue | +9.5% | +10.8% | +10.2% |
| EPS | −0.4% | +19.4% | +16.1% |
Forward fiscal years only. Blank means no analyst coverage for that year.
The three broadline food distributors reported within three days of each other this week, and each described the same reversal: the price of the food they buy has stopped rising. Sysco planned for food-cost inflation of 1.4% in its September quarter and got 0.3%, with deflation concentrated in poultry and dairy. US Foods said center-of-plate inflation ran 100 to 150 basis points below its own plan. At Performance Food Group, which sells to restaurants through its Foodservice arm and to c-stores and vending operators through Convenience and Specialty, foodservice inflation decelerated to 0.5%.
The belief these results were supposed to confirm was a record beef cost squeezing everyone who touches a case. Retail is still living that story: ground beef hit a record $6.92 a pound in August, against roughly 3% total food inflation. But the wholesale market has rolled over, with the Choice boxed-beef cutout slipping to $367.28 by late October. For a distributor, a falling product cost is not relief. It strips the nominal dollars off the invoice, and whatever earnings growth remains has to come out of the spread between what a case earns and what it costs to pick, load and drive.
The 36 cents US Foods kept
US Foods, which runs about 70 broadline distribution centers serving independent restaurants, hospitals, hotels and schools, lifted adjusted gross profit per case 4.3%, a gain the company put at $0.36, while adjusted operating expense per case rose only 2.7%. That spread turned total case growth of 1.3% into adjusted EBITDA up 9.9% to $555m. Independent restaurant cases grew 5.0%; chain cases fell 1.5%.
The source is mix and productivity rather than price. Private-brand cases reached approximately 35% of total cases, against about 34% in the March quarter. "The AI initiatives we have deployed over the past two years are now generating more than $75 million of adjusted EBITDA across sales, supply chain, and enterprise functions," chair and chief executive Dave Flitman said on the 5 November call, adding that seller headcount will now grow at a low single-digit rate against a prior mid-single-digit target.
Performance Food Group ran the same play. Gross profit per case rose $0.30 and group gross margin 33 basis points, with independent foodservice cases up 7.8%. "Performance Brands were nearly 51% of our cases sold to independent restaurants," chief executive Scott McPherson said on 4 November. Crucially, the earnings are coming from food distribution: Foodservice adjusted EBITDA rose 13.4% to $367.9m on $9.6bn of the quarter's $18.02bn in sales, while Specialty EBITDA fell 4.8% on a 9% jump in operating expenses.
Sysco's margin gain stopped at the warehouse door
Sysco expanded gross margin by 18 basis points. Then adjusted operating expenses rose 4.0% to $3.1bn, or 17 basis points as a share of sales, leaving adjusted operating income up 3.2% and GAAP operating income down 10.4%. Local cases grew 2.7%, below both rivals' independent growth. The remedy is dated but not delivered: "Every 1% improvement in pieces per mile delivers approximately $3 million of efficiency gains once scaled across the organization," chief executive Kevin Hourican said on 3 November, with routing optimization still in pilot regions.
Cost per case is where the industry's one real inflation now sits. The national on-highway diesel average reached $6.35 a gallon in late October against $3.72 a year earlier. US Foods recovered about 70% of fuel through surcharges against a typical 30% to 40%, and flagged roughly 1.5 points of fourth-quarter headwind. PFG absorbed a net $16m.
Three sessions carried the month. Sysco fell 9.33% on 3 November and pulled the other two down with it; on 4 November PFG rose 14.78% and US Foods 8.46%. Over three months the group is flat, US Foods up 10.0% and Sysco down 9.3%, and specialty distributor The Chefs' Warehouse fell 5.8% over the 30 days while Walmart and Kroger each gained more than 18% against a falling index.
What the per-case arithmetic settles
The mechanism works, and it is not shared. Two distributors converted deflation into profit by selling more of their own labels to independents and holding cost per case below gross profit per case; the incumbent held neither, and its answer to losing street share is to buy it, through the $29bn Jetro Restaurant Depot deal that pays $21.6bn in cash plus 91.5m shares.
The prices disagree with the operations. US Foods is the dearest at 15.4x trailing enterprise value to EBITDA, after a 48.4% year, and revenue of $10.40bn missed a $10.58bn consensus while the top of full-year earnings guidance came down to 20% from 24%. PFG sits at 14.2x with a 6.4% free-cash-flow yield and Foodservice compounding at 13.4%. Sysco is cheapest at 11.5x and 14.9x forward earnings, but the cause is identifiable: three years of flat-to-falling operating profit on rising sales, a sales guide cut to the low end of 6% to 7%, and a balance sheet about to absorb the Restaurant Depot financing at a 5.8% effective debt cost.
Nobody on any of the three calls blamed appetite-suppressing drugs for soft volume. Black Box Intelligence, which tracks chain same-store traffic, attributes the decline to inflation, a softening labor market and gasoline, and all three managements said much the same. The plate is not shrinking so much as cheapening, and a distributor paid on the dollar value of what crosses its dock has to find its growth 30-odd cents at a time.