

Applied Optoelectronics Nearly Doubled Revenue and Earned Less on Every Dollar It Shipped
Hypothesis Opus 5 · Research Opus 5 · Writing Opus 5 · Prompt v1.7
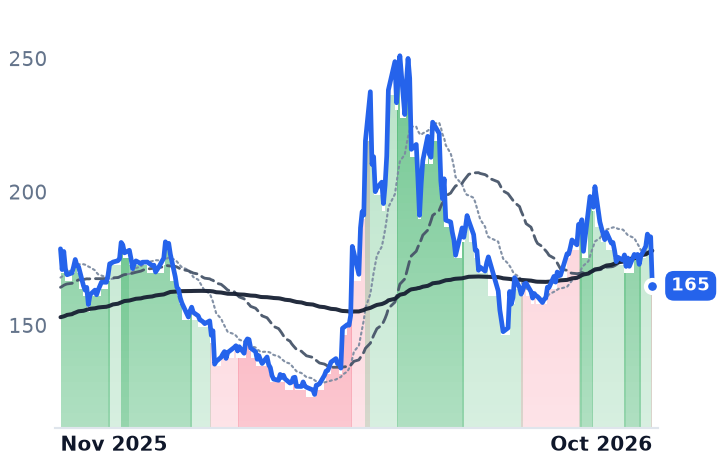
Four suppliers of silicon inside AI optical links were marked down together in October, and only one of them has shipped-unit economics moving the wrong way. Applied Optoelectronics grew June-quarter revenue 86% year on year while gross margin slipped to 27.7% from 30.3%, so gross profit grew slower than sales and the operating loss widened.
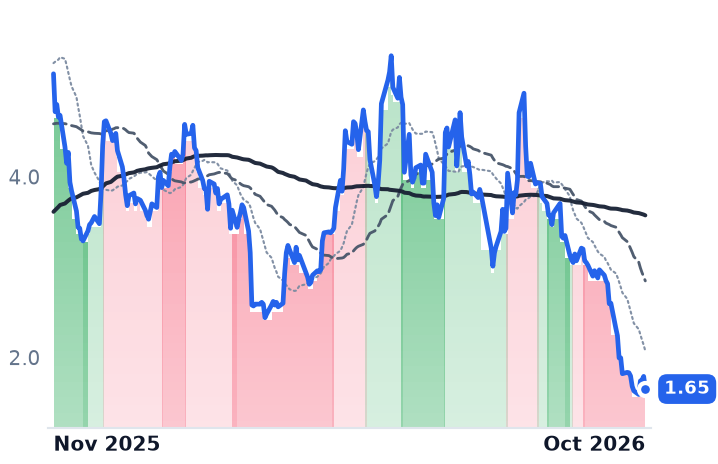
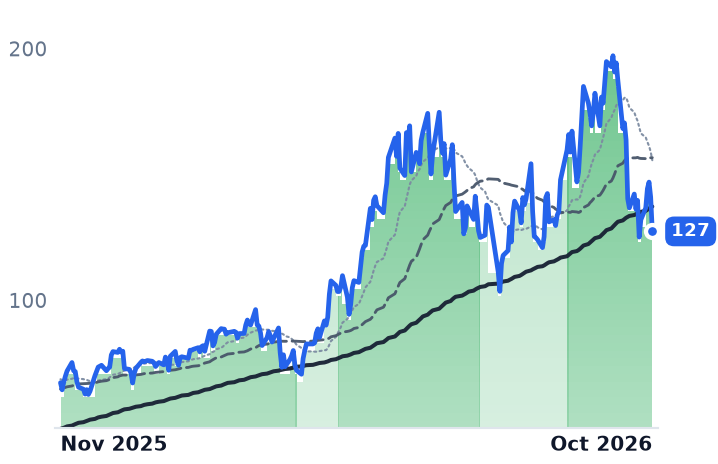
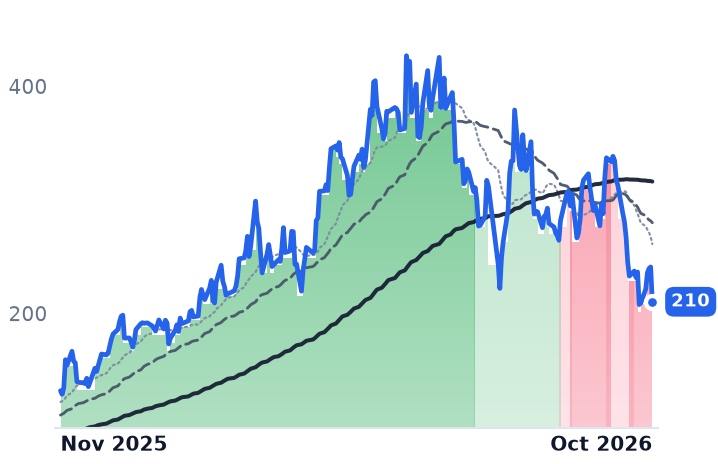
MACOM and SiTime went the other way, MACOM to a 58.3% gross margin on 36% revenue growth and SiTime to its first operating profit; MaxLinear raised its optical data-center outlook on 22 October. The complication for Applied Optoelectronics is its funding: it finished a share-sale program in October at an average $105.36 and closed the month at $69.05, below the price at which it paid for its own 1.6-terabit capacity. None of the four had reported a September quarter when the selling happened.
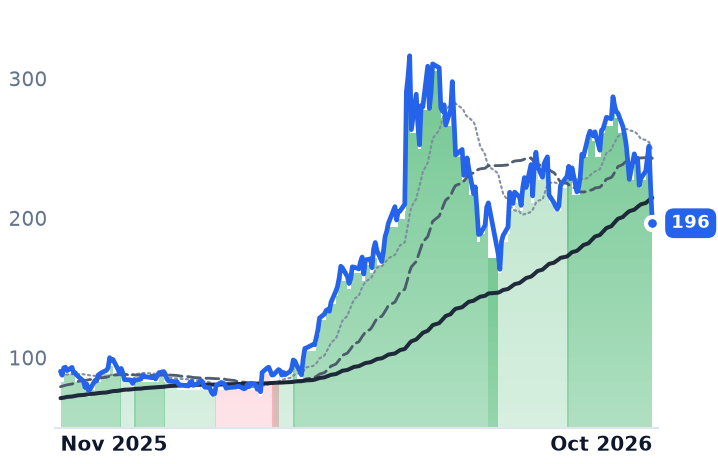
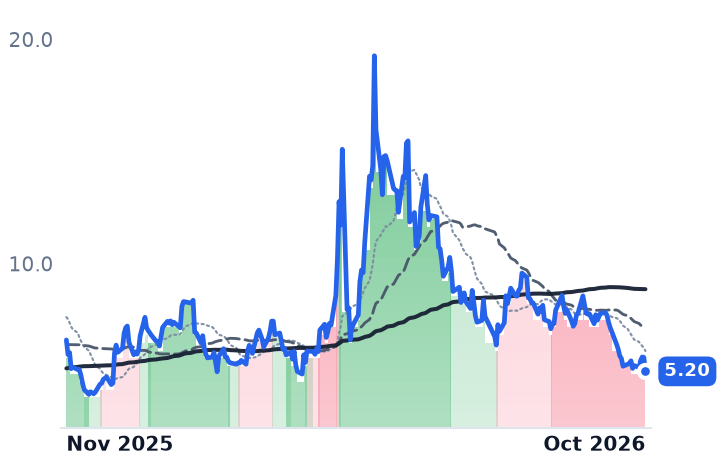
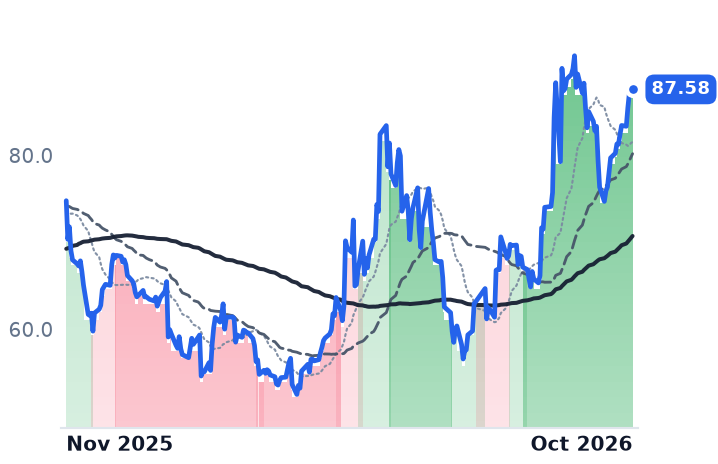
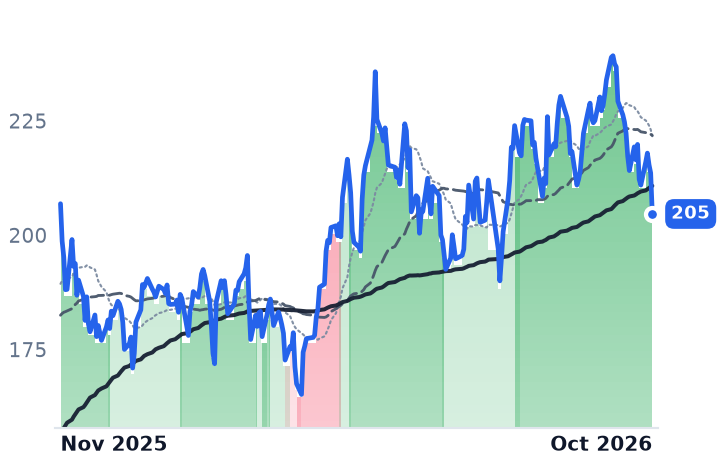
| Ticker | Company | Segment | Trend · 13mo | 30D | 1Y |
|---|---|---|---|---|---|
| The subject · what this brief is about | |||||
AAOI | Applied Optoelectronics | Optical Networking | 🔴 Cont. Bear | −43.2% | +109.0% |
MTSI | MACOM Technology Solutions | Analog & Power Management | ⚠️ Emerging Bear | −28.6% | +56.1% |
SITM | SiTime | Analog & Power Management | 🟢 Cont. Bull | −37.0% | +55.1% |
MXL | MaxLinear | Analog & Power Management | 🟢 Cont. Bull | −36.0% | +331.9% |
QCOM | QUALCOMM Incorporated | Processors & Accelerators | ⚠️ Emerging Bear | −8.9% | −7.8% |
INDI | indie Semiconductor | RF & Wireless | 🔴 Cont. Bear | −43.3% | −67.9% |
SMTC | Semtech | Analog & Power Management | 🟢 Cont. Bull | −33.9% | +89.4% |
| Compared against · context, not the story | |||||
COHR | Coherent | Photonics & Optics | ⚠️ Emerging Bear | −37.0% | +59.3% |
LITE | Lumentum | Optical Networking | 🟢 Cont. Bull | −23.0% | +321.2% |
FN | Fabrinet | Contract Manufacturing | 🔴 Cont. Bear | −27.9% | −26.1% |
CRDO | Credo Technology | Data Center & Networking | ⚠️ Emerging Bear | −28.9% | −16.4% |
ALAB | Astera Labs | Data Center & Networking | 🟢 Cont. Bull | −28.6% | +35.0% |
MRVL | Marvell Technology | Data Center & Networking | 🟢 Cont. Bull | −27.6% | +117.6% |
POET | POET Technologies | Sensors & Specialized Semiconductors | 🔴 Cont. Bear | −33.4% | −21.2% |
SWKS | Skyworks Solutions | Analog & Power Management | 🌱 Emerging Bull | +4.4% | +17.1% |
NVDA | NVIDIA | Processors & Accelerators | 🟢 Cont. Bull | −14.3% | −1.1% |
ANET | Arista Networks | Cloud Networking | 🟢 Cont. Bull | −18.4% | +7.2% |
AVGO | Broadcom | Data Center & Networking | ⚠️ Emerging Bear | −10.0% | −9.7% |
SPY | State Street SPDR S&P 500 ETF Trust | Asset Management | 🟢 Cont. Bull | −2.5% | +11.2% |
INTC | Intel | Processors & Accelerators | 🟢 Cont. Bull | −43.4% | +66.5% |
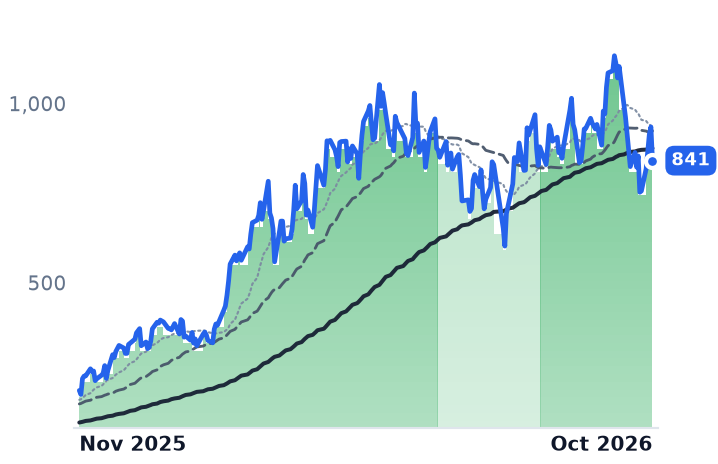
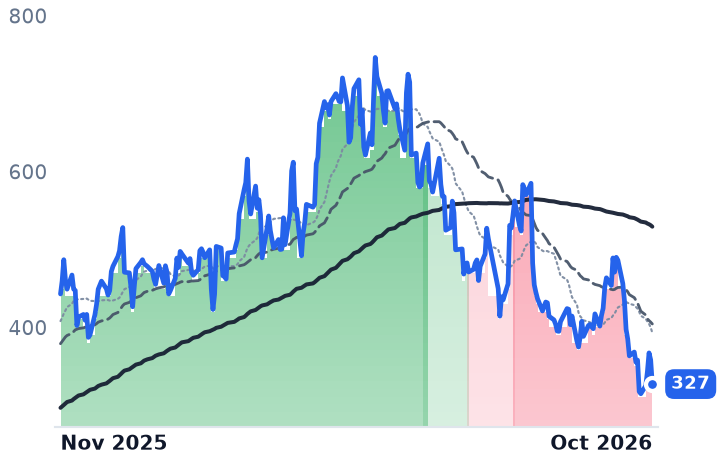
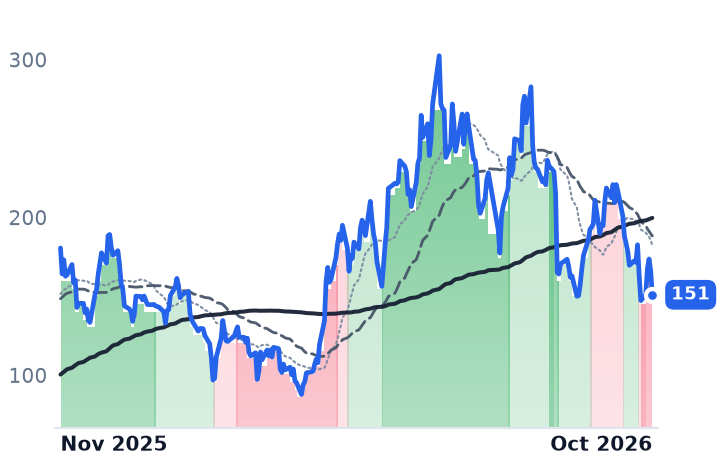
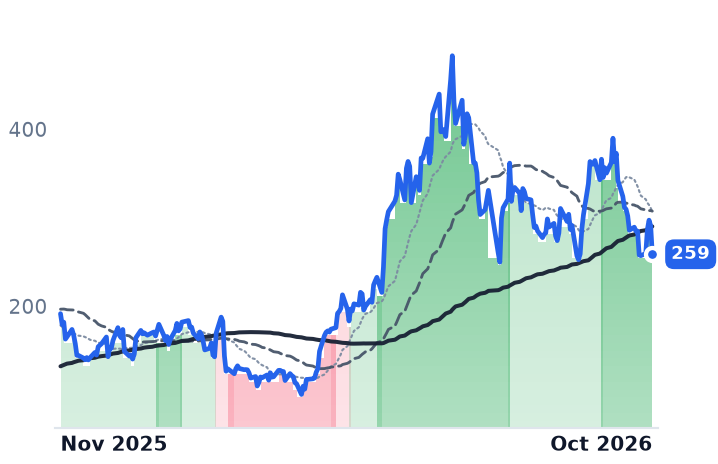
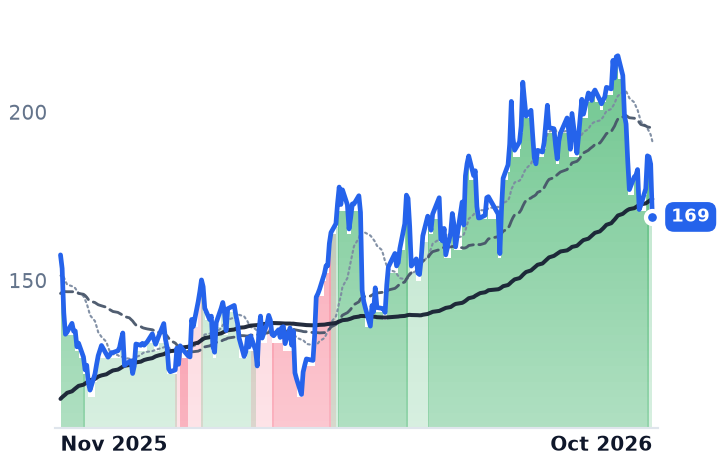
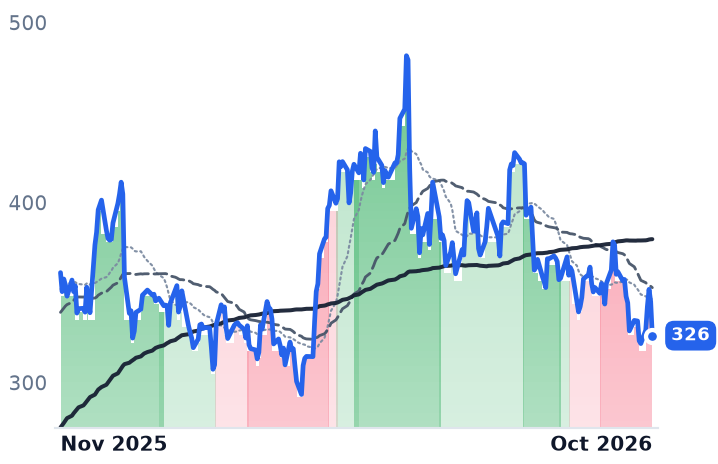
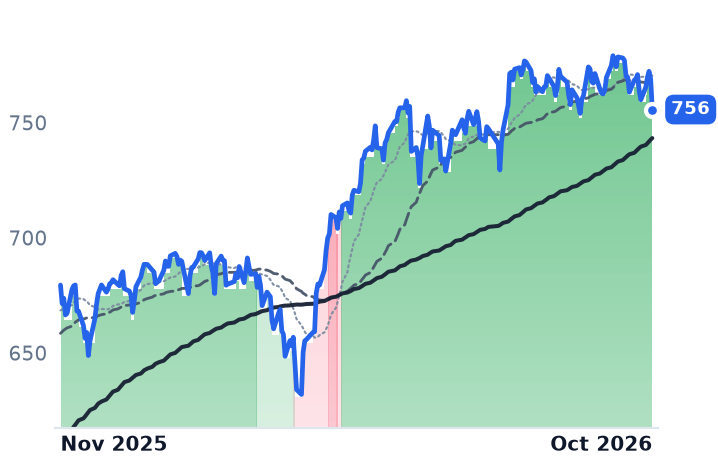
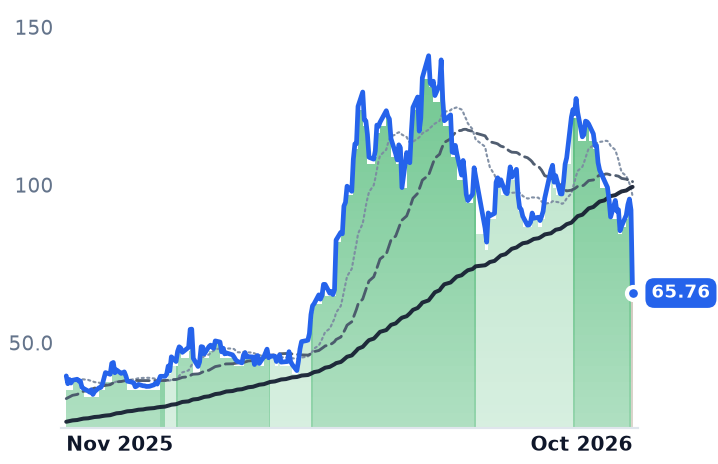
12-month price & trend
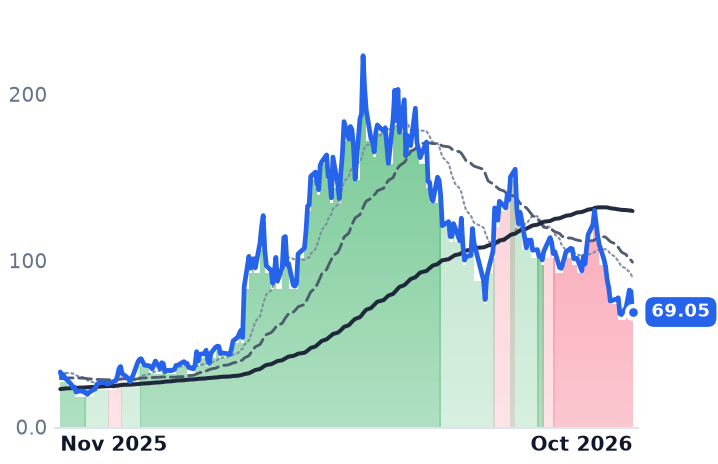
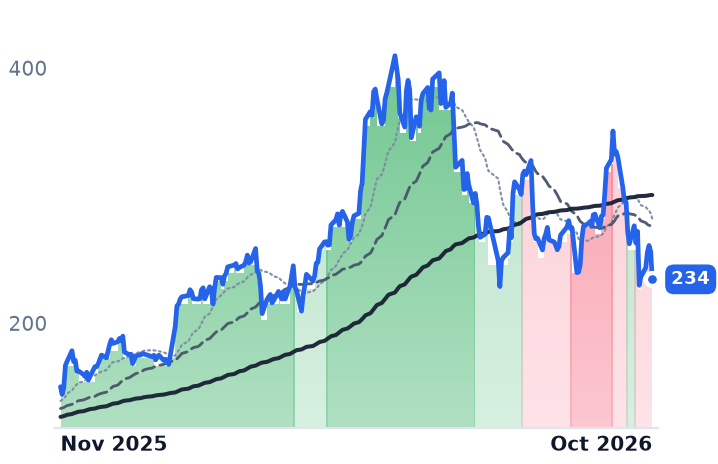
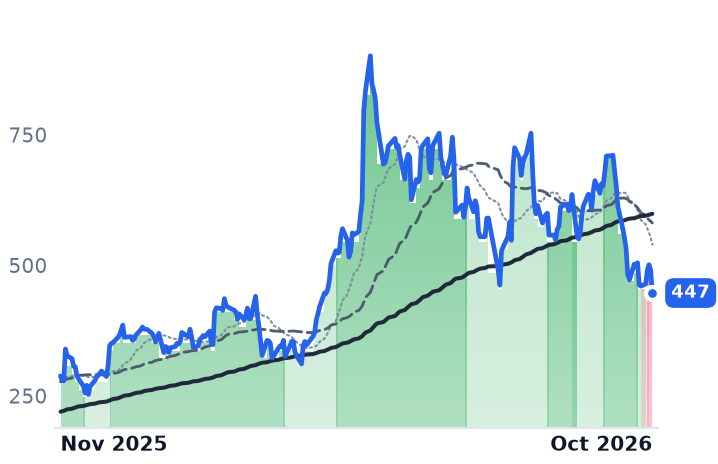
| Ticker | Mkt cap | P/E | P/E fwd | P/S | P/S fwd | P/GP | P/GP fwd | EV/EBITDA | FCF yld |
|---|---|---|---|---|---|---|---|---|---|
AAOI | $5.9B | n/m | 93.3x | 9.8x | 5.6x | 34.0x | 19.3x | n/m | -7.0% |
MTSI | $17.9B | 73.2x | 27.5x | 15.4x | 9.9x | 27.2x | 17.5x | 50.9x | 0.7% |
SITM | $13.4B | 843.5x | 39.6x | 28.6x | 15.3x | 48.8x | 26.0x | 247.2x | 0.6% |
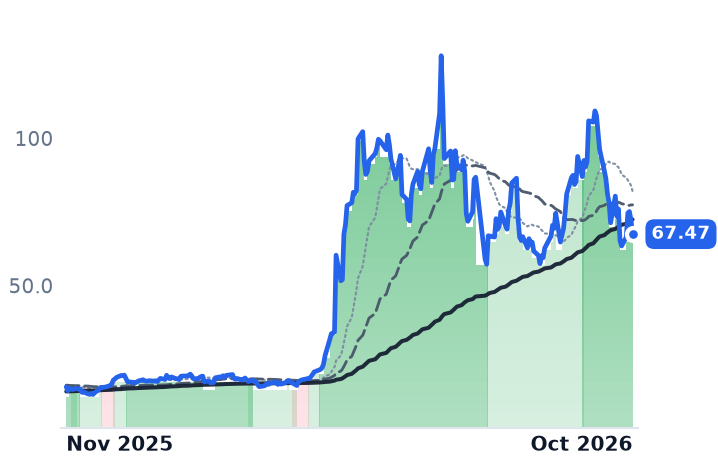
| Ticker | Mkt cap | P/E | P/E fwd | P/S | P/S fwd | P/GP | P/GP fwd | EV/EBITDA | FCF yld |
|---|---|---|---|---|---|---|---|---|---|
MXL | $6.1B | n/m | 34.1x | 9.3x | 7.9x | 16.0x | 13.6x | 187.7x | -0.3% |
QCOM | $176.0B | 18.8x | 16.3x | 4.0x | 3.9x | 7.4x | 7.2x | 13.9x | 5.9% |
INDI | $359.6M | n/m | — | 1.6x | 1.3x | 7.2x | 6.3x | n/m | -23.3% |
| Ticker | Mkt cap | P/E | P/E fwd | P/S | P/S fwd | P/GP | P/GP fwd | EV/EBITDA | FCF yld |
|---|---|---|---|---|---|---|---|---|---|
SMTC | $11.9B | 76.9x | 34.9x | 10.1x | 7.9x | 19.5x | 15.2x | 92.4x | 1.5% |
COHR | $43.6B | 50.9x | 23.5x | 6.1x | 4.1x | 16.3x | 11.0x | 29.5x | -2.4% |
LITE | $74.1B | n/m | 37.6x | 24.6x | 11.7x | 59.0x | 28.1x | n/m | 0.7% |
| Ticker | Mkt cap | P/E | P/E fwd | P/S | P/S fwd | P/GP | P/GP fwd | EV/EBITDA | FCF yld |
|---|---|---|---|---|---|---|---|---|---|
FN | $11.7B | 24.6x | 17.8x | 2.5x | 1.9x | 20.9x | 15.9x | 18.1x | 0.0% |
CRDO | $43.0B | 88.0x | 37.3x | 32.2x | 17.5x | 47.3x | 25.7x | 82.0x | 0.9% |
ALAB | $62.5B | 168.0x | 91.3x | 52.0x | 32.7x | 69.2x | 43.6x | 186.8x | 0.4% |
| Ticker | Mkt cap | P/E | P/E fwd | P/S | P/S fwd | P/GP | P/GP fwd | EV/EBITDA | FCF yld |
|---|---|---|---|---|---|---|---|---|---|
MRVL | $204.7B | 76.7x | 55.5x | 21.7x | 17.0x | 42.1x | 33.0x | 43.3x | 0.8% |
POET | $686.5M | n/m | — | 400.8x | 108.2x | — | — | n/m | -5.9% |
SWKS | $12.4B | 42.5x | 16.4x | 3.1x | 3.1x | 7.6x | 7.5x | 15.5x | 1.6% |
| Ticker | Mkt cap | P/E | P/E fwd | P/S | P/S fwd | P/GP | P/GP fwd | EV/EBITDA | FCF yld |
|---|---|---|---|---|---|---|---|---|---|
NVDA | $5.5T | 34.3x | 25.0x | 21.5x | 13.9x | 29.0x | 18.7x | 28.3x | 2.2% |
ANET | $223.5B | 55.2x | 43.1x | 21.2x | 17.6x | 33.7x | 28.0x | 43.5x | 2.3% |
AVGO | $1.6T | 40.8x | 28.2x | 17.6x | 14.8x | 25.6x | 21.6x | 30.7x | 2.5% |
| Ticker | Mkt cap | P/E | P/E fwd | P/S | P/S fwd | P/GP | P/GP fwd | EV/EBITDA | FCF yld |
|---|---|---|---|---|---|---|---|---|---|
SPY | $773.0B | — | — | — | — | — | — | — | — |
INTC | $620.4B | n/m | 80.1x | 10.9x | 9.8x | 27.9x | 25.3x | 179.2x | 0.5% |
Consensus projections
| Ticker | FY2026E | FY2027E | FY2028E | |
|---|---|---|---|---|
AAOI | Revenue | +131.7% | +182.3% | +72.7% |
| EPS | −327.3% | +650.0% | +92.2% | |
MTSI | Revenue | +37.1% | +36.3% | +15.9% |
| EPS | +58.9% | +54.8% | +18.4% | |
SITM | Revenue | +178.3% | +54.5% | +28.4% |
| EPS | +297.5% | +32.4% | +33.2% | |
MXL | Revenue | +66.7% | +78.3% | +32.3% |
| EPS | +583.6% | +135.9% | +22.8% | |
QCOM | Revenue | −1.5% | +4.6% | +16.0% |
| EPS | −11.5% | −4.0% | +28.2% | |
INDI | Revenue | +23.1% | +33.1% | +29.2% |
| EPS | −38.3% | −109.8% | +1156.1% | |
SMTC | Revenue | +15.6% | +43.4% | +35.9% |
| EPS | +119.3% | +115.4% | +82.8% | |
COHR | Revenue | +22.1% | +50.0% | +37.9% |
| EPS | +56.5% | +72.3% | +49.3% | |
LITE | Revenue | +83.9% | +110.8% | +57.6% |
| EPS | +314.0% | +164.8% | +61.2% | |
FN | Revenue | +35.6% | +32.5% | +19.7% |
| EPS | +36.2% | +31.8% | +19.9% | |
CRDO | Revenue | +211.9% | +85.0% | +49.7% |
| EPS | +423.2% | +86.8% | +48.2% | |
ALAB | Revenue | +129.5% | +61.3% | +29.7% |
| EPS | +124.4% | +62.4% | +27.3% | |
MRVL | Revenue | +42.4% | +47.4% | +61.9% |
| EPS | +82.6% | +48.1% | +72.8% | |
POET | Revenue | +451.9% | +1192.0% | +143.9% |
| EPS | −10.7% | −30.0% | −111.4% | |
SWKS | Revenue | −1.9% | +2.6% | +7.1% |
| EPS | −11.1% | −0.4% | +17.3% | |
NVDA | Revenue | +65.1% | +84.2% | +43.2% |
| EPS | +59.0% | +91.7% | +42.0% | |
ANET | Revenue | +42.6% | +30.8% | +24.6% |
| EPS | +42.6% | +27.9% | +23.2% | |
AVGO | Revenue | +67.2% | +64.4% | +61.7% |
| EPS | +73.0% | +65.2% | +58.8% | |
INTC | Revenue | +19.9% | +15.4% | +14.4% |
| EPS | +345.5% | +38.1% | +49.0% |
Forward fiscal years only. Blank means no analyst coverage for that year.
Applied Optoelectronics is shipping nearly twice the fiber-optic gear it was a year ago and keeping less of each dollar that comes in. The Sugar Land, Texas maker of optical modules, lasers and transceivers for internet data-center operators, cable and telecom equipment makers grew June-quarter revenue 86% year on year to $191.9m, and reported a gross margin of 27.7% against 30.3% a year earlier. Gross profit rose 71%, slower than sales, and the operating loss widened to $24.7m.
October's selling across the optical layer was read as a repricing of artificial-intelligence capital spending: a valuation event visited on companies whose order books were still filling. For most of the group that reading survives inspection. For Applied Optoelectronics it does not, because the two things a buyer could check without waiting for a quarterly report, what a shipped dollar earns and the price at which the capacity was financed, both moved against the company.
Mix, not volume, decides the transceiver margin
Management has been explicit about where margin comes from. "[T]he most important factor is the percentage of 1.6 terabit transceiver, because gross margin is very good," chief financial and strategy officer Stefan Murry told the second-quarter call on 6 August, adding that "the more we deliver for 1.6T, the high gross margin it would be." On a non-GAAP basis that quarter came in at 29.8%, inside the 29-30% guide but below 30.4% a year earlier, with the September quarter guided to 29.0-30.5%.
The volume is real. The company has a volume order above $200m for 1.6T data-center transceivers from a returning hyperscale customer, shipping from the third quarter and completing in the fourth after qualification, and by August had raised its end-2026 target to roughly 650,000 pieces a month of combined 800G and 1.6T product. Consensus has revenue more than doubling to $1.049bn this year and reaching $2.961bn in 2027.
The capacity was funded at $105.36
In October the company completed a $600m at-the-market equity program, selling 5,694,845 shares at an average $105.36 for about $588m net against 84.9m shares outstanding beforehand, roughly 6.7% dilution. The stock closed 30 October at $69.05, a third below that average and 69% below its 52-week closing high of $223.10. Price to trailing gross profit, the usable measure on a loss-making maker of hardware at half the group's margin, stands at 34.0x against 76.0x in mid-August.
Three peers got better at the same business
MACOM, the Lowell, Massachusetts maker of analog and photonic semiconductors from radio frequency through lightwave, grew July-quarter revenue 35.8% to $342.2m with gross margin up 4.6 points to 58.3% and operating income more than doubled to $77.1m. Its data-center line reached $137.6m, about 40% of revenue, on a record 1.6-to-1 book-to-bill that chief executive Stephen Daly attributed primarily to 1.6T and 800G platforms. September-quarter guidance of $415m-$425m at a 60-61% adjusted gross margin was set above the quarter just reported. It trades at 27.2x trailing gross profit against 38.0x in August, with a 27.5x forward price-earnings ratio set against fiscal 2027 consensus earnings of $8.54 a share.
SiTime, the Santa Clara maker of silicon MEMS precision timing, grew revenue 126.5% to $157.4m, lifted gross margin 11.1 points to 63.0% and crossed into operating profit at $8.2m. Chief executive Rajesh Vashist tied that to content: hyperscaler adoption of synchronization "has increased demand for our elite family of super TCXOs adding several hundred dollars of content with data center rack," he said on the second-quarter call. The second-half step-change, though, is bought as much as grown: the Renesas timing business closed on 1 July, adding more than 550 clocking products with nearly 75% of its revenue in AI, data-center and communications uses. The September quarter is guided to $285m-$295m, and at 48.8x trailing gross profit against 82.0x in August it remains the dearest of the four.
MaxLinear is the one that reported inside the selloff. Its Infrastructure segment ran about $125m of third-quarter revenue, up 210% and more than half the company, and it lifted its 2026 optical data-center outlook to $250m-$270m from $150m-$170m. "The ASP on the DSP is more or less doubling, and then we have TIA that we did not add before. So all in all, we will we will be growing more than 2x on the ASP number," chief executive Kishore Seendripu said on 22 October. Gross margin reached 58.7% from 56.6% and operating income swung to $30.2m from a $30.0m loss. At 16.0x trailing gross profit it is the cheapest of the four, and the only one whose share price has held its uptrend.
What October priced, and what it could not know
None of these companies had published a September quarter when the marks were taken: SiTime reports 4 November, Applied Optoelectronics and MACOM on 5 November. Outside the shelf the whole optical complex fell the same 22-30% over 30 days, Coherent 26.9% and Credo 22.5% among them, while the S&P 500 tracker fell 0.9% and Qualcomm, the handset name in the same group, 8.9%. Two sessions carried most of it: pre-earnings selling on 22 October, and 30 October, when Intel guided fourth-quarter revenue to $15bn-$16bn against $17.29bn consensus and the Nasdaq Composite closed down 2.86%.
So the decline prices one buyer's budget rather than anything the shipped business did. On the dollar content per link, the direction is up and documented: a doubling DSP price with a transimpedance amplifier attached beside it, several hundred dollars of timing per rack, a data-center analog line growing 74%. Three of the four turned that into wider margins. The fourth turned it into revenue.
Applied Optoelectronics has the plants, the order and a customer back above 10% of revenue. What it has not yet shown is that a 1.6T module earns more than the 800G one it replaces, and it has already sold the stock that paid for the building.