

Fabrinet's Sales Rose 45% and Its Gross Margin Stayed Where It Was Five Years Ago
Hypothesis Opus 5 · Research Opus 5 · Writing Opus 5 · Prompt v1.7
Fabrinet just finished the best year in its history and kept the same twelve cents of gross profit on every sales dollar it kept five years ago. Revenue in the June quarter rose 45% to $1.316bn, data-center work passed half of sales for the first time, and the gross margin moved four basis points.
That is what an assembly fee looks like: the company owns the factory and the labor, not the optics flowing through its revenue line. The mix of the 1.6-terabit upgrade lands elsewhere, at Lumentum's 47.4% gross margin and Amphenol's 40.5%, both of which widened over the year while Fabrinet's did not.
The oddity is price. Shares changed hands at 31.3x trailing gross profit against Amphenol's 19.2x, so the thinnest layer of the optical link carries the dearest gross-profit dollar in the chain.
| Ticker | Company | Segment | Trend · 13mo | 30D | 1Y |
|---|---|---|---|---|---|
| The subject · what this brief is about | |||||
FN | Fabrinet | Specialty Manufacturing & Components | 🔴 Cont. Bear | +15.4% | +27.8% |
GLW | Corning | Display & Optical Materials | ⚠️ Emerging Bear | −6.8% | +81.0% |
COMM | CommScope | Communication Equipment | 🔴 Cont. Bear | — | — |
| Compared against · context, not the story | |||||
APH | Amphenol | Connectors & Interconnect Systems | ⚠️ Emerging Bear | +7.2% | −30.8% |
LITE | Lumentum | Optical Transport & Switching | 🟢 Cont. Bull | +9.4% | +595.0% |
CIEN | Ciena | Optical Transport & Switching | ⚠️ Emerging Bear | +32.7% | +175.5% |
BDC | Belden | Enterprise Networking Infrastructure | 🔴 Cont. Bear | −7.6% | −3.8% |
TEL | TE Connectivity | Connectors & Interconnect Systems | ⚠️ Emerging Bear | +6.1% | −2.0% |
LUMN | Lumen Technologies | Broadband & Fixed Services | 🔴 Cont. Bear | −18.5% | −22.7% |
COHR | Coherent | Instrumentation & Test Equipment | ⚠️ Emerging Bear | +1.8% | +155.9% |
AAOI | Applied Optoelectronics | RF & Wireless | ⚠️ Emerging Bear | −0.9% | +239.5% |
MRVL | Marvell Technology | Specialty Semiconductors | 🟢 Cont. Bull | +15.4% | +202.3% |
ANET | Arista Networks | Cloud Networking | 🟢 Cont. Bull | +11.4% | +36.9% |
AVGO | Broadcom | Semiconductor Subsystems | ⚠️ Emerging Bear | +1.0% | +5.7% |
TMUS | T-Mobile US | Wireless Carriers | 🔴 Cont. Bear | −16.0% | −33.5% |
T | AT&T | Wireless Carriers | 🌱 Emerging Bull | −11.5% | −12.2% |
VZ | Verizon Communications | Wireless Carriers | 🟢 Cont. Bull | −15.6% | +7.0% |
CCI | Crown Castle | Wireless & Fiber Infrastructure | 🔴 Cont. Bear | +5.0% | −16.0% |
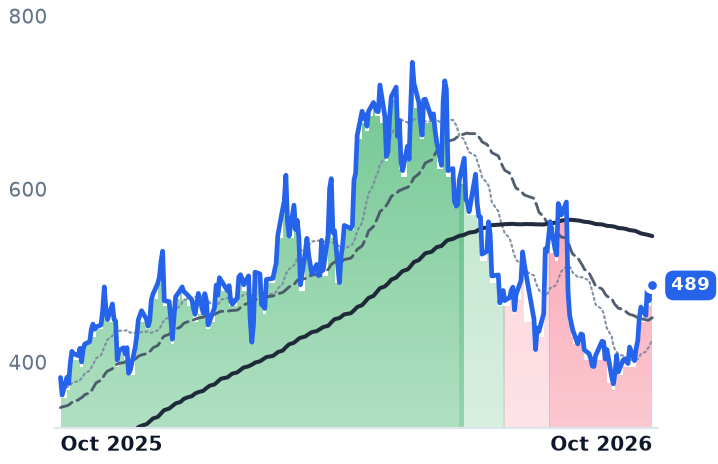
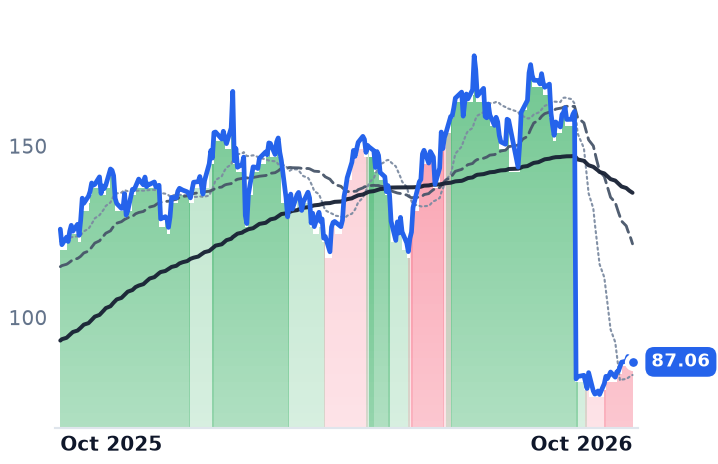
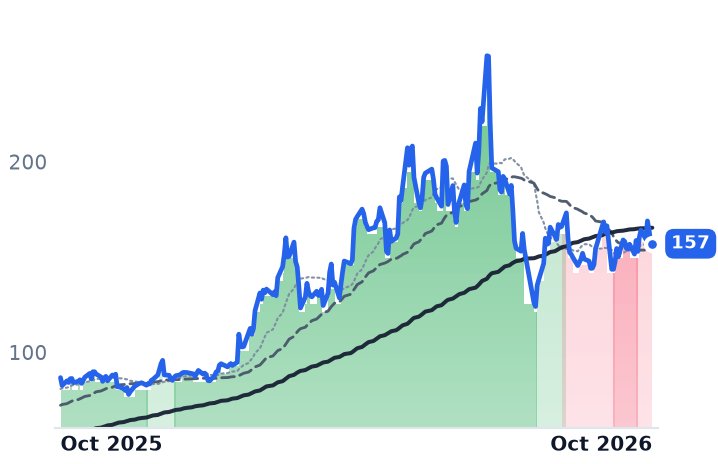
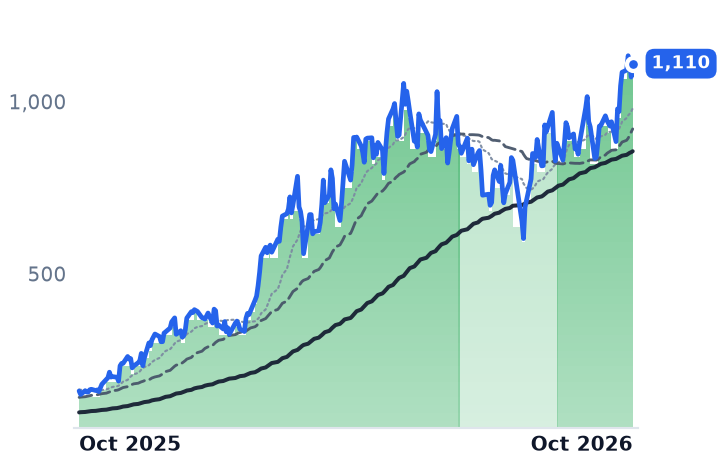
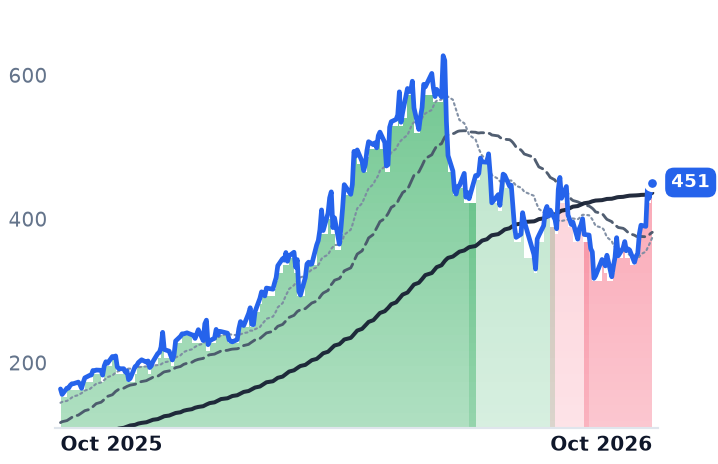
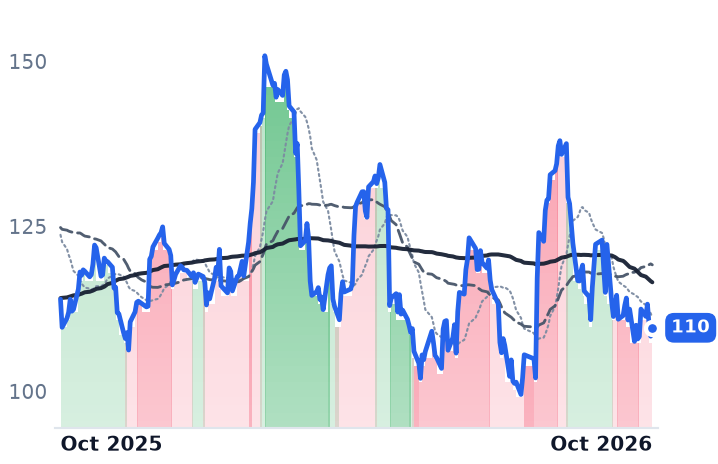
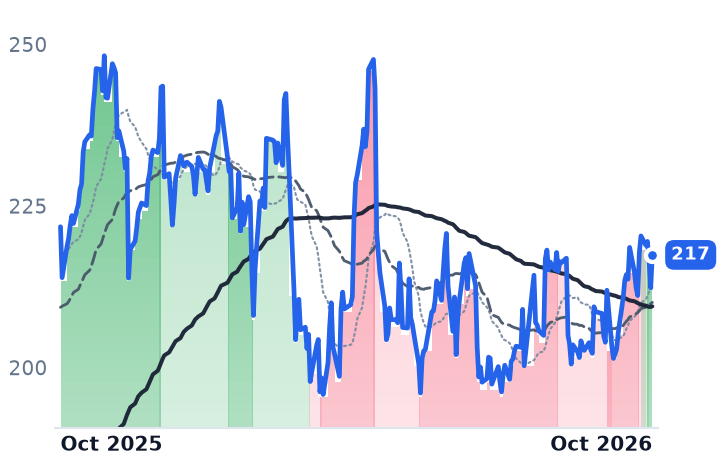
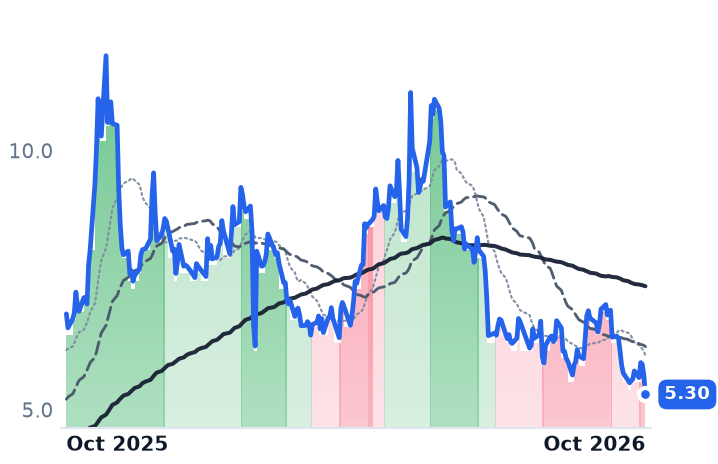
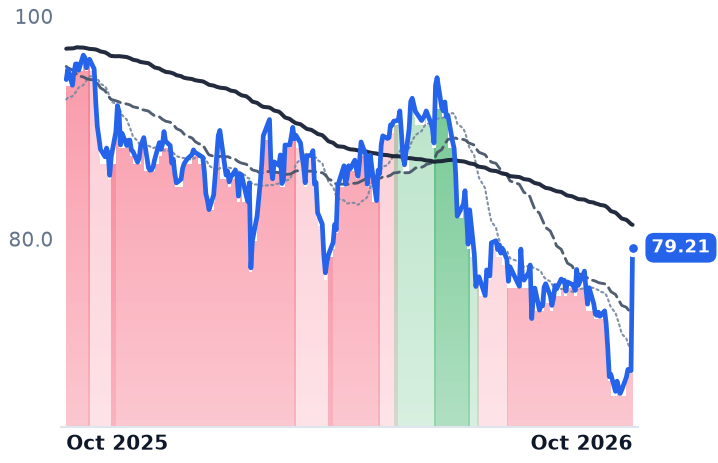
12-month price & trend
| Ticker | Mkt cap | P/E | P/E fwd | P/S | P/S fwd | P/GP | P/GP fwd | EV/EBITDA | FCF yld |
|---|---|---|---|---|---|---|---|---|---|
FN | $17.4B | 36.8x | 26.7x | 3.8x | 2.9x | 31.3x | 23.9x | 27.4x | 0.0% |
APH | $214.4B | 41.4x | 32.7x | 7.4x | 6.0x | 19.2x | 15.7x | 24.4x | 2.2% |
GLW | $135.0B | 70.9x | 47.7x | 8.0x | 7.0x | 21.9x | 19.3x | 33.4x | 1.8% |
| Ticker | Mkt cap | P/E | P/E fwd | P/S | P/S fwd | P/GP | P/GP fwd | EV/EBITDA | FCF yld |
|---|---|---|---|---|---|---|---|---|---|
LITE | $85.8B | n/m | 50.8x | 28.5x | 13.6x | 68.4x | 32.7x | n/m | 0.6% |
COMM | $3.9B | 0.6x | 11.7x | 17.7x | 0.9x | 20.7x | 1.1x | n/m | 2.2% |
CIEN | $56.0B | 128.1x | 60.5x | 10.1x | 8.9x | 23.4x | 20.6x | 77.4x | 1.5% |
| Ticker | Mkt cap | P/E | P/E fwd | P/S | P/S fwd | P/GP | P/GP fwd | EV/EBITDA | FCF yld |
|---|---|---|---|---|---|---|---|---|---|
BDC | $4.4B | 18.1x | 13.0x | 1.5x | 1.3x | 4.2x | 3.6x | 11.9x | 4.8% |
TEL | $63.9B | 21.4x | 17.0x | 3.3x | 2.9x | 9.4x | 8.3x | 13.8x | 5.7% |
LUMN | $5.7B | n/m | — | 0.5x | 0.5x | 1.0x | 1.1x | 7.7x | 14.7% |
| Ticker | Mkt cap | P/E | P/E fwd | P/S | P/S fwd | P/GP | P/GP fwd | EV/EBITDA | FCF yld |
|---|---|---|---|---|---|---|---|---|---|
COHR | $57.6B | 67.7x | 31.2x | 8.1x | 5.4x | 21.6x | 14.5x | 38.5x | -1.8% |
AAOI | $9.1B | n/m | 153.1x | 15.3x | 8.7x | 52.7x | 30.0x | n/m | -4.5% |
MRVL | $230.5B | 92.0x | 65.3x | 26.4x | 20.1x | 52.2x | 39.7x | 50.5x | 0.7% |
| Ticker | Mkt cap | P/E | P/E fwd | P/S | P/S fwd | P/GP | P/GP fwd | EV/EBITDA | FCF yld |
|---|---|---|---|---|---|---|---|---|---|
ANET | $258.7B | 64.0x | 50.0x | 24.5x | 20.4x | 38.9x | 32.4x | 50.2x | 2.0% |
AVGO | $1.7T | 45.0x | 31.1x | 19.4x | 16.3x | 28.6x | 24.1x | 33.7x | 2.3% |
TMUS | $195.9B | 19.1x | 16.7x | 2.1x | 2.1x | 3.9x | 3.8x | 10.9x | 7.8% |
| Ticker | Mkt cap | P/E | P/E fwd | P/S | P/S fwd | P/GP | P/GP fwd | EV/EBITDA | FCF yld |
|---|---|---|---|---|---|---|---|---|---|
T | $170.5B | 8.2x | 10.6x | 1.3x | 1.3x | 2.2x | 2.2x | 5.9x | 10.4% |
VZ | $202.4B | 12.6x | 9.7x | 1.5x | 1.4x | 2.5x | 2.4x | 8.1x | 10.6% |
CCI | $33.0B | 30.6x | 39.3x | 7.9x | 8.2x | 12.5x | 12.9x | 20.4x | 7.3% |
Consensus projections
| Ticker | FY2026E | FY2027E | FY2028E | |
|---|---|---|---|---|
FN | Revenue | +35.6% | +32.3% | +19.4% |
| EPS | +36.2% | +31.5% | +19.4% | |
APH | Revenue | +55.3% | +18.5% | +12.8% |
| EPS | +61.0% | +22.8% | +14.1% | |
GLW | Revenue | +17.8% | +19.0% | +21.2% |
| EPS | +30.3% | +32.6% | +36.8% | |
LITE | Revenue | +83.9% | +109.7% | +55.7% |
| EPS | +314.0% | +163.8% | +58.5% | |
COMM | Revenue | −21.8% | +65.4% | — |
| EPS | −7.9% | +40.8% | — | |
CIEN | Revenue | +34.4% | +26.9% | +27.3% |
| EPS | +160.5% | +48.0% | +47.5% | |
BDC | Revenue | +25.2% | +17.0% | +5.1% |
| EPS | +16.3% | +15.5% | +11.8% | |
TEL | Revenue | +16.1% | +9.6% | +6.8% |
| EPS | +33.1% | +13.5% | +10.8% | |
LUMN | Revenue | −10.4% | −3.8% | −1.4% |
| EPS | +41.1% | −64.4% | −30.2% | |
COHR | Revenue | +22.1% | +49.9% | +37.5% |
| EPS | +56.5% | +72.3% | +48.9% | |
AAOI | Revenue | +131.7% | +182.3% | +72.7% |
| EPS | −327.3% | +650.2% | +92.2% | |
MRVL | Revenue | +42.4% | +40.1% | +44.0% |
| EPS | +82.6% | +41.9% | +51.9% | |
ANET | Revenue | +42.4% | +29.9% | +23.8% |
| EPS | +42.5% | +27.2% | +22.3% | |
AVGO | Revenue | +67.1% | +63.9% | +62.1% |
| EPS | +73.0% | +64.9% | +58.6% | |
TMUS | Revenue | +7.1% | +4.4% | +4.0% |
| EPS | +10.2% | +27.4% | +20.0% | |
T | Revenue | +3.4% | +2.1% | +2.1% |
| EPS | +13.6% | +9.4% | +13.7% | |
VZ | Revenue | +2.3% | +1.7% | +1.1% |
| EPS | +6.8% | +4.7% | +7.1% | |
CCI | Revenue | −5.0% | +1.3% | +2.3% |
| EPS | +106.7% | +47.3% | +4.8% |
Forward fiscal years only. Blank means no analyst coverage for that year.
Fabrinet, the Thailand-based contract manufacturer that assembles optical transceivers and modules under other companies' brands, closed its fiscal year in June with quarterly revenue up 45% and data-center work past half of sales for the first time. Its gross margin was 12.27%, against 12.23% a year earlier.
The year has been read as Fabrinet claiming its share of the 800-gigabit and 1.6-terabit upgrade. The accounts say it claimed the volume and none of the mix. Gross margin has been pinned between 11.6% and 12.7% in each of the last eight quarters and each of the last five fiscal years, a band that does not move with revenue, because Fabrinet is paid a fee for building to customer specification with customer-specified content passing through its revenue. Growth buys operating leverage below the gross line and nothing above it.
The fee holds at twelve cents whatever the volume
Full-year revenue rose 35.7% to $4.641bn and operating income rose 42.7%, lifting GAAP operating margin to 10.48% in the June quarter from 9.63% in September 2025. On the company's own non-GAAP basis, gross margin was 12.2%, ten basis points better sequentially and thirty worse year on year, while non-GAAP operating margin of 10.9% was the highest in three years. Both readings agree: a 45% revenue gain did not widen the fee.
The demand is not in question. Data-center revenue reached $669m, up 68% year on year and 51% of the total, covering transceivers, data-center interconnect, silicon photonics and co-packaged optics. "Our fourth quarter was exceptional, capping off a remarkable year of accelerating growth and strong momentum," chief executive Seamus Grady said in the results release of 17 August 2026. Reported growth accelerated through all four quarters of the year, from 21.6% to 44.6%, and consensus has fiscal 2027 revenue at $6.09bn, a mild deceleration rather than a break.
Four customers, 57% of the year
What Fabrinet manages is not demand but who the demand belongs to. Cisco at 19.9%, NVIDIA at 16.3%, Nokia at 10.7% and Amazon at 10.5% each cleared the 10% disclosure line in fiscal 2026, 57.4% of revenue between them, so one program transition decides a quarter. At Rosenblatt's technology summit after the results, management said the data-center interconnect line had reached a $1bn run rate, up 140%, and that it would build interconnect products for NVIDIA's competitors — concentration, named as the risk being worked on.
The capacity plan is the other side of the fee. Fabrinet exited the year at a $5.3bn annualized run rate with a stated path toward $12.5bn-$14bn: office conversions at Pinehurst to $5.5bn-$5.8bn, Building 10 at Chonburi adding $3bn-$3.5bn by early 2027, two further Chonburi plants of roughly 1.2m square feet each adding $1.8bn-$2.1bn apiece. Scale is the product.
Where the link's margin actually sits
Rank the most recent reported quarters along the bill of materials of an optical link and the gross margin falls as you move from light to labor. Lumentum, which makes the lasers, modulators and transceiver engines, earned 47.4% on revenue up 109%, fourteen percentage points better than a year earlier. Amphenol, the connector and interconnect maker whose IT datacom market was 43% of second-quarter sales and grew 89% on record orders and a 1.23:1 book-to-bill, earned 40.5%, up four points. Corning's consolidated glass, fiber and connectivity margin was 36.1%, flat. Fabrinet's was 12.3%.
Price runs the other way. Fabrinet's shares carry 31.3x trailing and 23.9x forward gross profit; Amphenol's carry 19.2x trailing. The chain's thinnest layer holds its dearest gross-profit dollar.
What fell, and what did it
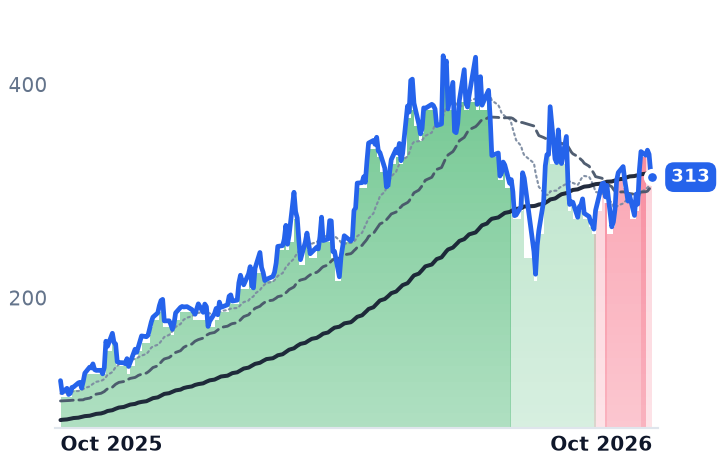
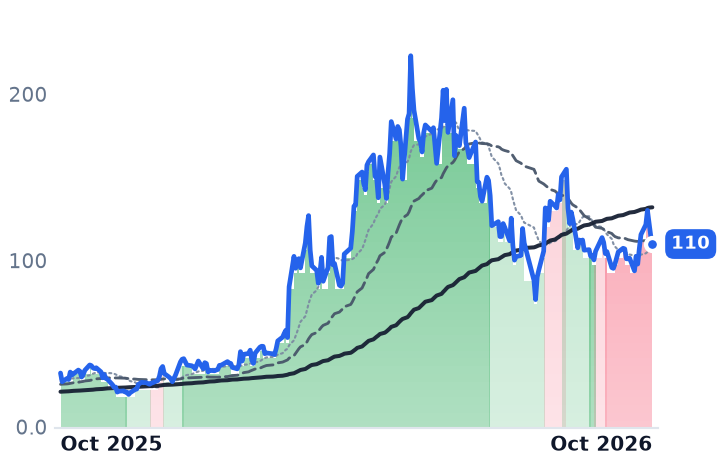
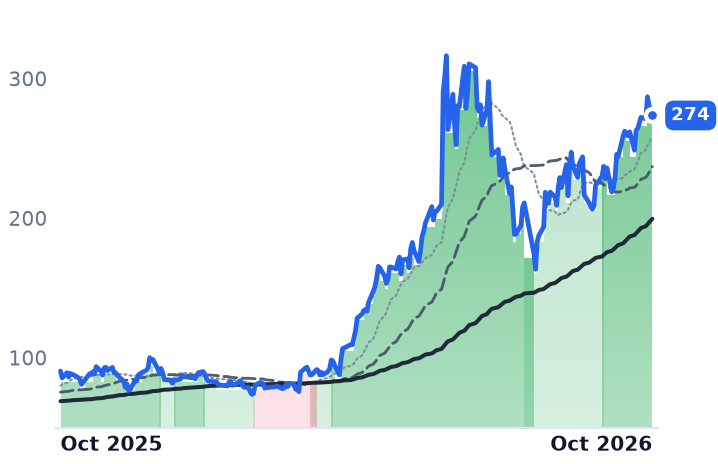
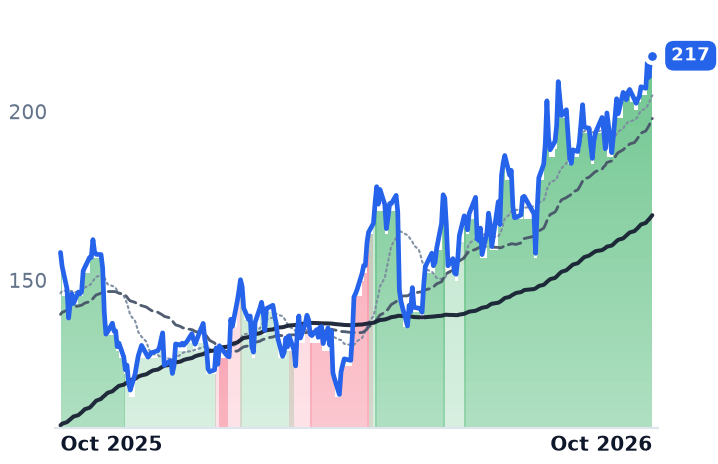
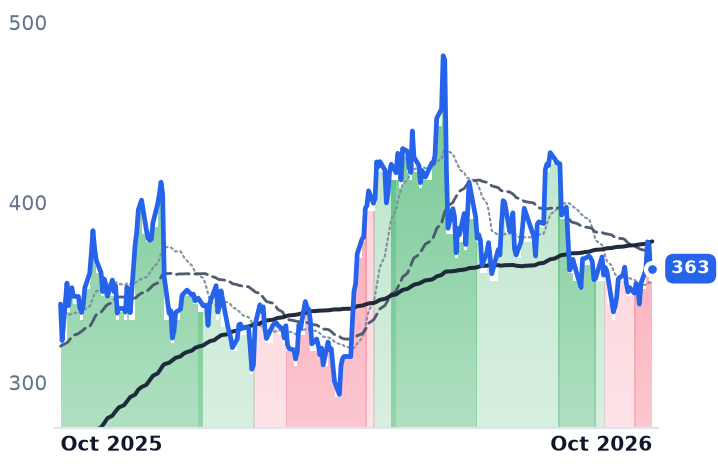
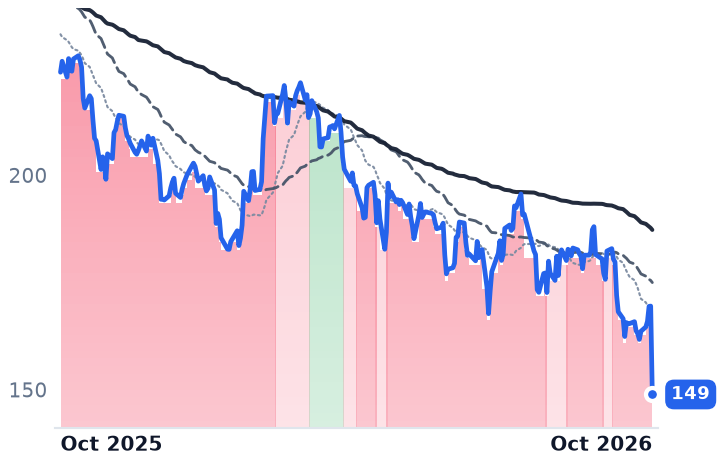
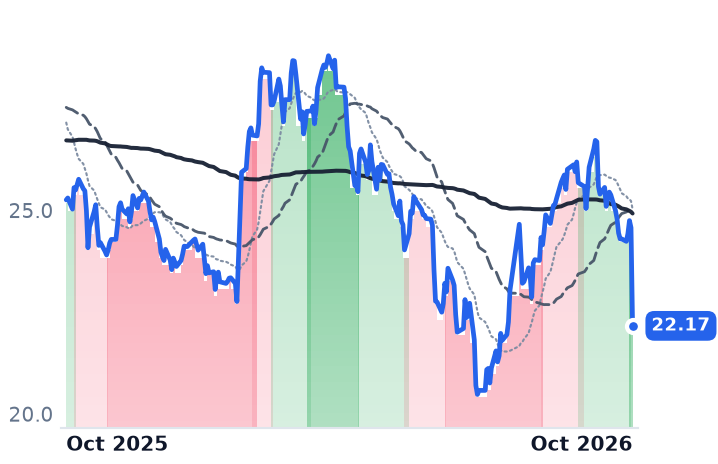
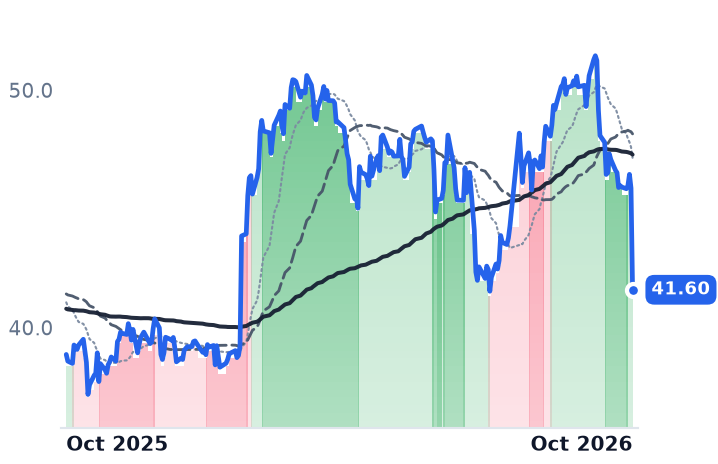
Fabrinet is down 26.2% over six months and up 15.4% over thirty days, and the gross-profit multiple has compressed by roughly a third from the 47.7x of 11 May 2026. Nothing in the operating record explains that: revenue growth, data-center share and operating margin all moved the other way. The identifiable shock was financing, not demand. When Corning disclosed a $2bn at-the-market equity program in mid-September its shares fell as much as 13.6%, and Coherent dropped 11%, Lumentum 9% and Fabrinet 6% in the same session. The 9 October carrier rout on SpaceX's agreement to buy 800-megahertz spectrum licences never reached the suppliers: Corning closed 0.4% lower, Fabrinet 0.3%.
Corning itself has kept de-rating at the margin, to 21.9x trailing gross profit against 26.3x in May, with quarterly revenue growth easing from 20.4% to 16.6% and consolidated gross margin flat. It reports third-quarter results on 27 October against management guidance of about 16% core sales growth to $4.9bn-$5.0bn and core earnings of $0.85-$0.89 a share.
So the markdown across the optical complex is not one judgment about photons. It is three differently paid businesses: an engine maker whose margin widens with speed, a connector maker whose margin widens with volume, and an assembler whose margin is a contract term. Only the first two capture the upgrade in the price of what they ship. Fabrinet captures it in square feet.
Two new Chonburi factories are meant to add about $2bn of revenue each. On the fee Fabrinet has earned for five years, each of them brings home roughly a quarter of a billion dollars of gross profit, and the content inside still belongs to somebody else.