

Half of AECOM's Revenue Is Pass-Through Cost, and Its $337m Loss Came From There
Hypothesis Opus 5 · Research Opus 5 · Writing Opus 5 · Prompt v1.6
The engineering firms that design America's grid, water and transport projects have lost roughly half their market value in a year, and the work is not what broke. AECOM's design fee line grew 4% last quarter on a record $27.8bn backlog; Stantec and Willdan both raised their 2026 targets, Willdan twice.
What did break sits in the part of the reported top line nobody earns a fee on. AECOM booked a $337m charge on a construction-management project, in a unit it had just decided to keep, cutting full-year adjusted earnings guidance by about 30%. That damage is real and it is located in the pass-through layer. The de-rating to 9.3x forward earnings, against 22-24x in May, is something else: an AI discount on billable hours that no reported number yet shows.
| Ticker | Company | Segment | Trend · 13mo | 30D | 1Y |
|---|---|---|---|---|---|
| The subject · what this brief is about | |||||
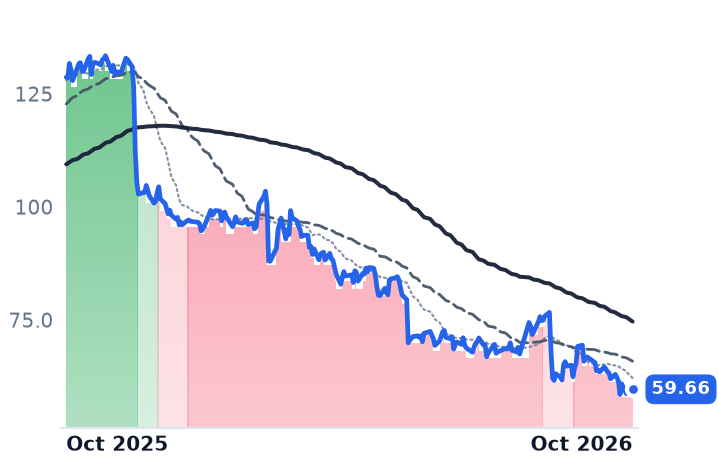
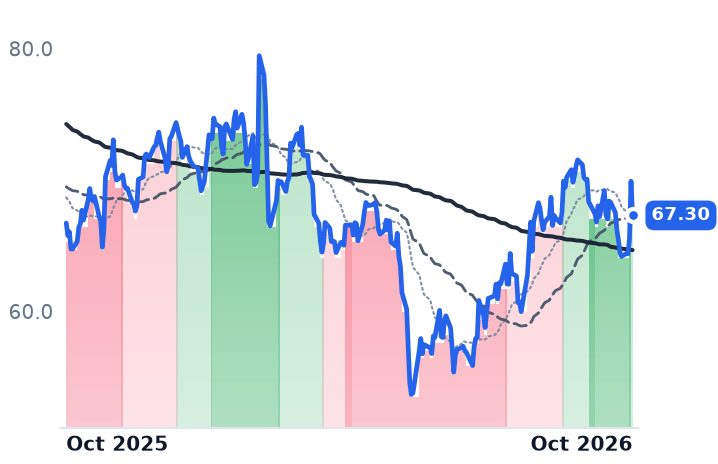
ACM | Aecom | Design & Engineering Consulting | 🔴 Cont. Bear | −10.4% | −53.6% |
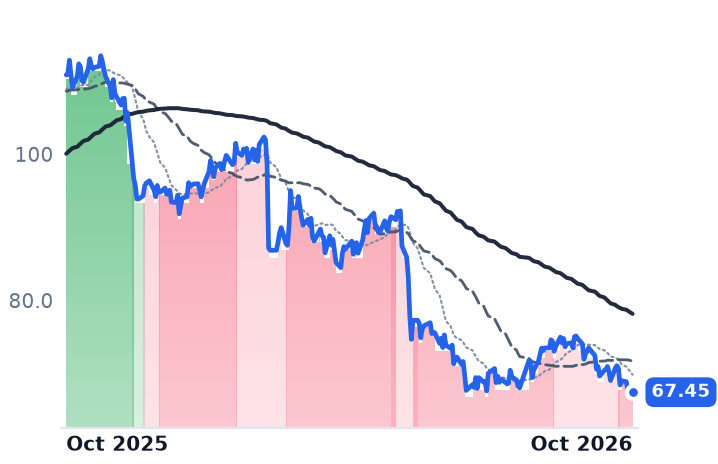
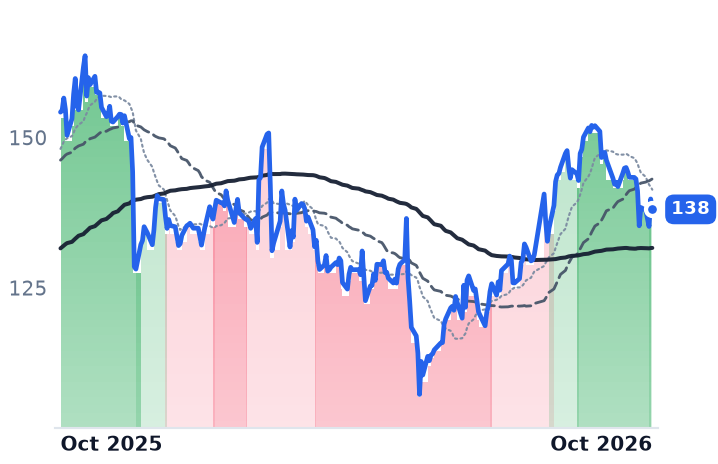
STN | Stantec | Design & Engineering Consulting | 🔴 Cont. Bear | −8.3% | −39.1% |
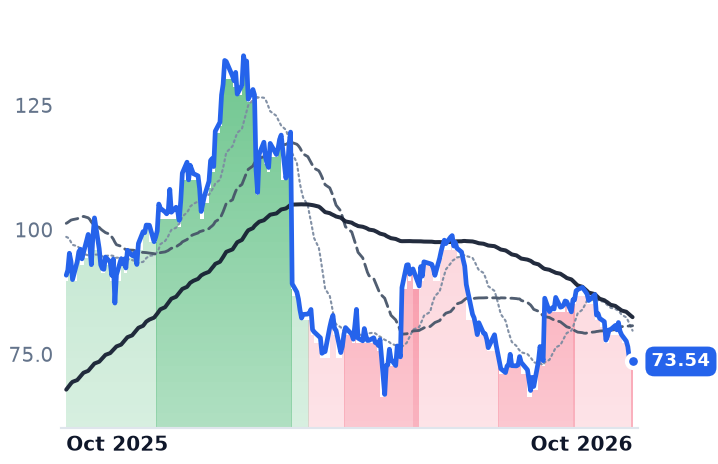
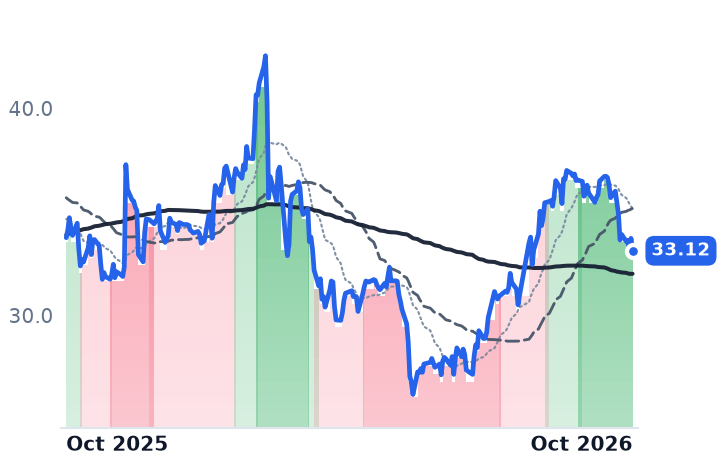
WLDN | Willdan | Design & Engineering Consulting | 🔴 Cont. Bear | −14.3% | −19.1% |
| Compared against · context, not the story | |||||
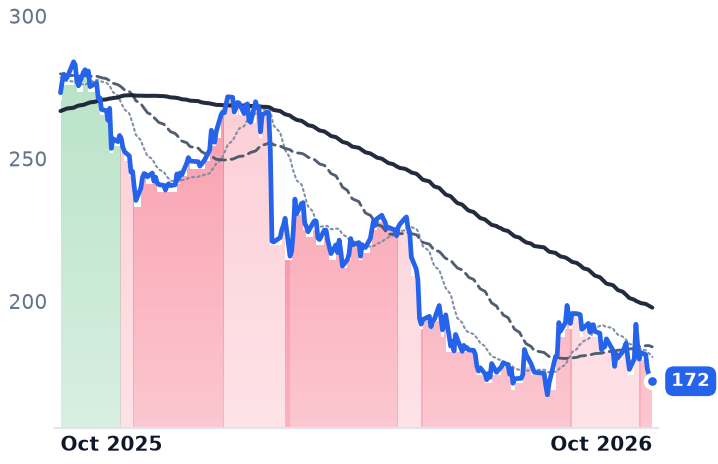
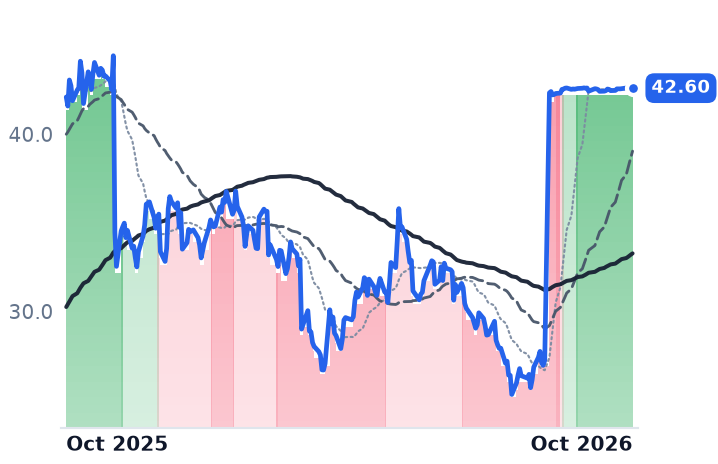
WSP.TO | WSP Global | Engineering & Construction | 🔴 Cont. Bear | −8.0% | −37.0% |
EXPO | Exponent | Technical & Engineering Consulting | 🌱 Emerging Bull | −1.5% | +0.9% |
J | Jacobs Solutions | Design & Engineering Consulting | 🌱 Emerging Bull | −5.6% | −10.5% |
TTEK | Tetra Tech | Design & Engineering Consulting | 🌱 Emerging Bull | −7.8% | −1.9% |
BWMN | Bowman Consulting | Design & Engineering Consulting | 🌱 Emerging Bull | +0.4% | +1.2% |
TIC | TIC Solutions | Testing, Inspection & Certification | 🌱 Emerging Bull | −11.8% | −39.9% |
LDOS | Leidos | Defense & Government Solutions | 🔴 Cont. Bear | −11.5% | −40.3% |
ULS | UL Solutions | Testing, Inspection & Certification | ⚠️ Emerging Bear | −10.6% | −10.3% |
MG | Mistras | Asset Inspection & Monitoring | 🟢 Cont. Bull | +8.0% | +111.6% |
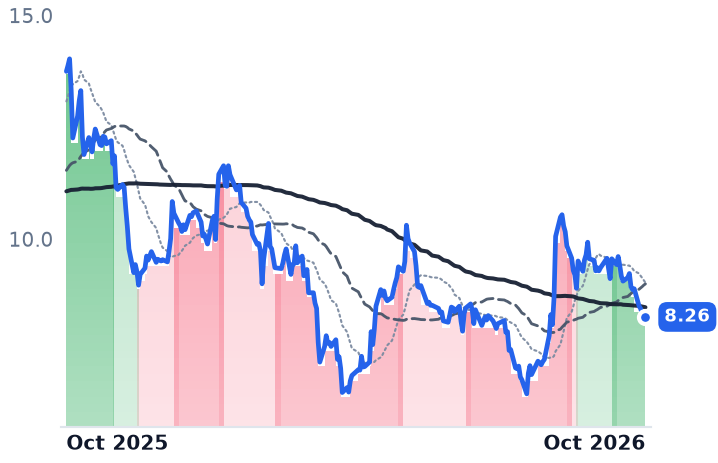
12-month price & trend
| Ticker | Mkt cap | P/E | P/E fwd | P/S | P/S fwd | P/GP | P/GP fwd | EV/EBITDA | FCF yld |
|---|---|---|---|---|---|---|---|---|---|
ACM | $7.7B | 27.0x | 9.3x | 0.5x | 1.0x | 8.8x | 16.9x | n/m | 2.7% |
STN | $7.7B | 21.7x | 15.5x | 1.4x | 1.1x | 3.1x | 2.5x | 11.7x | 6.1% |
WSP.TO | $23.2B | 24.4x | 15.1x | 1.2x | 1.4x | 6.8x | 7.9x | 13.0x | 6.6% |
| Ticker | Mkt cap | P/E | P/E fwd | P/S | P/S fwd | P/GP | P/GP fwd | EV/EBITDA | FCF yld |
|---|---|---|---|---|---|---|---|---|---|
WLDN | $1.1B | 16.6x | 14.4x | 1.5x | 2.6x | 4.0x | 6.9x | 14.6x | 5.6% |
EXPO | $3.3B | 30.2x | 29.2x | 5.2x | 5.5x | 21.0x | 22.5x | 21.4x | 3.3% |
J | $16.3B | 48.1x | 16.6x | 1.1x | 1.6x | 5.2x | 7.3x | 21.2x | 4.0% |
| Ticker | Mkt cap | P/E | P/E fwd | P/S | P/S fwd | P/GP | P/GP fwd | EV/EBITDA | FCF yld |
|---|---|---|---|---|---|---|---|---|---|
TTEK | $8.6B | 19.8x | 19.1x | 1.7x | 1.9x | 9.0x | 10.1x | 14.1x | 6.4% |
BWMN | $745.8M | 101.4x | 21.9x | 1.4x | 1.4x | 3.0x | 3.1x | 31.3x | 1.6% |
TIC | $1.8B | n/m | — | 0.9x | 0.8x | 2.8x | 2.6x | 14.5x | -0.1% |
| Ticker | Mkt cap | P/E | P/E fwd | P/S | P/S fwd | P/GP | P/GP fwd | EV/EBITDA | FCF yld |
|---|---|---|---|---|---|---|---|---|---|
LDOS | $14.8B | 10.9x | 9.5x | 0.8x | 0.8x | 4.8x | 4.6x | 9.0x | 14.6% |
ULS | $13.3B | 26.3x | 28.5x | 4.2x | 4.1x | 8.4x | 8.2x | 13.7x | 3.3% |
MG | $657.0M | 24.4x | 20.3x | 0.9x | 0.9x | 3.2x | 3.2x | 10.2x | 4.1% |
Consensus projections
| Ticker | FY2026E | FY2027E | FY2028E | |
|---|---|---|---|---|
ACM | Revenue | −2.9% | +8.6% | +5.8% |
| EPS | −24.1% | +60.4% | +14.2% | |
STN | Revenue | +9.2% | +6.0% | +4.8% |
| EPS | +13.4% | +11.8% | +12.3% | |
WSP.TO | Revenue | +19.1% | +7.1% | +6.4% |
| EPS | +18.5% | +15.1% | +13.7% | |
WLDN | Revenue | +24.5% | +16.5% | +12.6% |
| EPS | +109.3% | +23.9% | +4.1% | |
EXPO | Revenue | +4.1% | +10.0% | +7.5% |
| EPS | −0.3% | +12.3% | +14.0% | |
J | Revenue | −20.5% | +6.3% | +6.5% |
| EPS | +19.7% | +14.3% | +15.5% | |
TTEK | Revenue | −3.5% | +4.3% | +1.8% |
| EPS | +4.1% | +10.2% | +8.2% | |
BWMN | Revenue | +20.8% | +12.5% | — |
| EPS | +19.1% | +26.9% | — | |
TIC | Revenue | +43.5% | +4.9% | +4.2% |
| EPS | +391.1% | −88.6% | +9.1% | |
LDOS | Revenue | +5.2% | +6.1% | +4.7% |
| EPS | +17.1% | +4.6% | +2.9% | |
ULS | Revenue | +5.5% | +7.2% | +7.0% |
| EPS | +22.1% | +12.1% | +10.3% | |
MG | Revenue | +4.0% | +5.0% | +5.0% |
| EPS | +19.4% | +23.2% | +16.8% |
Forward fiscal years only. Blank means no analyst coverage for that year.
AECOM spent much of last year weighing a sale of its construction-management arm, concluded this year that it would keep it, and then took a $337m pre-tax charge on one of that unit's projects, the result of subcontractor productivity running below plan, delaying completion and raising the estimated cost to finish, according to the company's third-quarter release.
Where the loss landed is the story. AECOM, a Dallas infrastructure consultancy with 51,000 staff that plans, designs and manages transport, water and government projects, is not paid for "infrastructure spending" in any way its revenue line makes legible. It bills chargeable hours at a multiplier on cost, then collects subcontractor and other pass-through cost on top of that fee. Full-year 2026 net service revenue, the fee stripped of pass-throughs, is guided to $7.30bn-$7.35bn against $16.14bn of reported revenue last year. More than half the top line is money AECOM collects and earns no fee on, and the charge came out of that half.
The fee grew; the earnings guidance did not survive
The fee layer did what it has been doing. Design net service revenue rose 4% in the quarter, 5% adjusted for one fewer working day, with the Americas up 6%. Backlog reached a record $27.8bn, up 13%, on record quarterly wins of $4.2bn. "Our backlog increased 13% to a new all-time high on record quarterly wins and a 1.6 book-to-burn across the business, including 1.8 times in the Americas," chief executive W. Troy Rudd said on the August earnings call.
The accounting still bit. AECOM cut full-year adjusted earnings guidance to $3.95-$4.15 a share from the $5.65-$5.85 it set out in November, and trimmed the net service revenue target it would otherwise have carried. Shares fell 19% over the two sessions after the print on roughly triple normal volume, and are down 54% over twelve months. Consensus for fiscal 2027 sits at $6.38, implying the charge is treated as a one-off; at a $7.67bn market value the stock costs 9.3x that, against the 22-24x forward it carried in May, when its market capitalization was near $15bn.
Three firms raised guidance into the selling
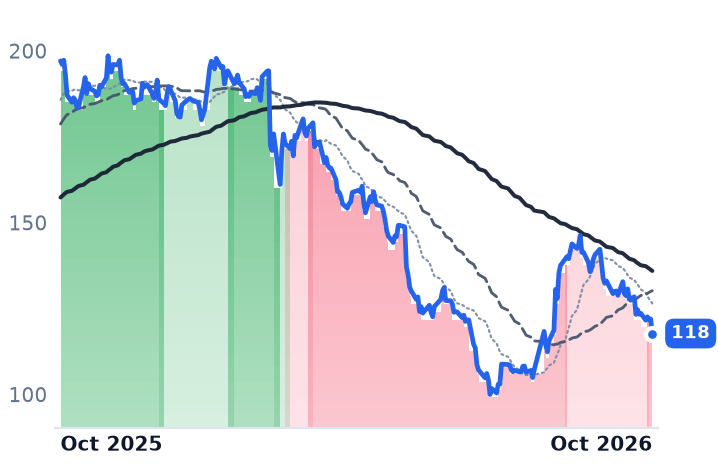
Nothing comparable broke at the others. Stantec, the Edmonton engineering and environmental consultancy, grew net revenue 11.5% in its second quarter, 3.7% of it organic, lifted backlog 17.5% to $9.2bn and raised its full-year margin target after posting an 18.7% adjusted margin on net revenue. Its shares fell 38% over the year, taking the forward earnings multiple to 15.5x from 21.7x trailing. WSP Global, the Montreal consultancy with 84,600 employees, grew second-quarter revenue 19.9% with operating margin up to 10.8% from 9.7%, though net income fell 12%; it trades at 15.1x consensus 2026 earnings, which are forecast up 18.5%.
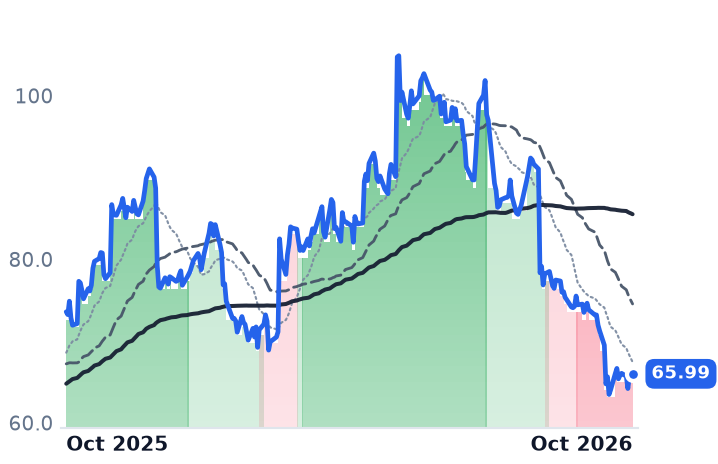
Willdan is the sharpest case. The Anaheim firm runs utility energy-efficiency and grid-optimization programs for cities, school districts and investor-owned utilities, and its gross revenue is close to meaningless: $231m of contract revenue in the June quarter produced $117m of net revenue, with adjusted earnings before interest, tax, depreciation and amortization up 51% to a record 28.2% margin on that fee. "Net revenue grew 23% year over year, including 18% organic growth," chief executive Mike Bieber said on the August 6 call, adding that the company was raising its 2026 targets. It has now raised the adjusted earnings target to $103m-$107m from the $85m-$90m set in February. The shares are 43% below their February high.
What the market is actually marking down
The reason is named, and it is not demand. Investors fear AI will do cheaply what consultants bill hefty fees for, cutting the billable hours a task requires and handing clients an argument for lower pricing. Bloomberg reported on September 29 that the Canadian firms are pushing back: Susan Reisbord, Stantec's incoming chief executive, told the Bloomberg Canadian Finance Conference in New York that AI is a productivity tool like others the firm has long used, that "we can't pull back a bridge or a road", and that "we have a big responsibility to be able to use it in the work that we provide by having the belts and suspenders to make sure that it's a safe use." WSP's Alexandre L'Heureux pointed to "a huge gap, or a big difference" in the scale of digital services clients now need against five years ago.
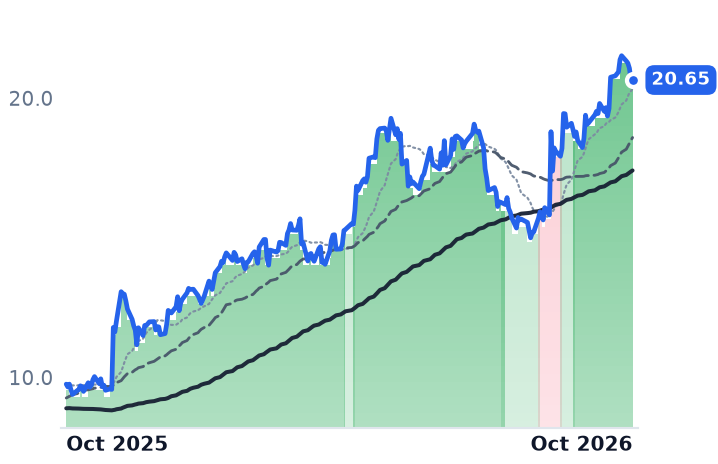
The discount is also oddly selective. Exponent, the Menlo Park failure-analysis and litigation-support consultancy and the purest chargeable-hours business of the group, grew second-quarter revenue 21% and still costs 30.2x trailing and 29.2x forward earnings. If AI were repricing the billable hour as such, that is the multiple that should have gone first.
So the verdict splits. AECOM's guidance cut earns a real part of its fall, and it is a reminder that the pass-through layer carries construction risk without carrying a fee. Beyond that, nothing in the reported numbers explains these moves: three of the four firms raised targets this summer and were sold anyway. The likelier reading is that the market is discounting the hour rather than the order book, which means dollar backlog is becoming the wrong gauge; fee per head, pricing on renewals and organic net revenue growth are the ones that would show the damage if it is coming.
The one piece of damage anyone can currently point to came from neither AI nor a shrinking pipeline. It came from a subcontractor falling behind on a job in the business AECOM had already tried to sell.