

CNX Hedged 2027 Gas at $3.31 per Thousand Cubic Feet and Fell Hardest in Appalachia
Hypothesis Opus 5 · Research Opus 5 · Writing Opus 5 · Prompt v1.6
The most hedged gas producer in Appalachia should have been the most insulated, and it de-rated more than any of its five neighbors. CNX's June quarter grew revenue 14.3% at a 38.3% operating margin, and its realized price including cash settlements rose 7.1%.
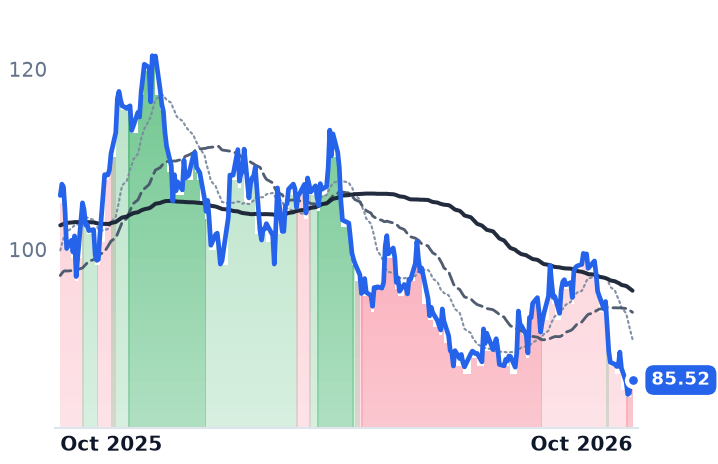
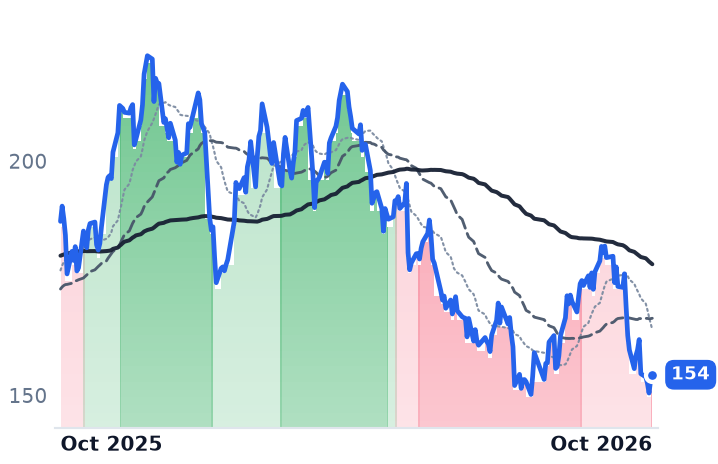
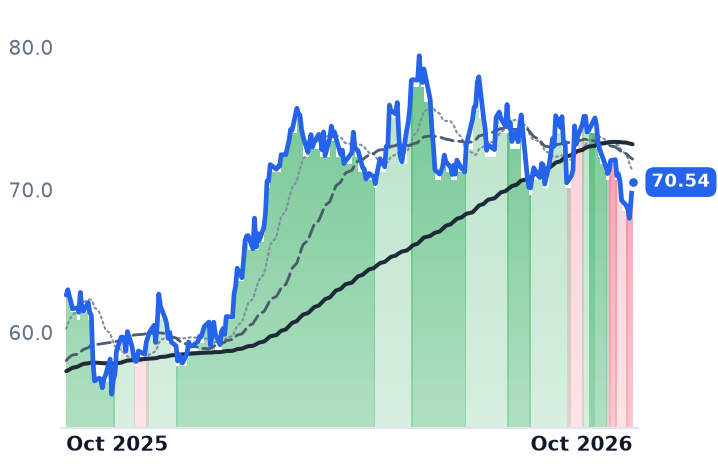
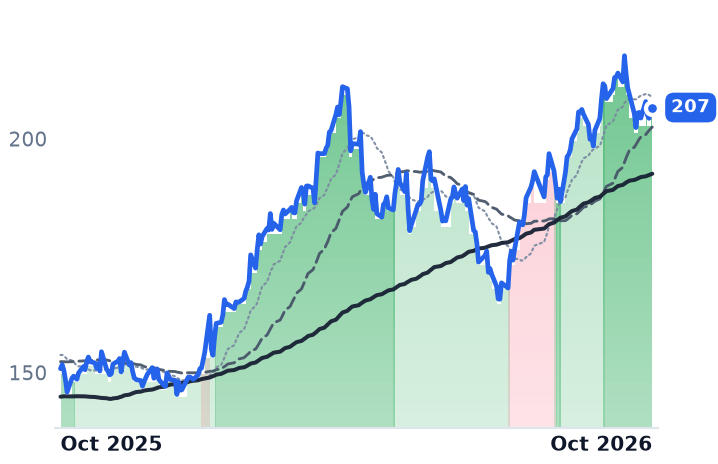
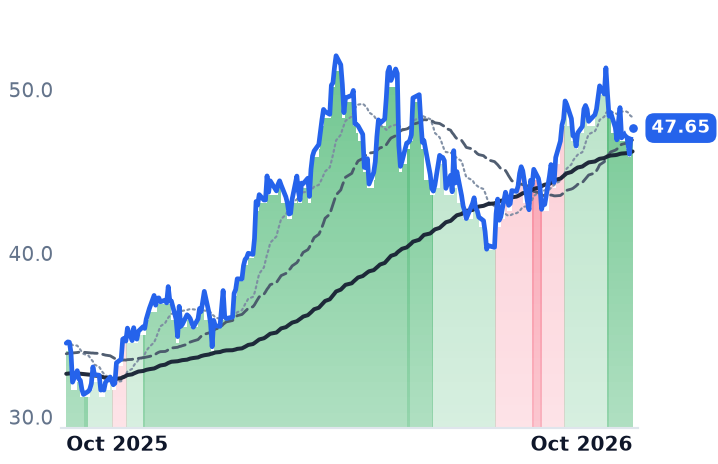
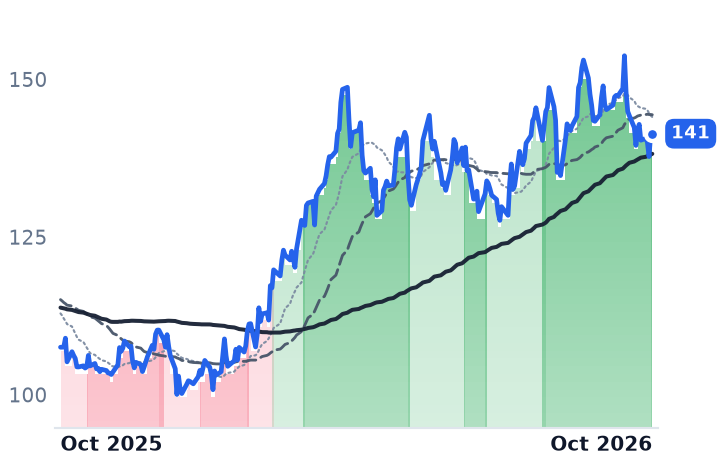
All six listed Appalachian producers crossed into a confirmed downtrend between September 28 and October 1, while front-month Henry Hub gas edged higher over the same thirty days. Only EQT's own accounts explain its share of the move: revenue fell 29.2% last quarter and consensus now models 2027 earnings per share down 5.4%. Range Resources grew operating income 73.9% and fell exactly as much as EQT. What the market appears to have repriced is the 2027-28 Appalachian netback and the timing of in-basin power demand.
| Ticker | Company | Segment | Trend · 13mo | 30D | 1Y |
|---|---|---|---|---|---|
| The subject · what this brief is about | |||||
EQT | EQT | Appalachian Shale Gas | 🔴 Cont. Bear | −9.1% | −11.8% |
RRC | Range Resources | Appalachian Shale Gas | ⚠️ Emerging Bear | −9.0% | −1.0% |
CNX | CNX Resources | Appalachian Shale Gas | 🔴 Cont. Bear | −16.0% | −5.4% |
| Compared against · context, not the story | |||||
AR | Antero Resources | Appalachian Shale Gas | ⚠️ Emerging Bear | −13.5% | +0.5% |
EXE | Expand Energy | Appalachian Shale Gas | 🔴 Cont. Bear | −12.7% | −19.3% |
GPOR | Gulfport Energy | Appalachian Shale Gas | 🔴 Cont. Bear | −13.9% | −17.5% |
NG=F | NG=F | — | 🔴 Cont. Bear | +2.0% | −9.6% |
KMI | Kinder Morgan | Natural Gas Pipelines & Transmission | ⚠️ Emerging Bear | −1.1% | +13.6% |
WMB | The Williams Companies | Natural Gas Pipelines & Transmission | 🟢 Cont. Bull | −4.9% | +12.7% |
LNG | Cheniere Energy | LNG Export & Infrastructure | 🟢 Cont. Bull | −7.6% | +16.3% |
SPY | State Street SPDR S&P 500 ETF Trust | Asset Management | 🟢 Cont. Bull | −0.1% | +15.2% |
XOM | Exxon Mobil | Upstream Exploration & Production | 🟢 Cont. Bull | +2.8% | +45.8% |
CVX | Chevron | Upstream Exploration & Production | 🟢 Cont. Bull | −0.9% | +37.0% |
DVN | Devon Energy | Diversified Onshore & Conventional | 🟢 Cont. Bull | −0.9% | +38.1% |
EOG | EOG Resources | Diversified Onshore & Conventional | 🟢 Cont. Bull | −2.6% | +31.5% |
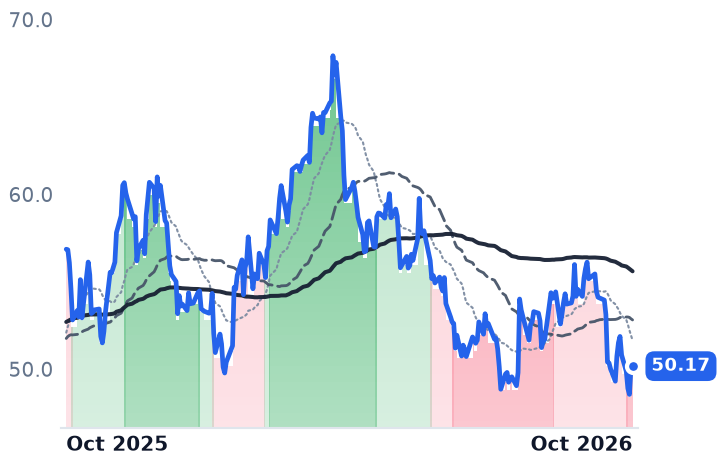
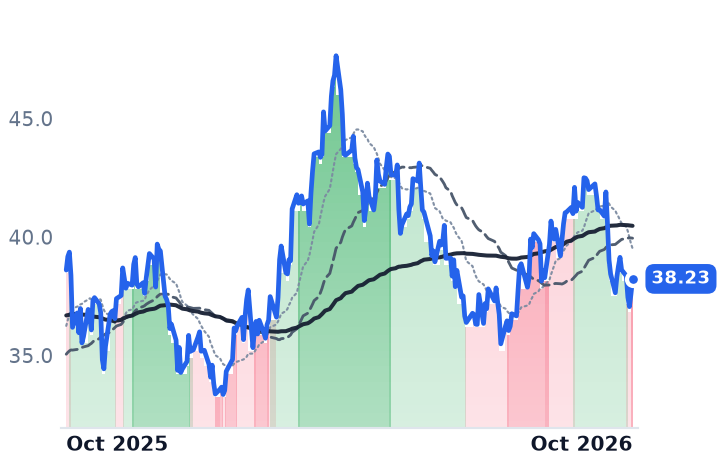
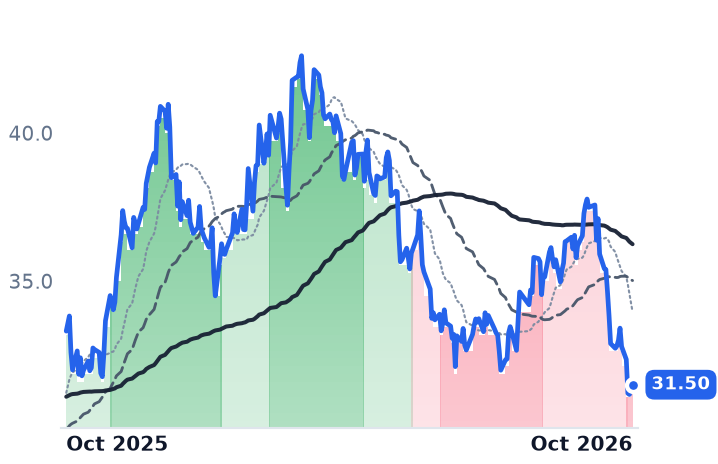
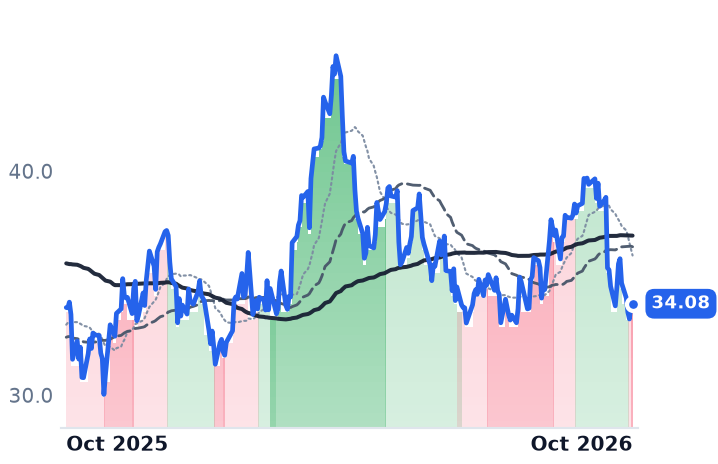
12-month price & trend
| Ticker | Mkt cap | P/E | P/E fwd | P/S | P/S fwd | P/GP | P/GP fwd | EV/EBITDA | FCF yld |
|---|---|---|---|---|---|---|---|---|---|
EQT | $31.4B | 11.0x | 12.4x | 3.4x | 3.4x | 4.9x | 5.0x | 6.0x | 12.0% |
RRC | $8.9B | 10.5x | 9.3x | 2.7x | 2.5x | 5.6x | 5.3x | 7.0x | 13.1% |
CNX | $4.7B | 4.6x | 9.9x | 1.9x | 1.9x | 3.9x | 3.9x | 3.7x | 11.3% |
| Ticker | Mkt cap | P/E | P/E fwd | P/S | P/S fwd | P/GP | P/GP fwd | EV/EBITDA | FCF yld |
|---|---|---|---|---|---|---|---|---|---|
AR | $10.4B | 9.6x | 7.9x | 1.8x | 1.5x | 7.1x | 5.9x | 6.3x | 13.6% |
EXE | $19.4B | 7.2x | 9.8x | 1.5x | 1.5x | 2.3x | 2.3x | 3.4x | 13.1% |
GPOR | $3.1B | 6.9x | 7.4x | 2.1x | 2.0x | 3.5x | 3.4x | 4.3x | 8.0% |
| Ticker | Mkt cap | P/E | P/E fwd | P/S | P/S fwd | P/GP | P/GP fwd | EV/EBITDA | FCF yld |
|---|---|---|---|---|---|---|---|---|---|
NG=F | — | — | — | — | — | — | — | — | — |
KMI | $68.5B | 19.7x | 20.0x | 3.8x | 3.7x | 6.9x | 6.8x | 12.5x | 5.6% |
WMB | $91.2B | 29.6x | 30.4x | 7.5x | 7.4x | 10.2x | 10.1x | 16.3x | -0.2% |
| Ticker | Mkt cap | P/E | P/E fwd | P/S | P/S fwd | P/GP | P/GP fwd | EV/EBITDA | FCF yld |
|---|---|---|---|---|---|---|---|---|---|
LNG | $58.2B | 20.6x | 50.5x | 2.6x | 2.5x | 4.9x | 4.8x | 10.2x | 12.1% |
SPY | $773.0B | — | — | — | — | — | — | — | — |
XOM | $654.6B | 26.1x | 15.0x | 2.0x | 1.7x | 7.9x | 6.5x | 11.5x | 2.9% |
| Ticker | Mkt cap | P/E | P/E fwd | P/S | P/S fwd | P/GP | P/GP fwd | EV/EBITDA | FCF yld |
|---|---|---|---|---|---|---|---|---|---|
CVX | $380.5B | 34.4x | 14.2x | 2.0x | 1.7x | 8.0x | 6.6x | 10.4x | 3.5% |
DVN | $30.8B | 13.6x | 9.2x | 1.8x | 1.3x | 8.1x | 5.8x | 4.9x | 8.7% |
EOG | $74.7B | 13.6x | 8.8x | 3.2x | 2.7x | 4.5x | 3.8x | 6.5x | 5.7% |
Consensus projections
| Ticker | FY2026E | FY2027E | FY2028E | |
|---|---|---|---|---|
EQT | Revenue | +9.9% | −0.8% | +11.9% |
| EPS | +37.2% | −5.4% | +40.3% | |
RRC | Revenue | +17.9% | +2.5% | +8.0% |
| EPS | +41.2% | −4.0% | +20.2% | |
CNX | Revenue | +17.1% | −9.3% | +7.0% |
| EPS | +45.0% | +30.6% | +22.6% | |
AR | Revenue | +31.0% | −0.1% | +8.3% |
| EPS | +135.1% | +3.9% | +26.9% | |
EXE | Revenue | +14.7% | −4.1% | +6.9% |
| EPS | +43.3% | −1.6% | +24.1% | |
GPOR | Revenue | +10.7% | +1.2% | +5.4% |
| EPS | +8.7% | +18.6% | +31.9% | |
KMI | Revenue | +8.6% | +1.6% | +5.1% |
| EPS | +19.8% | −0.0% | +9.0% | |
WMB | Revenue | +7.8% | +13.8% | +14.7% |
| EPS | +15.6% | +5.5% | +17.7% | |
LNG | Revenue | +15.4% | +2.1% | +3.8% |
| EPS | −65.4% | +214.6% | −8.0% | |
XOM | Revenue | +19.3% | −7.6% | +1.3% |
| EPS | +50.1% | −3.2% | +6.3% | |
CVX | Revenue | +20.5% | −10.9% | −0.3% |
| EPS | +88.5% | −11.2% | +2.8% | |
DVN | Revenue | +42.1% | +10.1% | +4.9% |
| EPS | +35.0% | −1.0% | +8.2% | |
EOG | Revenue | +21.5% | −4.5% | +0.9% |
| EPS | +56.4% | −9.9% | +2.7% |
Forward fiscal years only. Blank means no analyst coverage for that year.
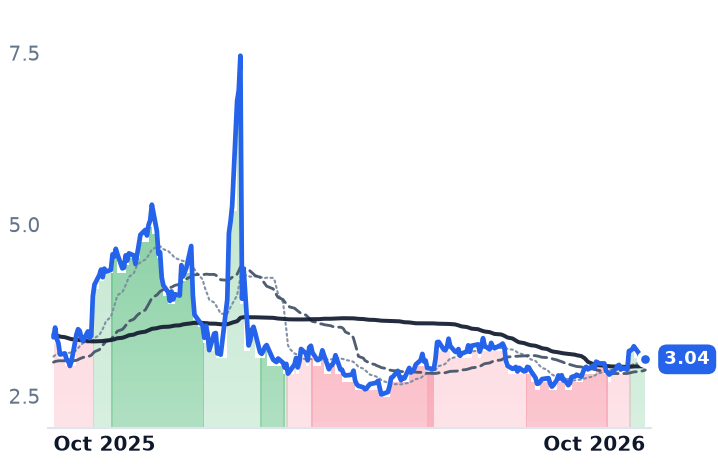
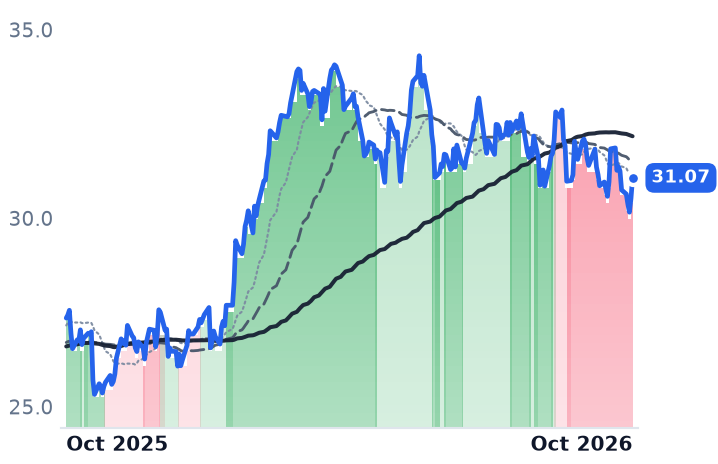
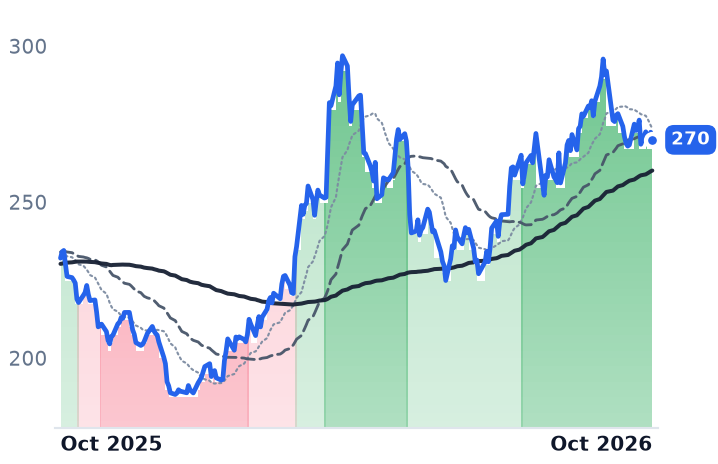
Between September 28 and October 1 every listed Appalachian natural gas producer crossed into a confirmed downtrend, each one's 50-day average slipping beneath its 200-day. EQT, Range Resources, CNX, Antero, Expand Energy and Gulfport all broke inside four trading sessions. The gas price did not do it: front-month Henry Hub rose 1.1% over the thirty days to October 2, while the six equities lost between 10% and 16%.
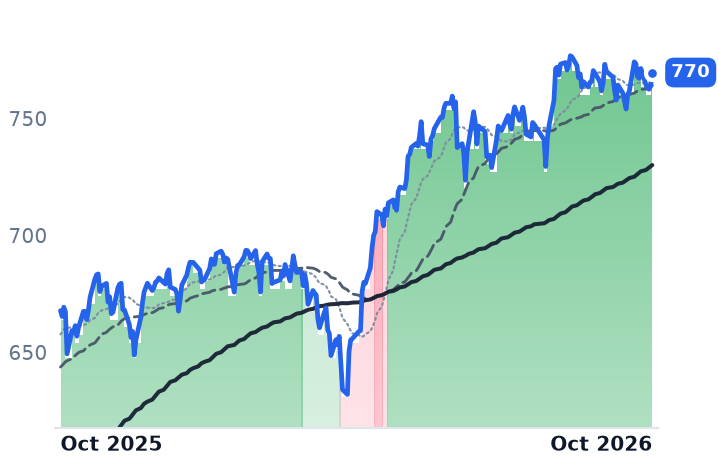
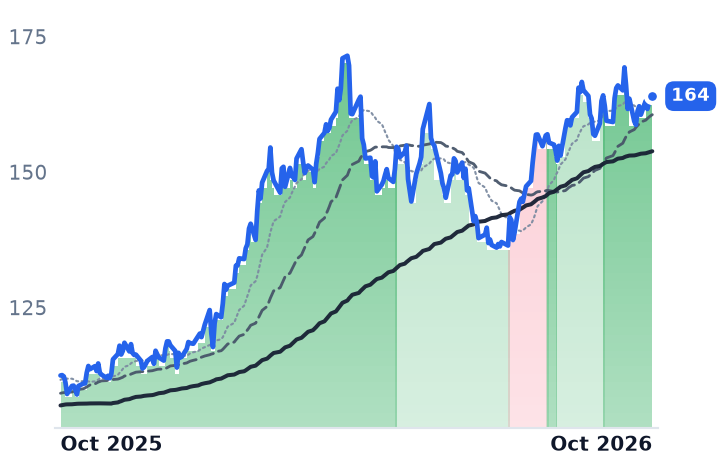
Nothing broader did it either. Broad equities were slightly higher, Exxon was flat, Chevron and Devon each fell under 3%, and gas-levered midstream held up better than the producers, with Kinder Morgan losing less than 3% and Williams about 6%. What got repriced is one basin's upstream dollar: the 2027-28 Appalachian netback, meaning the price a producer banks after the local discount, and the timing of the in-basin power demand that has carried these shares for two years.
The hedged one fell hardest
CNX Resources produces Marcellus and coalbed methane gas and owns roughly 2,600 miles of its own gathering pipe, which makes it the most insulated member of the group by construction. Its second-quarter supplemental disclosure shows 400.4 billion cubic feet of 2027 volumes hedged as of July 15, with fully covered volumes, benchmark plus basis, averaging $3.31 per thousand cubic feet. It fell 16.2%, the worst of the six.
The quarter was not the problem. Revenue grew 14.3% to $618.5m and operating income 24.3%, at a 38.3% operating margin, and CNX reported that its average realized price including cash settlements rose 7.1% to $2.87 per thousand cubic feet equivalent. The shares trade at 3.71 times trailing enterprise value to earnings before interest, taxes, depreciation and amortization, and at 0.96 times book, below stated book value, with analysts modelling 2027 earnings per share up 30.6% to $4.14. CNX is also the only one of the three with no data-center or behind-the-meter supply arrangement to point at.
Range Resources, which sells about a third of its production as ethane, propane, butane and condensate, fell 10.0%, exactly as much as EQT. Its June quarter grew revenue 19.1% to $833.6m and operating income 73.9%, lifting operating margin to 39.1% from 26.8%; reported net income fell 17.8% because derivative marks below the operating line went the other way. Its pre-hedge liquids price of $29.10 a barrel came in roughly $3.49 above the Mont Belvieu benchmark, and out of comparable rock Range realized $3.53 per thousand cubic feet equivalent last quarter against EQT's $2.65. At 9.35x forward earnings against 10.50x trailing, it is the only one of the three where consensus models profits rising.
The one its own accounts explain
EQT, the largest US gas producer, with 1.7 million acres in the Marcellus, is the exception. June-quarter revenue fell 29.2% to $1.81bn and operating income 60.0%, with operating margin collapsing to 25.1% from 44.3%, one quarter after a March period that grew revenue 39.7% at a 60.3% margin. Consensus models 2027 revenue down 0.8% and earnings per share down 5.4% to $3.82, and Zacks cut its third-quarter estimate to $0.44 from $0.47 on September 29. Its forward multiple of 12.42x sits above its trailing 11.03x, the market's way of saying earnings come down; on capital structure it is at 5.96x trailing EV/EBITDA with a 12.0% free cash flow yield.
EQT also carries the thinnest basis protection, by choice. "I don't see a way for basis not to continue to strengthen materially," chief financial officer Jeremy Knop told the July 22 earnings call, behind a decision to enter the year with roughly 35% of local basis sales hedged against a historical norm nearer 90%. Its disclosed 2027 commodity book is summer collars alone, $3.00 puts against $4.51 calls, set against guided volumes of 2,375-2,450 billion cubic feet equivalent.
Who sets the discount
Appalachia produces about 35.5 billion cubic feet a day and burns 10, so roughly 25.5 must leave daily through a Northeast-to-South corridor that has run at 88% of capacity. The basin cannot grow into the AI power story on its own pipe: the Permian and Haynesville account for more than 70% of forecast US production growth, the Permian adding 2.2 billion cubic feet a day in 2027 against Appalachia's 0.3. Those basins set the benchmark from which Appalachia is discounted, and Tennessee Zone 4 Marcellus basis for calendar 2027 is priced 67.4 cents under Henry Hub. The benchmark itself is being marked down: the Energy Information Administration cut its forecast by roughly 40 to 45 cents from the prior month, to $3.14 per million British thermal units in the fourth quarter, citing record output and end-October inventories of 3,969 billion cubic feet, 5% above the five-year average.
One caution against the obvious story: forward Appalachian basis has been tightening. AEGIS puts Winter 2026/27 at a 49-cent discount, with the near seasonal strips at record strengths.
Hedges bought nothing
EQT's de-rating is earned. It fell with consensus cutting underneath it, and it has the least basis protection to absorb the hit. CNX and Range have no such explanation in their own accounts, where margins widened and realizations rose, and the name with 2027 covered above today's curve fell furthest. The likelier reading is that the market repriced the late-decade netback and the credibility of demand timing, a judgment that treats a hedge book as irrelevant. No company news for any of the three was discoverable in the break window.
That makes the demand ledger the thing to read closely, because it is thinner than the narrative. EQT's largest arrangement, up to 665,000 million British thermal units a day to a 4.4 gigawatt plant at the Homer City campus, remains an agreement in principle. Its one signed, power-priced contract, ten years and 325,000 dekatherms a day to CPV's Shay Energy Center, serves a plant management does not expect in service until early 2031, worth about $100m a year and five cents on the corporate differential. Range's Robinson Township project with Liberty Energy is a framework without disclosed take-or-pay volumes.
EQT reports third-quarter results on October 20, and Range and CNX have not set dates, though late October is their pattern. The question those prints have to answer is what a molecule contracted for delivery in 2031 is worth to a shareholder now.