

Robotics Bucket's 85% Gain Is Really a Two-Name Story, Not Four
Prompt v1.0
The AI2 Robotics & Physical AI bucket's touted +85% one-year return is driven almost entirely by Teradyne and Cognex; Symbotic has sat in a strongly bearish trend band for nearly five months and is down over the same period, while Teradyne's own July swoon looks sector-driven rather than fundamental. Rockwell and Cognex report earnings August 4-5, which should clarify whether the industrial-automation leg of the thesis still has legs.
| Ticker | Company | Segment | Trend · 13mo | 30D | 1Y |
|---|---|---|---|---|---|
SYM | Symbotic | Industrial Automation & Motion Control | 🔴 Cont. Bear | −4.3% | −20.4% |
ROK | Rockwell Automation | Industrial Automation & Motion Control | 🟢 Cont. Bull | −4.8% | +31.2% |
CGNX | Cognex | Test & Measurement | 🟢 Cont. Bull | −15.4% | +69.7% |
TER | Teradyne | Test & Assembly Services | 🟢 Cont. Bull | −31.0% | +253.5% |
12-month price & trend
| Ticker | Mkt cap | P/E | P/E fwd | P/S | P/S fwd | P/GP | P/GP fwd | EV/EBITDA | FCF yld |
|---|---|---|---|---|---|---|---|---|---|
SYM | $28.0B | 456.1x | 213.1x | 10.6x | 10.0x | 49.1x | 46.3x | 434.2x | 2.6% |
ROK | $48.6B | 40.9x | 33.1x | 5.4x | 5.4x | 9.9x | 9.9x | 29.2x | 3.1% |
CGNX | $9.7B | 55.4x | 34.6x | 8.9x | 8.5x | 12.9x | 12.3x | 33.9x | 2.8% |
| Ticker | Mkt cap | P/E | P/E fwd | P/S | P/S fwd | P/GP | P/GP fwd | EV/EBITDA | FCF yld |
|---|---|---|---|---|---|---|---|---|---|
TER | $60.8B | 53.1x | 42.2x | 13.6x | 11.8x | 23.0x | 19.9x | 41.7x | 1.3% |
Consensus projections
| Ticker | FY2026E | FY2027E | FY2028E | |
|---|---|---|---|---|
SYM | Revenue | +25.7% | +29.2% | +24.5% |
| EPS | −15.6% | +82.3% | +121.2% | |
ROK | Revenue | +10.0% | +5.5% | +6.4% |
| EPS | +31.5% | +12.1% | +12.1% | |
CGNX | Revenue | +16.7% | +9.3% | +9.4% |
| EPS | +74.7% | +19.4% | +15.3% | |
TER | Revenue | +67.1% | +21.2% | +24.5% |
| EPS | +159.3% | +27.3% | +31.7% |
Forward fiscal years only. Blank means no analyst coverage for that year.
Four names, two very different stories
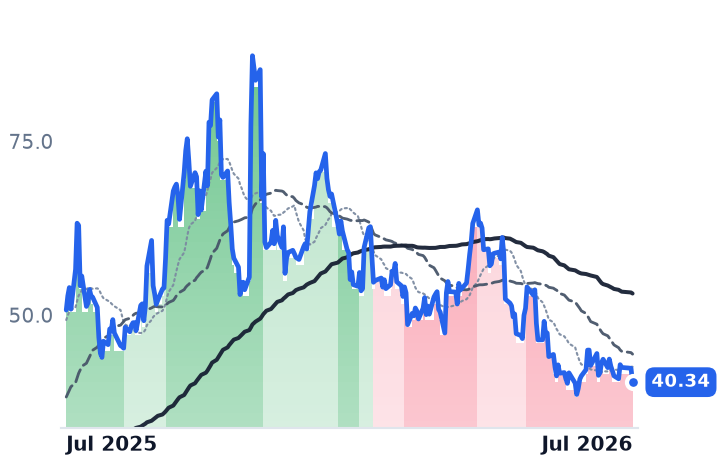
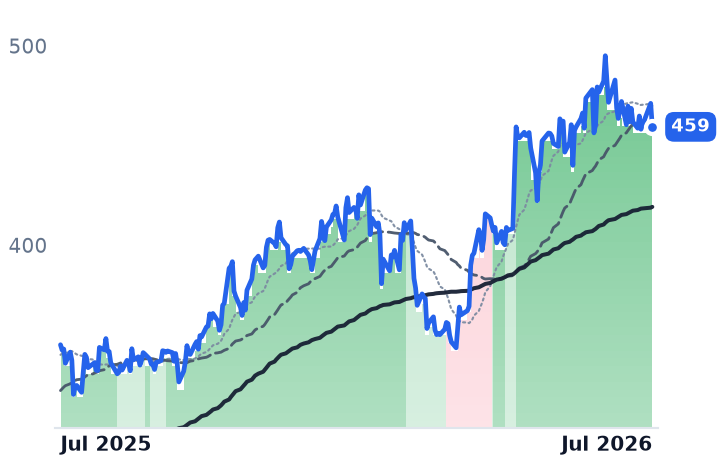
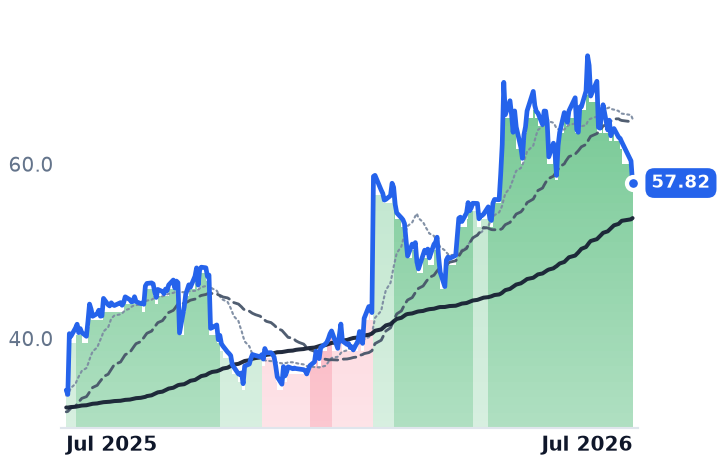
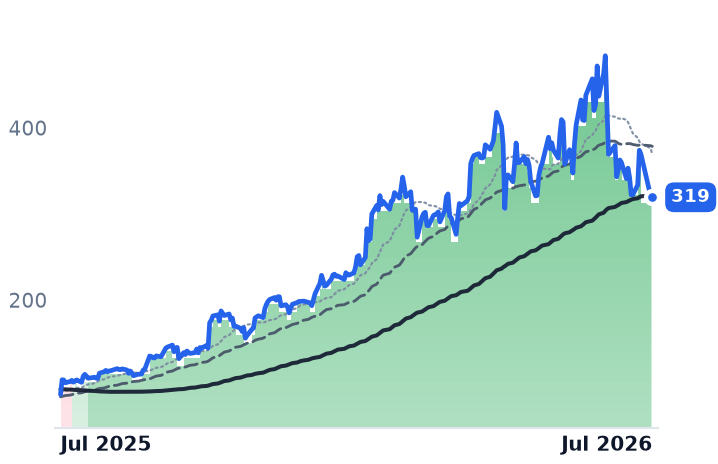
The bucket's average headline gain masks a sharp divergence. Over the trailing year, Teradyne rose roughly 252% and Cognex about 74%, while Rockwell added a more modest 32% — but Symbotic actually fell about 20% over the same stretch. Symbotic's trend band has sat in strongly bearish continuously since March 4, 2026, roughly five months running, never re-entering a bull band during the period this thesis frames as a bucket-wide bull run. Cognex, by contrast, has held strongly bullish almost without interruption since late February. Rockwell flipped into a sustained strongly bullish band on May 6 after churning through mildly bullish/mildly bearish earlier in the year. Teradyne held strongly bullish from January 2 through July 22 before slipping to mildly bullish on the most recent read.
The 30-day drawdown is concentrated, not shared
The bucket's reported roughly 11% monthly pullback is not evenly distributed: Teradyne alone fell about 27% in the trailing month, Cognex slipped roughly 9%, Rockwell was about flat, and Symbotic actually rose slightly even while sitting in a deep bear trend band. Teradyne's damage traces to a sector-wide event rather than company news — Teradyne fell 13.6% in a single week amid a broad "memory-glut panic" that also hit KLA, Lam Research and Seagate, part of a semiconductor index selloff exceeding 20% from its June peak tied to a Samsung earnings reaction and AI-capex-durability worries. Some brokers argue the glut fear is running ahead of actual fab-construction timelines, with memory price peaks not expected until 2027. Underlying results didn't support the selloff: Teradyne's Q2 revenue rose about 104% year-over-year with guidance roughly 21% above consensus, sending the stock up 12.8% on the print. Prior analysis flagged Teradyne's valuation as extended near $110x trailing earnings after its run, suggesting the setup favored pullbacks over chasing even before the July rout.
Symbotic is the outlier bear, not a pause
Symbotic's weakness looks structural rather than cyclical. The stock lost about 24.5% of its value in the first half of 2026 and is down roughly 28% year-to-date after Barclays reaffirmed a sell rating tied to execution risk on backlog conversion and roughly 80% Walmart revenue concentration. Short interest has climbed to about 47% of the float, consistent with the deep bear trend band rather than a name poised to reconverge with the group.
What to watch
Rockwell and Cognex report within days of each other — Rockwell on August 4, where Q2 orders of roughly $2.5B annualize toward a $10B run rate that Morgan Stanley ties to low-double-digit FY2027 sales growth, and Cognex on August 5, guiding roughly 16.5% year-over-year revenue growth at the midpoint with adjusted EBITDA margin expanding toward 28-31%. Those prints, not the recent price action, will determine whether the industrial-automation and machine-vision legs of this bucket are still confirming the thesis.